 Bo Peng1
 Xin Ma
- 1Shandong Key Laboratory of Intelligent Buildings Technology, School of Information and Electrical Engineering, Shandong Jianzhu University, Jinan, China
- 2Jinan Yuny Technology Co., Ltd., National Offshore Innovation and Entrepreneurship Base for Overseas Professionals, Jinan, China
The erratic and random characteristics of wind power and wind-thermal replacement significantly degrade the performance of AGC in an interconnected, multi-source power system. For the lack of cooperation between wind power and thermal plants in AGC of interconnected power system as well as the heavy computational burden and inflexible information interaction of centralized AGC architecture, a novel coordinated AGC control strategy for an interconnected multi-source power system based on distributed model predictive control (DMPC) algorithm is proposed in this research. Under the DMPC architecture, the dimension of centralized AGC problem is reduced in each subsystem, and the overall AGC performance can be enhanced through inter-area communication between subsystems. In the meantime, based on the proposed coordinated control strategy, the active AGC response capability of wind farms and energy storage in the interconnected system is exploited to realize the dynamic cooperation between the wind generation and thermal AGC plants, and the overall AGC control performance can be further improved. In this paper, local DMPC controllers are deployed in each subsystem to address the drawbacks of a centralized control architecture by exchanging forecast and state measurement information with neighboring subsystems. In addition, considering the current operating status of multiple kinds of energy sources with different features, a fuzzy-based coordinated control strategy is designed for the purpose of dynamically allocating the AGC demand inside the wind-storage system, and the wind farm’s reliability for AGC response in diverse operation scenarios can be guaranteed. Finally, comparative analysis with existing works has been conducted on a three-area power system, and numerical results demonstrate that the proposed coordinated AGC control strategy has better performance in AGC performance and the dynamic cooperation can be achieved between wind power and thermal plants in AGC response through the designed wind-storage system and coordinated DMPC AGC control strategy.
1 Introduction
With the increasing need of energy consumption, the scale of interconnected power systems around the world is continuously expanding. Currently, large power systems are generally composed of several interconnected subsystems or control areas through interregional tie-lines. All the thermal plants in each subsystem are responsible for balancing their own power demand. However, once a sudden power fluctuation event occurs, it will cause a significant impact on the power balance in each subsystem, and leading the whole interconnected grid into an unstable operation state with frequency and tie-line power fluctuations. Therefore, AGC has been widely applied for maintaining the active power balance of the interconnected power systems. Many types of controllers have been designed for improving the AGC dynamic performance, such as proportional-integral-derivative (PID) control (Debbarma et al., 2013; Hasanien and El-Fergany, 2019), robust control (Shayeghi et al., 2007; Zhang et al., 2013; Xiong et al., 2018), event-triggered load frequency control (Wen et al., 2015; Lv et al., 2020; Yuan et al., 2020), neural fuzzy-based intelligent control (Kocaarslan and Çam, 2005; Yousef et al., 2014; Aziz et al., 2019), and model prediction schemes (Venkat et al., 2008; Ma et al., 2014; Shiroei and Ranjbar, 2014). In addition, advanced soft computing techniques are also applied in AGC controller to deal with the uncertainties and variation of operating points. In (Abd-Elazim and Ehab, 2018), genetic and firefly optimal algorithm are applied in the load frequency controller of a two-area system composing of PV grid and thermal generators. In (Mohanty et al., 2014), Differential evolution algorithm is adopted for AGC control of an interconnected power systems with non-linearity. Moreover, fuzzy logic algorithm has been applied in (Kocaarslan and Çam, 2005; Aziz et al., 2019) for scheduling the gains of the AGC controller dynamically of two-area interconnected power systems. In (Arya, 2017), fuzzy-based fractional order controller is designed for diminishing the frequency and tie-lie power deviations efficiently. The above-mentioned literatures have improved the dynamic AGC performance of interconnected power systems by means of complex controllers or advanced optimization algorithms. However, control strategies of the mentioned works are built on a centralized architecture, which is unsuitable for large-scale power grids due to the calculation complexity, communication delays, and resilience risks. Therefore, a distributed control architecture has more adaptability for interconnected system, and due to the robust control performance and efficient information communication features, DMPC algorithm has been acknowledged as an efficient method for improving the frequency stability of the interconnected system. A DMPC-based load frequency controller is designed in (Ma et al., 2017) for a deregulated three-area power system considering the effect of bilateral contracts of load demands. In (Jain et al., 2018), a DMPC AGC architecture is proposed for wide-area control of power system oscillations under communication and actuation constraints. In (Chen et al., 2018) an extended DMPC controller is designed for frequency regulation of a two-area power system under uncertain system condition and parameters. In addition, considering environmental pressure and market competition pressure, a distributed economic MPC for LFC of multi-area power system with wind power plants is proposed in (Zhang et al., 2021), but the dynamic features of wind plants and potential for active AGC response has not been discussed.
Nevertheless, besides the centralized control framework, another factor for weakening the AGC performance is the increasing penetration rate of renewable energy (e.g., wind energy) and the lack of coordination between multiple energy sources. With the increase of wind power integration capacity, more researchers are attracted into fields like wind power forecasting (Li et al., 2021a; Li, 2022a; Li, 2022b), wind turbines (WT) fault detection and wind farm’s flexible operation (Li et al., 2021b), and it has been testified that the active AGC response capability of WT can be exploited by advanced control strategy. Therefore, it is essential to exploit the potential of WTs for AGC response. A coordinated control framework and an adaptive PID control scheme has been designed for wind farms in (Magdy et al., 2018). Moreover, an interconnected power system with enhanced load frequency management is proposed in (Chang-Chien et al., 2013), and WTs are included into the AGC model of entire system. It should be noted that the WT operation state is significantly affected by the wind speed, which in turn affects the interconnected system’s capacity to provide a reliable frequency response. In previous studies (Wu et al., 2017; Abazari et al., 2019; Peng et al., 2019), reliable active power reserve for WT’s frequency response can be acquired through the de-loading operation, and when WT is incapable of participating the frequency regulation process, energy storage (ES) units with rapid responding characteristics are deployed to manage the power shortages in frequency response. However, in most literature cited above, the AGC control techniques are employed in scenarios with a constant windspeed rather than scenarios with varying ones, which might impair the strategies’ reliability and efficiency. Moreover, in an interconnected power system with multiple power sources like wind energy, conventional thermal plants and ES unit, because of the slow ramp rate of thermal plants and the large “wind-thermal replacement”, the thermal plants cannot meet the AGC demand of each subsystem alone, and the frequency will suffer more severe fluctuations if the current windspeed is not sufficient to support WT’s participation in AGC, which is detrimental to the frequency stability of the whole multi-area power system. Therefore, it is critical that WTs must be able to dynamically collaborate with the ES for obtaining a reliable and active AGC response ability in various operation conditions, and it is also important for WTs to cooperate with thermal plants to make up for the operation constraints of the thermal power.
It is apparent from the previous works that the AGC performance of interconnected power system with multiple kinds of power sources largely depends on the control strategy architecture and the coordination between power sources. Therefore, a coordinated AGC control strategy based on DMPC algorithm is proposed to enhance the AGC performance of a multi-source interconnected power system with high-level wind power penetration rate. In the proposed coordinated control strategy, to deal with the drawbacks mentioned under the centralized framework, the dimension of centralized AGC problem is reduced in each subsystem under the DMPC architecture. Then, local DMPC controller of each subarea communicates with adjacent areas exchange their states and prediction information to improve the AGC performance of the whole system with better stability and reliability. Moreover, ES units are deployed in the windfarms as a combined wind-storage system (CWES) to let the WTs participate in AGC response actively through cooperation with the ES. Taking current operation states of CWESs and thermal plants into consideration, a fuzzy-based controller is designed for active frequency response inside the CWES system and realizing a dynamic cooperation between wind farm and thermal generators in each subsystem. Therefore, the CWES system is ensured with better adaptability and reliability for AGC support under fluctuating windspeeds and the features of renewable generation and conventional thermal plants can be coordinated flexibly, and the overall AGC dynamic performance of the multi-source interconnected power system can be effectively improved.
The main contributions of this paper are as follows:
1) Based on a DMPC algorithm, a novel AGC model of a multi-source interconnected power system is designed. In each subsystem, a synthesised AGC state-space model composed of a combined wind-energy storage system and thermal generators is designed to let the local WTs participate in the AGC process. Then, through communication of the control and prediction information between local DMPC controllers, the AGC response potential of the WTs is fully exploited, and the AGC performance of multi-area power system is improved effectively.
2) A novel coordinated control strategy for multiple kinds of power sources with different operational features is designed based on the fuzzy logic algorithm. Considering current operation trajectories of the combined wind turbine and energy storage units, a fuzzy controller is designed to realize an active AGC response of the CWES system dynamically. Under the proposed control strategy, flexible coordinated operation between WTs and ES is achieved. Therefore, adaptability and performance of the CWES system for multi-area AGC active response under multi-scenarios are both enhanced.
3) Through the proposed control strategy, the active AGC response capability of the CWES and conventional thermal generators inside multi-area grid can be fully exploited, and the ramping rate issue of conventional plants can be well alleviated through the quick power response feature of CWES in the beginning stage of AGC. As a result, the frequency stability weakened by the wind-thermal replacement is ameliorated.
The remainder of this paper is organized as follows. The system structure and modelling theories are introduced in Section 2. The DMPC algorithm and dynamic cooperation strategy for a CWES system in frequency support are introduced in Section 3, and case studies are given in Section 4. Finally, conclusions are summarized in Section 5.
2 System framework
The framework of multi-area power grid studied in this paper is demonstrated in Figure 1, there are three subsystems inside the interconnected system, and power flows among these adjacent areas through tie-lines. It can be observed that there exists a conventional generator model and a CWES model as the power source in each area. In addition, an MPC-based AGC controller is deployed in each area for local AGC response.
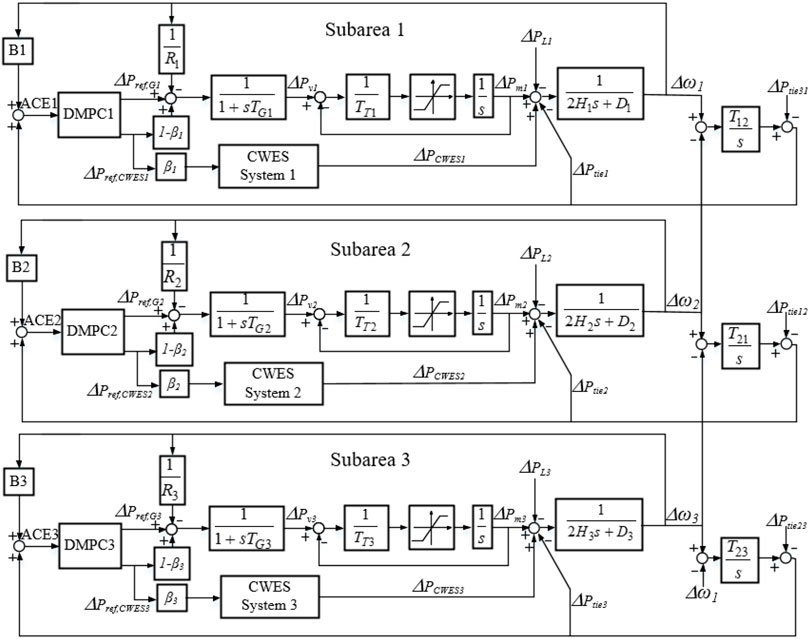
FIGURE 1. Framework of multi-area power system with CWES.
2.1 Modelling of an interconnected system
From Figure 1, the dynamic relationships among every block in the overall multi-area AGC system can be represented by differential equations, and the dynamic balance between the power variation and the frequency fluctuation Δωi in subarea 1 can be expressed as
where Δωi is the frequency variation in the ith subarea system; Di and Hi are the system damping constant and inertia constant, respectively; and ΔPmi and ΔPCWESi are the active power variations from the thermal unit and the CWES system, respectively. ΔPLi is the load fluctuation, which is also the disturbance in the AGC response model, and ΔPtiei is active power interaction of the tie-line in this area.
The differential equation of the thermal plant’s turbine in ith area can be expressed as
where ΔPvi is the governor valve adjustment of the conventional generation unit and TTi is the time constant of the steam turbine.
The differential equation of the thermal plant’s governor in area i is given as
where TGi is the time coefficient of the governor valve adjustment, Ri is the system’s primary frequency response coefficient, and ΔPref,G is the AGC reference command of the DMPC controller for the thermal power unit in this area.
Moreover, the active power exchanged between the ith area and its adjacent area can be expressed as
where Tij is the power exchange factor between the ith area and the jth area, M is the number of subareas contained in the multi-area grid, and M = 3 in this paper.
2.2 AGC response model of a subarea integrated with a CWES system
As shown in Figure 1, the previous section introduced the structure of the interconnected power system and the dynamic relationships of the thermal plants in the AGC process. Since each subarea in the interconnected system has a high penetration rate of wind generation and the power output of wind farm accounts for approximately 30% of the total active power generation in each subarea, the “wind-thermal” substitution effect of the entire multi-area power system is obvious. Therefore, this section jointly models the AGC process of the thermal plants and WTs in the same area so that cooperation of these two kinds of energy sources in the AGC process can be achieved. Moreover, the adjustment burden and the slow response problem of thermal plants in AGC can be alleviated, and the AGC response capability of the interconnected system is improved.
The simplified WT model applied in the multi-area system in this study is displayed in Figure 2. Here, Pref,W and PW are the active power output reference and actual power output of WT, and kwp and kwi are the proportional and integral gain coefficients of the PI block of the rotor-side converter, respectively. The constant Tfl is the filter coefficient of the power outer loop. ird is the d-axis component of the rotor current, and sg is the generator slip. KRSC is defined as the gain coefficient of the rotor-side converter. According to the above control block diagram, the mathematical models of the WT are as follows:
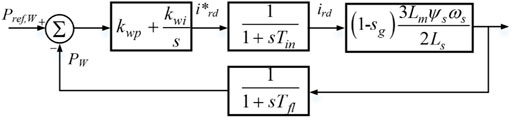
FIGURE 2. Control model of a WT in the CWES system.
In the CWES system proposed in this paper, the energy storage unit mainly assists the WTs in participating in the AGC process of the interconnected system. The ES output is mainly determined according to the operating state and active power reference value of the WTs, so the subarea AGC controller does not determine this output. Therefore, the active power reference value Pref,W delivered to the WTs in the subarea is equal to the reference value Pref, CWES of the CWES system.
During the AGC response, the output characteristics of AGC resources should be fully utilized in this area. The CWES is mainly responsible for addressing the slow power ramping problem of thermal plants in the initial stage of AGC response. As the AGC process progresses, the power generation of thermal plants gradually matches the AGC demand. For that scenario, the CWES system should gradually reduce the output, transfer the main task back to thermal plants, and provide a reliable active power reserve for the next AGC demand to make up for the “wind-thermal replacement” effect. In this paper, according to the AGC response process and real-time frequency variation, the wind power is integrated into the AGC process of each area by dynamically modifying the control parameters of local DMPC controller. Then, the active AGC response capability of CWES and conventional thermal generators inside multi-area grid can be fully utilized, and the ramping rate issue of conventional plants can be well alleviated.
The power reference modifications of CWES and thermal plant in the ith area can be expressed in Eq. 9:
where ΔP’ref,CWESi and ΔP’ref,Gi are the modified control variables of the CWES system and thermal plants in subarea i, respectively, and β is the modification factor, and it represents the frequency response process. Based on fuzzy theory, β is dynamically determined by frequency deviation Δω and frequency change rate dω/dt of the ith area, and it will be explained in Section 3.1.
In summary, based on Eqs 1–9, the dynamic relationship between the WTs and the thermal plants in the AGC response model of subarea i can be expressed, from which a state-space model of the AGC response process in this subarea can also be obtained, as shown in Eq. 10:
The parameters of the AGC state-space model of area i are as follows:
In Eq. 10, xi is the state variable of the state-space model and contains the main state indicators of each block in the AGC process of the ith area; ui is the input variable. The DMPC controller in this area modifies ui according to the operating state of the system, thereby adjusting the output of the thermal plants and the CWES system to improve the AGC performance. Aij and Bij are the state variable and control variable coefficient matrixes of area i and its adjacent area j, respectively. In this paper, by adding the state information and control information of adjacent areas to the local state-space expression, coordinated communication between the controllers of each area is realized. wi is the system disturbance variable. In this paper, the active load fluctuation is set as the disturbance variable in each subarea. yi is the output variable of the state-space model of the ith area. In this paper, the area control error ACEi is set as the controller’s output.
This section integrates the CWES in each subarea with traditional thermal power units into a unified AGC response model, and the wind power is integrated into the AGC process of each area by dynamically modifying the control parameters of local DMPC controller. As a result, the active AGC response capability of the CWES and conventional thermal generators inside multi-area grid can be fully utilized, and the ramping rate issue of conventional plants can be well alleviated.
3 Design of the DMPC algorithm and CWES cooperation strategy
3.1 Application of DMPC algorithm in interconnected power system
MPC is also known as rolling-horizon optimal control. The optimal closed-loop control sequence can be achieved by solving the optimal control problem at each control period, and only the initial step of the control sequence is applied. In the next time interval, a new optimization problem is established and solved based on the new measurement results. The application of MPC algorithms in interconnected power systems can be mainly divided into centralized MPC and distributed MPC (DMPC), but the centralized control architecture has the drawbacks of inflexible information communication and stability issues for large-scale interconnected systems with extensive geographic distribution scales and significant number of subsystems. Moreover, the computational burden of the upper-level controllers is always heavy. However, the DMPC algorithm transforms the large-scale constrained optimization problem into multiple small-scale local problems, and focusing on the association among subsystems, the optimization decision of subsystems, and the information exchange to ensure a global stability of the interconnected system. In addition, each local MPC controller cooperates through iteration and coordination to meet the global control objectives set by the system, and the DMPC algorithm can achieve the same performance as the centralized MPC algorithm with reduced computation time. Moreover, the DMPC algorithm is able to ensure a closed-loop stability by satisfying the iteration’s termination constraints. Considering that the modern interconnected power systems integrated with wind and thermal power units are typically geographically dispersed and complex systems with multiple interconnection areas, so the traditional centralized MPC models are complex with high dimensions and physical operation constraints. Therefore, under the DMPC control framework, the AGC of each sub-area is controlled by its local MPC controller without going through the upper-level controller, and the coordination of each subarea’s AGC process at the system level can be achieved through information communication between local controllers, which can reduce the computational burden and improve the overall AGC control performance effectively.
The framework of DMPC algorithm is designed by dividing the entire interconnected system into several subsystems, and each of which has its own independent local MPC controller. The local controller solves the local optimization problem while considering the state and control variables of its neighbouring subsystems, including the constraints, objectives, disturbances, and interactions between the subsystems. In addition, each local controller achieves optimal control based on local information and improves the overall performance by sharing information with other controllers to achieve a global optimization goal of the interconnected system through the coordinated strategy. The framework of DMPC is demonstrated in Figure 3. In this study, the AGC optimal control problem of a interconnected power system with combined wind-storage system is solved using a DMPC method.
1) Prediction model and objective function
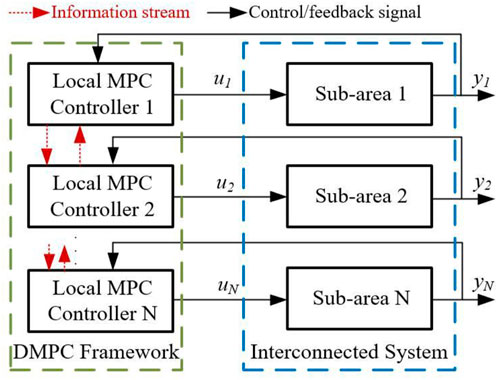
FIGURE 3. Framework of DMPC algorithm.
At each control interval, the local DMPC controllers of each area will exchange prediction and operation information with its neighbour subareas. The discretization of AGC state-space model of multi-area power system can be transformed into:
Define the prediction variable zi(k), and its relationship with the state variable xi(k), disturbance variable wi(k) and control variable ui(k) is shown in Eq. 12:
In summary, the objective function of the ith subarea is shown in Eq. 17:
By substituting Eq. 12 into Eq. 13, the optimization target Ji can be expressed in Eq. 14:
In the above equations, Np and Nc are the prediction and control steps of each optimization interval, respectively. x'i (k + j|k) and u'i (k + j|k) are the AGC response model’s prediction trajectories of the state variable and control variable in period Tp, respectively, and both trajectories’ starting point is k. Qi and Ri are the weighted positive definite matrixes in the ith subarea and are used as weight matrixes in the optimization function to affect the optimization result. Qi mainly affects the process of the state variable trending to the reference value, and Ri affects the control variable’s variation range in each optimization interval. The weighted matrixes in Eq. 15 are set as Q1 = Q2 = Q3 = diag (100,0,0,0,0,100,100) and R1 = R2 = R3 = diag (1,0).
According to the discrete state-space model and the states of the model at k, the states in the future period Np can be predicted. The prediction model based on the state variables and control variables of subarea i and its adjacent area j at time k can be expressed as follows:
The prediction vectors z i∗, u i∗ and w i∗ are defined as:
The prediction vectors are substituted into Eq. 17, and the result is transformed into the following prediction vector form:
By substituting the above equation into Eq. 15, the optimization objective function can be rewritten as:
In Eq. 20, f (k) and c (k) are functions of state variables and system disturbances at time k, respectively, which are known values, and H is a constant coefficient. By converting the objective function into a quadratic function form with ui∗ (k) as the pending variable, the optimization functions for each control interval are:
The transformation relationships between the main coefficient matrixes in the optimization model and the coefficient matrixes in the state-space model are as follows:
2) Constraints
According to (Ma et al., 2014), a typical value of the GRC (generation rate constraint, GRC) for a conventional synchronous generator is taken as 8%–10% per minute, and the power deviation rate of the conventional plant in the ith area can be restricted to
The power increment constraints of both conventional generator and wind turbine can be expressed as
Based on the above constraints and the expression of the state-space model of the multi-area power system, the constraints of the state variable and control variable in the objective function can be summarized as inequalities Eqs 25–27:
In this section, according to the AGC regulation demand and the operating states of WTs and ES, fuzzy-based controllers FLC1 and FLC2 are designed for dynamic modification of ui and cooperation inside the CWES system. Considering the physical constraints of the generation units in a subarea, by solving the DMPC-based optimal control objective function of each subarea, the WTs can take active part in the AGC response of each area to enhance the interconnected system’s AGC performance.
3.2 Coordinated operation strategy of the CWES system in subarea i
Due to the output characteristics of WTs, it cannot be guaranteed that wind farms in multi-source interconnected power system are capable of acting AGC response under scenarios with fluctuating wind speed. However, in the early stage of the frequency response process of the multi-area power system, WTs may not be able to increase their power due to the wind speed. Because of the slow ramp rate of thermal plants and the large “wind-thermal replacement”, the thermal plants alone cannot meet the AGC demand of this subarea, and there will be greater frequency fluctuations in this area, which will affect the frequency stability of the whole multi-area system. Therefore, to deal with the reliability problem in AGC response of wind farm, a coordinated control strategy of the CWES is proposed based on fuzzy theory. The Coordinated control and dynamic modification diagram of the CWES is demonstrated in Figure 4. This control diagram is composed of a DMPC parameter correction block and a CWES coordinated control block, which are introduced as follows:
1) Dynamic modification of DMPC

FIGURE 4. Coordinated control and dynamic modification diagram of CWES.
Each area’s DMPC output are modified by β, and β (0–1) can be dynamically achieved through FLC1 as shown in Figure 4. The input variables Frequency deviation and frequency change rate are chosen as FLC1’s input, and the data range can be found in reference (Peng et al., 2019). The fuzzy membership of FLC1 is depicted in Figure 5. The states of the input and output variables of FLC1 are described by five variables, and the reasoning rule of FLC1 is defined as: if frequency variation value or the absolute value of frequency change rate of local area is large, then DMPC modification coefficient β should be large; if frequency variation value is small and frequency change rate is nearly 0, then β should be small. The fuzzy reasoning rule of FLC1 is demonstrated in Table 1.
2) Coordinated operation strategy of the CWES system
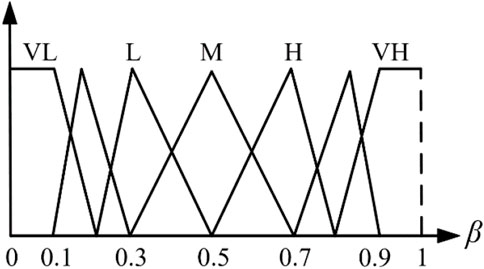
FIGURE 5. Fuzzy membership of FLC1 output.
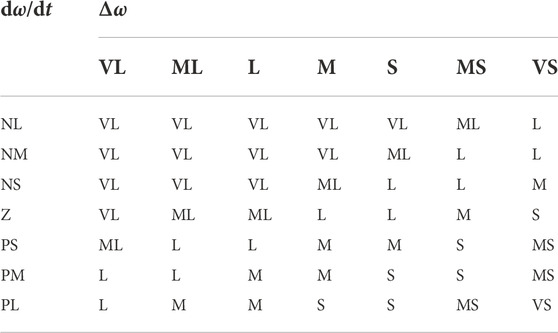
TABLE 1. Reasoning rules of FLC1.
By FLC1 and the fuzzy membership introduced above, the modified CWES active power for AGC response ΔP’ref,CWESi can be calculated. Hereafter, in order to participate in AGC response under scenarios with varying wind speed, a fuzzy controller FLC2 is designed for the CWES as depicted in Figure 6. In FLC2, real-time wind speed data and state of charge (SOC) value are chosen as inputs of FLC2 to represent current operation states of CWES. Furthermore, considering the AGC response demand and fluctuating wind scenario, reasoning rules of FLC2 are designed and the AGC cooperation factor αt can be calculated. Finally, by deploying FLC2 in the active power control block of the CWES, then a dynamic AGC demand allocation between the WTs and ES can be realized, and the flexible cooperation inside the CWES can be expressed as Eq. 28:
where ΔPref, ES and ΔPref, WT are the active power output reference of the wind turbine and energy storage unit, respectively. The sum of these two variables are the output of the CWES system, and the allocation of AGC response demand is adjusted by αt.
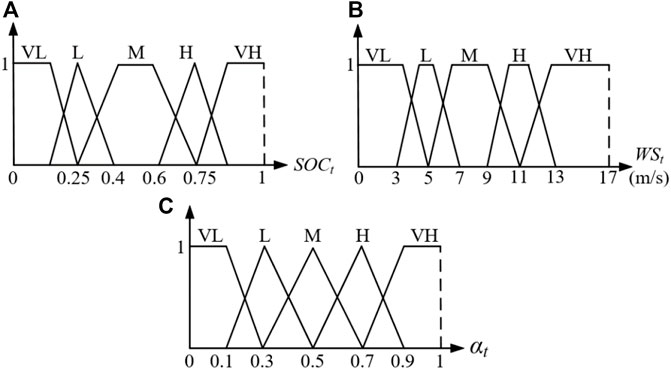
FIGURE 6. Fuzzy membership of FLC2. (A) Fuzzy membership of SOC (B) Fuzzy membership of wind speed (C) Fuzzy membership of FLC2’s output.
The fuzzy linguistic variables defined in FLC2 are similar with FLC1. The fuzzy membership of FLC2 is depicted in Figure 6. It can be observed in Figure 6A, when SOCt is below 0.2, which means there is little energy left in the ES, and the membership value can be set as VL. In addition, the membership which represents the level of wind speed is depicted in Figure 6B, according to operation characteristics of WTs studied in (Li et al., 2021a), the range of wind speed is defined from 0 to 17 m/s. Finally, as demonstrated in Figure 6C, αt is set to [0, 1].
In this paper, the scenario of a sudden load increase in the interconnected system is used as an example for analysis. Based on this scenario, the basic fuzzy logic rules of the controller are designed as follows:
When the active power generation in the power system cannot meet its load, then the ES device will turn into discharge state, and the WTs will increase their power output to support the system frequency in rising back to the rated value. When the capacity of the ES is fixed, a higher SOCt value indicates that the ES has sufficient electrical energy reserves for frequency support. Correspondingly, at that time, the active power reserve of WTs in the CWES system can be smaller. Moreover, when the WSt value is low, the active power backup of WTs at this time can only meet some part of the AGC regulation order, so the frequency regulation capability of WTs at this time is weak. In summary, if the SOCt value is high and the WSt value is low, then the dynamic allocation coefficient αt will take a higher value, which means that the ES will bear more AGC demand. If the SOCt value is low and the WSt value is high, then αt will take a lower value in this scenario, indicating that the CWES system will mainly use the active power reserve of WTs in response to the current AGC demand.
In the ith area, the control block framework of energy storage units is depicted in Figure 7.
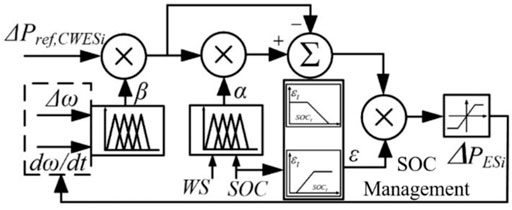
FIGURE 7. Control block of ES in subarea.
To fully utilize the limited ES capacity and avoid overcharging/discharging events during the subarea’s AGC process, this section designs an output modification diagram for the ES control loop. According to the SOC of the ES, the ES output is flexibly modified to realize dynamic cooperation between the ES and WTs and a smooth power output as expressed as Eq. 29. In addition, the proposed SOC management strategy is improved based on former works. Moreover, a piecewise function is constructed to establish a linear relationship between εt and SOCt to avoid a step change in εt with varying SOC. The relationship between εt and SOCt is shown in Eqs 30, 31.
Where εt is the correction factor of the ES output. When the ES is charging, μt equals 1, and μt will be set to 0 when the ES is discharging.
Based on the fuzzy logic algorithm, FLC1 and FLC2 are designed in this section to realize the unified AGC response of the CWES and conventional generator in each subarea, and dynamic cooperation inside the CWES system can also be achieved. Moreover, by applying the fuzzy-based FLC2 in the control loop of the CWES, the WTs are enabled to take active part in the AGC regulation of the multi-area power system reliably under scenarios with fluctuating wind speed, and the limited ES capacity can be fully exploited under the improved SOC management strategy. Then, by solving the optimal control objective function of the DMPC algorithm and considering the physical constraints of the thermal plants and CWES system in the subarea, the AGC performance can be improved at the level of whole multi-area power system.
3.3 Implementation steps of the DMPC algorithm in the interconnected multi-area system with CWES systems
The application steps of the proposed DMPC-CWES algorithm are demonstrated in Figure 8, and the entire control process can be divided into three parts: the initialization part (red dashed box), the communication part (blue dashed box), and the MPC part (black dashed box). Each part is specifically introduced as follows:
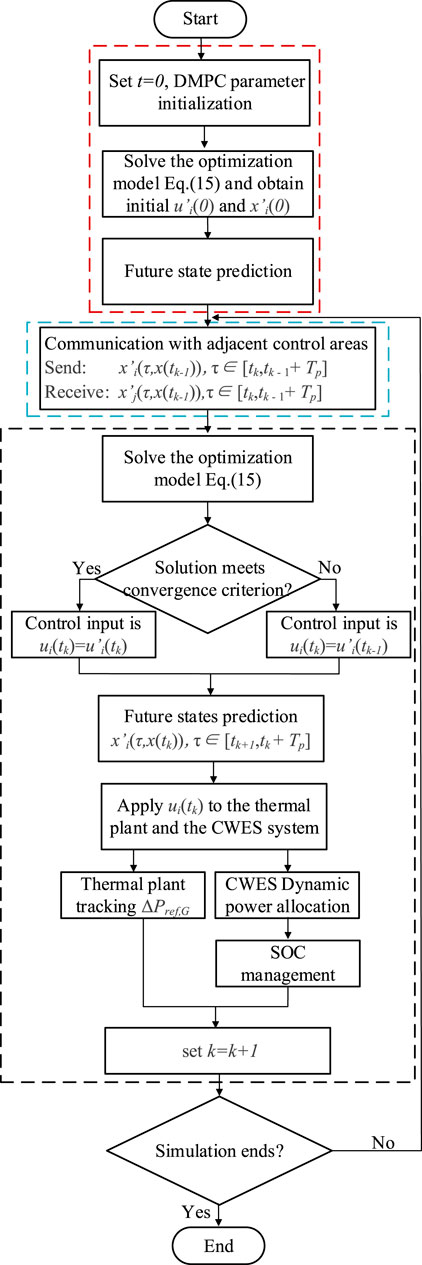
FIGURE 8. Flow chart of the proposed DMPC algorithm.
Algorithm initialization part:
a) Initialize the DMPC algorithm and the interconnected system.
b) Solve the optimization model in Eq. 15, and obtain the first solutions of the control input ui’ (0) and state xi’ (0) under the initial conditions.
c) The first prediction will proceed with the initial state variable and control variable of the system to obtain future states.
Information communication part:
Information exchange between control areas. At time instant tk, subarea i will send its previous predictions xi’ (δ,x (tk-1)), δ∈[tk, tk - 1 + Tp] to the adjacent control areas and receive prediction and control information xj’ (δ,x (tk-1)), δ∈[tk, tk - 1 + Tp] from other controllers.
MPC part:
a) Optimization: Solve the optimization model in Eq. 15.
b) If the solutions meet the convergence criterion, then the control input is ui (tk) = ui’(tk); otherwise, ui (tk) = ui’(tk-1).
c) Predict the future states xi’(δ,x(tk)), δ∈[tk + 1, tk + Tp].
d) Apply the control input to the thermal plants and the CWES system. Then, the thermal plants will track the reference generation setpoint ΔPref,G. After the reference power of the CWES ΔPref,CWES is decided by the DMPC controller, the power demand will be dynamically allocated between the WT and ES units according to their operating states. The WTs can participate in the AGC with auxiliary support from ES under various wind conditions, and the ES life can be prolonged by the SOC management strategy.
e) Set k = k + 1. If the simulation is not complete, then return to the communication part.
4 Simulation and case study
4.1 Parameter settings
To verify the AGC response performance of the proposed control strategy, a 3-area test model is designed on the MATLAB/Simulink platform, as depicted in Figure 1. The test model consists of three interconnected power systems, and each sub-power system has its own CWES system with an equivalent 15 MW wind turbine model and a 2 MW/1 MWh energy storage unit. The installed capacity of the conventional thermal generators in each subarea is 20 MW. In order to verify the dynamic AGC response performance of the multi-area system under different control strategies, a sudden 0.1 p.u. load step increase is set at 6 s in area 1 and area 2. The sampling time of the simulation scenarios is Ts = 1 s, and the prediction horizon Tp and control horizon Tc of the MPC algorithm are set as 10 s and 5 s, respectively. The parameters of the interconnected areas in the simulation are demonstrated in Table 2.
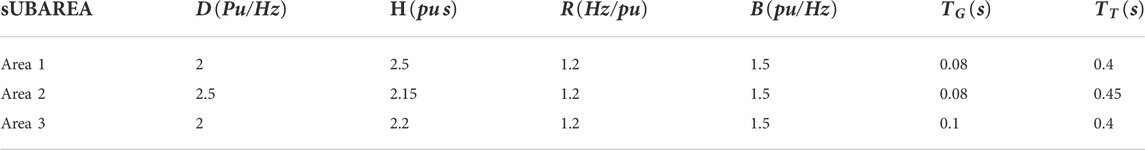
TABLE 2. Parameters applied in the simulation test.
4.2 Simulation results and analysis
4.2.1 Case A
In this case, the multi-area simulation system is tested with fixed wind speed. Three kinds of control methods including the proposed DMPC-CWES strategy have been tested and compared in this case. The test results of this case are depicted in Figures 9–14.
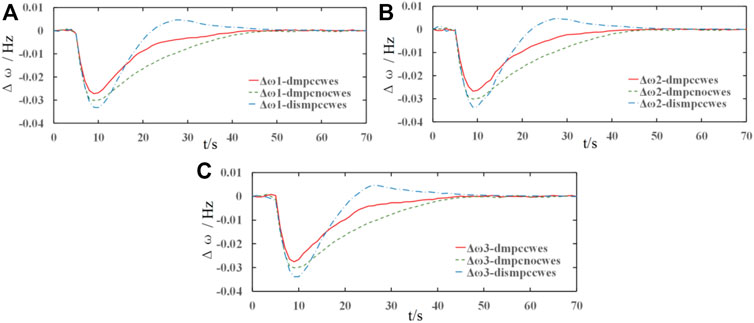
FIGURE 9. AGC response performance of multi-area power system. (A) AGC response performance in the 1st area; (B) AGC response performance in the 2nd area; (C) AGC response performance in the 3rd area.
The AGC performance of each subarea is shown in Figure 9. The red solid curves represent the simulation results under the proposed DMPC strategy with CWES auxiliary support; the green dotted lines show the response results under the DMPC strategy without the CWES system, and the blue dashed curves display the response performance of the distributed MPC algorithm. The test data results in case A are listed in Table 3, and Δfmax is the maximum average value of frequency fluctuation and tstable is the average period for frequency to recover to stable state.
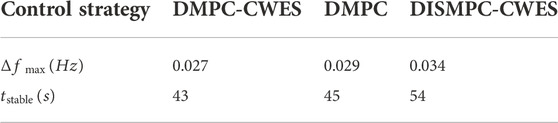
TABLE 3. Test results in case A.
From Figures 9A–C, it is apparent that the frequency maximum variation and the frequency recovery time and the steady-state stability under the proposed DMPC algorithm with CWES demonstrate better performance than those of the other control strategies. Figures 9A is taken for further analysis because the frequency response performance is similar in each subarea. Comparing both DMPC algorithm results shown in Figures 9A, the algorithm with auxiliary frequency support from the CWES system shows better response performance than the control strategy without the CWES system. During the frequency response process, the CWES takes an active part in the AGC process. Moreover, both the WT and ES units have better power order tracking features than conventional thermal plants; therefore, when the load step occurs, the CWES system responds to the power imbalance immediately by injecting active power into the interconnected system, so the red curve exhibits smaller frequency variation than the green curve without the CWES system. Owing to the GRC constraints on the thermal plants, the green curves take more time to return to steady state. It can be observed that in all three images in Figure 9, the control performance under the distributed MPC algorithm has the largest frequency variation and fluctuation during the AGC response process. In the distributed MPC control algorithm, the frequency of the interconnected power system may eventually return to the normal value. However, due to the lack of prediction and control information exchange between subareas during the AGC control process, the sub-MPC controllers focus more on their local control targets than on coordination from an interconnected system perspective, leading to a less satisfactory simulation result.
The connections between subareas are maintained by tie-lines, and the active power exchange during the AGC process is also realized through them. The tie-line active power exchange in each subarea under different control methodologies is displayed in Figures 10A–C, and the appearances of the curves are the same as those in Figure 1. As can be observed in Figures 10A, the ΔPtie curves under the DMPC algorithm are smoother than the control performance under the distributed MPC strategy. Owing to the lack of information communication with other sub-MPC controllers, there are more power fluctuations in the tie-line power change process. Moreover, it can also be observed that the dotted green curves are slightly closer to zero than the solid red curves, which means that more power is exchanged through the tie-lines under the DMPC mode with CWES auxiliary support. According to the curves shown in Figure 9, the frequency is restored to the normal value quicker than in the strategy without CWES support. Although the blue curves may show that more energy is exchanged via the tie-lines than in the other two situations during certain periods, the negative influences of tie-line power fluctuations under the distributed MPC mode are much larger than those under the DMPC mode. Moreover, because the load step occurs in area 1 and area 2, as displayed in Figure 10, active power is injected into these two areas through the tie-lines to support the power imbalance in these two areas. In contrast, the power flows from area 3 to the other areas, and this also demonstrates that the AGC control target of the whole system is achieved through coordination among subareas inside the interconnected system. Therefore, in the design process of the AGC controller, the control and prediction information communication between subareas should be fully considered like that in the proposed DMPC algorithm, and the control performance has been clearly improved, as shown in Figures 9, 10.
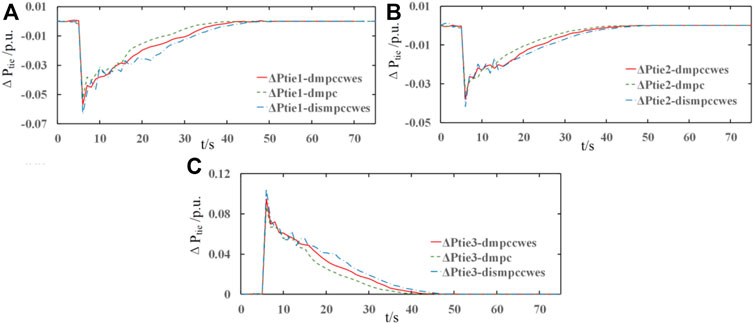
FIGURE 10. Power exchange of tie-lines between the adjacent areas. (A) active power exchange in the 1st area; (B) active power exchange in the 2nd area; (C) active power exchange in the 3rd area.
In the interconnected multi-area system, the AGC response is mainly realized by the generation units, and most of them are conventional thermal units. The power output variation simulation results ΔPm of the conventional thermal plants in each subarea are shown in Figure 11. It is apparent that the simulation curves in Figures 11A,B have similar trends, and it is reasonable to choose Figures 10A for the control performance analysis of the 1st and 2nd area. As depicted in Figure 11A, ΔPm under the proposed DMPC strategy with CWES reaches its steady output state at t = 38 s, and the steady-state time of ΔPm under DMPC without CWES is 42 s. Although the results of the DMPC methods share similar times for reaching the steady state, ΔPm of the DMPC algorithm with CWES auxiliary support has a faster response speed, and the fast response ability is realized by coordinated operation between the WT and ES units inside the CWES system. Therefore, the frequency support performance under this control strategy is better than that of the other two methods. Moreover, the simulation results under the distributed MPC algorithm show more fluctuation features than those under the DMPC algorithm, and the time when steady state is reached is t = 44 s, which is longer than that of the former control methods. Figure 11C demonstrates the simulation results of the active power variation of the thermal plants in area 3, and it can be clearly observed that ΔPm in area 3 returns to 0 after reaching the steady state. Area 3 mainly provides active power support for the other two areas in the AGC process, and there is no load step in this area. Therefore, ΔPm in area 3 is 0 at steady state, and ΔPm is 0.1 p. u. MW in both the area 1 and area 2 to make up for the energy imbalance generated by the load steps.
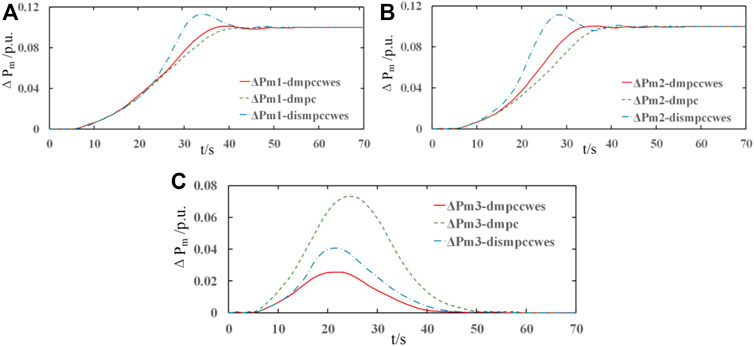
FIGURE 11. Active power output variation of the conventional generators in the interconnected areas. (A) Active power trajectory in the 1st area; (B) active power trajectory in the 2nd area; (C) active power trajectory in the 3rd area.
Notably, the power variation curves under DMPC without the CWES system are higher than those curves of the other two strategies. This means that without the auxiliary AGC support of the CWES system, the power generation burden of thermal power plants in area 3 to provide power support for area 1 and area 2 is much heavier than that of the control strategy with the CWES system.
Figure 12 illustrates the simulation results of the power output variation of the CWES systems in the three interconnected areas, and the results under different control algorithms are displayed in different colours for comparison. Notably, in all three images in Figure 12, the power variation under the DMPC algorithm without the CWES system is zero; therefore, only the test results under the proposed DMPC-CWES control framework and the distributed MPC algorithm are compared and displayed in Figure 12.
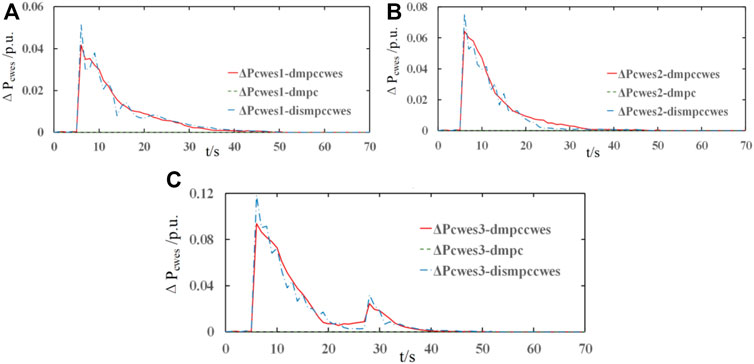
FIGURE 12. Active power output variation of the CWES systems in each subarea in the AGC response process: (A) active power variation of the CWES in the 1st area; (B) active power variation of the CWES in 2nd area; (C) active power variation of the CWES in the 3rd area.
As demonstrated in Figures 12A,B, all the CWES power variation curves step up at t = 6 s to respond to the active power load steps in area 1 and area 2. Due to the generation rate constraints of conventional thermal plants in the interconnected power system, the active power imbalance cannot be compensated immediately. Therefore, during the early stages of the power imbalance, the CWES system assumes the main role of frequency support and makes a quick response to the AGC requirements to prevent the system frequency from falling to a lower level. Moreover, with the auxiliary energy from the CWES, the AGC burden of the conventional thermal plants can be effectively alleviated. Then, as the AGC process proceeds, the main AGC responsibility gradually shifts from the CWES systems to the thermal plants in the interconnected system because the long-term AGC power generation matches the features of the thermal plants. Although the CWES system can provide auxiliary frequency support under both control algorithms, in terms of control performance, it can be clearly observed that there are more fluctuations in the distributed MPC algorithm than in the proposed control strategy. Due to the absence of control information exchange between sub-MPC controllers in each area, the power generated from the WTs and ES changes more frequently, leading to unsatisfactory control performance compared with that of the proposed DMPC algorithm with information sharing.
Notably, as shown in Figure 12C, there is another generation step up at t = 28 s for frequency support with a smaller margin than that at t = 6 s. As shown in Figure 11C, ΔPm of the thermal plants in area 3 begins gradually decreasing to 0; however, the AGC process is still ongoing, so the power outputs of the CWES system increase again to alleviate the AGC burden on the thermal plants.
4.2.2 Case B
Considering the wind speed in practical scenarios is fluctuating, therefore it is essential to test the control performance of the proposed control strategy under a varying wind condition. The range of the test wind speed fluctuates from 3 m/s to 14 m/s, which covers the most operation states of the WT. The wind speed trajectory is depicted in Figure 13.
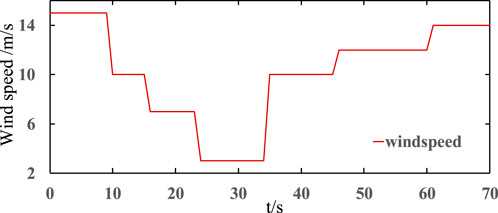
FIGURE 13. Varying wind speed for testing the CWES in the multi-area power system.
In case B, the AGC response capability of the WT and ES is fully utilized through fuzzy controller FLC1, FLC2, and SOC management. The test results data under fluctuating wind speed are listed in Table 4. Δf15s and Δf22s are the frequency drops caused by the wind speed changes at t = 15 s and 22 s, respectively; tstable(s) is the period when the frequency recovers to stable state.
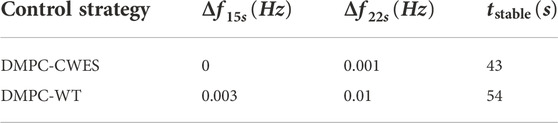
TABLE 4. Test results in case B.
The test results are depicted in Figure 14A. The simulation results in Figure 14A are obtained under the same DMPC algorithm, except that the red curve represents auxiliary support from the CWES system and the green curve indicates without that support. The curves show similar control performance until the wind speed drops from 10 m/s to 7 m/s at t = 15 s. When the WT operates under a wind speed higher than 10 m/s, it achieves the rated power output. However, when the wind speed drops below 10 m/s, the WT has to change into the MPPT mode, in which it adjusts its power output according to the wind speed; therefore, the power for AGC support is restrained by the current wind conditions. When there is no ES unit to compensate for the insufficient power that should be generated by the WT, the mode with only the WT exhibits a second frequency drop at t = 15 s, as shown by the green dashed curve in Figure 14A. Moreover, at t = 22 s, a greater decrease occurs in the wind speed, which drops by 3 m/s. In this wind condition, the WT will stop generating power, and the AGC support process will be suspended. As demonstrated from Figures 14A–C, after t = 22 s, there is no power from the WTs for AGC support, and the frequency drops again due to the sudden power imbalance caused by the stopping of the WTs. In contrast, under the proposed DPMC-CWES control algorithm, the negative influences on the control performance caused by the varying wind conditions are much smaller than those without the CWES system. In Figure 14A, the frequency fluctuations in the red curve at t = 15 s and t = 22 s are obviously smaller than those in the green curve. As shown in Figure 14B, after t = 22 s, the green curve reaches 0, which means that the WTs stop supporting the AGC process, while the power from the CWES system still responds to the AGC demand until the frequency returns to a normal value. As shown in Figure 14C, in spite of its lower power output as wind speed decreases, the WT still can respond to AGC regulation demand effectively, and the ES generates additional power to make up for the power imbalance caused by WT’s exit. Figure 14D demonstrates the ES power output inside the CWES system during the AGC process. When the wind speed drops and the power from WTs decreases, the ES power will ramp up to meet the AGC demand for the CWES system to ensure that the CWES system can exhibit adaptability and reliability for operating in varying wind conditions.
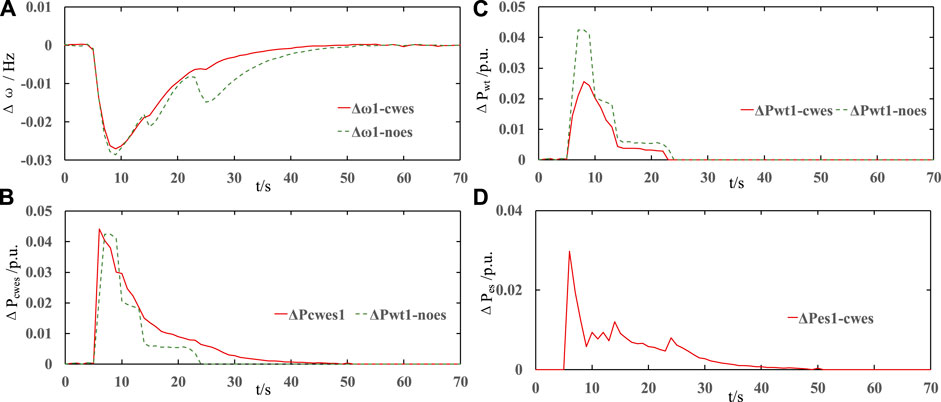
FIGURE 14. Test results under fluctuating wind speed: (A) frequency simulation trajectory under the DMPC-CWES and no-ES strategy in the 1st area, (B) active power of the wind farm under the DMPC-CWES and no-ES strategy in the 1st area, (C) active power of the CWES under the DMPC-CWES and no-ES strategy in the 1st area, and (D) active power output curve of the ES.
This case demonstrates that the proposed DMPC-CWES coordinated operation strategy is capable of adapting operation scenarios with fluctuating wind speed, and the AGC response performance of the multi-area power system can also be assured.
4.2.3 Comparison with other AGC control strategies
In this section, the AGC control performance of control strategies applied this paper and other research works on the AGC problem of the interconnected power system are compared. The comparison tests are conducted on the same simulation system of Section 4.1, a sudden 0.1 p.u. load step increase is set at 6 s in area 1 and area 2. In addition, a wind speed fluctuation event is set at 46 s in order to compare the reliability of different AGC control strategies under varying wind speed. The comparison results are listed in Table 5, and the simulation result is demonstrated in Figures 15, 16.

TABLE 5. Test results of AGC performance under different control strategies.
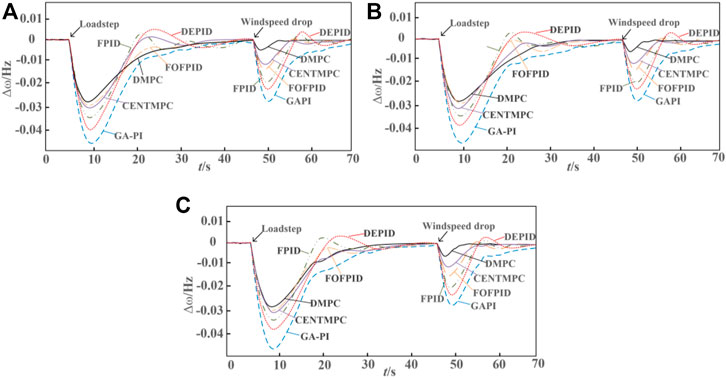
FIGURE 15. AGC response performance of multi-area power system under different control strategies. (A) AGC response performance in the 1st area; (B) AGC response performance in the 2nd area; (C) AGC response performance in the 3rd area.
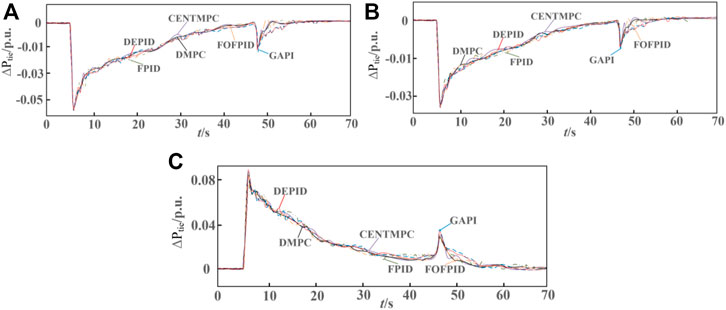
FIGURE 16. Power exchange of tie-lines between the adjacent areas under different control strategies. (A) active power exchange in the 1st area; (B) active power exchange in the 2nd area; (C) active power exchange in the 3rd area.
Besides the proposed DMPC-based AGC control strategy, five other AGC control strategies are tested in this section, including the GAPI (Genetic algorithm-based PI controller), FPID (Fuzzy algorithm-based PID), DEPID (differential evolution algorithm based PID), FOFPID (fractional order fuzzy PID), and CENTMPC (centralized MPC). As demonstrated in Figure 15, the DMPC, CENTMPC and FOFPID have better performance in lifting the frequency nadir caused by sudden load step than the other three strategies, and average frequency variation settling time of the proposed DMPC-based strategy in the first frequency drop event is 38 s, which is the shortest of all the AGC strategies in the comparison test. After windspeed fluctuation at t = 46 s, there is a second frequency drop, and the frequency nadir is −0.8 × 10⁻² Hz under the proposed strategy and it outperforms the other AGC strategies due to the coordinated operation between windfarm and thermal plants as well as the active AGC response from the combined wind and energy storage system. In addition, as can be observed in Figure 16, due to the coordinated multi-source operation and the effective information communication between local MPC controllers in each control step, there is less fluctuations and power overshoots in the exchanged tie-line power under the proposed AGC strategy than the other strategies under a centralized and uncoordinated control framework.
4.3 Discussion
Three simulation scenarios are designed to validate the proposed AGC control strategy. In Case A, the combined wind-storage systems inside the multi-area power system operate under fixed wind speed to validate the effectiveness of the proposed coordinated AGC strategy. In Case B, a varying windspeed has been added to the test system to test the adaptability and reliability of the proposed strategy under practical complex operation scenarios. Finally, in Section 4.3, comparisons among other AGC control strategies in existing works have been made to validate the outstanding performance of the proposed control strategy for the interconnected power system with high wind power integration.
From the numerical results in Section 4.2, it demonstrates that during the frequency response process, by exchanging the prediction and state information with adjacent subsystems in the distributed MPC control framework, the power fluctuations of tie-lines can be apparently depressed than the other control strategies. Moreover, through the coordinated operation strategy for multi-sources inside the interconnected power system, the combined wind-storage system can take an active part in the AGC process, and the AGC response burden of conventional thermal plants can be alleviated significantly. Specially in Section 4.2.3, comparisons with other AGC control strategies also demonstrates the effectiveness and the adaptability of the proposed control strategy for the specified interconnected power system with multiple energy sources and high wind power penetration rate. Although other AGC control strategies in existing works both have outstanding control performance for interconnected power system, there still exist a performance gap compared to the proposed coordinated control strategy due to the lack of coordination between fluctuating wind energy, thermal plants with physical constraints and features of energy storage units. In conclusion, the overall AGC performance of an interconnected multi-source power system can be effectively improved through the DMPC-based coordinated AGC control strategy.
In this paper, the focus of the proposed control strategy lies on the coordinated operation of the combined wind-storage system and the complementary characteristics between wind turbine, energy storage units and traditional thermal plants to achieve the improvement of AGC performance. The authors assume that each area communicates through a dedicated AGC channel, and the time delay effect of the signal is ignored. However, with the increasing scale of grid interconnection, AGC needs to transmit wide-area control signals with the help of open communication networks, which may generate large time delays and negatively affect the control performance. Therefore, the impact of communication time delay on the AGC control performance in large-scale interconnected grids needs to be considered in future work to make further improvements and enhancements to the control strategy.
5 Conclusion
This paper designed a novel coordinated AGC control strategy for an interconnected multi-source power system based on distributed model predictive control algorithm. The multi-source interconnected power system is separated into three subsystems, and local DMPC controllers are deployed in each area to address the drawbacks of a centralized control architecture by exchanging forecast and state measurement information with adjacent areas. Additionally, in each subarea, the operation parameters of the CWES and local thermal generators are created into a synthetic state-space model that allows for a flexible cooperation between wind farm and thermal plants to enhance the AGC performance at the level of the interconnected system. In addition, taking into consideration the current operating points of the CWES, a fuzzy-based coordinated operation scheme is designed for the purpose of dynamically allocating the AGC power demand inside the CWES system. Consequently, dynamic collaboration between WTs and ES can be realized, and the CWES’s reliability for AGC in diverse operation scenarios can be guaranteed. Finally, the effectiveness of the proposed DMPC-CWES AGC response strategy is validated by simulation tests on a three-area multi-source power system with high wind penetration, numerical results demonstrate that the proposed coordinated AGC control strategy has better performance in AGC performance and the dynamic cooperation can be achieved between wind power and thermal plants in AGC response through the designed wind-storage system and coordinated DMPC AGC control strategy.
Data availability statement
The original contributions presented in the study are included in the article/supplementary material, further inquiries can be directed to the corresponding author.
Author contributions
Conceptualization, BP and XM; methodology, BP; software, XXM; validation, BP, CT, and YS; formal analysis, YS; investigation, CT; data curation, BP; writing—original draft preparation, BP; writing—review and editing, BP; visualization, XM; supervision, BP; project administration, BP; funding acquisition, BP. All authors have read and agreed to the published version of the manuscript.
Funding
This work is supported in part by the Natural Science Youth Foundation of Shandong province under Grant ZR2021QE240, and in part by PhD Research Fund of Shandong Jianzhu University under Grant X21040Z.
Conflict of interest
Author YS was employed by Jinan Yuny Technology Co., Ltd.
The remaining authors declare that the research was conducted in the absence of any commercial or financial relationships that could be construed as potential conflict of interest.
Publisher’s note
All claims expressed in this article are solely those of the authors and do not necessarily represent those of their affiliated organizations, or those of the publisher, the editors and the reviewers. Any product that may be evaluated in this article, or claim that may be made by its manufacturer, is not guaranteed or endorsed by the publisher.
References
Abazari, Ahmadreza, Hassan, Monsef, and Wu, Bin (2019). Load frequency control by de-loaded wind farm using the optimal fuzzy-based PID droop controller. IET Renew. Power Gener. 131, 180–190. doi:10.1049/iet-rpg.2018.5392
Abd-Elazim, Sahar M., and Ehab, S. Ali. (2018). Load frequency controller design of a two-area system composing of PV grid and thermal generator via firefly algorithm. Neural comput. Appl. 302, 607–616. doi:10.1007/s00521-016-2668-y
Arya, Yogendra. (2017). AGC performance enrichment of multi-source hydrothermal gas power systems using new optimized FOFPID controller and redox flow batteries. Energy 127, 704–715. doi:10.1016/j.energy.2017.03.129
Aziz, S., Wang, H., Liu, Y., Peng, J., and Jiang, H. (2019). Variable universe fuzzy logic-based hybrid LFC control with real-time implementation. IEEE Access 7, 25535–25546. doi:10.1109/access.2019.2900047
Chang-Chien, L., Sun, C., and Yeh, Yu-Ju (2013). Modeling of wind farm participation in AGC. IEEE Trans. Power Syst. 293, 1204–1211.
Chen, Min-Rong, Zeng, Guo-Qiang, and Xie, Xiao-Qing (2018). Population extremal optimization-based extended distributed model predictive load frequency control of multi-area interconnected power systems. J. Frankl. Inst. 35517, 8266–8295. doi:10.1016/j.jfranklin.2018.08.020
Debbarma, S., Chandra Saikia, L., and Sinha, N. (2013). AGC of a multi-area thermal system under deregulated environment using a non-integer controller. Electr. Power Syst. Res. 95, 175–183. doi:10.1016/j.epsr.2012.09.008
Hasanien, H. M., and El-Fergany, A. A. (2019). Salp swarm algorithm-based optimal load frequency control of hybrid renewable power systems with communication delay and excitation cross-coupling effect. Electr. Power Syst. Res. 176, 105938. doi:10.1016/j.epsr.2019.105938
Jain, A., Chakrabortty, A., and Emrah, B. (2018). Distributed wide-area control of power system oscillations under communication and actuation constraints. Control Eng. Pract. 74, 132–143. doi:10.1016/j.conengprac.2018.03.003
Kocaarslan, Ilhan, and Çam, Ertuğrul (2005). Fuzzy logic controller in interconnected electrical power systems for load-frequency control. Int. J. Electr. Power & Energy Syst. 278, 542–549. doi:10.1016/j.ijepes.2005.06.003
Li, H., Deng, J., Feng, P., Pu, C., Arachchige, D. D. K., and Cheng, Q. (2021). Short-term nacelle orientation forecasting using bilinear transformation and ICEEMDAN framework. Front. Energy Res. 9, 780928. doi:10.3389/fenrg.2021.780928
Li, H. (2022), SCADA data based wind power interval prediction using LUBE-based deep residual networks. Front. Energy Res. 10, 920837. doi:10.3389/fenrg.2022.920837
Li, H., Deng, J., Yuan, S., Feng, P., and Arachchige, D. D. K. (2021). Monitoring and identifying wind turbine generator bearing faults using deep belief network and EWMA control charts. Front. Energy Res. 9, 799039. doi:10.3389/fenrg.2021.799039
Li, H. (2022). Short-term wind power prediction via spatial temporal analysis and deep residual networks. Front. Energy Res. 662. doi:10.3389/fenrg.2022.920407
Lv, X., Sun, Y., Wang, Y., and Dinavahi, V. (2020). Adaptive event-triggered load frequency control of multi-area power systems under networked environment via sliding mode control. IEEE Access 8, 86585–86594. doi:10.1109/access.2020.2992663
Ma, M., Chen, H., Liu, X., and Allgower, F. (2014). Distributed model predictive load frequency control of multi-area interconnected power system. Int. J. Electr. Power & Energy Syst. 62, 289–298. doi:10.1016/j.ijepes.2014.04.050
Ma, M., Zhang, C., Liu, X., and Chen, H. (2017). Distributed model predictive load frequency control of the multi-area power system After deregulation. IEEE Trans. Ind. Electron. 646, 5129–5139. doi:10.1109/tie.2016.2613923
Magdy, Gaber, Mohamed, E. A., Shabib, G., Elbaset, A. A., and Mitani, Y. (2018). SMES based a new PID controller for frequency stability of a real hybrid power system considering high wind power penetration. IET Renew. Power Gener. 1211, 1304–1313. doi:10.1049/iet-rpg.2018.5096
Mohanty, Banaja, Panda, Sidhartha, and Hota, P. K. (2014). Controller parameters tuning of differential evolution algorithm and its application to load frequency control of multi-source power system. Int. J. Electr. power & energy Syst. 54, 77–85. doi:10.1016/j.ijepes.2013.06.029
Peng, B., Zhang, F., Liang, J., Ding, L., Liang, Z., and Wu, Q. (2019). Coordinated control strategy for the short-term frequency response of a DFIG-ES system based on wind speed zone classification and fuzzy logic control. Int. J. Electr. Power & Energy Syst. 107, 363–378. doi:10.1016/j.ijepes.2018.11.010
Shayeghi, H., Shayanfar, H. A., and Malik, O. P. (2007). Robust decentralized neural networks based LFC in a deregulated power system. Electr. Power Syst. Res. 77, 3241–4251. doi:10.1016/j.epsr.2006.03.002
Shiroei, M., and Ranjbar, A. M. (2014). Supervisory predictive control of power system load frequency control. Int. J. Electr. Power & Energy Syst. 61, 70–80. doi:10.1016/j.ijepes.2014.03.020
Venkat, Aswin N., Hiskens, I., Rawlings, J., and Wright, S. (2008). Distributed MPC strategies with application to power system automatic generation control. IEEE Trans. Control Syst. Technol. 166, 1192–1206. doi:10.1109/tcst.2008.919414
Wen, S., Yu, X., Zeng, Z., and Wang, J. (2015). Event-triggering load frequency control for multiarea power systems with communication delays. IEEE Trans. Ind. Electron. 632, 1308–1317. doi:10.1109/tie.2015.2399394
Wu, Ziping, Gao, D. W., Zhang, H., Yan, S., and Wang, X. (2017). Coordinated control strategy of battery energy storage system and PMSG-WTG to enhance system frequency regulation capability. IEEE Trans. Sustain. Energy 83, 1330–1343. doi:10.1109/tste.2017.2679716
Xiong, L., Li, H., and Wang, J. (2018). LMI based robust load frequency control for time delayed power system via delay margin estimation. Int. J. Electr. Power & Energy Syst. 100, 91–103. doi:10.1016/j.ijepes.2018.02.027
Yousef, Hassan A., Al-Kharusi, K., Albadi, M. H., and Hosseinzadeh, N. (2014). Load frequency control of a multi-area power system: An adaptive fuzzy logic approach. IEEE Trans. Power Syst. 294, 1822–1830. doi:10.1109/tpwrs.2013.2297432
Yuan, Y., Zhang, P., Wang, Z., and Chen, Y. (2020). Noncooperative event-triggered control strategy design with round-robin protocol: Applications to load frequency control of circuit systems. IEEE Trans. Ind. Electron. 67 (3), 2155–2166. doi:10.1109/tie.2019.2903772
Zhang, C.-K., Jiang, L., Wu, Q. H., He, Y., and Wu, M. (2013). Delay-dependent robust load frequency control for time delay power systems. IEEE Trans. Power Syst. 283, 2192–2201. doi:10.1109/tpwrs.2012.2228281
Keywords: AGC, multi-area, frequency response, DMPC, fuzzy algorithm
Citation: Peng B, Ma X, Ma X, Tian C and Sun Y (2023) Coordinated AGC control strategy for an interconnected multi-source power system based on distributed model predictive control algorithm. Front. Energy Res. 10:1019464. doi: 10.3389/fenrg.2022.1019464
Received: 15 August 2022; Accepted: 30 September 2022;
Published: 12 January 2023.
Edited by:
Yusen He, The University of Iowa, United StatesReviewed by:
Huajin Li, Chengdu University, ChinaOmveer Singh, Gautam Buddha University, India
Amil Daraz, Nazarbayev University, Kazakhstan
Lichun Zhang, The University of Iowa, United States
Copyright © 2023 Peng, Ma, Ma, Tian and Sun. This is an open-access article distributed under the terms of the Creative Commons Attribution License (CC BY). The use, distribution or reproduction in other forums is permitted, provided the original author(s) and the copyright owner(s) are credited and that the original publication in this journal is cited, in accordance with accepted academic practice. No use, distribution or reproduction is permitted which does not comply with these terms.
*Correspondence: Xin Ma, cGVuZ2JvMjBAc2RqenUuZWR1LmNu