 Wenyan Qian
 Siyuan Cao2
 Yuanshi Zhang
 Qinran Hu
- 1School of Electrical Engineering, Southeast University, Nanjing, China
- 2Nanyang Technological University, Singapore, Singapore
- 3School of Engineering, University of British Columbia, Kelowna, BC, Canada
Multi-terminal high voltage DC (MTDC) network is an effective technology to integrate large-scale offshore wind energy sources into conventional AC grids and improve the stability and flexibility of the power system. In this paper, firstly, an analytical model of a general applicable MTDC system integrated with several isolated AC grids is established. Then, an improved AC-DC power flow algorithm is used to eliminate the additional DC slack bus or droop bus iteration (SBI/DBI) step of the conventional AC-DC sequential power flow. A multi-objective optimal power flow (MOPF) algorithm is proposed to minimize two optimization targets, i.e., overall active power loss and generation costs of the system. To increase the degree of freedom, adaptive droop control is used in the proposed optimization algorithm in which the voltage references and droop coefficients of the modular multilevel converters (MMCs) are control variables. A multiple objective particle swarm optimization (MOPSO) method is applied to solve the MOPF problem and achieve the Pareto front. A technique for order of preference by similarity to ideal solution (TOPSIS) is incorporated in the decision analysis section and helps the decision maker to identify the best compromise solution.
Introduction
In recent years, there has been a steady transition of energy from traditional fossil fuel sources toward renewable energy, typified by the use of wind power. In contrast to fossil energy sources such as coal and oil, wind energy is clean, low-carbon, and sustainable, making it an effective way to resolve the conflict between energy depletion and socioeconomic growth (Chen et al., 2020; Hu et al., 2022a; Hu et al., 2022b). Offshore wind energy is growing in popularity as a source of renewable energy compared to onshore wind energy because of the vast sea area, high and consistent wind speed, high utilization rate, and minimum environmental impact (Beiter et al., 2017; Xiao et al., 2021). Although the majority of the offshore wind farms currently in use are situated within 100 km of the coast and have relatively small capacities, there are some located farther offshore and are larger in scope. Based on the grid connection requirements, the transmission mode of offshore wind farms can be divided into two categories: high-voltage alternating current (HVAC) and high-voltage direct current (HVDC) transmission (Meah and Ula, 2007; Kalair et al., 2016; Yang et al., 2022).
However, while optimizing the energy structure, various issues have been brought about as a result of the widespread use of wind energy (Ma et al., 2017; Dong and Li, 2021). Large-capacity wind farms are typically located far away from load centers, which makes local consumption more challenging. The operation of wind turbines connected to the grid directly through AC lines is unstable, subject to system voltage fluctuations, and may even trigger the false operation of relay protection devices in wind farms. The voltage stability of the system may also be influenced by voltage fluctuation and flicker brought on by wind power volatility (Wei et al., 2011). Meanwhile, the charging problem of AC cable limits the transmission capacity of active power and increases the construction cost of reactive power compensation equipment (Meah and Ula, 2007; Kalair et al., 2016).
A Voltage Source Converter based high-voltage direct current transmission technology (VSC-HVDC) has been presented as a solution to these issues. The usage of VSC HVDC has many benefits over HVAC and line commutated converter-based HVDC (LCC-HVDC) (Muniappan, 2021; Damala et al., 2022). For instance, it may be used to connect to asynchronous grids, requires no reactive power compensation, and does not have phase change failures (Li et al., 2014). Another advantage of the VSC converter over the traditional LCC converter is that it can independently control the active and reactive power injection of the AC system and is comparatively simple to expand traditional point-to-point HVDC to high voltage multi-terminal (MTDC) setups. Additionally, due to the exceptional qualities in terms of performance, scalability, and controllability, modular multilevel converters (MMCs), has been replacing the traditional two- or three-level converter technologies for HVDC applications (Saad et al., 2013; Debnath et al., 2014; Saad et al., 2016).
MTDC is a potential technology to integrate large-scale offshore wind energy sources into conventional AC grids. The MMC-MTDC technology is cost-effective and can be used to improve the stability and flexibility of the system. It has become an important method for connecting offshore wind power plants to the grid and has obvious advantages for long-distance and large-scale offshore wind power systems (Liang et al., 2011; Chaudhuri et al., 2012). The usage of an MTDC grid, however, also presents new challenges for converter control strategies (Yao et al., 2008). Only one bus is used as the DC slack bus in the conventional master-slave control of the converter stations to manage the DC grid voltage, which is susceptible to DC-grid failures. Droop control can significantly improve the stability of the DC grid since numerous converters operating in droop control mode can serve as distributed DC slack buses (Nasirian et al., 2014; Chen et al., 2017).
Also, several studies have been done on the optimal power flow (OPF) of the MTDC system in recent years, as strategies for achieving optimal control and scheduling of the power systems have drawn increasing amounts of attention (Rouzbehi et al., 2014; Khazaei et al., 2015). To achieve optimal power flow, usually, the topology selection, parameter configuration, and capacity of the VSC-MTDC system are optimized and analyzed to minimize the construction or operation cost. Baradar et al. (2013) proposed an algorithm for solving the optimal power flow of AC-DC systems based on second-order cone programming. Cao et al. (2013) aimed to minimize the transmission loss of the whole AC/DC network with different VSC control strategies and grid code compliance of wind farms considered. Song et al. (2020) proposed a cost-based adaptive droop control strategy for use in a VSC-based MTDC system to minimize the total generation cost of the AC system. However, these studies only consider one objective. Since they did not consider the trade-offs of different objectives, the optimal solutions obtained from these single-objective optimizations frequently result in unsatisfactory solutions for some other objectives.
Based on this problem, the concept of multi-objective OPF (MOPF) is proposed. Ghasemi et al. (2014) solved the non-convex, non-smooth, and high-dimension optimization MOPF problem using a multi-objective modified imperialist competitive algorithm (MOMICA) but is only limited to the AC grid. Rodrigues et al. (2012) considered both transmission loss and social welfare as optimization objectives for a hybrid AC-DC system. A genetic-based algorithm was used to solve the MOPF problem and the decision analysis was incorporated. However, the converter loss, which accounts for a significant fraction of the overall MTDC system loss, was excluded. Kim (2017) took both converter loss and post-contingency corrective actions into account and the non-dominated sorting genetic algorithm was used to identify MOPF solutions, but droop control mode was not considered. Li et al. (2018) proposed an approach that is applicable to droop control but the MTDC model used is limited to a point-to-point or three-terminal system which is not general enough. Also, the sequential power flow methods (Beerten et al., 2012; Beerten and Belmans, 2015) used in this study involve an additional DC slack bus or droop bus iteration (SBI/DBI) step, which increases the computational burden.
In this paper, a multi-objective optimization algorithm is proposed to minimize the total active power loss and generation cost of an MTDC system connected to AC grids. Further on, an improved power flow algorithm is then applied. The main contributions of this paper are summarized as follows:
1) For the optimization of a general MTDC grid linked to several isolated AC grids, different objectives are considered. The multiple objective particle swarm optimization (MOPSO) method is used to solve the MOPF problem and achieve a Pareto front, and various compromise solutions are selected using TOPSIS.
2) Different control modes for the MMCs are taken into consideration while using a general MTDC model. The only control variables used in the control strategy are the active voltage references and the droop coefficients of the MMCs under adaptive droop control mode.
3) An improved power flow algorithm is used to eliminate the SBI/DBI step and make the calculation of the power flow more efficient. By calculating the active power injection at the AC-grid point of common coupling (PCC) using the DC power flow data, the AC power flow iteration is eliminated from the overall iteration loop.
Steady state model of MMC-MTDC system
In this section, the characteristics and control strategy of the MMC stations that connect the AC and DC grids are discussed. Then, an analytical model of a general applicable MTDC system integrated with several isolated AC grids is established. The MOPF problem of this model is formulated and the equality and inequality constraints of the system are presented.
MTDC network modeling
MMC is able to control the active and reactive power injection
1) Constant
2) Constant
3) Droop control: The active power injected from the DC grid depends on the droop coefficient k and the deviation of actual voltage
The direction of power is considered to be positive when it is flowing to the AC grid. The active power injected from the DC grid
The droop coefficient
The reactive power injection can be controlled in two modes:
1) Constant
2) Constant
The overall converter loss
1) Constant loss, including the filter, transformer load, and no-load loss;
2) Active power loss depending on the converter current
3) Active power loss depending on the converter current
Thus, the overall converter loss can be expressed by a generalized function of converter current
where a represents the constant loss;
The MTDC network model used in this paper is similar to the AC grid model. The DC power flow is determined by the line resistances and voltage differences between DC nodes in a steady-state condition. The current injected at DC node i can be written as
where
Combining Eqs 4, 5, 1, a system of equations that can be solved by an iterative Newton-Raphson (NR) method is given by
It should be noted that Eq. 6 is also applicable for DC nodes that are not connected to AC grids or under outage state. For these nodes, both
Problem formulation
In this section, the total generation cost and active power loss of the system are taken as optimization objectives. The models of these targets are presented and the equality and inequality constraints of the system are given. The total generation cost is represented by the total cost of variable generators in the isolated AC grid connected to the MTDC network. The total active power loss is formulated as the sum of total DC transmission loss and converter loss.
Objective functions
The model used to formulate the total generation cost is
where
The overall active power loss of the MTDC system is given by
where
where
Constraints
The equality constraints of the system are given by
where
The inequality constraints of the system can be written as
where
where
Improved sequential AC-DC power flow algorithm
The conventional sequential AC-DC power flow methods for master-slave control and DC voltage droop control (Beerten et al., 2012; Beerten and Belmans, 2015) perform AC and DC power flows iteratively, adding a SBI/DBI step to calculate the power loss of the corresponding converter stations, which increases the computational burden. Since a large number of power flow solutions are required for the multi-objective particle swarm optimization approach used in this paper, it is necessary to reduce the time required for a single power flow calculation.
In this section, an improved power flow algorithm is proposed. Different sub-module (SM) types including half-bridge, full-bridge and mixed half- and full-bridge is considered. To eliminate SBI/DBI, a power loss formula for MMC stations with different SM types expressed by a function of DC current is developed. Using the DC power flow results, the active power injection
Derivation of analytical MMC loss formula
The active power at the AC side of the converter
where
where
A function of converter current
where
where a,
where
The calculated converter loss coefficients a,
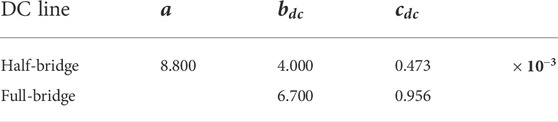
TABLE 1. Converter loss coefficients (in P.U.).
Improved power flow algorithm
In this section, an improved AC-DC power flow algorithm is proposed, as shown in Figure 1. The power loss formula derived in the previous section is used to calculate the converter loss of MMC stations to eliminate the SBI/DBI step. In this method the active power injected from AC grid to PCC can be calculated by the DC power flow results, thus excluding the AC power flow from the overall iteration loop and improving the efficiency of the algorithm.
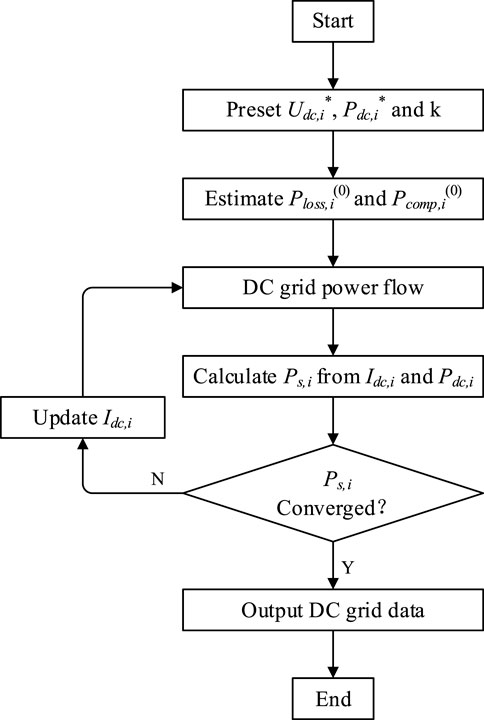
FIGURE 1. Flowchart of the improved AC-DC power flow algorithm.
The power references
After DC grid power flow calculated using Eq. 6,
Thus, the active power injected from AC grid to PCC can be calculated by
where
The convergence of the overall iteration is given by
where
Multi-objective optimization
The approach for MOPF is divided into two parts to provide the best compromise solution according to the preference of the decision-makers. First, the MOPSO algorithm is used, and the Pareto optimal solution set matching the requirements is obtained under the optimization mechanism of the algorithm. Different solutions are generated by changing the voltage references and droop coefficients of the MMCs under adaptive droop control. The multi-attribute decision-making process is then carried out based on the subjective preferences of the decision maker and the objective data of the Pareto optimal solution set. The best compromise solution is then reached by contrasting the decision-making steps using TOPSIS to identify the optimal operating point that matches the actual needs.
Multiple objective particle swarm optimization (MOPSO)
MOPSO is a multi-objective problem-solving technique that builds on PSO. In the MOPSO method, non-dominated solutions are saved to approximate the Pareto front and considered as an optimal solution set for decision-makers to select. The overall framework of the MOPSO algorithm is shown in Figure 2 and the main steps are listed as follows:
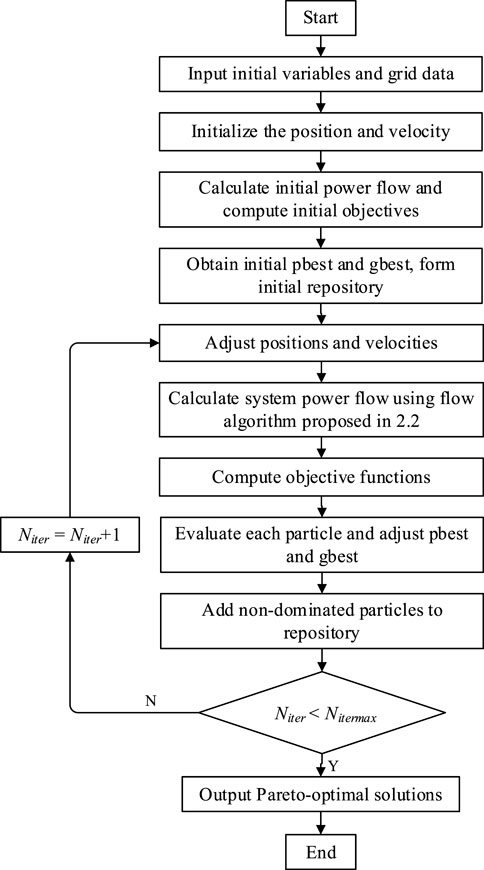
FIGURE 2. Flowchart of the MOPSO algorithm.
Step 1: Input the initial variables, including 1) MTDC system: line data, node data, PCC node number, initial steady state power flow; 2) MMC station: Submodule (SM) type, constant, linear, quadratic coefficients
Step 2: Initialize the position and velocity of particles.
Step 3: Calculate the power flow of the MTDC system using the method introduced in section 2.2, the value of the objective function for each particle can be found according to the power flow solution.
Step 4: Evaluate each particle and determine the initial personal optimal position pbest and global optimal position gbest. Create an external repository to keep non-dominated solutions.
Step 5: Adjust the velocities and positions of all particles to change the voltage references and droop coefficients of the MMCs under adaptive droop control.
Step 6: Calculate the power flow of the MTDC system using the method introduced in section 2.2 and compute the objective functions using the power flow results.
Step 7: Evaluate the calculated objective functions according to the updated value. Update pbest, gbest and the external repository containing non-dominated solutions.
Step 8: Check if the end condition is met. If Niter < Nitermax, increase the iteration number Niter and back to step 5.
Step 9: Output the obtained Pareto-optimal solutions.
Step 10: End MOPSO
Optimal decision based on Pareto frontiers
In an actual power system, many factors, such as the economy and power quality, should be taken into consideration, leading to varied preferences for different compromise solutions on the Pareto Frontier curve among decision-makers. As a result, a reasonable strategy is required to choose one or more superior options for decision-makers.
The Technique for Order of Preference by Similarity to Ideal Solution (TOPSIS) is a multi-criteria decision analysis method established by Ching-Lai Hwang and Yoon in 1981. It is a method for ranking solutions based on how close the solutions are to an idealized target by weighing the relative merits of the available solutions. The evaluation solution is optimal if it has the shortest geometric distance from the positive ideal solution (PIS) and the longest geometric distance from the negative ideal solution (NIS); and vice versa. The procedure of TOPSIS is given as follows:
1) Create an evaluation matrix
2) Normalize the evaluation matrix
3) Create the weight matrix
4) Determine the best solution
5) For each solution, calculate the Euclidean distance
6) Calculate the similarity according to
7) Rank the alternatives according to their similarity
The larger
Case studies
In this section, a six-terminal MTDC system integrated with isolated AC grids through MMC stations is used as the test system and the parameters of the system are presented. The MOPSO method is used to approximate the Pareto front and the decision-making process is carried out using TOPSIS. Compromise solutions for various preferences and extreme solutions are calculated and compared with the solution before optimization to verify the effectiveness of the proposed approach.
System structure
As shown in Figure 3, the MTDC system is a meshed DC grid with six DC buses and seven branches. DC nodes 1, 2, 4, 5, and 6 are connected to five isolated AC grids through five MMC stations, while the DC node 3 does not have a converter station connected to the AC grid. MMC-1, 2 and 5 are in droop control mode and connected to AC area 1,2 and 5 respectively, while MMC-3 and 4 are in constant P control mode with their droop coefficients to be zero. The parameters of the above network in per unit value are shown in Table 2 and Table 3. The MMCs connected to DC node 1 and node 2 are based on FBSMs, while other MMCs are based on HBSMs. The base capacity
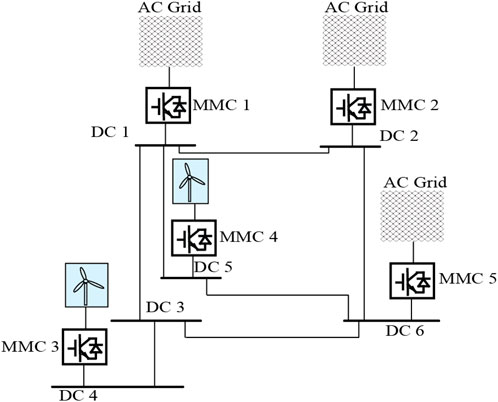
FIGURE 3. Six-terminal MTDC system.
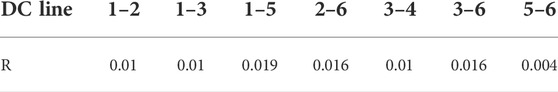
TABLE 2. DC transmission line branch data (in P.U.).
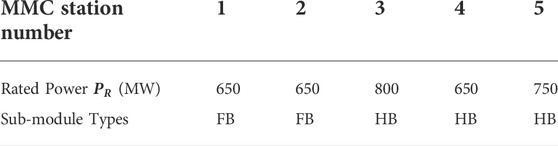
TABLE 3. MMC parameters.
It is assumed that each of area 1, 2, and 5 has four adjustable generators that supply power to the corresponding MMC stations. In the same AC system, each generator has a different cost curve which was regarded as a quadratic function, as shown in Table 4.
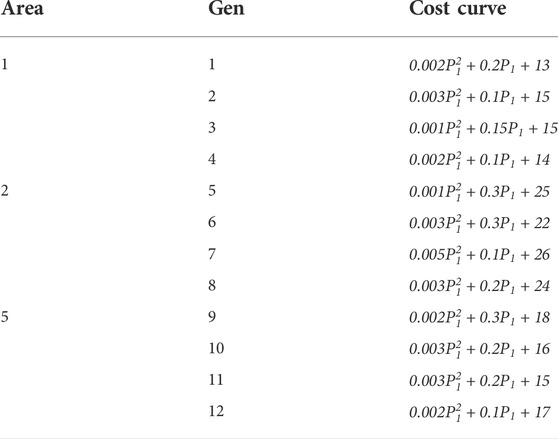
TABLE 4. Generator cost curves.
Parameter setting
The controlled active and reactive powers under master-slave control given in Table 5 are used to give an initial steady-state condition for the test system. The droop coefficients for MMC 1,2 and 5 are initially set to be 25, 50 and 12.5 respectively. The calculated steady-state grid power flow for the given condition is shown in Table 6. In the corresponding DC terminals, the values in Table 6 were used as initial power and voltage references, as shown in Table 7. These values are applied to the test system and used to calculate the objective functions before optimization.

TABLE 5. Desired DC grid power flow pattern (in P.U.).
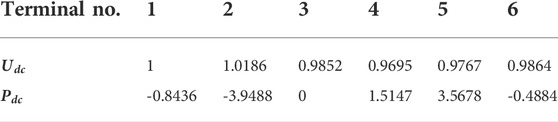
TABLE 6. Numerical solution from power flow analysis (in P.U.).

TABLE 7. MMC parameters (in P.U.).
Multi-objective optimization
It is assumed that the load (except PCC node injections) of area-1,2 and 5 supported by the changeable generators are 1 p.u., 2 p.u. and 2 p.u. respectively. Before optimization, the overall active power loss of the MTDC network is 32.2034 MW and the total generation cost of the system variable generator units is 440.3697 USD/h.
By changing the voltage reference and droop coefficient of the MMC station under droop control mode, the active power injection at the PCC nodes can be modified. As a result, the output of each generator in these areas and total active power loss of the test system are different from the value before modification, thus changing the total generation cost and active power loss of the test system.
The droop coefficients are set between 12.5 and 100 for MMC stations in droop control mode, and the voltage references of the related DC nodes are set between 0.95 and 1.05. The Population size, repository size, and maximum iteration number are set to 100, 200, and 200 respectively. After optimization using MOPSO according to the proposed approach, the distribution of Pareto-optimal solutions is given in Figure 4.
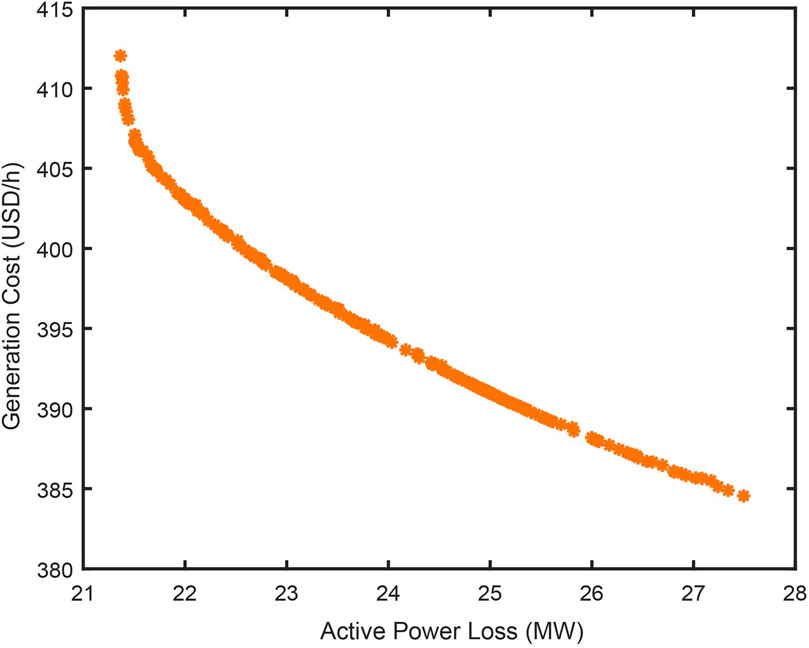
FIGURE 4. Distribution of Pareto optimal sets.
As shown in Fig. 4, 200 non-dominated solutions are obtained at the end of the iteration. Table 8 lists the two extreme Pareto optimum alternatives as well as the initial solution before optimization. Extreme solutions 1 and 2 are the extreme solutions for the least generation cost and the minimal active power loss objectives, respectively. It can be seen from Table 8 and Figure 4 that:
1) The two objectives in this paper conflict with each other and cannot be optimized at the same time. In other words, the decrease of the total generation cost would lead to a higher total active power loss while lowering total active power loss will result in more generation cost.
2) Compared to extreme solution 1, extreme solution 2 has fewer power loss and higher generation cost, whereas both objectives of extreme solution 1 and extreme solution 2 have reduced total active power loss and generation cost when compared to the solution before optimization.
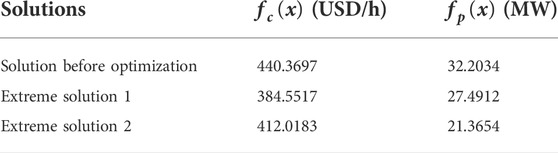
TABLE 8. Comparison of extreme solutions and the solution before optimization.
Optimal decision based on Pareto frontiers
Table 9 shows the obtained compromise solutions for various settings for the weight of each objective. The weight for objective
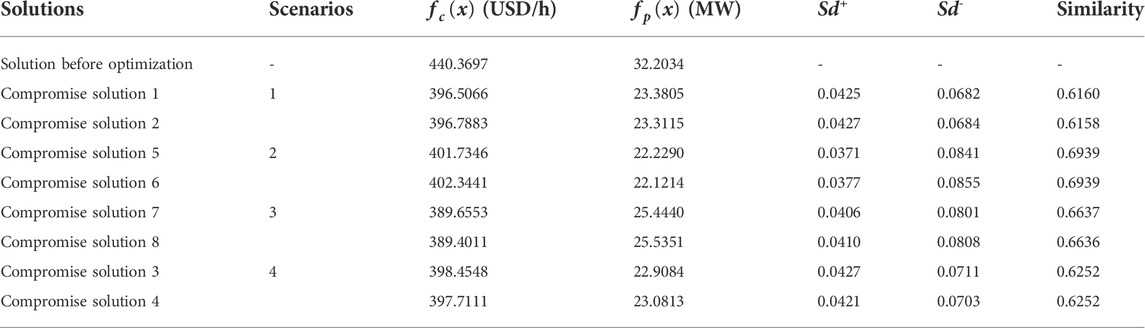
TABLE 9. Comparison of compromise solutions and the solution before optimization.
Conclusion
In this paper, a multi-objective OPF algorithm is proposed to reduce the total active power loss and generation costs of an MTDC grid connected to several isolated AC grids. A six-terminal MTDC system with five nodes connected to MMCs under different control modes is constructed. An improved sequential power flow was applied to eliminate the SBI/DBI step and the AC power flow iteration. By using MOPSO, the voltage references and droop coefficients of the MMCs under adaptive droop control are changed to generate different power flow patterns and a set of non-dominated Pareto-optimal solutions is obtained. The two optimal targets can be realized together with compromise by incorporating TOPSIS as a decision maker and the “best” solutions found under severe and varied compromise settings are discussed after the simulation of the constructed MTDC grid. The case study results show that all solutions found under different situations after optimization are superior to those found initially. The proposed approach applies to a generalized MMC MTDC model that interconnects arbitrary buses in one or more AC grids and has arbitrary topology. The limitation of the proposed method is that the grid parameters for the AC network connected to the MTDC grid are not considered. Also, the stability of the system under the optimized solution is not investigated.
Data availability statement
The raw data supporting the conclusion of this article will be made available by the authors, without undue reservation.
Author contributions
WQ and YZ contributed to the conception and design of the algorithm and case study. SC and QH wrote the first draft of the manuscript. YL and HL contributed to manuscript revision and proofread and approved the submitted version.
Funding
This research is supported by the National Natural Science Foundation of China (51907026), Natural Science Foundation of Jiangsu Province, China (BK20190361), Key Research and Development Program of Jiangsu Province, China (BE2020081-2).
Conflict of interest
The authors declare that the research was conducted in the absence of any commercial or financial relationships that could be construed as a potential conflict of interest.
Publisher’s note
All claims expressed in this article are solely those of the authors and do not necessarily represent those of their affiliated organizations, or those of the publisher, the editors and the reviewers. Any product that may be evaluated in this article, or claim that may be made by its manufacturer, is not guaranteed or endorsed by the publisher.
References
Baradar, M., Hesamzadeh, M. R., and Ghandhari, M. (2013). Second-order cone programming for optimal power flow in VSC-type AC-DC grids. IEEE Trans. Power Syst. 28 (4), 4282–4291. doi:10.1109/tpwrs.2013.2271871
Beerten, J., and Belmans, R. (2015). MatACDC-an open source software tool for steady-state analysis and operation of HVDC grids.
Beerten, J., Cole, S., and Belmans, R. (2012). Generalized steady-state VSC MTDC model for sequential AC/DC power flow algorithms. IEEE Trans. Power Syst. 27 (2), 821–829. doi:10.1109/tpwrs.2011.2177867
Beiter, P., Musial, W., Kilcher, L., Maness, M., and Smith, A. (2017). An assessment of the economic potential of offshore wind in the United States from 2015 to 2030. Golden, CO (United States): National Renewable Energy Lab.
Cao, J., Du, W., Wang, H. F., and Bu, S. (2013). Minimization of transmission loss in meshed AC/DC grids with VSC-MTDC networks. IEEE Trans. Power Syst. 28 (3), 3047–3055. doi:10.1109/tpwrs.2013.2241086
Chaudhuri, N. R., Majumder, R., and Chaudhuri, B. (2012). System frequency support through multi-terminal DC (MTDC) grids. IEEE Trans. Power Syst. 28 (1), 347–356. doi:10.1109/tpwrs.2012.2196805
Chen, X., Wang, L., Sun, H., and Chen, Y. (2017). Fuzzy logic based adaptive droop control in multiterminal HVDC for wind power integration. IEEE Trans. Energy Convers. 32 (3), 1200–1208. doi:10.1109/tec.2017.2697967
Chen, T., Pipattanasomporn, M., Rahman, I., Jing, Z., and Rahman, S. (2020). Matplan: A probability-based planning tool for cost-effective grid integration of renewable energy. Renew. Energy 156, 1089–1099. doi:10.1016/j.renene.2020.04.145
Damala, R. B., Patnaik, R. K., and Dash, A. R. (2022). A simple decision tree-based disturbance monitoring system for VSC-based HVDC transmission link integrating a DFIG wind farm. Prot. Control Mod. Power Syst. 7 (1), 25–19. doi:10.1186/s41601-022-00247-w
Debnath, S., Qin, J., Bahrani, B., Saeedifard, M., and Barbosa, P. (2014). Operation, control, and applications of the modular multilevel converter: A review. IEEE Trans. Power Electron. 30 (1), 37–53. doi:10.1109/tpel.2014.2309937
Dong, W., and Li, S. (2021). Reliability sensitivity of wind power system considering correlation of forecast errors based on multivariate NSTPNT method. Prot. Control Mod. Power Syst. 6 (1), 10–11. doi:10.1186/s41601-021-00192-0
Ghasemi, M., Ghavidel, S., Ghanbarian, M. M., Gharibzadeh, M., and Vahed, A. A. (2014). Multi-objective optimal power flow considering the cost, emission, voltage deviation and power losses using multi-objective modified imperialist competitive algorithm. Energy 78, 276–289. doi:10.1016/j.energy.2014.10.007
Hu, Q., Han, R., Quan, X., Wu, Z., Tang, C., Li, W., et al. (2022a). Grid-forming inverter enabled virtual power plants with inertia support capability. IEEE Trans. Smart Grid 13, 4134–4143. doi:10.1109/tsg.2022.3141414
Hu, Q., Liang, Y., Ding, H., Quan, X., Wang, Q., and Bai, L. (2022b). Topological partition based multi-energy flow calculation method for complex integrated energy systems. Energy 244, 123152. doi:10.1016/j.energy.2022.123152
Kalair, A., Abas, N., and Khan, N. (2016). Comparative study of HVAC and HVDC transmission systems. Renew. Sustain. Energy Rev. 59, 1653–1675. doi:10.1016/j.rser.2015.12.288
Khazaei, J., Miao, Z., Piyasinghe, L., and Fan, L. (2015). Minimizing DC system loss in multi-terminal HVDC systems through adaptive droop control. Electr. Power Syst. Res. 126, 78–86. doi:10.1016/j.epsr.2015.04.020
Kim, M. (2017). Multi-objective optimization operation with corrective control actions for meshed AC/DC grids including multi-terminal VSC-HVDC. Int. J. Electr. Power & Energy Syst. 93, 178–193. doi:10.1016/j.ijepes.2017.05.028
Lei, J., An, T., Du, Z., and Yuan, Z. (2016). A general unified AC/DC power flow algorithm with MTDC. IEEE Trans. Power Syst. 32 (4), 2837–2846. doi:10.1109/tpwrs.2016.2628083
Li, X., Yuan, Z., Fu, J., Wang, Y., Liu, T., and Zhu, Z. (2014). “Nanao multi-terminal VSC-HVDC project for integrating large-scale wind generation,” in Proceeding of the 2014 IEEE PES General Meeting| Conference & Exposition, National Harbor, MD, USA, July 2014 (IEEE), 1–5.
Li, Y., Li, Y., Li, G., Zhao, D., and Chen, C. (2018). Two-stage multi-objective OPF for AC/DC grids with VSC-HVDC: Incorporating decisions analysis into optimization process. Energy 147, 286–296. doi:10.1016/j.energy.2018.01.036
Liang, J., Jing, T., Gomis-Bellmunt, O., Ekanayake, J., and Jenkins, N. (2011). Operation and control of multiterminal HVDC transmission for offshore wind farms. IEEE Trans. Power Deliv. 26 (4), 2596–2604. doi:10.1109/tpwrd.2011.2152864
Ma, Z., Chen, H., and Chai, Y. (2017). Analysis of voltage stability uncertainty using stochastic response surface method related to wind farm correlation. Prot. Control Mod. Power Syst. 2 (1), 20–29. doi:10.1186/s41601-017-0051-3
Meah, K., and Ula, S. (2007). “Comparative evaluation of HVDC and HVAC transmission systems,” in Proceeding of the 2007 IEEE Power Engineering Society General Meeting, Tampa, FL, USA, June 2007 (IEEE), 1–5.
Muniappan, M. (2021). A comprehensive review of DC fault protection methods in HVDC transmission systems. Prot. Control Mod. Power Syst. 6 (1), 1–20. doi:10.1186/s41601-020-00173-9
Nasirian, V., Davoudi, A., Lewis, F. L., and Guerrero, J. M. (2014). Distributed adaptive droop control for DC distribution systems. IEEE Trans. Energy Convers. 29 (4), 944–956. doi:10.1109/tec.2014.2350458
Rodrigues, S., Pinto, R. T., Bauer, P., and Pierik, J. (2012). “Optimization of social welfare and transmission losses in offshore MTDC networks through multi-objective genetic algorithm,” in Proceedings of The 7th International Power Electronics and Motion Control Conference, Harbin, China, June 2012 (IEEE), 1287–1294.
Rouzbehi, K., Miranian, A., Luna, A., and Rodriguez, P. (2014). DC voltage control and power sharing in multiterminal DC grids based on optimal DC power flow and voltage-droop strategy. IEEE J. Emerg. Sel. Top. Power Electron. 2 (4), 1171–1180. doi:10.1109/jestpe.2014.2338738
Saad, H., Dennetière, S., Mahseredjian, J., Delarue, P., Guillaud, X., Peralta, J., et al. (2013). Modular multilevel converter models for electromagnetic transients. IEEE Trans. Power Deliv. 29 (3), 1481–1489. doi:10.1109/tpwrd.2013.2285633
Saad, H., Jacobs, K., Lin, W., and Jovcic, D. (2016). “Modelling of MMC including half-bridge and full-bridge submodules for EMT study,” in Proceedings of The 2016 Power Systems Computation Conference, Genoa, Italy, June 2016 (IEEE), 1–7.
Song, S., McCann, R. A., and Jang, G. (2020). Cost-based adaptive droop control strategy for VSC-MTDC system. IEEE Trans. Power Syst. 36 (1), 659–669. doi:10.1109/tpwrs.2020.3003589
Wei, C., Han, M., and Yan, W. (2011). “Voltage fluctuation and flicker assessment of a weak system integrated wind farm,” in Proceedings of The IEEE Power and Energy Society General Meeting, Detroit, MI, USA, July 2011 (IEEE), 1–5.
Xiao, D., Chen, H., Wei, C., and Bai, X. (2021). Statistical measure for risk-seeking stochastic wind power offering strategies in electricity markets. J. Mod. Power Syst. Clean Energy. doi:10.35833/MPCE.2021.000218
Yang, B., Liu, B., Zhou, H., Wang, J., Yao, W., Wu, S., et al. (2022). A critical survey of technologies of large offshore wind farm integration: Summary, advances, and perspectives. Prot. Control Mod. Power Syst. 7 (1), 17–32. doi:10.1186/s41601-022-00239-w
Yao, L., Xu, L., Bazargan, M., and Macleod, N. (2008). Large offshore wind farm grid integration-challenges and solutions. Cigre 9. International Council on Large Electric Systems.
Keywords: adaptive droop control, multi-objective optimal power flow, MOPSO, modular multilevel converters (MMCs), MTDC, sequential power flow, TOPSIS
Citation: Qian W, Cao S, Zhang Y, Hu Q, Li H and Li Y (2022) Multiple objective optimization based on particle swarm algorithm for MMC-MTDC system. Front. Energy Res. 10:1030259. doi: 10.3389/fenrg.2022.1030259
Received: 28 August 2022; Accepted: 09 September 2022;
Published: 29 September 2022.
Edited by:
Dongliang Xiao, South China University of Technology, ChinaReviewed by:
Zao Tang, Hangzhou Dianzi University, ChinaQiujie Wang, China Three Gorges University, China
Copyright © 2022 Qian, Cao, Zhang, Hu, Li and Li. This is an open-access article distributed under the terms of the Creative Commons Attribution License (CC BY). The use, distribution or reproduction in other forums is permitted, provided the original author(s) and the copyright owner(s) are credited and that the original publication in this journal is cited, in accordance with accepted academic practice. No use, distribution or reproduction is permitted which does not comply with these terms.
*Correspondence: Yuanshi Zhang, eXVhbnNoaXpoYW5nQHNldS5lZHUuY24=