 Feifei Cui
 Xixiang Lin1
- 1School of Automation Science and Engineering, Xi’an Jiaotong University, Xi’an, Shaanxi, China
- 2School of Artificial Intelligence, Nanjing Agricultural University, Nanjing, China
With the green-oriented transition of energy, electric vehicles (EVs) are being developed rapidly to replace fuel vehicles. In the face of large-scale EV access to the grid, real-time and effective charging management has become a key problem. Considering the charging characteristics of different EVs, we propose a real-time scheduling framework for charging stations with an electric vehicle aggregator (EVA) as the decision-making body. However, with multiple optimization objectives, it is challenging to formulate a real-time strategy to ensure each participant’s interests. Moreover, the uncertainty of renewable energy generation and user demand makes it difficult to establish the optimization model. In this paper, we model charging scheduling as a Markov decision process (MDP) based on deep reinforcement learning (DRL) to avoid the afore-mentioned problems. With a continuous action space, the MDP model is solved by the twin delayed deep deterministic policy gradient algorithm (TD3). While ensuring the maximum benefit of the EVA, we also ensure minimal fluctuation in the microgrid exchange power. To verify the effectiveness of the proposed method, we set up two comparative experiments, using the disorder charging method and deep deterministic policy gradient (DDPG) method, respectively. The results show that the strategy obtained by TD3 is optimal, which can reduce power purchase cost by 10.9% and reduce power fluctuations by 69.4%.
1 Introduction
In recent years, the global energy structure (Tian et al., 2018; Peng et al., 2021) is transforming into clean energy (Fu et al., 2018; Rajendran et al., 2022), which provides an incentive for the development of EVs. According to research, the exhaust gas emitted by fuel vehicles is one of the main causes of global warming (Purushotham Reddy et al., 2021). Against the background of carbon neutrality (Duan, 2021), some countries have introduced relevant policies promoting EVs (Yang et al., 2020) to replace traditional fuel vehicles. A smart grid is a new type of modern grid that is stable, efficient, and economical. However, with the large-scale charging demand of EVs, the smart grid faces many challenges (Choi et al., 2017; Brenna et al., 2018), such as increasing exchange power fluctuations and degrading power quality. Therefore, the stable access of EVs to the smart grid is a key issue that must be solved.
EVs have the advantages of flexibility and adjustability due to the power battery. Taking advantage of these features, people can control the charging or discharging of EVs to realize grid stability. At present, various optimization approaches have been proposed to manage the charge or discharge of EVs, that is, convex-optimum methods, programming-based methods (Hu et al., 2013; Ordoudis et al., 2019), and heuristic-based methods (Megantoro et al., 2017; Li et al., 2019). Shi et al. (2017) optimized the day-ahead scheduling of EVs by Lyapunov optimization, which can realize real-time management but relies on precise objective functions. Based on mixed integer programming, Koufakis et al. (2020) minimized EV charging costs and load fluctuations, which also relies on accurate predictions of environmental information. Combining genetic algorithms and dynamic programming algorithms, Ravey et al. (2012) formulated energy management strategies for EVs, but the method shows poor robustness. Therefore, the uncertainty of renewable energy generation and user demand makes it difficult to establish the optimization model based on traditional methods.
There are two ways to deal with the uncertainty in charge and discharge management of EVs. One is to predict uncertain values before optimization through physical models or probability distributions (Kabir et al., 2020). However, this method is only suitable for scenarios with low accuracy requirements, such as day-ahead prediction. Another solution benefits from the development of DRL (Franaois-Lavet et al., 2018). DRL includes two types of methods, model-based and model-free. Model-free DRL (Wan et al., 2019) has attracted great attention in this field due to the following two advantages: 1) neural network as a function approximator (Zhang et al., 2021) can extract more data features based on data history. The data features are input into the policy network to learn the optimal policy. This process does not rely on the predicted values. 2) This method makes decisions according to the current state, so it is suitable for real-time decision scenarios with high precision requirements.
Based on DRL, Chis et al. (2017) and Li et al. (2022) combined neural networks and DRL, which effectively reduced the charging cost. Zhao and Lee (2022) and Su et al. (2020) proposed a dynamic pricing mechanism based on DRL to minimize charging costs. Abdalrahman and Zhuang (2022) improved user satisfaction by maximizing the quality of the charging service. Qian et al. (2022) proposed a pricing mechanism based on multi-agent reinforcement learning and reduced the cost of charging stations. However, the afore-mentioned works in the literature only consider the benefits of the demand side while ignoring the benefits of the supply side. In the electricity market, EVA (Okur et al., 2020; Kong et al., 2021) plays an important role in integrating demand, participating in bidding, and purchasing resources. Qiu et al. (2020) and Tao et al. (2022) studied the efficient pricing problem from the perspective of EVA. Considering the operation cost of microgrids and the purchasing cost of EVs, Zhaoxia et al. (2019) reduced overall costs through day-ahead optimized scheduling. Kandpal and Verma (2021) and Mahmud et al. (2019) considered the microgrid benefits by minimizing grid peaks, but they still used inefficient traditional methods. As an important part of the electricity market, the role of EVA participating in electricity ancillary services (Yang et al., 2017; Yuan et al., 2021) is neglected. Meanwhile, there are few works in the literature (Wang and Cui, 2020; Zhou et al., 2021) that consider the behavioral characteristics of different cars such as taxis, buses, and private cars. Most of them are about path planning or pricing issues.
To sum up, at present, EV charging scheduling based on DRL is used and the following problems still exist: 1) As one of the most effective mechanisms to integrate the market, the benefits and the electric ancillary service functions of EVA are neglected. 2) When applying DRL, it is difficult to learn a strategy that can balance multiple optimization objectives. 3) In the charging model, the characteristics of different types of EVs are not taken into account. Aiming to fill the research gaps, this paper proposes a real-time charging scheduling framework with EVA as the decision-making body. We build a scheduling model with continuous action space, which is solved based on TD3. Our optimization objectives are set to minimize the cost of EVA and minimize the fluctuations of microgrids. The main contributions of this paper are as follows:
• A real-time charging scheduling framework with EVA as a decision-making body is proposed. Considering multiple optimization objectives, the EVA cost and the microgrid exchange power fluctuations are minimized.
• Considering the charging characteristics of taxis and private cars, the charging scheduling process is established as an MDP model. EVA is an agent that interacts with the environment to maximize accumulated rewards.
• The MDP model is solved by TD3. Compared with the disorder charging method and DDPG, the TD3 achieves lower EVA costs and lower microgrid fluctuations.
The remainder of this paper is organized as follows. In Section 2, we introduce the system model, constraints, and optimization objectives in detail. In Section 3, we introduce the main elements of the design of the MDP model. In Section 4, we briefly introduce the TD3 method. In Section 5, we perform groups of experiments and analyze the results. Finally, in Section 6, we conclude this paper.
2 System model
2.1 System framework
In this paper, the framework of charging station scheduling is shown in Figure 1. First, the power supplier microgrid is composed of DER, an energy storage system (ESS), a micro-power dispatching center (MDC), and a load. Microgrid stability is affected by output power PDER and load power PL. DER is a electricity-generating unit, and its excess energy is stored or sent to the main grid. We assume that PDER includes two types of output sources, photovoltaic power and wind force. EVA mainly sends charging strategy π to the charging station according to the physical information and economic information. The physical information includes the microgrid exchange power and the state of charge (SOC) of the charging stations. Economic information is determined by the market side, including resource buyers and market operators. The market operator acts as a middleman, matching tenders and resource buyers. On the market side, EVA minimizes the purchase cost of resources. On the grid side, EVA minimizes power fluctuations.
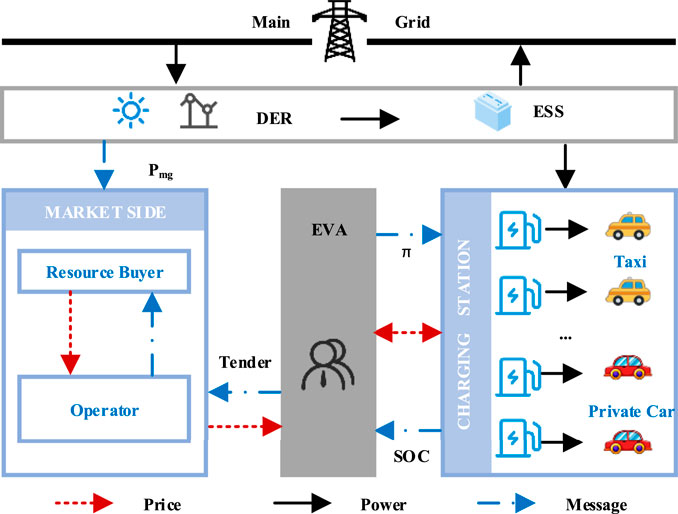
FIGURE 1. Scheduling framework of the EV charging station in a microgrid.
When the EVs arrive at the station, EVA will obtain their maximum charging power and charging demand. According to the day-ahead exchange power Pmg and the electricity price from the market side, EVA formulates the charging strategy π. According to the strategy, DER supplies energy for EVs in charging stations. Meanwhile, the charging station feeds back the SOC to EVA, which provides a reference for its decision-making.
2.2 Constraint model
This paper considers two types of vehicles, taxis and private cars. We divided the 24-h scheduling time into T time steps, that is, t = {1, 2, ⋯T}. One time step is denoted as τ.
At time t, the number of taxis and private cars is Xt and Yt, respectively. When updating the number of cars at the next moment, we need to remove the cars that meet the charging expectations and add new cars. We assumed that the number of newly added taxis and private cars at each moment is Mt and Nt, and the proportion with fast-charging demand is σ1 and σ2. In the scheduling process, the charging or discharging power is limited to the following two conditions.
2.2.1 Power limitations of charging station
where
where the first term represents the maximum or minimum power of the charging station during time τ. The second term represents the remaining available capacity of the battery.
2.2.2 State of charge limitations of electric vehicles
where δ is the allowable difference factor between the SOC expected value
At time t, the maximum power of the charging station is
where
where Pf and Ps are a fast power and slow power of the charging station, which are fixed values.
For the total power Pt allocated to the charging station, the power distributed to each fast-charging and slow-charging vehicle is
The SOC update satisfies the following equation:
Note that for each time step, we need to remove the cars that have reached the expected values and add the new cars. Therefore, the total value of SOC at the next moment can be expressed as
where the first item is the sum of the updated SOC of all vehicles at time t. The second term is the sum of the SOC of newly added Mt+1 + Nt+1 vehicles at time t + 1. The third term is the sum of the SOC that reaches the expected values at time t.
2.3 Optimization objective
According to the system model in Section 2.1, we set two optimization objectives, namely, maximizing the benefits of EVA and minimizing power fluctuations.
Assuming that the service cost of EVA is a fixed value, reducing the power purchase cost can maximize EVA’s profit. The first optimization objective can be set as follows:
where λt is the time-of-use electricity price at time t. Pt is limited by Eq. 1.
We define FP as the exchange power fluctuation of the microgrid. The second optimization objective can be set as follows:
where PMG,t is the microgrid real-time power including EVs at time t.
where PEV,t, PL,t, and PDER,t are the real-time values of EVs, other loads, and DER, respectively.
3 Model design of Markov decision process
3.1 Markov decision process
For reinforcement learning (RL), the agent and environment are two main interacting objects, as shown in Figure 2. The agent perceives the state and reward from the environment to learn and make decisions, while the environment updates the state and reward at the next moment based on the current action from the agent. The purpose of this process is to learn a strategy that satisfies the optimization objectives through continuous interactions.
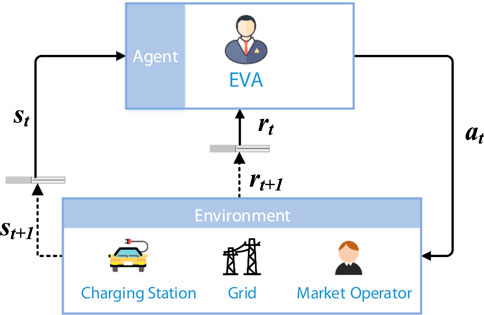
FIGURE 2. RL structure for charging scheduling.
The learning process of RL is usually described by MDP. We set the EVA as an agent and information such as price and power as the environment. At time t, the agent interacts with the environment to give a policy π and implement action at within the action range. The environment reacts to at and updates the state st+1. The state transition function P determines the update from st to st+1. The environment feedbacks to the agent a reward
3.2 Model design
State space S is the set of state values. S is a description of the current situation and should not contain redundant information. Therefore, in this paper, st ∈ S contains four variables, time-of-use electricity price, the sum of charging station SOC, the output power of DER, and the power of other loads, denoted as
Action space A is the set of action values. We set the total charging or discharging power of the charging station as the action. Limited by the maximum and minimum charging power, at can be expressed as
where
State transition function P is the rule for state update, denoted as
In Eq. 18, it can be seen that st+1 is determined by the action and state st. The probability of taking action at in state st is denoted as p (st+1|st, at).
Reward function
At time t, in order to minimize the exchange power fluctuations of the microgrid, the reward function can be designed as
At time t, in order to encourage the agent to charge and satisfy the needs of users, the reward function can be designed as
where
In order to balance these three rewards, the total reward function can be expressed as
where β1, β2, and β3 are the balance coefficients of three rewards, respectively.
4 Proposed approach
TD3 is a type of deterministic strategy gradient algorithm, which is a relatively advanced method. In Section 3, the action is continuously adjustable. Therefore, it is necessary to select a type of RL method with continuous action space. Compared with traditional RL methods, such as Q-learning, TD3 can handle decision problems with continuous action space and continuous state space. The training process has fast convergence speed and good stability. The following is the principle and training process of TD3.
4.1 TD3 algorithm
TD3 is an optimization method of DDPG, which is based on the actor-critic framework. Methods based on the actor-critic framework consist of critic networks and actor networks. The purpose of the actor networks is to establish a relational mapping of st and at, while the purpose of the critic networks is to evaluate this mapping relationship and output the value function Q. Its mapping relationship can be described as
DDPG uses the experience replay of Deep Q-learning (Gao and Jin, 2022), and adds two target networks, namely, the target-actor network and the target-critic network. The loss function L of the critic network is defined as
where θQ is the critic network parameter. M is the number of learning samples selected from the experience replay buffer.
where γ is the discount factor. μ′ and θμ′ represent the target-actor network and its parameter, respectively. Q′ and θQ′ represent the target-critic network and its parameter, respectively.
The current state is mapped to action by the function μ(st, θμ). The actor-network parameter is updated through the gradient back-propagation algorithm. Its loss gradient is
where ∇ is the gradient. μ and θμ are the output value and parameters of the actor-network.
The target network parameters θQ′ and θμ′ can be updated by smoothing exponentials
where τ is the update factor.
When updating the Q value of the critic network, it can be expressed as
However, if the value function is estimated by maximum, the DDPG method will overestimate, which causes slow convergence and a suboptimal solution. In order to overcome these shortcomings, TD3 has been improved in the following three aspects.
First, in order to overcome the over-estimation problem, TD3 establishes two independent critic networks and two target-critic networks. The target network Q value is updated by the minimum Q value, as follows:
where
The loss function can be improved as
where Qk and
Second, if we update the actor-network μ and critic networks Qk in each loop, the training process will be unstable. Fixing μ and only training the Q-function can converge faster and get better results. Therefore, TD3 adds the concept of actor-network training frequency, which is less than the update frequency of the critic network. That is also the meaning of “delay.”
Finally, to avoid overfitting, TD3 adds a target-actor smoothing step. The action output by the actor-network is improved as
where ɛ is the noise obeying the truncated normal distribution. σ is the variance, and d is the truncated amplitude.
4.2 Training process
Based on TD3, the training framework for optimal scheduling of charging stations is shown in Figure 3. The detailed training steps of the agent are as follows.
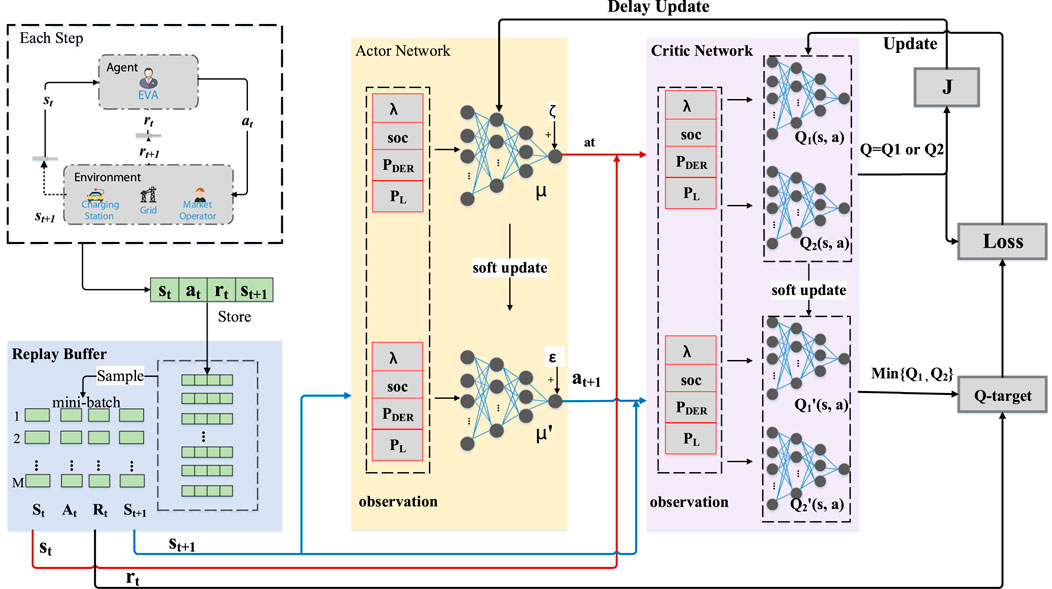
FIGURE 3. Training framework of TD3.
First, as shown by the red line in Figure 3, the agent interacts with the environment to get st and uses the actor-network to get μ(st, θμ). To increase the exploratory effect, we add random noise to the action, which is
Then, as shown by the blue line in Figure 3, the target networks get target action by Eq. 32. Through the critic networks, value functions Q1 (st, at) and Q2 (st, at) are calculated. Through the target-critic networks, the target value functions
Finally, as shown by three gray squares on the right in Figure 3, the critic network parameters
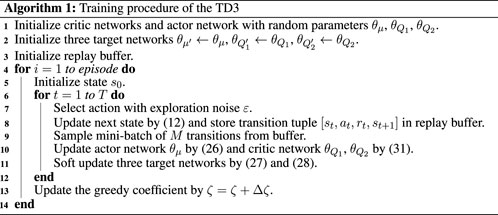
Algorithm 1 outlines the process of learning the optimal policy based on TD3.
Algorithm 1. Training procedure of the TD3.
5 Experiment
5.1 Experimental settings
In this paper, we simulate charging station scheduling in a complex park during a working day. This type of park includes offices, residences, and commercial shops. The microgrid contains wind force, photovoltaic outputs, charging stations, and other household loads. The detailed parameter settings are as follows.
5.1.1 Environmental parameters
We consider two types of vehicles, taxis and private cars. Figure 4 shows the number distributions of taxis and private cars. Taxis usually use a two-shift system, with shifts at 6:00 and 18:00, respectively. Therefore, we assumed that the taxi charging peak occurs at 1:00 and 15:00. The private car charging peaks are affected by two groups of people, employees and residents. Therefore, it is assumed that the charging peaks occur at 10:00 and 21:00, respectively. The fast-charging ratios of taxis and private cars are set to σ1 = 0.7 and σ2 = 0.1, respectively. The initial SOC distributions of taxis and private cars are N(0.35, 1) and N(0.45, 1), respectively, and the expected SOC distributions are N(0.95, 1) and N(0.90, 1), respectively.
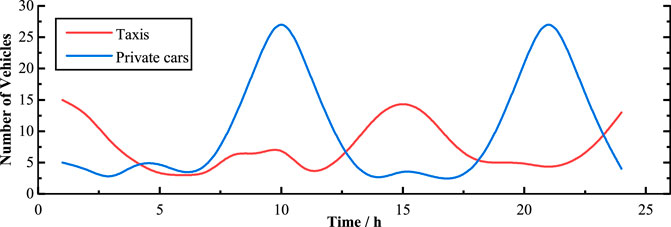
FIGURE 4. Number distributions of taxis and private cars.
The charging station power is divided into four gears: −30, −7, +7, and +30 kw. When each vehicle leaves the charging pile, the deviation of SOC from the expected value is less than the tolerance factor δ = 0.05. The time step is set to τ = 1h and the time-of-use electricity price is listed in Table 1.
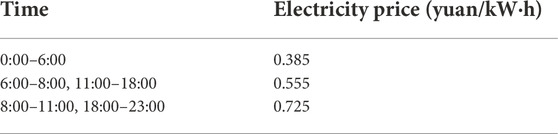
TABLE 1. Time-of-use electricity price.
Figure 5 shows the day-ahead power curves that are output forecast curves (Figure 5A) and household load forecast curves (Figure 5B). Assuming that this working day is an ordinary sunny day, the photovoltaic output power reaches the peak about at 12:00, and the wind-force output power fluctuates randomly. According to Eq. 16, we can obtain the forecast curve of microgrid exchange power (Figure 5C), which shows that there are evident peaks and valleys in some periods. To rule out the possibility that the method depends on the distribution, we set the uncertain power to be ±10% of the forecast power.
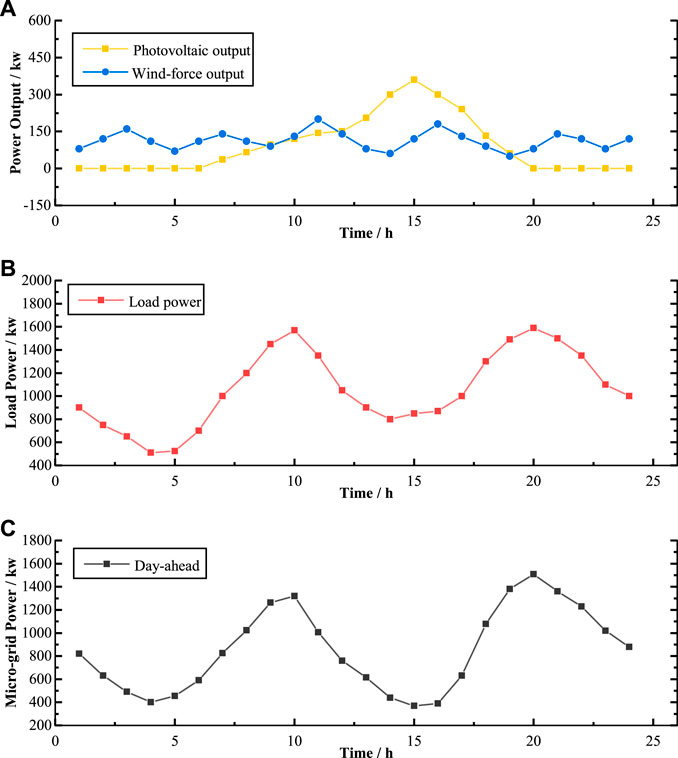
FIGURE 5. Day-ahead power curves for microgrid: (A) output power; (B) load power; (C) microgrid exchange power.
5.1.2 Algorithm settings
To evaluate the performance of the TD3, we set up two different methods, the disorder charging method and DDPG. The parameters and rule settings of these three methods are as follows:
• TD3: The detailed parameters of TD3 are shown in Table 2. In Eq. 24, we set the number M of learning samples from the experience replay buffer to 256. When updating the Q value of two critic networks, the discount factor γ set to 0.99 (Zhang et al., 2021) works best. In Eqs 27, 28, the soft update factor τ is set to 0.005. In Eq. 32, the added noise is set to ɛ ∼ clip (0.2, 1, −0.5, 0.5). For better exploration, set th initial value of greedy coefficient ς is set to zero and its increment for each episode to 0.00002. Note that when setting the reward functions, each reward is normalized by its maximum values.
• DDPG: Compared with TD3, DDPG uses one critic network and does not add noise ɛ when the actor-target network updates the action. In order to compare the performance of different algorithms, other training parameters of DDPG keep the same as that of TD3.
• Disorder charging: To provide a quantitative reference for the performance of the DRL methods, we set up a disordered charging experiment. When one EV arrives at the station, the charging station starts to continuously supply power with Pf = 30kw or Pf = 7kw until its SOC reaches the expected value.
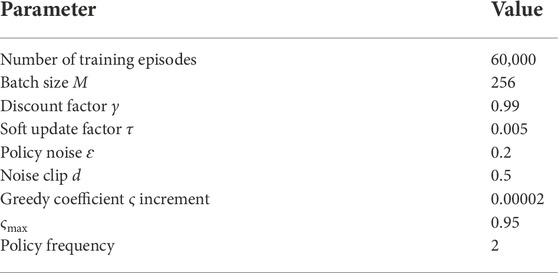
TABLE 2. Training parameters of TD3.
5.1.3 Metrics
To quantitatively evaluate the performance of the three methods, we set the following three metrics.
• Average price:
• Fluctuation:
• Satisfaction:
5.2 Training results
We evaluate three groups of experiment results and training processes by the three metrics in Section 5.1.3. The following are the analysis results.
Figure 6 shows the training process of two DRL methods. To be more intuitive, we average the rewards every 30 episodes, the results of which are shown as the dark blue curve in Figure 6. It can be seen that at the beginning, the reward of both methods is low. When the reward curve tends to stabilize, it means that the agent has explored the optimal strategy. Compared with DDPG (Figure 6A), the convergence point of TD3 (Figure 6B) is 28% earlier and the reward value is 1.5 (Table 3). Therefore, TD3 has notable advantages of better stability, faster convergence, and higher reward in solving the model proposed in this paper.
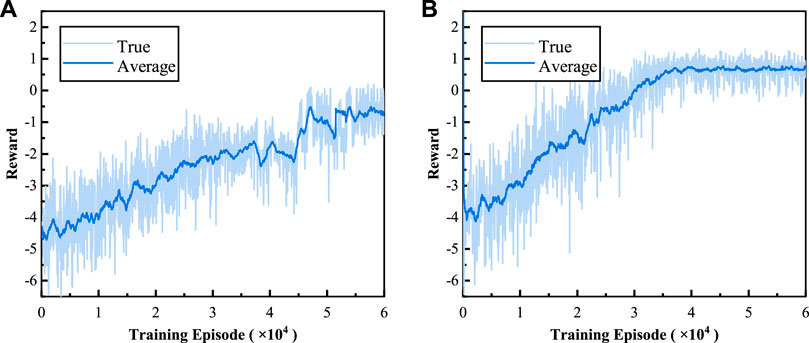
FIGURE 6. Reward curves in the training process: (A) DDPG and (B) TD3.

TABLE 3. Experimental results of charging strategies under different methods.
Figure 7 shows the results of charging or discharging strategies obtained by three experiments. The gray curves represent the time-of-use price, and the red columns represent the charging or discharging power in each time step. Positive values represent electricity purchased and negative values represent electricity sold by EVA. In Figure 7A, it is evident that the disorder charging method does not respond to price. Its charging strategy is to meet the maximum charging demand in each time step. In Figure 7B, the scheduling strategy obtained by DDPG is to charge less during the high-price hours and charge more during other hours. In Figure 7C, the TD3-based strategy has evident discharge behaviors during high-price hours, which indicates a more adequate response to price. From the perspective of the overall benefit, the TD3-based strategy can reduce the electricity price by 10.90% (Table 3), which performs better than DDPG.
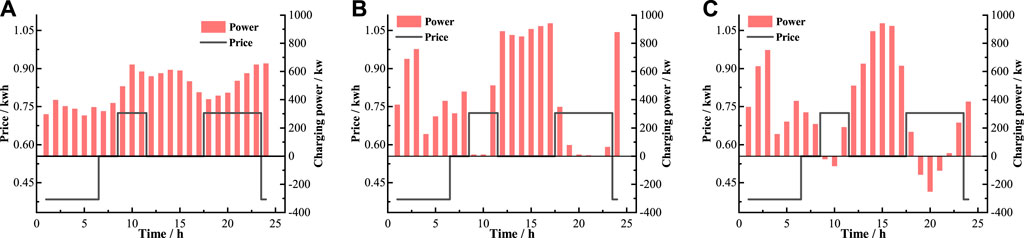
FIGURE 7. Charging or discharging strategies obtained by (A)disorder charging, (B) DDPG, and (C) TD3.
Figure 8 shows the results of the microgrid exchanging power. Compared with the day-ahead values, it is evident that the average exchanging power of all experiments increases, which is the result of balancing the charging satisfaction. As shown by the red line in Figure 8, if the charging behavior of EVs is not managed, a large number of EV loads will increase the peak-to-valley difference. In addition, compared with DDPG, the strategy obtained by TD3 can drastically reduce the power fluctuation by 69.40% (Table 3), which is almost twice that of DDPG. Note that in the hours of 3:00–7:00, there is a valley for both RL methods. Combined with Figure 7, during this low-price period, the agent sacrifices certain power fluctuations, which can not only reduce the charging cost but also improve the charging satisfaction.
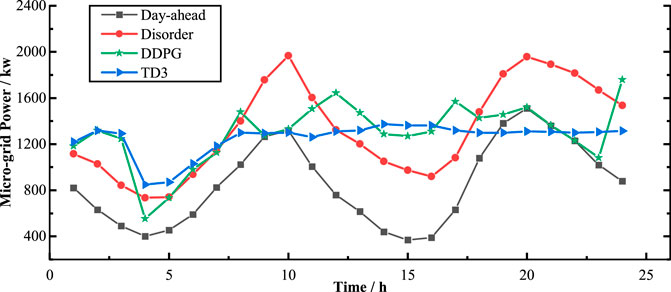
FIGURE 8. Exchange power of the microgrid in one day obtained by day-ahead prediction; disorder charging, DDPG; TD3.
Table 3 summarizes the results of the three groups of experiments. In terms of charging satisfaction, compared with the other two methods, TD3 sacrifices a certain degree of satisfaction. However, compared to DDPG’s results, it is worth sacrificing 24% satisfaction to reduce 51% cost and 84% power fluctuations. Therefore, for the charging model in this paper, the strategy based on TD3 is optimal, which can obtain the real-time scheduling strategy faster and higher overall benefits.
5.3 Impact of model parameters
In the training process of TD3, the balance coefficient β = [β1, β2, β3] has an important influence on the exploration of optimal strategy. Figure 9 shows the training curves for three different groups of balance coefficients. In order to explore the influence on strategy formulation, experiments are conducted with β1, β2, β3 as the dominant factors, respectively. From Figure 9, it can be seen that the reward dominated by β2 is the largest. Table 4 summarizes the experiment results, from which we can see that the strategies dominated by β1 and β3 are two extreme cases. The former reduces costs with maximum discharging, while the latter improves satisfaction with maximum charging. On the whole, when dominated by β2, the strategy can guarantee both low cost and low power fluctuations. Therefore, for the training in Section 5.2, the balance coefficient is set to be [0.2, 0.6, 0.2] dominated by β2.
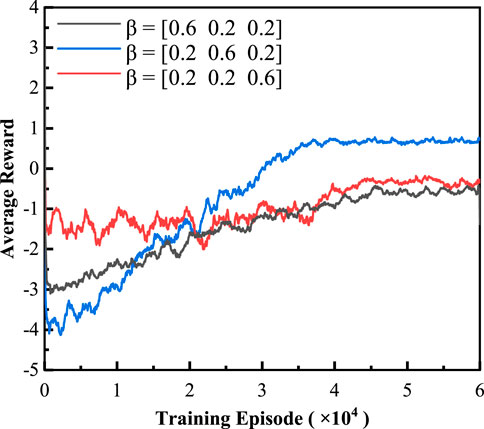
FIGURE 9. Training curves under different balance coefficient β based on TD3.

TABLE 4. Experimental results of charging strategies under different balance coefficient β.
6 Conclusion
In the current EV charging management market, balancing the interests of each participant will be an important part in improving the market structure. Therefore, it is necessary to formulate a charging management strategy that considers the interests of each participant. Considering the participation of EVA, microgrids, and users, this paper provides a reference for solving this problem.
Based on DRL, we propose a charging scheduling framework with EVA as the decision-making body. Considering the charging characteristics of electric taxis and private cars, we formulate a charging strategy for charging stations based on TD3. Compared with the disorder charging method and DDPG, TD3 can reduce power purchase costs by 10.9% and reduce power fluctuations by 69.4% on the basis of ensuring certain user satisfaction.
Data availability statement
The original contributions presented in the study are included in the article/Supplementary Material; further inquiries can be directed to the corresponding author.
Author contributions
FC performed the experiment and wrote the manuscript, XL contributed to the analysis and manuscript preparation, RZ helped perform the analysis with constructive discussions, and QY contributed to the conception of the study.
Funding
This work was supported in part by the National Natural Science Foundation of China under Grant 62173268, Grant 61803295, Grant 61973247, and Grant 61673315; in part by the Major Research Plan of the National Natural Science Foundation of China under Grant 61833015; in part by the National Postdoctoral Innovative Talents Support Program of China under Grant BX20200272; in part the National Key Research and Development Program of China under Grant 2019YFB1704103; and in part by the China Postdoctoral Science Foundation under Grant 2018M643659.
Conflict of interest
The authors declare that the research was conducted in the absence of any commercial or financial relationships that could be construed as a potential conflict of interest.
Publisher’s note
All claims expressed in this article are solely those of the authors and do not necessarily represent those of their affiliated organizations, or those of the publisher, the editors, and the reviewers. Any product that may be evaluated in this article, or claim that may be made by its manufacturer, is not guaranteed or endorsed by the publisher.
References
Abdalrahman, A., and Zhuang, W. (2022). Dynamic pricing for differentiated pev charging services using deep reinforcement learning. IEEE Trans. Intell. Transp. Syst. 23, 1415–1427. doi:10.1109/tits.2020.3025832
Brenna, M., Foiadelli, F., Soccini, A., and Volpi, L. (2018). “Charging strategies for electric vehicles with vehicle to grid implementation for photovoltaic dispatchability,” in 2018 International Conference of Electrical and Electronic Technologies for Automotive, Milan, Italy, July 09–11, 2018 (IEEE), 1–6.
Chis, A., Lund’en, J., and Koivunen, V. (2017). Reinforcement learning-based plug-in electric vehicle charging with forecasted price. IEEE Trans. Veh. Technol. 66, 3674–3684. doi:10.1109/TVT.2016.2603536
Choi, W., Wu, Y., Han, D., Gorman, J., Palavicino, P. C., Lee, W., et al. (2017). “Reviews on grid-connected inverter, utility-scaled battery energy storage system, and vehicle-to-grid application - challenges and opportunities,” in 2017 IEEE Transportation Electrification Conference and Expo (ITEC), Chicago, IL, June 22–24, 2017 (IEEE), 203–210.
Duan, P. (2021). “Research on the transaction and settlement mechanism of yunnan clean energy’s participation in the west to east power transmission for the goal of “carbon peak” and “carbon neutral,” in 2021 IEEE Sustainable Power and Energy Conference (iSPEC), Nanjing, China, December 23–25, 2021 (IEEE), 1843–1850.
Franaois-Lavet, V., Henderson, P., Islam, R., Bellemare, M. G., and Pineau, J. (2018). An introduction to deep reinforcement learning. Hanover, United States: Now Foundations and Trends.
Fu, G., Liu, J., Liu, J., and Liu, R. (2018). “Quantitative analysis of the feasibility of realizing the transformation to clean energy for China’s energy increment by 2035,” in 2018 International Conference on Power System Technology (POWERCON), Guangzhou, China, November 06–08, 2018 (IEEE), 510–515.
Gao, G., and Jin, R. (2022). “An end-to-end flow control method based on dqn,” in 2022 International Conference on Big Data, Information and Computer Network, Sanya, China, January 20–22, 2022 (IEEE), 504–507.
Hu, W., Su, C., Chen, Z., and Bak-Jensen, B. (2013). Optimal operation of plug-in electric vehicles in power systems with high wind power penetrations. IEEE Trans. Sustain. Energy 4, 577–585. doi:10.1109/tste.2012.2229304
Kabir, M. E., Assi, C., Tushar, M. H. K., and Yan, J. (2020). Optimal scheduling of ev charging at a solar power-based charging station. IEEE Syst. J. 14, 4221–4231. doi:10.1109/jsyst.2020.2968270
Kandpal, B., and Verma, A. (2021). Demand peak reduction of smart buildings using feedback-based real-time scheduling of evs. IEEE Syst. J. 16, 1–12. doi:10.1109/JSYST.2021.3113977
Kong, W., Luo, F., Jia, Y., Dong, Z. Y., and Liu, J. (2021). Benefits of home energy storage utilization: An Australian case study of demand charge practices in residential sector. IEEE Trans. Smart Grid 12, 3086–3096. doi:10.1109/tsg.2021.3054126
Koufakis, A.-M., Rigas, E. S., Bassiliades, N., and Ramchurn, S. D. (2020). Offline and online electric vehicle charging scheduling with v2v energy transfer. IEEE Trans. Intell. Transp. Syst. 21, 2128–2138. doi:10.1109/tits.2019.2914087
Li, H., Yang, D., Su, W., Lv, J., and Yu, X. (2019). An overall distribution particle swarm optimization mppt algorithm for photovoltaic system under partial shading. IEEE Trans. Ind. Electron. 66, 265–275. doi:10.1109/tie.2018.2829668
Li, S., Hu, W., Cao, D., Dragicevic, T., Huang, Q., Chen, Z., et al. (2022). Electric vehicle charging management based on deep reinforcement learning. J. Mod. Power Syst. Clean Energy 10, 719–730. doi:10.35833/mpce.2020.000460
Mahmud, K., Hossain, M. J., and Ravishankar, J. (2019). Peak-load management in commercial systems with electric vehicles. IEEE Syst. J. 13, 1872–1882. doi:10.1109/jsyst.2018.2850887
Megantoro, P., Danang Wijaya, F., and Firmansyah, E. (2017). “Analyze and optimization of genetic algorithm implemented on maximum power point tracking technique for pv system,” in 2017 international seminar on application for technology of information and communication (iSemantic) (New Jersey, United States: IEEE), 79–84.
Okur, O., Heijnen, P., and Lukszo, Z. (2020). “Aggregator’s business models: Challenges faced by different roles,” in 2020 IEEE PES innovative smart grid technologies europe (ISGT-Europe) (New Jersey, United States: IEEE), 484–488.
Ordoudis, C., Pinson, P., and Morales, J. M. (2019). An integrated market for electricity and natural gas systems with stochastic power producers. Eur. J. Operational Res. 272, 642–654. doi:10.1016/j.ejor.2018.06.036
Peng, L., Jinyu, X., Jiawei, W., Zhengxi, C., and Shining, Z. (2021). “Development of global wind and solar resource to cope with global climate change,” in 2021 IEEE Sustainable Power and Energy Conference (iSPEC), Nanjing, China, December 23–25, 2021 (IEEE), 986–996.
Purushotham Reddy, M., Aneesh, A., Praneetha, K., and Vijay, S. (2021). “Global warming analysis and prediction using data science,” in 2021 Fifth International Conference on I-SMAC (IoT in Social, Mobile, Analytics and Cloud) (I-SMAC), Palladam, India, November 11–13, 2021 (IEEE), 1055–1059.
Qian, T., Shao, C., Li, X., Wang, X., Chen, Z., and Shahidehpour, M. (2022). Multi-agent deep reinforcement learning method for ev charging station game. IEEE Trans. Power Syst. 37, 1682–1694. doi:10.1109/tpwrs.2021.3111014
Qiu, D., Ye, Y., Papadaskalopoulos, D., and Strbac, G. (2020). A deep reinforcement learning method for pricing electric vehicles with discrete charging levels. IEEE Trans. Ind. Appl. 56, 5901–5912. doi:10.1109/tia.2020.2984614
Rajendran, A., Jayan, P. P., Mohammed Ajlif, A., Daniel, J., Joseph, A., and Surendran, A. (2022). “Energy performance improvement in house boat tourism through clean energy route interfaced with energy efficient power conversion techniques and energy storage,” in 2022 IEEE International Conference on Power Electronics, Smart Grid, and Renewable Energy (PESGRE), Trivandrum, India, January 02–05, 2022 (IEEE), 1–7.
Ravey, A., Roche, R., Blunier, B., and Miraoui, A. (2012). “Combined optimal sizing and energy management of hybrid electric vehicles,” in 2012 IEEE Transportation Electrification Conference and Expo (ITEC), Dearborn, MI, June 18–20, 2012 (IEEE), 1–6.
Shi, W., Li, N., Chu, C.-C., and Gadh, R. (2017). Real-time energy management in microgrids. IEEE Trans. Smart Grid 8, 228–238. doi:10.1109/tsg.2015.2462294
Su, Z., Lin, T., Xu, Q., Chen, N., Yu, S., and Guo, S. (2020). “An online pricing strategy of ev charging and data caching in highway service stations,” in 2020 16th International Conference on Mobility, Sensing and Networking (MSN), Tokyo, Japan, December 17–19, 2020 (IEEE), 81–85.
Tao, Y., Qiu, J., and Lai, S. (2022). Deep reinforcement learning based bidding strategy for evas in local energy market considering information asymmetry. IEEE Trans. Ind. Inf. 18, 3831–3842. doi:10.1109/tii.2021.3116275
Tian, Y., Yu, Z., Zhao, N., Zhu, Y., and Xia, R. (2018). “Optimized operation of multiple energy interconnection network based on energy utilization rate and global energy consumption ratio,” in 2018 2nd IEEE Conference on Energy Internet and Energy System Integration (EI2), Beijing, China, October 20–22, 2018 (IEEE), 1–6.
Wan, Z., Li, H., He, H., and Prokhorov, D. (2019). Model-free real-time ev charging scheduling based on deep reinforcement learning. IEEE Trans. Smart Grid 10, 5246–5257. doi:10.1109/tsg.2018.2879572
Wang, G., and Cui, D. (2020). “Research on vehicle routing branch pricing algorithm for multi-model electric vehicles based on board testing,” in 2020 IEEE International Conference on Power, Intelligent Computing and Systems (ICPICS), Shenyang, China, July 28–30, 2020 (IEEE), 954–959.
Yang, J., Fei, F., Xiao, M., Pang, A., Zeng, Z., Lv, L., et al. (2017). “A noval bidding strategy of electric vehicles participation in ancillary service market,” in 2017 4th International Conference on Systems and Informatics (ICSAI), Hangzhou, China, November 11–13, 2017 (IEEE), 306–311.
Yang, Y., Zhang, B., Wang, W., Wang, M., and Peng, X. (2020). “Development pathway and practices for integration of electric vehicles and internet of energy,” in 2020 IEEE Sustainable Power and Energy Conference (iSPEC), Chengdu, China, November 23–25, 2020 (IEEE), 2128–2134.
Yuan, H., Lai, X., Wang, Y., and Hu, J. (2021). “Reserve capacity prediction of electric vehicles for ancillary service market participation,” in 2021 IEEE 2nd China International Youth Conference on Electrical Engineering (CIYCEE), Chengdu, China, December 15–17, 2021 (IEEE), 1–7.
Zhang, F., Yang, Q., and An, D. (2021). Cddpg: A deep-reinforcement-learning-based approach for electric vehicle charging control. IEEE Internet Things J. 8, 3075–3087. doi:10.1109/jiot.2020.3015204
Zhao, Z., and Lee, C. K. M. (2022). Dynamic pricing for ev charging stations: A deep reinforcement learning approach. IEEE Trans. Transp. Electrific. 8, 2456–2468. doi:10.1109/tte.2021.3139674
Zhaoxia, X., Hui, L., Tianli, Z., and Huaimin, L. (2019). “Day-ahead optimal scheduling strategy of microgrid with evs charging station,” in 2019 IEEE 10th International Symposium on Power Electronics for Distributed Generation Systems (PEDG), Xi'an, China, June 03–06, 2019 (IEEE), 774–780.
Keywords: electric vehicle, microgrid, multi-objective optimization, charging scheduling, deep reinforcement learning
Citation: Cui F, Lin X, Zhang R and Yang Q (2023) Multi-objective optimal scheduling of charging stations based on deep reinforcement learning. Front. Energy Res. 10:1042882. doi: 10.3389/fenrg.2022.1042882
Received: 13 September 2022; Accepted: 24 October 2022;
Published: 16 January 2023.
Edited by:
Hanlin Zhang, Qingdao University, ChinaCopyright © 2023 Cui, Lin, Zhang and Yang. This is an open-access article distributed under the terms of the Creative Commons Attribution License (CC BY). The use, distribution or reproduction in other forums is permitted, provided the original author(s) and the copyright owner(s) are credited and that the original publication in this journal is cited, in accordance with accepted academic practice. No use, distribution or reproduction is permitted which does not comply with these terms.
*Correspondence: Qingyu Yang, eWFuZ3Fpbmd5dUBtYWlsLnhqdHUuZWR1LmNu