 Rachit Srivastava
 Mohammad Amir
 Furkan Ahmad
 Sushil Kumar Agrawal
 Anurag Dwivedi
 Arun Kumar Yadav
- 1Department of Electrical Engineering, Bansal Institute of Engineering and Technology, Lucknow, UP, India
- 2Department of Electrical Engineering, Faculty of Engineering and Technology, Jamia Millia Islamia, New Delhi, India
- 3Division of Sustainable Development, College of Science and Engineering, Hamad Bin Khalifa University, Qatar Foundation, Doha, Qatar
Besides being limited in quantity, conventional energy sources also emit toxic gases. The Photovoltaic (PV) Solar System is one of the most energizing green energy sources. Around the globe, solar panels are being installed on barren land as well as on the roofs of buildings to generate electricity. An education institute in northern India recently took a step in this direction by installing a grid-tied 100
1 Introduction
Coal-based electricity generation plants have raised severe environmental concerns during their long-term operation. As an alternative, PV solar technology is one of the most reliable, clean, and environmentally friendly technologies for converting solar energy into electricity (Shamami et al., 2020; Ahmad et al., 2017). The PV plant has the potential to generate significant amounts of electricity since it has the ability to meet the electrical demands of the entire globe. There has been impressive progress in the production of electrical energy from solar photovoltaic plants throughout the world (Shariff et al., 2019; Shaikh et al., 2018). As a result of end-user awareness and incentives, India’s rooftop solar PV plants have expanded rapidly. The Jawaharlal Nehru National Solar Mission of the Ministry of New and Renewable Energy, Government of India, estimates 100 GW of PV capacity by 2022. Therefore in various cities, rooftop solar photovoltaic plants have been commissioned, the power generated by PV plants has been utilized, and the excess energy is delivered to the utility (Sharma et al., 2015; Upadhyay and Singh 2021; Yenneti, 2016). Setting up a solar PV plant on the floor isn't usually possible because of free and un-shaded land availability. Hence, the rooftop area may be applied efficaciously for power generation by putting in a solar PV plant (Milosavljevic et al., 2015; Dalal et al., 2021; Amir and Haque, 2022). Various tasks have been taken with the aid of government and private organizations to install solar PV plants on the roof of any of the government workplace buildings, houses, personal establishments and authorities, and personal workstations to address the latest power disaster and growth in tariff charges. The rooftop solar PV plant will not only solve the strength disaster but also mitigate the damaging consequences of greenhouse gases, including CO2 and NO2 gases, which can be produced with the aid of using fossil fuel-based power technology plants (Dalal et al., 2021; Turney and Fthenakis 2011; Zarzavilla et al., 2022). A substantial element of PV-based electricity may be used for promoting grid-tie solar PV plants of various sizes in step with the need of the consumer (Amir et al., 2022).
Performance assessment of PV systems in real outdoor conditions is very important as the performance of the PV system in a research laboratory environment is distinct from the performance of the PV system in practical open-air conditions (Asaad et al., 2017). There are a few software programs such PVsyst (Rachit and Vinod kumar 2016; PVSyst, 2020; Baqir and Channi 2021; Shrivastava et al., 2021), PVWatts (Psomopoulos et al., 2015; Dobos, 2014; Abdallah et al., 2022), PVGIS (Psomopoulos et al., 2015; Abdallah et al., 2022; PVGIS, 2012), RETScreen (Umar et al., 2018; Srivastava et al., 2020), SAM (Wang et al., 1999), TRNSYS (Beckman et al., 1994), PV*SOL (Firat, 2019; El Gindi et al., 2017; Kavitha et al., 2021), and HOMER (Ahmad and Alam 2018a; Ahmad and Alam 2017; Ahmad and Alam 2018b; Ahmad et al., 2020), etc. that are able to estimation overall performance of PV system however the reliability of the software program remains now no longer tested. International Electro-technical Commission has evolved the IEC 61724 standard that incorporates requirements and diverse constraints for the overall solar PV plant performance evaluation (IEC International Standard, 1998). Most nations have followed the IEC 61724 standard.
A 100-kW grid-tie solar photovoltaic plant was installed in 2018 and has been operating since then on the rooftop of Bansal Institute of Engineering and Technology, Lucknow, UP. The present case study has evaluated its 1-year performance (1 Jan 2019, to 31 December 2019) concerning reference yield, electricity generation, final yield, and performance ratio based on ICE 61724 standards. Along with that performance - evaluation of the actual power plant is compared with outcomes obtained from PV*syst software. Economic analysis and environmental effects of the plant have also been calculated to check the feasibility of the plant.
The paper is separated into five Sections. Section 2 provides a general overview of grid-tie PV plants. This Section introduces performance evaluation using PV*syst software. Section 3 discusses in detail the actual 100kWp PV plant. It includes details of the PV module, inverter configuration, AC and DC distribution box, and the support structure of the module. This Section also provides environmental data on the site location. In Section 4, various results of the actual plant and PV*syst software are presented. Also, a comparison of the installed PV power plant and PV*syst is carried out. In Section 5, the summary and conclusion of the paper are presented. Moreover, this paper outlines the contributions of the presented research. The key objective of this proposed study are as follows:
• According to the requirements of IEC 61724, the present paper examines the rooftop grid-connected PV system’s performance for 1 year.
• In order to evaluate the power plant’s performance, this paper analyzes the various parameters of the PV plant, including reference yield, final yield, and performance ratio (PR) of the PV plant.
• A detailed comparative analysis of the obtained results from the actual power plant with PV*syst software is carried out.
• Finally, we have explained how the proposed case study would help assess the feasibility of building a large-scale PV plant under different atmospheric conditions.
2 Literature review
Many kinds of research have been carried out on grid-tie rooftop PV plants in distinct parts of the globe. In this Section, we have reviewed some recently conducted studies.
Rajesh Arora et al. Arora et al. (2022) have done a performance evaluation of 186 kWp grid-connected PV plant commission on the roof of a building in Northern India. In this work, the plants have been monitored for 1 year (2018). PVsyst and SAM software were used to compare the actual plant and software results. The performance ratio of the plant has been reported to be 0.827. From the observation, it has been found that the net system losses are observed to be 27.7%.
Hassane Dahbi et al. Dahbi et al. (2021) investigated 12 months of a 6 MW grid-connected photovoltaic (PV) plant mounted on a ground-based PV plant in southern Algeria. In this work, the plant’s overall performance was estimated with the help of IEC 61724 standards. The yearly average performance ratio, system efficiency, and capacity factor were 74.68%, 11.39%, and 21.44%, respectively. It has been observed that the plant performance ratio decreases linearly with increasing ambient temperature or solar irradiation.
Ahmad Faiz Minai et al. Minai et al. (2022) monitored 462.7 kWp grid PV plant roofs of three separate high-rise buildings in India. The real-time performance of the system was investigated for 3 years. The plant performance has been compared with the PV*syst software results. The Performance Ratio of the 467.2 kWp system installed was 80.68%, while the system efficiency was about 15.47%.
Layachi Zaghba et al. Zaghba et al. (2022) did a performance evaluation of a photovoltaic plant in a Sahara environment (Algerian desert); the installed capacity of the plant is 2.25 kWp. The performance of the plant was monitored According to IEC standard 61724. From the performance evaluation, it has been found that the plant’s performance ratio varies from 0.78 to 0.97.
(Shrivastava et al., 2021) has executed an overall performance assessment of a hundred ninety kW grid-tie PV plant established in Punjab. From the observations, it's been noticed that the final yield, reference yield, and overall PR range from 1.45 to 2.84h, 2.29–3.53 h, and 0.55 to 0.83, respectively. The average electricity yield yearly of the Photovoltaic system is 812.76 kWh/kW/year, with system effectiveness of 8.3%. The outcomes obtained from the actual system were compared with those from the PV*Sol software program result.
Another study (Sharma and Goel, 2017) monitored an overall performance evaluation of a thirteen kW roof-established grid-tie photovoltaic plant. The plant is mounted on the roof of a college in Odisha. From the observations, it's been discovered that the PV, plant, and inverter efficiencies vary from 4.5 percent to 9.2 percent, 3.6 percent to 7.8 percent, and 50 percent to 87 percent, respectively, and the overall PR varies within the range of 0.29–0.66.
Software evaluation of a 1 kW grid-tie PV plant has been achieved (Tarigan and DjuwariKartikasari, 2015). PV*syst and RETscreen software programs were involved in the study. It has been observed that the plant may meet a home’s primary electric requirements. This plant delivers approximately one MWh of electricity annually into the grid with an average performance ratio of 0.72.
Further, (Pritam Satsangi et al., 2018), did an overall performance assessment of a forty kW grid-tie PV plant established in Uttar Pradesh state, India. The plant is installed on the roof of a college in Agra city, Uttar Pradesh state. The overall performance of the plant was estimated to the IEC 61724 standards. PV, inverter, and overall plant effectiveness for the year were determined to be 9.36 percent, 90.9 percent, and 8.51 percent, respectively. The performance ratio and capability factor have been determined to be 0.63 and 0.9.
Research (Peerapong and Limmeechokchai, 2014) has compared three varieties of grid-tie solar PV power plant life, namely solar household rooftop (11.04 kW), integrated ground-mounted rooftop (330 kW), and utility-scale plant (38.5 MW) in Thailand. From the analysis, it's been discovered that the least price of power of $0.27 per unit was by utility-scale solar PV plants. The energy cost with residential Sun rooftop PV plant and ground-mounted rooftop PV plant were $0.46 per unit and $0.29 per unit, respectively. The literature review of various plants commission at different locations of the world has been tabulated in Table 1.
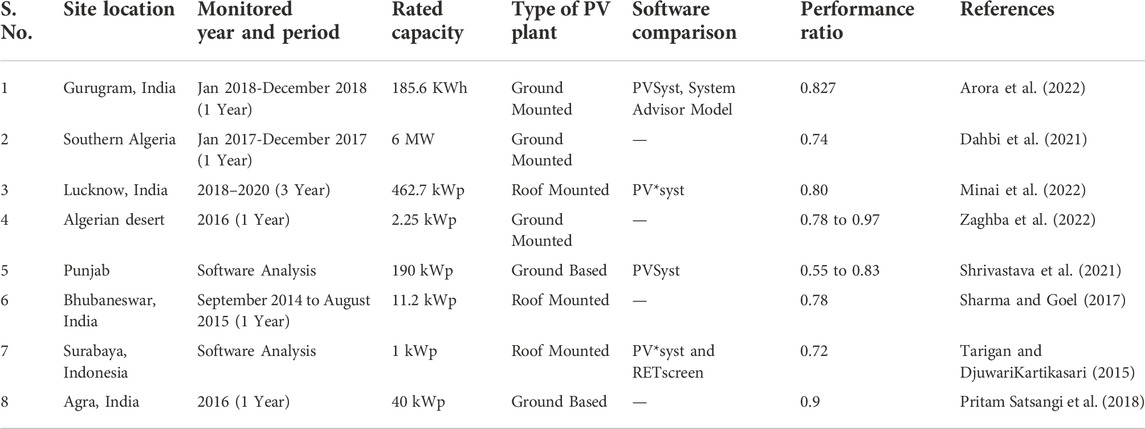
TABLE 1. Literature review of various plant commissions at different locations around the world.
The literature survey found that IEC 61724 standard and its indicators are used for the performance evaluation of PV plants (Rao et al., 2022). It has also been noticed that roof-mounted PV systems are feasible in most places worldwide. Comparing software results with the actual results is also essential to compare the plant’s expected and actual performance. From the literature survey, it has also been observed that PV*syst simulation software is mostly used. It has also been found that economic analysis is also a vital aspect of checking the feasibility of the plant.
3 Performance indicators
The International Electro-Technical Commission (IEC) has published IEC 61724 standard to suggest a detailed set of instructions and constraints for the performance evaluation of any solar PV plant (IEC International Standard, 1998; Boddapati et al., 2021; Srivastava et al., 2020). Many counties around the world have adopted this standard. The Bureau of Indian Standards also adopted the same standard in 1998. Some essential parameters prescribed by the standard are listed below:
3.1 Array yield
Array yield is the generated energy output of the PV array on a per kW basis of an installed PV array. It indicates the energy output from the plant, and it is independent of plant size. Also, the
3.2 Final yield
The final yield is the ratio of the PV plant’s net AC-generated energy output and the plant’s rated power, also referred to as the yield factor or PV yield. The yield factor is one of the key indicators reflecting plant operating conditions, for example, the tilt angle of the PV array and mounting structure (Srivastava et al., 2020; Shiva Kumar and Sudhakar, 2015). If value of
3.3 Reference yield
Reference yield is defined as the ratio of total global radiation on the surface of the PV plant
3.4 Performance ratio
The performance ratio (PR) is the ratio of reference yield and final yield. It is a unit less quantity. The performance ratio shows the aggregate loss of the PV plant. The ideal condition’s performance ratio is 1 (100%). But in practice,
4 Solar photovoltaic plant
The 100 kWp on-grid plant is set up on the rooftop of a Bansal Institute of Engineering and Technology, UP, India. The global horizontal photo voltaic radiation data had been gathered from the NASA database. The overall performance evaluation of the proposed PV plant has been observed for 1 year (1 January 2019 to 31 December 2019). In this Section, a detailed description of the installed
4.1 Site location
The 100kWp grid-tie PV plant is hooked up on the roof of Bansal Institute of Engineering and Technology, Lucknow. The institute is placed in the northern area of India. The mean annual temperature of Lucknow varies from 8°C to 40°C, and Lucknow’s mean annual precipitation rainfall is 670.3 mm. In Lucknow, June is the hottest month (33°C avg), whereas the coldest month is January (15°C avg), and the wettest month is July (194.7 mm avg) (Annual Weather Averages Near Lucknow). For the site location of Lucknow, March to June is the summer session, July to September is the rainy session, whereas October to February is the winter session. The proposed site is positioned at longitude 80°55′37.22″E and latitude 26°56′31.93″N. Figure 1 indicates a Google map of the plant vicinity (Google, 2022).
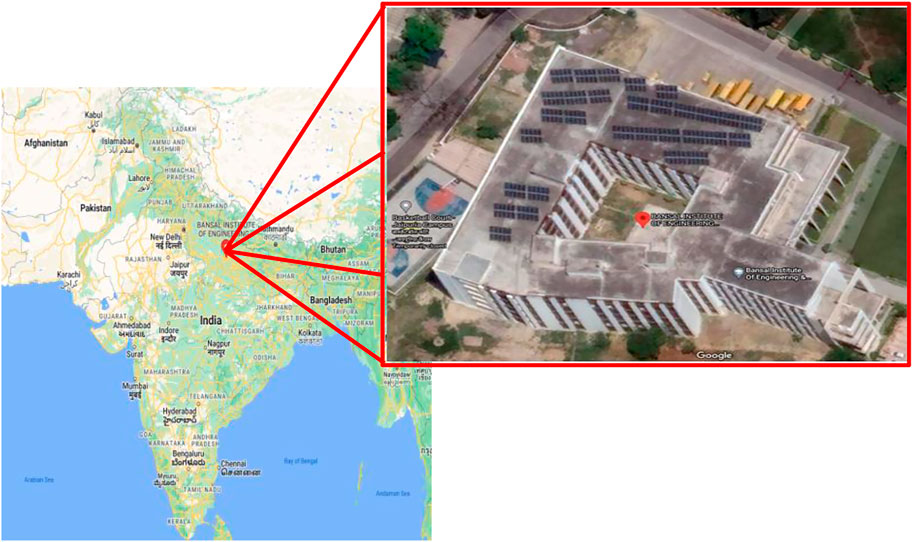
FIGURE 1. Location of the 100 kW grid-tie plant at Indian Map (Google, 2022).
4.2 Photovoltaic module
The one hundred
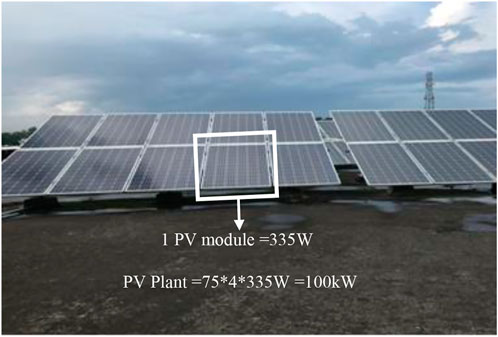
FIGURE 2. Pictorial view of the installed PV plant.
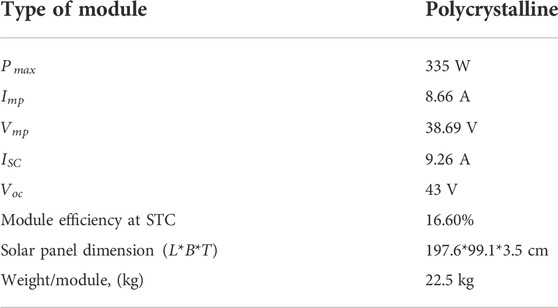
TABLE 2. PV module specifications.
A total of 75 modules of 335 W have formed an array connected with an inverter; similarly, three more arrays are formed and connected with three inverters. Thus, a total of 4 inverters are employed in this project. Ten modules were placed in a single support structure, and 30 such structures were formed to support the modules.
4.3 Inverter
A 3-phase inverter, Luminous NXi 325 [Luminous India (b)], was used in this plant. The inverter has been employed to convert DC electricity into AC electricity. The inverter has a grid-tie feature; hence the generated AC electricity is directly fed to the state grid. The rated effectivity of the inverter is 95.6%. Figure 3 indicates a hardware setup of the inverters. The configurations of inverters are tabulated in Table 3.
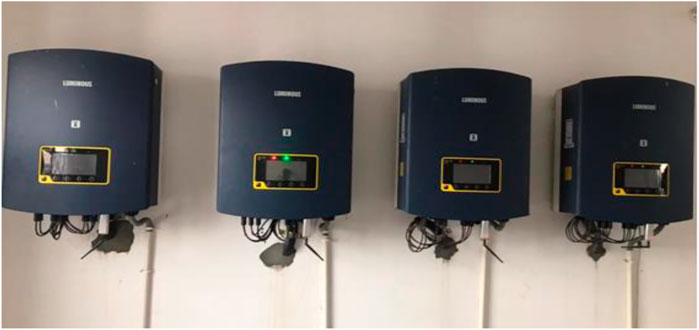
FIGURE 3. Hardware setup of the inverters.
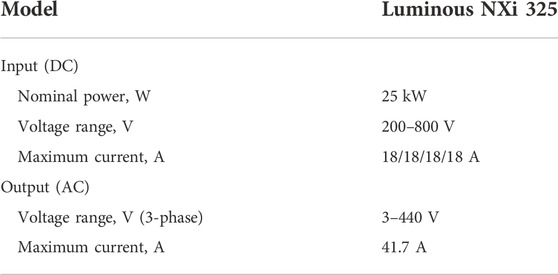
TABLE 3. Inverter specifications.
The module’s output power is first fed to the DC Distribution Box and then provided to the Inverters. DC Distribution box protects the inverter and module from lightning. All four Inverters have a 25 kW power rating with an input operating range from 200 to 800 DC voltage while producing a three-phase 440 V output voltage. All four Inverters are parallelly operated; that is why if one string or inverter fails, the remaining three inverters will be in the ON position, which means the whole plant will not shut down. That is why more than one inverter is used in the PV plant instead of a single inverter in most places. The output of the inverter is fed to the AC Distribution Box, and then power is fed to the grid via net metering. The AC distribution box protects the inverter and grid from overvoltage or current conditions.
4.4 Data acquisition and grid integration
A grid is an interconnected network to send electrical energy from generation units to the end users. Bansal Institute of Engineering and Technology, Lucknow, is located in the northern grid; hence, the plant is connected with the Jankipuram Substation of the Madhyanchal Vidyut Vitran Nigam Limited, an Utter Pradesh Corporation Limited subdivision. The plant is connected with the grid on the net-metering concept. When the plant generates electricity more than the required electricity demand of the institute and the electricity flow from the plant to the grid, and when the plant generates electricity less than the required electricity demand of the institution, the electricity flow from the grid to load. As the educational institute commissions, the plant considered in this study, power flows from the grid to the institute during weekdays. In contrast, excess electricity flows back to the grid on weekend days.
A monitoring and data acquisition system is also provided in this system. The inverters are connected to the server through the modem or Ethernet cable. The useful data of the inverter, such as grid voltage, dc-link voltage, current, and generated electricity, were stored in the inverter server. The user can check or monitor the data anytime by logging in to the inverter server.
4.5 Global solar radiation data
The vicinity is required for the overall performance assessment of the site’s global solar radiation data. For this, Global photo voltaic radiation data of this site location has been gathered from the NASA database. The month-to-month variation of global photovoltaic radiation is proven in Table 4. Global solar radiation is most in May (6.38 kW/m2/day) and minimal in December (3.12 kW/m2/day). The average global solar radiation for 12 months is 4.56 kW/m2/day.
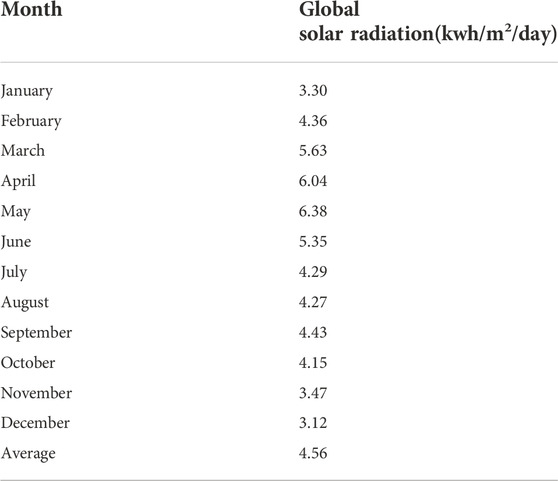
TABLE 4. Monthly variation of global solar radiation for the site location.
5 Methodology for Performance evaluation
In this work, the performance evaluation of a 100-kW roof-mounted PV plant is carried out for 1 year, which is reasonably sufficient to analyze the effect of the season on the plant. Figure 4 shows the flow chart of the performance evaluation of a grid-connected solar-powered microgrid. For the performance evaluation, the following steps were carried out:
• Collection of daily generated electricity data from the inverter web database.
• Collection of solar radiation data from NASA database.
• Calculating reference yield, final yield, electricity generation, performance ratio, and other vital indicators per the prescription of IEC 61724 for evaluating the PV plant.
• Estimation of payback period and other critical economic parameters.
• Performance evaluation of the plant using PVsyst software.
• Comparison of the actual performance of the plant with PV*syst software results.
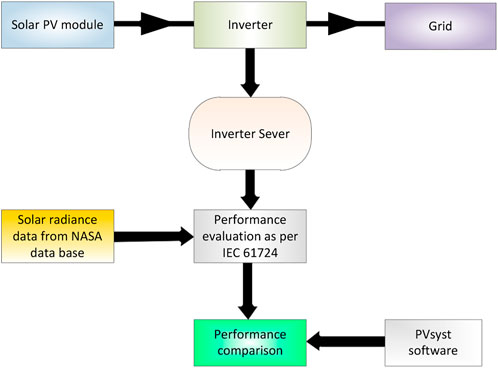
FIGURE 4. Graphical representation of proposed performance evaluation of grid-connected solar-powered microgrid.
6 Results of actual plant
To study the overall electrical performance of the installed grid-tie PV plant, some most significant parameters like reference yield, final yield, overall performance ratio, total electricity generation, etc., were calculated for 1 year (1 January 2019 to 31 December 2019) as per IEC 61724 standard. Various consequences drawn from the overall performance evaluation are listed in this Section.
6.1 Reference
Reference yield has been computed with the help of the formula mentioned in Section 3.3. The month-to-month variation of reference yield is proven in Figure 5A. From Figure 5, it can be found that
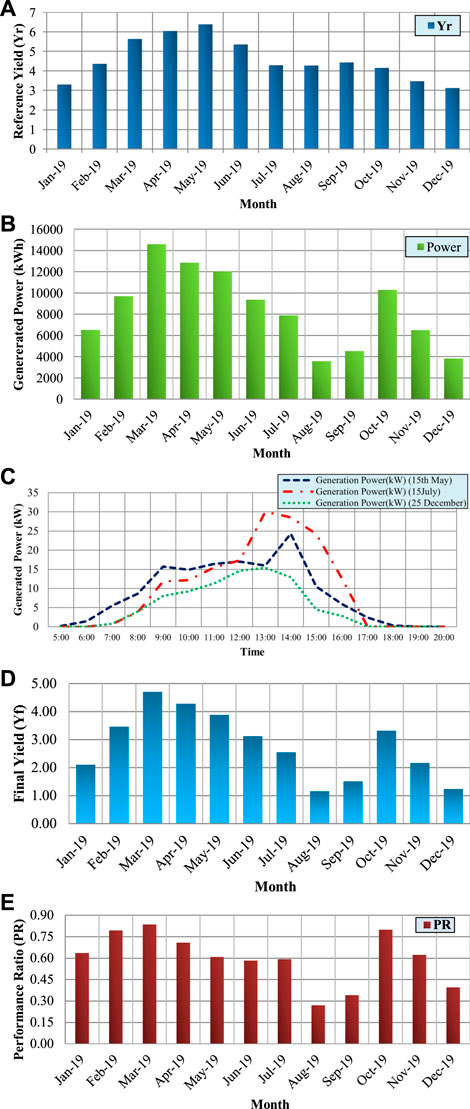
FIGURE 5. (A) Monthly variation of Reference Yield
6.2 Electricity generation
AC electrical energy output to the grid has been collected from the data acquisition plant through the internet. The data acquisition center collects data on a sample of 5 min. Electricity data has been collected for 12 months (1 January 2019 to 31 December 2019). The monthly variation of electricity produced is shown in Figure 5B. The plant generated a minimum electricity of 3823.4 kWh in December and a maximum of 14582.5 kWh in March. Figure 5 shows that power generation is maximum in the summer session (as for the site location March to June months are summer session) and minimum in the winter session (as for the site location November to February months are winter session). Because solar radiation is high during the summer session, solar radiation is low in the winter session. In the rainy session (as for the site location July to September months are raining session), electricity generation is medium due to the clouds. In October, electricity generation is in good quantity because of the clear sky in this month. The total electricity generation from the plant during the observed period is 101572 kWh.
Figure 5C shows the hourly variation of power generation on 15 January 2019, 15 May 2019, and 15 August 2019. The dates are selected as follows, 15 January represents the electricity generation pattern of the winter session, 15 May represents the electricity generation pattern of the summer session, and 15 August represents the electricity generation pattern of raining session. The annual electricity demand of the institute is about 170 MWh, and the plant generates 101 MWh annually, which covers 59.4% of the total required electricity demand.
6.3 Final yield
The final yield has been computed with the help of the formula mentioned in Section 3.2. Figure 5D shows the month-to-month reference yield variation. The
6.4 Performance ratio
The overall performance ratio has been computed with the help of the formula mentioned in Section 3.4. The month-to-month version of the overall performance ratio is proven in Figure 5E. The overall performance ratio is most in March (0.84) and second most in October (0.80) as in these two months, atmospheric temperature is not so high, and there is almost negligible fog due to which plant work on optimal conditions whereas minimal in August (0.27) as in this month high cloud and rainfall is there due to which shading effects of the cloud affects the performance of the plant. The average overall performance ratio in the whole year is 0.60.
6.5 Economic investigation
The overall installation cost of the plant was 65 Lakh Indian Rupees (USD 819.33) (conversion rate: 1 USD $ = 79.33 INR as of 8th July 2022 (XE Currency Converter, 2022)). The cost of electricity from the utility to the institute is nine Indian Rupees/kWh (USD 0.11) (DERC, 2020). From the performance assessment of the PV plant, it is observed that the plant delivered 101.572 MWh of electricity in a year. The calculation shows that this plant saves approximately nine Lakh 14 thousand one hundred 48 Indian Rupees (USD 11522.97) in a year. From the calculations, it is also found that the simple payback duration of the proposed PV plant is 7 years and 1 month. Also, discounted payback duration of the plant is 8 years and 9 months, considering the 4.5 discount rate in India. Both the simple payback duration and discounted payback duration of the plant are less than 20 years (Sherwani et al., 2010); hence, the proposed PV plant is more economical.
6.6 Emission analysis
Electricity generation from the PV plant is 101.572 MWh in a year. Hence, the annual save of CO2 gas emission is 4.06 tons per the National Renewable Energy Laboratory report (the save of emission by PV Plant is approximately 40 g CO2/kWh) (NREL). From the calculations, it has been found that the plant will save a total of 101.5-ton CO2 in its life cycle, as the estimated life of the PV plant is 25 years.
6.7 Sustainable development goals
Sustainable Development Goals (SDGs) are 17 globally interconnected goals that aim to provide people and the planet with a blueprint for peace and prosperity in the 21st century. The Sustainable Development Goals (SDGs) were established by the United Nations General Assembly (UN-GA) in 2015 and are intended to be achieved by 2030. It will assist in achieving Goal 7, ensuring everyone has access to affordable, reliable, sustainable, and modern energy. Since India has an electricity deficit, installing self-generated photovoltaic plants will benefit the 7.1.1 goal: “Proportion of population with access to electricity.” As a result of such projects, the 7.2.1 goal of increasing the share of renewable energy in final energy consumption will be accomplished. Due to the high efficiency of solar energy, this plant can assist in achieving goal 7.3.1, which is a measure of energy intensity based on primary energy and GDP. As India is a developing country, the results of this research work will aid in achieving goal 7. a.1, which is to increase international financial flows to developing countries to support clean energy research and development, as well as the production of renewable energy, including hybrid systems. As this study is concerned with renewable energy, it will contribute to achieving goal 7. b.2, which is to install renewable energy-generating capacity in developing countries.
7 Simulation of PV*syst
Various parameters of the actual PV plant, such as PV module rating, inverter rating, a series-parallel combination of the PV module, geographical data, etc., were faded into PV*Syst software. Simulation outcomes of a 100 kW photovoltaic plant are analyzed in this Section. The outcomes had been bought from the simulation model of a 100 kW photovoltaic plant modeled in PV*syst as per the plant specifications and constraints. All the parameters of the plant and methodological data of the plant location have been fed into PV*Syst software, and results were computed.
7.1 Sun path
Shading performs a crucial function in the total performance evaluation of a photovoltaic PV plant. The plant considered in this study has no shading effect. The solar path graph for the plant is proven in Figure 6. From Figure 6, we can observe that in this solar radiation is available throughout the year. In the winter, the Sun is in lower digresses, whereas in the summer, the Sun is in higher digresses.
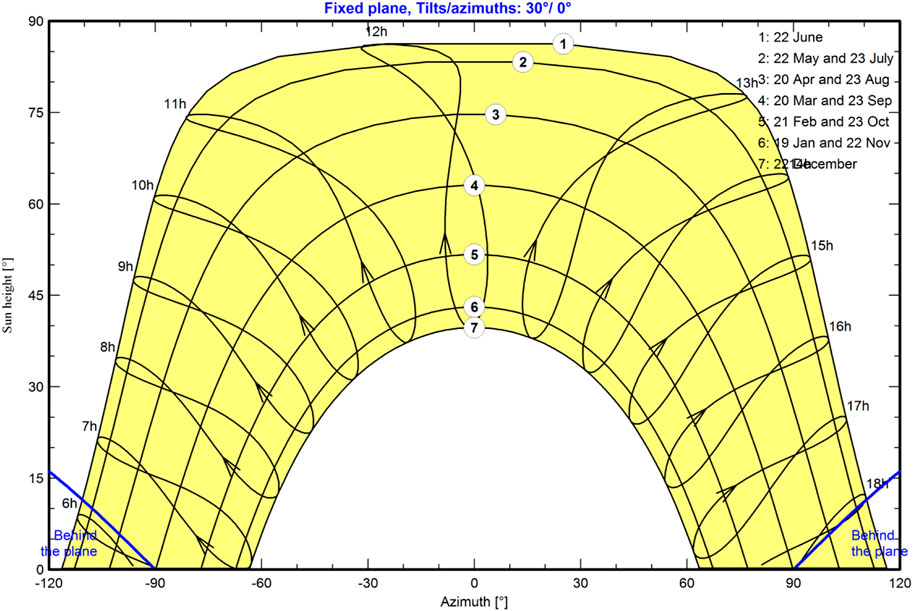
FIGURE 6. Sun paths height/azimuth plot within PV*Syst.
Figure 6 shows the variation of the Sun’s path throughout the year. During the peak winter days, say 22 December, the Sun’s azimuth varies from about −60° to+60° degrees, the Sun’s height is also shallow (about 35°), and the duration of the Sun also shines very low. But as we move toward summer, Sun azimuth spam is increasing, Sun height is also increasing, and the Sun shines for a longer duration. During the peak summer days, say 22 June, Solar azimuth varies from −120° to +120°, Sun height is also about 750, and Sun duration is very high. It has also been observed from the blue lining in the graph that the plant faces very slight shading in the summer session in the morning and evening. That is why we can say that the plant is not facing shading throughout the year.
7.2 Balances evaluation
Balances and their essential effects are demonstrated in Table 5, including the parameters like global radiation on a horizontal plane and ambient average temperature, global irradiation on a collector plane except for any optical alterations, and effective global photo voltaic radiation considering losses (soiling and shading). For the proposed site location, the global radiation on the horizontal plane is 1665.7 kWh/Sqm, and the annual global incident energy on the collector with no optical corrections and effective global radiation with optical losses are 1787.5 kWh/m2 and 1741.3 kWh/m2 respectively. The average diffused radiation is 907.86 kWh/Sq. m, whereas the average ambient temperature is 25.14°C. With this effective global photo voltaic radiation, annual DC electricity generated from the photovoltaic array and yearly AC electricity delivered into the grid is 147.52 MWh and 142.60 MWh, respectively. Here, the average performance ratio of the system is 0.783.
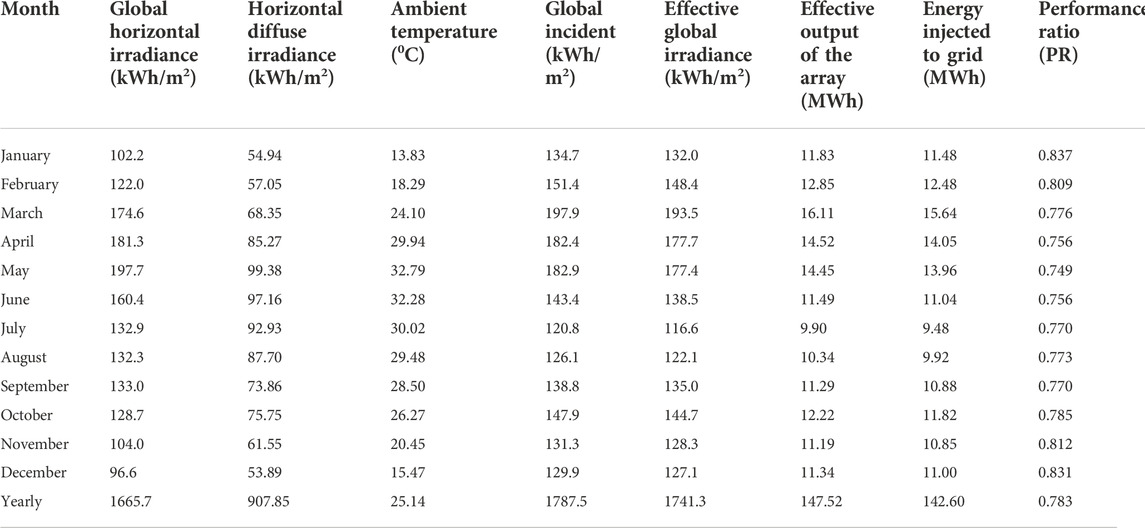
TABLE 5. PV*syst software results of
7.3 Computation of losses
Various losses had been computed from the simulation analysis, proven in Figure 7. These performance indicators are defined through the IEC 61724 standard (Baqir and Channi, 2021); these indicators are popular indications for observation of Photovoltaic plant performance. From Figure 7, it has been observed that the array capture loss of the plant is 0.93 h/day. System loss of the PV plant is 0.13 h/day, whereas produced beneficial electricity is 3.84 h/day.
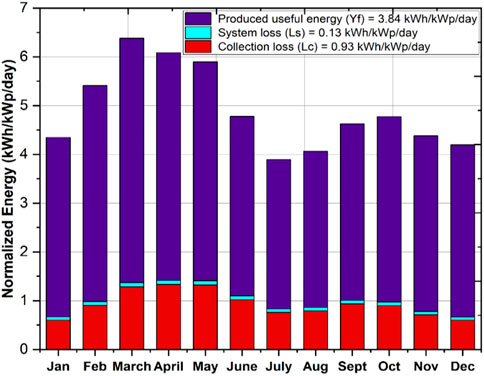
FIGURE 7. Various losses per installed
It can also be observed that the plant generates the highest electricity in the summer session, say April and May, but losses are also very high. In the rainy session, say July and August, the plant generates lesser electricity, but losses are slightly lower. In the winter session, say December and January, the plant generates medium electricity with the least losses. That is why we can say that in the summer session, losses are high due to temperature, whereas losses are less due to lower temperatures in the winter session.
7.4 Average yields
Various yield mentioned in Section 3.1 has been proven in Table 5 shows that the reference yield of the plant varies from 3.90 to 6.38 h/day, whereas the average reference yield is 4.90 h/day. The array yield of the plant varies from 3.13 to 5.10 h/day, whereas the average reference yield is 3.97 h/day. The average array capture loss goes 0.929. It has additionally been discovered that the final yield of the PV plant varies from 3.06 to 5.01 h/day, whereas the average final yield is 3.89 h/day.
7.5 Distributed grid electricity
The designed
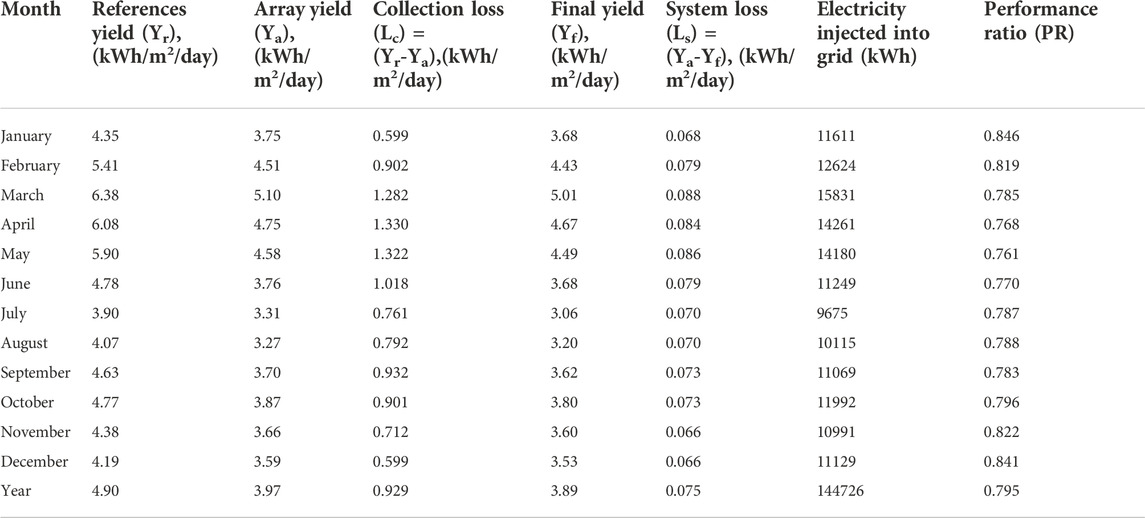
TABLE 6. Various yields of the proposed PV plant and electricity injected into the grid.
7.6 Overall performance Ratio
The overall performance ratio (PR) for the virtual hundred kW PV plant is 79.5%. The variation in overall performance ratio values on a month-to-month basis is proven in Figure 8. From Table 6, it can be observed that plant performance is lower in the summer and higher in the winter months.
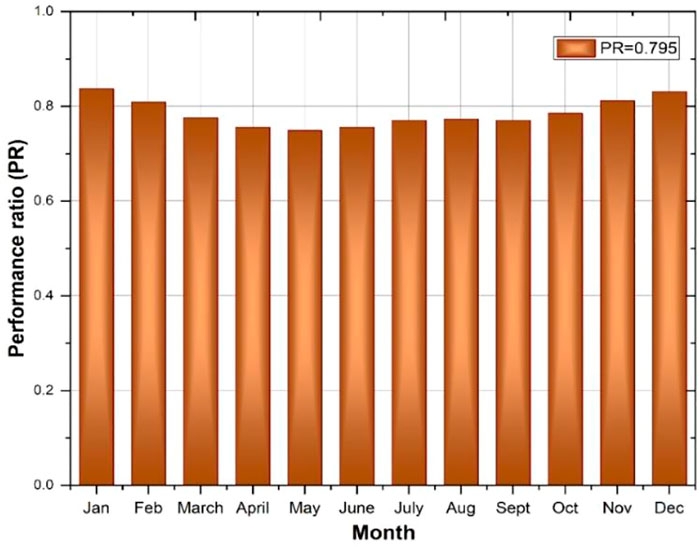
FIGURE 8. Overall performance ratio.
As described in Section 7.3, losses are least in the winter session, say December and January; hence performance ratio of the plant is also the highest. In the rainy session, say, July and August, losses are medium; hence performance ratio of the plant is also medium. In the summer session, say April and May, losses are the highest; therefore, the plant’s performance ratio is also the least. For this reason, plant performance does not depend on the plant’s power output but depends upon the plant’s performance.
7.7 Arrow loss evaluation
The arrow loss graph is considered in Figure 9, representing the number of losses in the plant. Global photo voltaic radiation on the horizontal plane is 1966 kWh/m2; however, the effective photo voltaic radiation on the collector is 1741 kWh/m2. When this effective irradiance falls on the surface of a photovoltaic module or array, electricity or electrical energy is produced. After the PV conversion, the nominal array energy at standard testing conditions (STC) is 177.6 MWh. The efficiency of the PV array at STC is 15.33%. The annual array’s virtual energy at MPP is 147.5 MWh. The various losses in this stage are 11.10% loss due to temperature, 0.65% loss due to light-induced degradation, 2.1% loss due to module array mismatch, and 0.99% ohmic wring losses. Available energy on an annual basis at the inverter output facility is 144.7 MWh, injected into the grid. Here two losses were possible, and one is inverter loss during inverter operation, i.e., 1.89% and inverter loss over nominal inv. power is 0.1%.
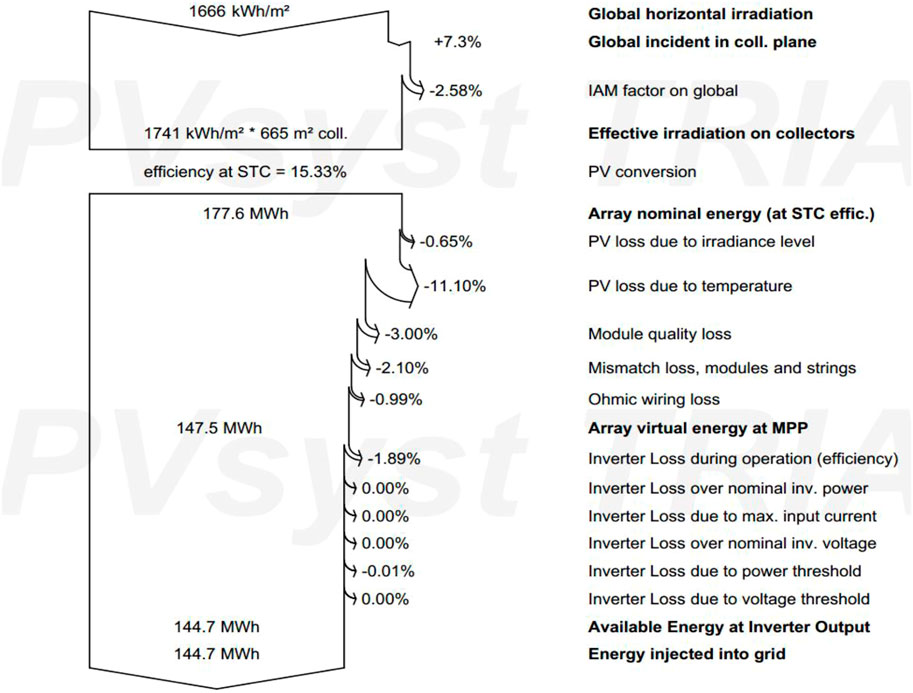
FIGURE 9. Arrow loss diagram of the PV plant.
8 Comparative results analysis
Proposed
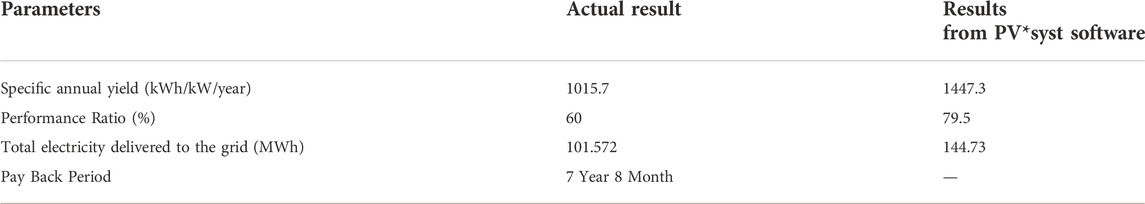
TABLE 7. Significant outcomes from the comparison.
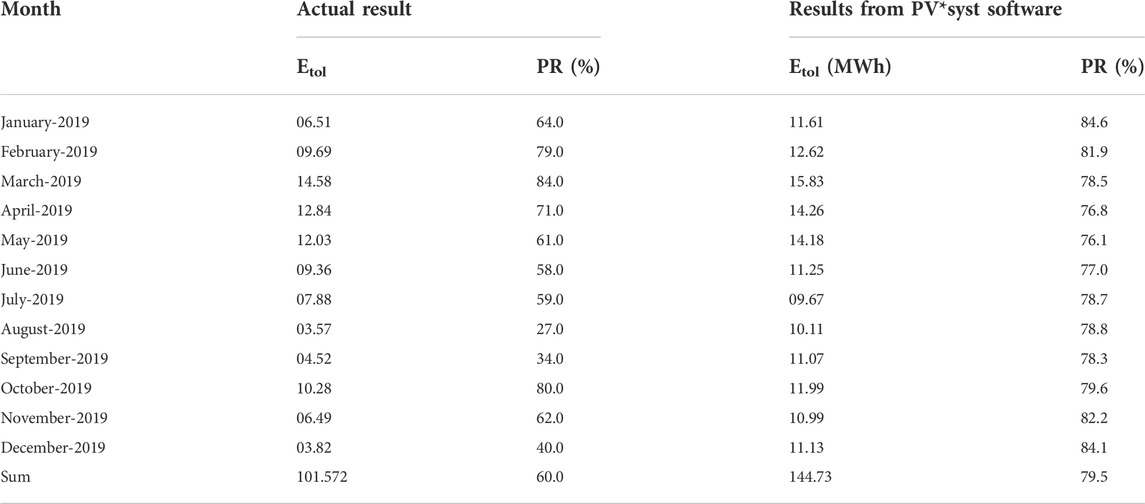
TABLE 8. Comparative analysis of power generation and performance ratio from actual
From Tables 6, 7, it is observed that the plant is working satisfactorily, and its specific annual yield is 1015.7 kWh/kW/year. From the software results, it has been observed that the plant can produce up to 1447.3 kWh/kW/year. The actual plant generates a total of 101.5 MWh of electricity in the observed year, whereas software predicts 144.7 MWh of electricity generation in a year. The actual plant’s monthly electricity generation varies from 14.58 MWh to 03.57 MWh according to the weather conditions, whereas software predicts monthly variation from 15.83 MWh to 09.67 MWh. The actual plant’s performance ratio is 60%, whereas a plant can achieve up to 79.5%performance ratio. The actual plant performance ratio varies from 84.0% to 27.0% according to the session and outages, whereas software predicts significantly less variation from 84.6% to 76.1%. The difference between software results and actual results are there because software predicts the results in ideal condition, whereas in the observation period, the plant was not run in an optimal scenario, and some outages occurred during the observation duration. The PV*syst software shows detailed losses that occurred in different conversion processes. From the economic investigation, it has been noticed that the simple payback duration of the PV plant is 7 years and 8 months, whereas discounted payback duration of the PV plant is 8 years and 9 months. From the calculations, it has also been found that the plant will save a total of 101.5-ton CO2 in its life cycle.
The benefit of the proposed PV plant is that it shows satisfactory results and does not require any extra land space for installation. As space is an essential aspect of the populated area as the land cost is very high. Hence, this study can be beneficial for the installation of small-scale or medium-scale grid-connected PV plants on the roof of any residential or commercial building. Such a project can be beneficial in reducing dependency on utility as electricity cost is increasing day by day and power is cut by the utility. Such a project can also be helpful in the enhancement of microgrid developments. As in a microgrid, the generation and local loads are near, which leads to energy saving; as in a microgrid, transmission loss is much less. With the installation of such projects, the consumer becomes a prosumer, which means the consumer consumes and produces the electricity.
9 Conclusion
The proposed 100
• The annual average
• The overall performance ratio ranges from 27 percent to 84 percent, with a yearly average value of 60%.
• The PV plant has delivered101.57
• The payback period of the PV plant is 7 years and 1 month.
• The present plant will save 101.5 tons of CO2 in its life cycle.
• From the software program comparison, it has been observed that for this site, we can attain up to 144.73
The actual system results have shown that a roof-mounted PV system can be very useful for developing DC and AC microgrids. Based on the case considered, the plant is able to meet 59% of the institute’s electricity needs without taking up any additional space. Additionally, the plant is both environmentally friendly and economically viable.
Further, the results of the system can be used to implement a large-scale solar plant. The study aims to gain a better understanding of the region and appropriate advanced technology. This will enable the planning and development of solar PV plants in northern India. Analyses of similar nature can be conducted at various locations, and the results can be compared with those obtained using other software. In the future, it will be possible to calculate performance evaluations for plants that receive shade. Ultimately, such a project can contribute to developing DC and AC multi-microgrids that can efficiently utilize PV energy.
Data availability statement
The original contributions presented in the study are included in the article/supplementary material, further inquiries can be directed to the corresponding author.
Author contributions
All authors listed have made a substantial, direct, and intellectual contribution to the work and approved it for publication.
Conflict of interest
The authors declare that the research was conducted in the absence of any commercial or financial relationships that could be construed as a potential conflict of interest.
Publisher’s note
All claims expressed in this article are solely those of the authors and do not necessarily represent those of their affiliated organizations, or those of the publisher, the editors and the reviewers. Any product that may be evaluated in this article, or claim that may be made by its manufacturer, is not guaranteed or endorsed by the publisher.
Acknowledgments
Open access funding is provided by the Qatar National Library.
References
Abdallah, R., Juaidi, A., Salameh, T., Jeguirim, M., Camur, H., Kassem, Y., et al. (2022). “Estimation of solar irradiation and optimum tilt angles for south-facing surfaces in the united Arab emirates: A case study using PVGIS and PVWatts,” in Recent advances in renewable energy technologies (Elsevier), 3–39. doi:10.1016/b978-0-12-823532-4.00004-5
Ahmad, F., Alam, M. S., and Alsaidan, I. S. (2020). “Campus microgrid: A case study,” in Proceedings of the IEEE Power Engineering Society Transmission and Distribution Conference, Chicago, IL, USA, 12-15 Oct. 2020, 1–6. doi:10.1109/TD39804.2020.9299998
Ahmad, F., and Alam, M. S. (2018). Economic and ecological aspects for microgrids deployment in India. Sustain. Cities Soc. 37, 407–419. doi:10.1016/j.scs.2017.11.027
Ahmad, F., and Alam, M. S. (2017). Feasibility study, design and implementation of smart polygeneration microgrid at AMU. Sustain. Cities Soc. 35, 309–322. doi:10.1016/j.scs.2017.08.007
Ahmad, F., and Alam, M. S. (2018). Optimal sizing and analysis of solar PV, wind, and energy storage hybrid system for campus microgrid. Smart Sci. 6 (2), 150–157. doi:10.1080/23080477.2017.1417005
Ahmad, F., Alam, M. S., and Shahidehpour, M. (2017). “Optimal placement of electric, hybrid and plug-in hybrid electric vehicles (xEVs) in Indian power market,” in Proceedings of the 2017 Saudi Arabia Smart Grid Conference, SASG, Jeddah, Saudi Arabia, 12-14 Dec. 2017, 1–7. doi:10.1109/SASG.2017.8356502
Amir, M., Prajapati, A. K., and Refaat, S. S. (2022). Dynamic performance evaluation of grid-connected hybrid renewable energy-based power generation for stability and power quality enhancement in smart grid. Front. Energy Res. 10. doi:10.3389/fenrg.2022.861282
Amir, M., and Haque, A. (2022). Intelligent based hybrid renewable energy resources forecasting and real time power demand management system for resilient energy systems. Sci. Prog. 105 (4). doi:10.1177/00368504221132144
Annual Weather Averages Near Lucknow Annual Weather Averages. Lucknow: Time and Date. Available at: https://www.timeanddate.com/weather/india/lucknow/climate (Accessed April 20, 2020).
Arora, R., Arora, R., and Sridhara, S. N. (2022). Performance assessment of 186 kWp grid interactive solar photovoltaic plant in Northern India. Int. J. Ambient Energy 43 (1), 128–141. doi:10.1080/01430750.2019.1630312
Asaad, M., Ahmad, F., Alam, M. S., and Das, G. (2017). “Automation of the grid: Indian initiatives,” in Proceedings of the 2017 IEEE International Conference on Technological Advancements in Power and Energy (TAP Energy), Kollam, India, 21-23 Dec 2017, 1–5. doi:10.1109/TAPENERGY.2017.8397227
Baqir, M., and Channi, H. K. (2021). Analysis and design of solar PV system using Pvsyst software. Mater. Today Proc. 48, 1332–1338. doi:10.1016/j.matpr.2021.09.029
Beckman, W. A., Broman, L., Fiksel, A., Klein, S. A., Lindberg, E., Schuler, M., et al. (1994). TRNSYS the most complete solar energy system modeling and simulation software. Renew. Energy 5 (1–4), 486–488. doi:10.1016/0960-1481(94)90420-0
Boddapati, V., Nandikatti, A. S. R., and Daniel, S. A. (2021). Techno-economic performance assessment and the effect of power evacuation curtailment of a 50 MWp grid-interactive solar power park. Energy sustain. Dev. 62, 16–28. doi:10.1016/j.esd.2021.03.005
Dahbi, H., Aoun, N., and Sellam, M. (2021). Performance analysis and investigation of a 6 MW grid-connected ground-based PV plant installed in hot desert climate conditions. Int. J. Energy Environ. Eng. 12 (3), 577–587. doi:10.1007/s40095-021-00389-x
Dalal, R., Bansal, K., and Thapar, S. (2021). Bridging the energy gap of India’s residential buildings by using rooftop solar PV systems for higher energy stars. Clean. Energy 5 (3), 423–432. doi:10.1093/ce/zkab017
DERC (2020). Tariff order - FY 2020-21. Lucknow, India: Uttar Pradesh Power Corporation Limited. Available at: https://www.upenergy.in/site/writereaddata/siteContent/202011131458233800Press English_FY2020-21.pdf.
Dobos, A. (2014). PVWatts version 5 manual - technical report NREL/TP-6A20-62641. Natl. Renew. Energy Lab. 5, 20. [Online]. Available: https://www.nrel.gov/docs/fy14osti/62641.pdf.
El Gindi, S., Abdin, A. R., and Hassan, A. (2017). Building integrated Photovoltaic Retrofitting in office buildings. Energy Procedia 115, 239–252. doi:10.1016/j.egypro.2017.05.022
Firat, Y. (2019). Utility-scale solar photovoltaic hybrid system and performance analysis for eco-friendly electric vehicle charging and sustainable home. Energy Sources Part A Recovery Util. Environ. Eff. 41 (6), 734–745. doi:10.1080/15567036.2018.1520354
Google (2022). Google earth. Lucknow, India: Google Earth. Available at: https://maps.app.goo.gl/ERwpyXDrYxxXaB7d7 (Accessed June 20, 2022).
IEC International Standard (1998). International Standard. Photovoltaic system performance monitoring – guidelines for measurement, data exchange and analysis. First Ed. Geneva, Switzerland: ISO, 1–21. [Online]. Available: https://law.resource.org/pub/in/bis/S05/is.iec.61724.1998.pdf.
Kavitha, M., Godwin Immanuel, D., Edwin Selva Rex, C. R., Meenakshi, V., Pushpavalli, M., Singari, S., et al. (2021). “Energy forecasting of grid connected roof mounted solar PV using PVSOL,” in Proceedings of the 2021 International Conference on Innovative Computing, Intelligent Communication and Smart Electrical Systems (ICSES), Chennai, India, 24-25 Sep. 2021. doi:10.1109/ICSES52305.2021.9633888
Luminous India(a) Solar panel 330W/24V poly. Available at: https://www.luminousindia.com/solar-panel-330w-24v-poly.html.
Luminous India(b) Solar on grid combo - 25 KW. Available at: https://www.luminousindia.com/solar-combo-25-kw-nxi.html.
Milosavljević, D. D., Pavlović, T. M., and Piršl, D. S. (2015). Performance analysis of A grid-connected solar PV plant in Niš, republic of Serbia. Renew. Sustain. Energy Rev. 44, 423–435. doi:10.1016/j.rser.2014.12.031
Minai, A. F., Usmani, T., Alotaibi, M. A., Malik, H., and Nassar, M. E. (2022). Performance analysis and comparative study of a 467.2 kWp grid-interactive SPV system: A case study. Energies 15 (3), 1107. doi:10.3390/en15031107
Peerapong, P., and Limmeechokchai, B. (2014). Investment incentive of grid connected solar photovoltaic power plant under proposed feed-in tariffs framework in Thailand. Energy Procedia 52, 179–189. doi:10.1016/j.egypro.2014.07.069
Pritam Satsangi, K., Bhagwan Das, D., Sailesh Babu, G. S., and Saxena, A. K. (2018). Performance analysis of grid interactive solar photovoltaic plant in India. Energy sustain. Dev. 47, 9–16. doi:10.1016/j.esd.2018.08.003
Psomopoulos, C. S., Ioannidis, G. C., Kaminaris, S. D., Mardikis, K. D., and Katsikas, N. G. (2015). A comparative evaluation of photovoltaic electricity production assessment software (PVGIS, PVWatts and RETScreen). Environ. Process. 2, S175–S189. doi:10.1007/s40710-015-0092-4
PVGIS (2012). Photovoltaic geographical information system. Ispra, Italy: EU Science Hub - European Commission. Available at: http://re.jrc.ec.europa.eu/pvg_download/map_index.html.
PVSyst (2020). PVSyst – logiciel photovoltaïque. Logiciel Photovoltaïque. Available at: https://www.pvsyst.com/ (Accessed April 27, 2020).
Rachit, S., and Vinod Kumar, G. (2016). Design of grid connected PV system using PVsyst. i-manager’s J. Electr. Eng. 10 (1), 14. doi:10.26634/jee.10.1.8195
Rao, S. N. V. B., Yellapragada, V. P. K., Padma, K., Pradeep, D. J., Reddy, C. P., Amir, M., et al. (2022). Day-ahead load demand forecasting in urban community cluster microgrids using machine learning methods. Energies 15 (17), 6124. doi:10.3390/en15176124
Shaikh, F. A., Alam, M. S., Asghar, M. S. J., and Ahmad, F. (2018). Blackout mitigation of voltage stability constrained transmission corridors through controlled series resistors. Recent Adv. Electr. Electron. Eng. Former. Recent Pat. Electr. Electron. Eng. 11 (1), 4–14. doi:10.2174/2352096510666171108160930
Shamami, M. S., Alam, M. S., Ahmad, F., Shariff, S. M., AlSaidan, I., Rafat, Y., et al. (2020). Artificial intelligence-based performance optimization of electric vehicle-to-home (V2H) energy management system. SAE Int. J. Sustain. Transp. Energy, Environ. Policy 1 (2), 1–11. doi:10.4271/13-01-02-0007
Shariff, S. M., Alam, M. S., Ahmad, F., Rafat, Y., Asghar, M. S. J., and Khan, S. (2019). System design and realization of a solar-powered electric vehicle charging station. IEEE Syst. J. 14, 2748–2758. doi:10.1109/jsyst.2019.2931880
Sharma, A., Srivastava, K., and Kar, S. K. (2015). Jawaharlal Nehru national solar mission in India. Green Energy Technol. 201, 47–67. doi:10.1007/978-81-322-2337-5_3
Sharma, R., and Goel, S. (2017). Performance analysis of a 11.2 kWp roof top grid-connected PV system in Eastern India. Energy Rep. 3, 76–84. doi:10.1016/j.egyr.2017.05.001
Sherwani, A. F., Usmani, J. A., and Varun, G. (2010). Life cycle assessment of solar PV based electricity generation systems: A review. Renew. Sustain. Energy Rev. 14 (1), 540–544. doi:10.1016/j.rser.2009.08.003
Shiva Kumar, B., and Sudhakar, K. (2015). Performance evaluation of 10 MW grid connected solar photovoltaic power plant in India. Energy Rep. 1, 184–192. doi:10.1016/j.egyr.2015.10.001
Shrivastava, A., Sharma, R., Kumar Saxena, M., Shanmugasundaram, V., Lal Rinawa, M., and Ankit, (2021). Solar energy capacity assessment and performance evaluation of a standalone PV system using PVSYST. Mater. Today: Proc. doi:10.1016/j.matpr.2021.07.258
Srivastava, R., Tiwari, A. N., and Giri, V. K. (2020). An overview on performance of PV plants commissioned at different places in the world. Energy Sustain. Dev. 54, 51–59. doi:10.1016/j.esd.2019.10.004
Tarigan, E., Djuwari, , , and Kartikasari, F. D. (2015). Techno-economic simulation of a grid-connected PV system design as specifically applied to residential in surabaya, Indonesia. Energy Procedia 65, 90–99. doi:10.1016/j.egypro.2015.01.038
Tripathi, B., Yadav, P., Rathod, S., and Kumar, M. (2014). Performance analysis and comparison of two silicon material based photovoltaic technologies under actual climatic conditions in Western India. Energy Convers. Manag. 80, 97–102. doi:10.1016/j.enconman.2014.01.013
Turney, D., and Fthenakis, V. (2011). Environmental impacts from the installation and operation of large-scale solar power plants. Renew. Sustain. Energy Rev. 15 (6), 3261–3270. doi:10.1016/j.rser.2011.04.023
Umar, N., Bora, B., Banerjee, C., and Panwar, B. S. (2018). Comparison of different PV power simulation softwares: Case study on performance analysis of 1 MW grid-connected PV solar power plant. Int. J. Eng. Sci. Invent. 7 (7), 11–24. [Online]. Available at: https://www.researchgate.net/profile/Birinchi-Bora/ publication/326919529_Comparison_of_different_PV_power_simulation_softwares_ case_study_on_performance_analysis_of_1_MW_grid-connected_PV_solar_power_ plant/links/5b6c40a545851546c9f930ee/Comparison-of-diff.
Upadhyay, S. P., and Singh, U. (2021). “Jawaharlal Nehru national solar mission: A critical analysis of evolution and challenges,” in New Research Directions in Solar Energy Technologies (Singapore: Springer), 11–30. doi:10.1007/978-981-16-0594-9_2
Wang, J., He, X., and Deng, Y. (1999). Introducing software architecture specification and analysis in SAM through an example. Inf. Softw. Technol. 41 (7), 451–467. doi:10.1016/S0950-5849(99)00009-9
XE Currency Converter (2022). 1 VND to USD - convert Vietnamese dongs to US dollars. Available at: https://www.xe.com/currencyconverter/convert/?Amount=1&From=VND&To=USD (Accessed July 8, 2022).
Yenneti, K. (2016). The grid-connected solar energy in India: Structures and challenges. Energy Strategy Rev. 11–12, 41–51. doi:10.1016/j.esr.2016.06.002
Zaghba, L., Khennane, M., Fezzani, A., Borni, A., and Mahammed, I. H. (2022). Experimental outdoor performance evaluation of photovoltaic plant in a Sahara environment (Algerian desert). Int. J. Ambient Energy 43 (1), 314–324. doi:10.1080/01430750.2019.1636865
Zarzavilla, M., Quintero, A., Abellán, M. A., Serrano, F. L., Austin, M. C., and Tejedor-Flores, N. (2022). Comparison of environmental impact assessment methods in the assembly and operation of photovoltaic power plants: A systematic review in the castilla—La mancha region. Energies 15 (5), 1926. doi:10.3390/en15051926
Nomenclature
$ Dollar Currency
Keywords: solar energy, electricity, capacity, growth, renewable energy, energy consumpion, clean energy, grid connected-photovoltaic system
Citation: Srivastava R, Amir M, Ahmad F, Agrawal SK, Dwivedi A and Yadav AK (2022) Performance evaluation of grid connected solar powered microgrid: A case study. Front. Energy Res. 10:1044651. doi: 10.3389/fenrg.2022.1044651
Received: 14 September 2022; Accepted: 18 October 2022;
Published: 24 November 2022.
Edited by:
Sudhakar Babu Thanikanti, Chaitanya Bharathi Institute of Technology, IndiaReviewed by:
Mobi Mathew, Rajiv Gandhi Institute of Petroleum Technology, IndiaAneesh A. Chand, University of the South Pacific, Fiji
Copyright © 2022 Srivastava, Amir, Ahmad, Agrawal, Dwivedi and Yadav. This is an open-access article distributed under the terms of the Creative Commons Attribution License (CC BY). The use, distribution or reproduction in other forums is permitted, provided the original author(s) and the copyright owner(s) are credited and that the original publication in this journal is cited, in accordance with accepted academic practice. No use, distribution or reproduction is permitted which does not comply with these terms.
*Correspondence: Furkan Ahmad, ZnVhaG1hZEBoYmt1LmVkdS5xYQ==