 Xialei Zhang
 Da Chang
 Xuening Liao
- 1School of Computer and Information Technology, Shanxi University, Taiyuan, Shanxi, China
- 2School of Computer Science, Shaanxi Normal University, Xi’an, Shaanxi, China
- 3Shaanxi Key Laboratory for Network Computing and Security Technology, Xi’an, Shaanxi, China
As an important branch of the Internet of Things, the smart grid has become a crucial field of modern information technology. It realizes the two-way information flow and power flow by integrating the advanced metering infrastructure (AMI) and distributed energy resources, which greatly improves users’ participation. However, owing to smart meters, the most critical components of AMI, are deployed in an open network environment, AMI is a potential target for data integrity attacks. Among various attack types, the scaling attack is the most typical one, because it can be used as a general expression for most of other ones. By launching a scaling attack, adversaries can randomly reduce hourly reported values in smart meters, thereby causing economic losses. A number of research efforts have been devoted to detecting data integrity attacks. Nonetheless, most of the existing investigations focus on all attack types, and little attention has been paid to a detection strategy specially designed for scaling attacks. Our contribution addresses this issue in this paper and hence, developing a detection model of scaling attacks considering consumption pattern diversity (SA2CPD), to ensure that scaling attacks can be effectively detected when users have multiple consumption patterns. To be specific, we leverage Kmeans to distinguish different consumption patterns, and then the consumption intervals can be extracted to binarize the data. We divide time periods in every day into two categories based on the binarization values, and use one of them with the greatest information gain to construct a decision tree for judgment. Both theoretical and simulation results based on the GEFCom2012 dataset show that our SA2CPD model has a higher F1 score than the decision tree model without considering consumption pattern diversity, the KNN model and the Naive Bayes model.
1 Introduction
The traditional power grid has a history of more than 100 years. Owing to its disadvantages of one-way information flow, low user participation, etc., it has gradually been unable to adapt to the modern society. As a consequence, the smart grid emerges as the times require, which not only incorporates renewable energy resources such as solar energy and wind energy to support multiple energy supply, but also integrates the advanced metering infrastructure (AMI) to control the power layer, realizing the two-way flow of information and power (Zanetti et al., 2019; Rouzbahani et al., 2020; Choi et al., 2021; Sarenche et al., 2021; Chaudhry et al., 2022; Huang et al., 2022; Park et al., 2022). Specifically, smart meters which play a vital role in AMI are deployed in demand sides, i.e., users, to collect and upload information about power consumption and supply to the utility. The utility then makes decisions on real-time pricing, and energy scheduling, among others, based on the uploaded information, and then feeds back the decisions to guide users supply and consume electricity smartly (Singh et al., 2017; Zheng et al., 2018; Choi et al., 2021; Chaudhry et al., 2022; Huang et al., 2022; Park et al., 2022; Verma et al., 2022). However, as smart meters are deployed in an open network environment, they are vulnerable to data integrity attacks, by launching which an adversary can seriously endanger the safe operation of the smart grid through tampering with the information in smart meters (Jokar et al., 2016; Hu et al., 2019; Jakaria et al., 2019; Yao et al., 2019; Zheng et al., 2019; Rouzbahani et al., 2020; Tehrani et al., 2020; Bhattacharjee and Das, 2021; Singh and Mahajan, 2021; Sun et al., 2021; Yan and Wen, 2021; Chaudhry et al., 2022; Mudgal et al., 2022; Verma et al., 2022). Therefore, the research on data integrity attacks detection is of significant importance and has become a research hotspot in the field of the smart grid (Jokar et al., 2016; Zheng et al., 2019; Tehrani et al., 2020; Ibrahem et al., 2021).
Recently, much work has been conducted on the detection for data integrity attacks in AMI, which is mainly divided into three categories (Jiang et al., 2014; Jokar et al., 2016; Yao et al., 2019), including state-based (Huang et al., 2013; Salinas et al., 2014; Leite and Mantovani, 2018; Lo and Ansari, 2013; McLaughlin et al., 2013; Aziz et al., 2020; Bhattacharjee et al., 2021b,a), game theory-based (Cardenas et al., 2012; Yang et al., 2016; Wei et al., 2018, 2017; Paul et al., 2020) and classification-based (Jokar et al., 2016; Singh et al., 2017; Ismail et al., 2018; Yeckle and Tang, 2018; Zheng et al., 2018; Fernandes et al., 2019; Jakaria et al., 2019; Punmiya and Choe, 2019; Zheng et al., 2019; Rouzbahani et al., 2020; Tehrani et al., 2020; Yan and Wen, 2021). As a result of the popularity of artificial intelligence technologies, the feasibility of machine learning to detect attacks in AMI has attracted much attention of a large number of researchers. Therefore, classification-based detection has gradually become a mainstream technology. For example, Jokar et al. (Jokar et al., 2016) proposed a data integrity attacks detection model based on SVM. They compared the reported total consumption value with the actual total consumption value to find out the suspicious area, and then used the historical data and synthetic attack data to train SVM. Tehrani et al. (Tehrani et al., 2020) took sampling values of 24 h and their mean, standard deviation, minimum and maximum values as features. Firstly, they used Kmeans for clustering, and then generated false data according to the synthetic attack method proposed in the literature (Jokar et al., 2016) to construct a complete dataset for training and testing the decision tree, random forest and gradient boosting. Nevertheless, the existing studies all have the problem of dealing with different attack types indiscriminately, but different attacks have different characteristics, and there is currently no algorithm that can contrapuntally detect scaling attacks. Thus, it is vital to design a detection model specially for scaling attacks.
To fill this gap, in this paper we propose a detection model of scaling attacks considering consumption pattern diversity in AMI (SA2CPD). Compared with existing schemes which deal with all attack types indiscriminately, our SA2CPD model focuses on the scaling attack only, as the scaling attack is a typical data integrity attack. The reason is that the scaling attack can not be easily judged by manual methods, and can be used as a generalization of several other attack types. In addition, we also consider consumption pattern diversity of users caused by living conditions, work and rest habits, etc. Specifically, we first leverage the clustering technology to differentiate different consumption patterns and extract consumption intervals. Then the data are discretized by binarization on the basis of consumption intervals, which can distinguish normal data from false data. Finally, the discretized data are used as the input of the decision tree. In this step, we divide the 24 time periods of a day into two categories, and the decision tree makes judgement in accordance with one of the two corresponding to the time periods with the greatest information gain, to successfully detect the false data injected by scaling attacks.
To further validate the effectiveness and efficiency of our SA2CPD model, we conduct a performance simulation based on the GEFCom2012 dataset (Hong, 2014). The consumer in our experimental scenario has three different consumption patterns, and each pattern has 1,586 data. We use the widely adopted criteria as comparison metrics including the False Positive Rate (FPR), False Negative Rate (FNR) and F1 score, which can comprehensively measure the recall and the precision. We design two experiments. In the first experiment, we test the performance of our model when the proportion of false data in the test set is varied from 10% to 80%. The result verifies the effectiveness of our detection model and is accord with our theoretical analysis. In the second experiment, through the comparative experiments with the decision tree model without considering consumption pattern diversity, the KNN model and the Naive Bayes model, the results show that our model is more efficient. For example, when the attack proportion is 50%, our FPR and FNR are 0.2% and 6.78%, and the F1 score is 96.38%, while those of the Naive Bayes model are 0.18%, 11% and 94% respectively, and those of the KNN model are 0.02%, 13% and 92.96%.
The remainder of the paper is organized as follows: In Section 2, we present the network and threat models, and then briefly describe the related machine learning algorithms. In Section 3, we present the detailed design of our SA2DCP model. In Section 4, we describe the metrics and conduct performance analysis in comparison with the decision tree model without considering consumption pattern diversity, the KNN model and the Naive Bayes model. In Section 5, we show experimental results to validate the effectiveness and efficiency of SA2CPD model. In Section 6, we discuss other related issues. Related literature is reviewed in Section 7. Finally, we conclude the paper in Section 8.
2 Preliminary
In this section, we first present the network and threat models and then briefly introduce the Kmeans and decision tree model used in SA2CPD.
2.1 Network models
AMI plays a crucial role in the smart grid and greatly promotes the intelligence of the power grid. As shown in Figure 1, AMI consists of smart meters, i.e., SM1-SM4, data concentrators (DC), the utility and communication networks between them (Jiang et al., 2014; Huang et al., 2022). The communication networks in AMI enable the smart grid to realize the two-way flow of information. Specifically, the smart meter, domestic appliances and distributed renewable equipments in a user’s home form a home area network (HAN). The smart meter is responsible for collecting the consumption and supply information of domestic appliances and renewable equipments. A neighborhood area network (NAN) consists of a data concentrator and adjacent smart meters. The DC collects the information from all smart meters in the NAN over wireless networks, and then forwards it to the utility through wired networks such as optic fiber in the wide area networks (WAN). Based on the received information, the utility makes decisions such as the time-of-use price, the optimal electricity plan which are conducive to the operation of the smart grid, and finally feeds back the decisions to users. Users can view the feedback information through smart meters and conduct corresponding power supply or consumption. For example, a supply-user determines his optimal power supply according to the decision information and a demand-user decides when to use electricity to save money according to the real-time price.
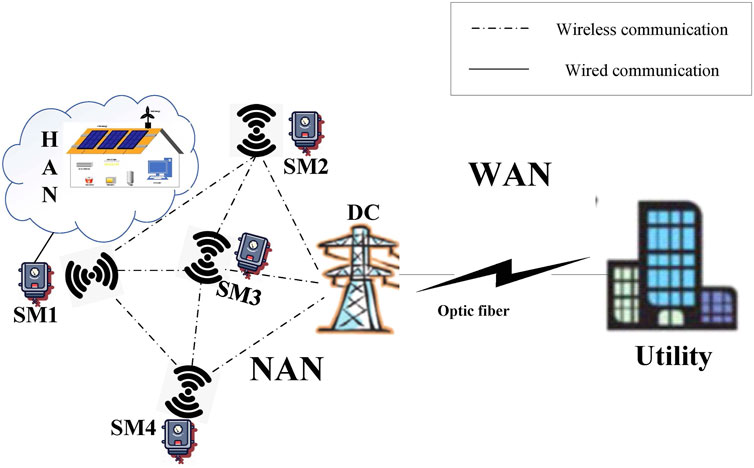
FIGURE 1. The architecture of AMI.
2.2 Threat models
Data integrity attacks in AMI mainly include six types (Jokar et al., 2016; Hu et al., 2019; Zanetti et al., 2019; Zheng et al., 2019; Yan and Wen, 2021) from h1 to h6 formalized as
h1 represents contaminating the hourly reported value of meters through multiplying by a same random number. h2 represents that adversaries control a smart meter to report its measured values as 0 for a certain duration. h3 represents manipulating the hourly reported value of meters through multiplying by a different random number. h5 expresses reporting values of meters as the mean value of a day. h4 multiplies each reported value by a different random number on the basis of h5. h6 reverses the order of reported values of the meter in a day. We divide these six attack types into two categories, Category 1 and Category 2. Category 1 is that the damage is caused by the reduction of the reported total consumption including h1 − h4, and Category 2 is that the total amount remains unchanged including h5 and h6. Because the majority of the attack types are caused by changing the reported total consumption, we focus on Category 1, namely h1 − h4. Furthermore, the damage of h2 is extremely obvious and the effects of h1 and h4 can be represented by h3. Therefore, we focus on h3 and name it the scaling attacks.
2.3 Kmeans
Kmeans is one of the most commonly used methods in clustering, which can achieve the best distinction between classes based on the similarity of distances between points (Jain, 2010). The goal of the Kmeans is to divide a dataset into k classes, so that each point is closest to the center of the class it belonged to. After all points are divided once, the class center is recalculated according to points within each class, and then iteratively assign points and update the class center until it no longer changes.
2.4 Decision tree
The decision tree is a popular algorithm often used to classify or regress data, which learns a large number of training samples to construct a tree and judges the selected features in the tree in turn, so as to determine the label of samples (Safavian and Landgrebe, 1991). A decision tree consists of a root node, internal nodes and leaf nodes. The predictions for all samples are judged sequentially from the root node. After a series of judgments in internal nodes, the marked results can be obtained at the leaf node. The judgement from the root node to the leaf node is a process in which the uncertainty of information is continuously reduced.
It is how to select the most appropriate features to make use of the least judgment to draw a conclusion, so as to avoid the decision tree being too large, that is the most important thing in the process of constructing a decision tree. Decision trees use information gain to minimize the uncertainty of information (i.e., information entropy) in each judgment, which can be formalized as
In Eq 2, g(D, A) is the information gain of feature A to dataset D, H(D) is the information entropy of dataset D before judgment, and H (D|A) is the empirical conditional entropy of D when the feature A is given. All notations used in this paper are defined in Table 1. It is worth noting that the tth time period represents the (t − 1)th hour to the tth hour.
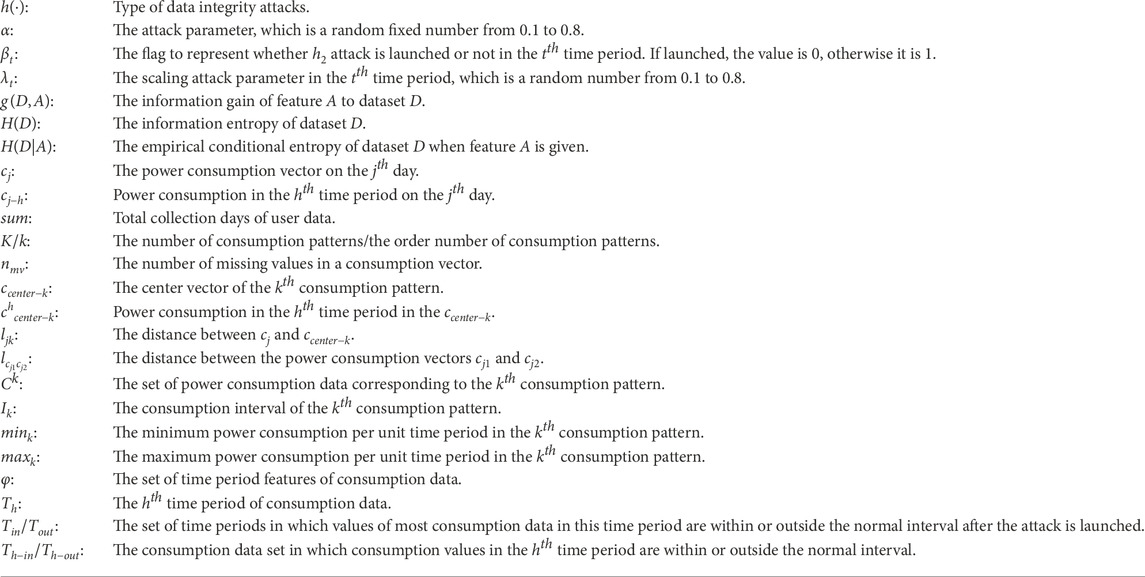
TABLE 1. Notations.
3 The detection model of scaling attacks considering consumption pattern diversity in AMI
In this section, we first present the basic idea of the proposed detection model of scaling attacks considering consumption pattern diversity in AMI (SA2CPD). Then, we show details of the SA2CPD.
3.1 Basic idea
Recall that adversaries will randomly inject reduced values into original data when launching scaling attacks, so we can distinguish normal data from false data as long as we find power consumption intervals of the original normal data and use these intervals as the boundary. Moreover, due to the differences in living conditions, work and rest habits, etc., each user has different electricity consumption patterns, so clustering need to be performed before classification to find multiple normal intervals of the original data. After that, we use intervals to binarize the data so that all values are 0 or 1. Finally, the binarized data is involved in training and classification judgment. Based on the above statement, our SA2CPD consists of the following three steps. First, find out k consumption patterns by clustering and then extract consumption intervals. Second, generate false data on the basis of the scaling attack model, h3 (xt), described in Section 2.2, and then discretize the data. Finally, use the discretized data as the input of the classifier for detection.
In order to achieve better performance, we leverage Kmeans for clustering and the decision tree for classification, and propose a detection model of scaling attacks considering consumption pattern diversity in AMI (SA2CPD). Algorithm 1 shows the specific implementation process, which consists of four steps: i) data preprocessing; ii) distinguishing different consumption patterns and extracting consumption intervals; iii) binarization and iv) classification.
3.2 Our method
3.2.1 Data preprocessing
This step corresponds to lines 1–12 in Algorithm 1. Power consumption collected by the smart meter deployed on the user side can be represented as a matrix
3.2.2 Distinguish consumption patterns
This step corresponds to lines 13–14 in Algorithm 1. Affected by personal habits, holidays and other factors, each user has different power consumption patterns, and the power consumption patterns of different users are also different from each other. Therefore, it is necessary to cluster the power consumption data before classification to reduce the false negative rate. There are various methods that can be used to distinguish power consumption patterns, here we use the Kmeans method, which is the most commonly used in clustering (Jokar et al., 2016; Tehrani et al., 2020).
The implementation of Kmeans clustering is an iterative process including three steps. First step, K vectors are randomly selected from c as centers of initial consumption pattern sets ccenter = [ccenter−1, ccenter−2 ccenter−k ccenter−K]. Second step, for each cj, calculate the distance between it and each ccenter−k as
where ccenter−k represents the center of the kth consumption pattern,
where
Notice that the random selection of initial centers may result in a local optimal solution rather than a global optimal solution. Therefore, we take advantage of the characteristic that there is no intersection between different consumption patterns to set filter conditions to exclude local optimal solutions, which can be formalized as
Here, mini (i = s, t) and maxi (i = s, t) represent the minimum and maximum values of power consumption per unit time period in the ith consumption pattern.
3.2.3 Binarization
This step corresponds to lines 15–28 in Algorithm 1. When detecting data integrity attacks, it is necessary to analyze the difference between normal data and false data. Here, we leverage the binarization method to transform fine granularities into coarse granularities to make the difference of features larger to improve detection efficiency.
We can extract K corresponding intervals of K consumption patterns as I = [I1, I2…Ik…IK], where
In Eq. 7, Ik represents the interval of the kth consumption pattern set.
After extracting consumption intervals, false data is generated through multiplying each
For each
3.2.4 Classification
This step corresponds to lines 29–43 in Algorithm 1. Let φ = [T1, T2…Th…T24] represents 24 time periods of a power consumption vector. For normal data, values of all 24 time periods are within I, so all values are binarized to 0. For false data, although there are some values within I, most of values are outside I, as shown in Figure 2.
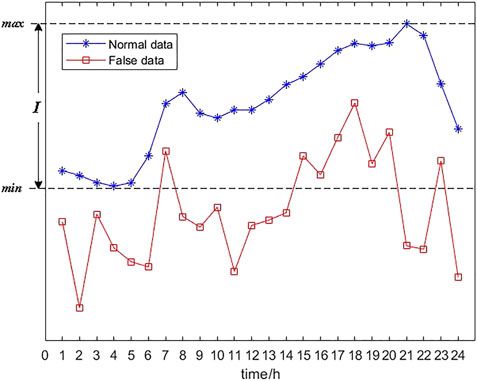
FIGURE 2. False data vs. normal data.
Figure 2 shows the comparison between normal data and false data. It can be seen that only values in eight time periods in false data including 7, 15, 16, 17, 18, 19, 20 and 23 are greater than the minimum value of normal data. Let Tin and Tout represent the set of time periods in which most values in this period in power consumption vectors are within or without I after the attack is launched. For the decision tree, the empirical conditional entropy of time period Th to dataset D is denoted as
where i indicates the value of power consumption after binarization in the time period T which is 0 or 1, l is a flag representing whether the power consumption vector is normal (denoted as 0) or false (denoted as 1), Di is the set of power consumption vector when its value in the time period T is i, Dil is the set of power consumption vector when its value in the time period T is i and the flag is l, |.| represents the quantity of power consumption vectors in a set. The object of constructing a decision tree is to find the time period with the greatest information gain, which can be formalized as
It is also equivalent to
For the time period in Tin, as the number of power consumption data (vectors) increases, we have
If the dataset is balanced, we can derive that
Hence, on the basis of Eqs 9, 12, 13, when Th ∈ Tin, we can obtain that
For the time period in Tout, as the number of power consumption data (vectors) increases, we have
If the dataset is balanced, we can derive that
Hence, on the basis of Eqs 9, 15, 16, when Th ∈ Tout, we can obtain that
Therefore, from Eqs 11, 14, 17, we know that a decision tree should be constructed based on power consumption during time periods in Tout and those of time periods in Tin will not be adopted, which can maximize information gain and avoid the decision tree being too large. For example, after the scaling attack is launched, power consumption in time periods 1–6 are outside I with the greatest probability, because these time periods usually belong to valley time periods for many users. Therefore, time periods 1–6 belong to Tout, based on which the decision tree shown in Figure 3 can be constructed. When a new power consumption vector is collected, the judgement will be made from the root node to a leaf node. For example, if binarization values in time periods 1–6 are [0,1,0,0,1,0], it will be detected as false data after judgements in Step 1, Step 2 and Step 3.
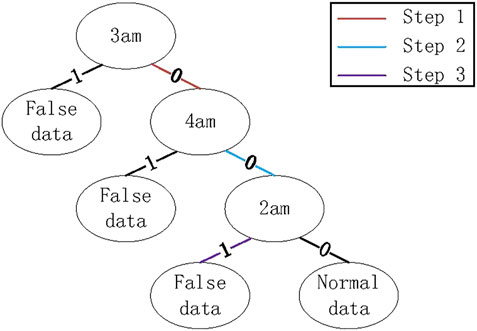
FIGURE 3. Decision tree generated by consumption data.
4 Detection performance analysis
In this section, we first introduce metrics of detection performance, and then show comparison analysis with other models.
4.1 Metrics
We use the FPR, the FNR and the F1 score as metrics to compare with other algorithms (Amara korba and El Islemkarabadji, 2019; Jakaria et al., 2019; Rouzbahani et al., 2020). The higher the F1 score is, the lower the FPR and FNR are, the better the performance is. Relevant notations are given below.
(1) TP/TN/FP/FN: False data is detected as false data/normal data is detected as normal data/normal data is detected as false data/false data is detected as normal data.
(2) Recall (Rec): The ratio of the number of false data being detected as false data versus the total number of false data, meaning that
(3) FNR: The ratio of the number of false data being detected as normal data versus the total number of false data, meaning that
(4) Precision (Pre): The ratio of the number of false data being detected as false data versus the total number of data being detected as false data, meaning that
(5) FPR: The ratio of the number of normal data being detected as false data versus the total number of normal data, meaning that
(6) F1 Score: The harmonic average of Precision and Recall, which is
4.2 Comparison with other models
4.2.1 SA2CPD VS. models without considering consumption pattern diversity
Different from our SA2CPD model in Section 3, in which clustering is performed first to obtain multiple power consumption patterns, and then consumption intervals can be extracted as the basis for binarization. When consumption pattern diversity is not considered, all power consumption data of users are regarded as belonging to a single pattern, in which case only a known value can be selected as the threshold. Here we discuss two models with the minimum value and the mean value as thresholds and we call them as B-MIN Model and B-MEAN Model.
4.2.1.1 Binarization based on the minimum value (B-MIN model)
Compared with the B-MIN model, performance of our SA2CPD model is better in terms of the FNR and the F1 score, as shown in Theorem 1.
4.2.1.2 Binarization based on the minimum value (B-MIN model)
Compared with the B-MEAN model, performance of our SA2CPD model is better in terms of the FPR, the FNR and the F1 score, as shown in Theorem 2.
4.2.2 Decision tree VS. Naive Bayes
The reason why we choose the decision tree as the classifier is that the binarization can help the decision tree discretize continuous values and can make a great difference between normal data and false data. Similarly, Naive Bayes can also use the binarization method to improve the detection efficiency. However, it is only suitable to the situation where the distribution of power consumption data of each pattern is concentrated. When the distribution of power consumption data of each pattern is scattered, compared with the Naive Bayes model, performance of our SA2CPD model is better in terms of the FNR and the F1 score, as shown in Theorem 3.
4.2.3 Decision tree VS. KNN
After the adversary launches the scaling attack, values in the power consumption vector will be reduced, resulting in a distance between false data and normal data. Hence, KNN can be used to detect scaling attacks whose classification is according to the distance. However, compared with the KNN model, performance of our SA2CPD model is better in terms of the FNR and the F1 score, as shown in Theorem 4.
5 Performance evaluation
In this section, we first introduce the simulation setup. We then show experimental results to validate the effectiveness and efficiency of the SA2CPD.
5.1 Evaluation setup
In our evaluation, the GEFCom2012 dataset (Hong, 2014) from the global energy forecasting competition was used to carry out the performance validation of our SA2CPD model. The dataset includes historical records of hourly collected power consumption in 20 zones from 1 January 2004 to 30 June 2008. Each record includes 28 columns. The first column is zone_id, the second to fourth columns are year, month and day, and the fifth to 28th columns are 24 hourly collected power consumption values. There are no missing values in the dataset. By extracting three zones with large power consumption differences, we simulate a user with three power consumption patterns and there are 1,586 power consumption vectors in each consumption pattern. We set the ratio of training set to test set as 7: 3 and 854 power consumption vectors are taken from each consumption pattern to generate false data for training. Hence, the size of the training set is 5,124 and the size of the testing set is 2,196.
Based on the above simulation settings, we conduct two experiments, each of which includes 500 random evaluation cases. In the first experiment, we evaluate performance of our SA2CPD model under different attack proportions. In the second experiment, we conduct two groups of comparative experiments. Firstly, our SA2CPD model is compared with the decision tree without considering consumption pattern diversity. Then we compare our SA2CPD model with the KNN model and the Naive Bayes model mentioned in Section 4.
5.2 Effectiveness of our SA2CPD model
Figure 4 illustrates the FPR, the FNR and the F1 score of our SA2CPD model under different attack proportions. As shown in this figure, when the attack proportion in the testing set increases from 10% to 80%, the F1 score are [ 95.7%, 96.23%, 96.32%, 96.4%, 96.38%, 96.41%, 96.46%, 96.52% ], the FPR are [ 0.18%, 0.20%, 0.18%, 0.20%, 0.20%, 0.19%, 0.19%, 0.20% ], and the FNR are [ 6.69%, 6.51%, 6.69%, 6.63%, 6.78%, 6.79%, 6.75%, 6.67% ]. Hence, regardless of the attack proportion, our SA2CPD model has a high F1 score, a low FPR and a low FNR, validating the effectiveness of our SA2CPD model.

FIGURE 4. Performance of SA2CPD under different attack proportions.
5.3 Comparison with the B-MIN model and the B-MEAN model
Figure 5 depicts the FPR of our SA2CPD model, the B-MIN model and the B-MEAN model. It can be seen from the figure that the FPR of the B-MIN is the lowest, followed by our method. Both of them are lower than 0.5% and the difference between them is very small. However, the FPR of the B-MEAN is over 60%. Figure 6 depicts the FNR of our SA2CPD model, the B-MIN model and the B-MEAN model. It can be seen that the B-MEAN has the lowest FNR, followed by our method. Similarly, the difference between them is small. However, the FNR of the B-MIN is over 80%. The above experimental results are consistent with our analysis in 4.2.1.
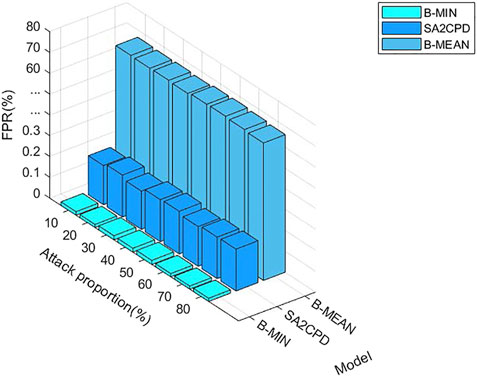
FIGURE 5. The FPR of our SA2CPD model, the B-MIN model and the B-MEAN model under different attack proportions.
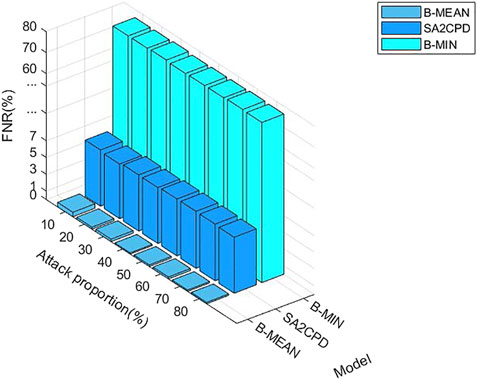
FIGURE 6. The FNR of our SA2CPD model, the B-MIN model and the B-MEAN model under different attack proportions.
Figure 7 shows F1 score of our SA2CPD model, the B-MIN model and the B-MEAN model. As can be seen from figure, the F1 score of the B-MIN model is less than 50%, and it is almost unchanged with the increase of attack proportions. The F1 score of the B-MEAN model under different attack ratios are [24.8%, 42.83%, 56.10%, 66.72%, 74.82%, 81.58%, 87.41%, 92.25%], which increases significantly with the increase of attack proportions. The F1 score of our method are all above 95% and are always greater than those of the B-MIN model and the B-MEAN model. The above experimental results verify the theoretical analysis in 4.2.1.
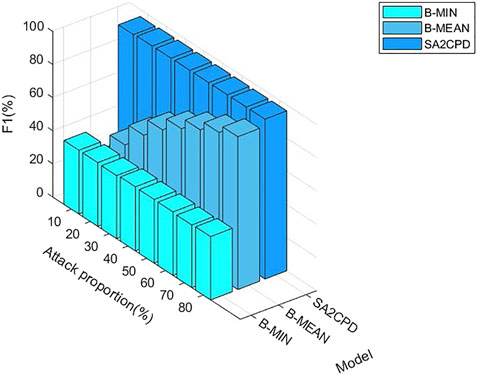
FIGURE 7. The F1 score of our SA2CPD model, the B-MIN model and the B-MEAN model under different attack proportions.
5.4 Comparison with the Naive Bayes model and the KNN model
Figure 8 displays the FPR of our SA2CPD model, the Naive Bayes model and the KNN model. From the figure, performance of the KNN model is the best and the highest FPR is only 0.06% when the attack proportion is 60%. The performance of the Naive Bayes model takes the second place, and its FPR does not exceed 0.2%. Our SA2CPD model shows the worst performance, but all FPR values are maintained at about 0.2%. Figure 9 displays the FNR of our SA2CPD model, the Naive Bayes model and the KNN model. It can be seen that the decision tree has the best performance and all FNR values are slightly higher than 5%. Nonetheless, the FNR of the Naive Bayes model is more than 10%, and the FNR of the KNN model is close to 15%. The above experimental results verify the theoretical analysis in 4.2.2 and 4.2.3.
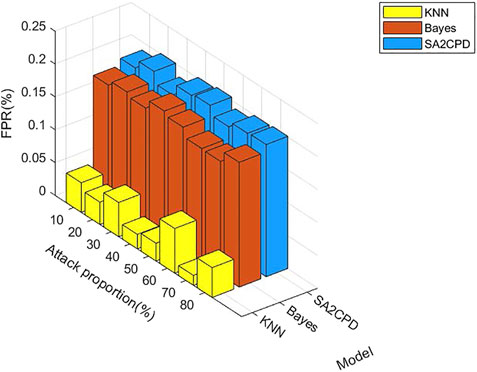
FIGURE 8. The FPR of our SA2CPD model, the Naive Bayes model and the KNN model under different attack proportions.
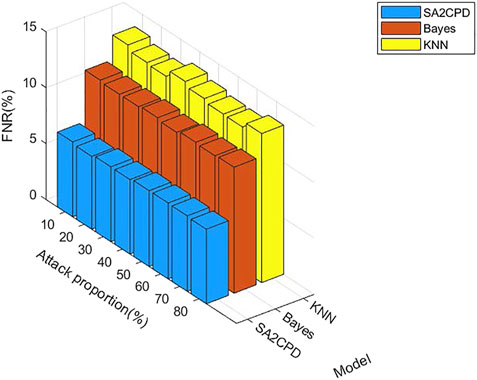
FIGURE 9. The FNR of our SA2CPD model, the Naive Bayes model and the KNN model under different attack proportions.
Figure 10 displays the F1 score of our SA2CPD model, the Naive Bayes model and the KNN model. Although the performance of our SA2CPD model on the FNR is much better than the other two, the FPR is slightly higher, it can not be concluded that the performance of our SA2CPD model is the best. Hence, we further show the performance of these three models in terms of F1 score in Figure 10. As we can see, no matter what the attack proportion is, the F1 score of our SA2CPD model are always greater than those of the Naive Bayes model and the KNN model. Specifically, the F1 score of the KNN model is slightly higher than 92%, and that of the Naive Bayes model is slightly higher than 94%, while that of our SA2CPD model is always higher than 96%. The above experimental results are consistent with our theoretical analysis in 4.2.2 and 4.2.3.
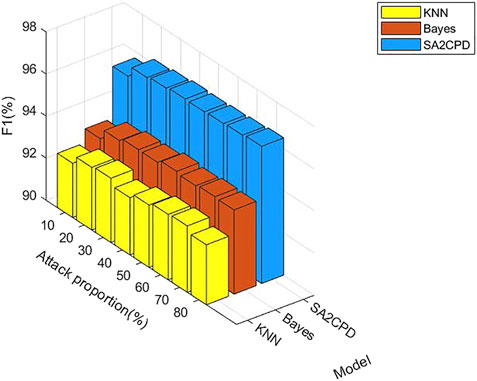
FIGURE 10. The F1 score of our SA2CPD model, the Naive Bayes model and the KNN model under different attack proportions.
6 Discussion
We now discuss the following problems and extensions related to this paper: detection of scaling attacks by injecting enlarged values, and detection of the h4 attack mentioned in Section 2.
6.1 Dedection of scaling attacks by injecting enlarged values
In this paper we investigate scaling attacks tampering with reduced reported values in smart meters, which can be represented as h3 (xt) = γtxt, γt = random (0.1, 0.8). In fact, injecting enlarged data into smart meters also belongs to the category of scaling attacks, which can be formalized as h3 (xt) = γtxt, γt = random (1, + ∞). Classical detection methods compare the total power supply and the total power consumption of all users to detect scaling attacks (Jokar et al., 2016). If these two values are close to each other, it is considered that no attack has occurred (Bhattacharjee et al., 2021a,b). If the total power consumption is less than the power supply, it is considered that an attack has occurred. Hence, if an adversary launches scaling attacks by injecting both reduced values and enlarged values and ensure that the total power supply and the total power consumption are close to each other, he can easily escape from these detection methods. In contrast, SA2CPD can still detect this adversary effectively. This is because, no matter whether the data is reduced or enlarged, as long as the false data falls outside the extracted consumption intervals, it will be binarized to 1, which can be detected by the decision tree.
6.2 Detection of the h4 attack
In the Section 2, we mentioned that the h4 attack can be represented by the h3 attack. It is because h4 represents manipulating the hourly reported value of smart meter as the mean value of a day multiplying by a different random number. Therefore,
7 Related work
As we described in Section 1, existing research on data integrity attacks detection in AMI falls into three main categories (Jiang et al., 2014; Jokar et al., 2016; Yao et al., 2019). The first type is state-based. For example, Huang et al. (Huang et al., 2013) used state estimation and analysis of variance (ANOVA) based on customer metering data aggregated at distribution transformers to detect contaminated meters and estimate the actual usage. Salinas et al. (Salinas et al., 2014) studied data integrity attacks in microgrids. They took values of stolen electricity as the measurement bias and used the least square method to make the optimal estimation, then the honest meter will show a zero bias and the compromised meter will show a non-zero bias. Leite et al. (Leite and Mantovani, 2018) used the data of meters to detect the power loss based on the multivariate procedure of monitoring and control. Through the combination with GIS program, the geographical location of fraud can also be found. Using power information and sensors placement, Lo et al. (Lo and Ansari, 2013) developed a hybrid detection framework to detect data integrity attacks by detecting abnormal activities in the power grid. McLaughlin et al. (McLaughlin et al., 2013) proposed a system that combines multiple technologies to detect data integrity attacks. The system collects relevant evidence of attacks from three different information sources to minimize the number of false positives. Aziz et al. (Aziz et al., 2020) rely on the results of state estimation in centralised aggregators, located between smart meters and the control center, to aid in false data detection. Bhattacharjee et al. (Bhattacharjee et al., 2021b) embedded the appropriate unbiased mean, the median absolute deviation, etc. to produce trust scores for smart meters to classify compromised smart meters from normal ones.
The second type is based on game theory, and the goal of game theory-based methods is to find a balance between the utility and adversaries (Cardenas et al., 2012; Yang et al., 2016; Wei et al., 2018, 2017; Paul et al., 2020). For example, Yang et al. (Yang et al., 2016) proposed a game theory model to deal with the situation that multiple adversaries jointly launch attacks. They introduced a penalty factor to represent the punishment for adversaries when they were detected. When an adversary decides to participate in a joint attack and succeed, the gain will be distributed to each adversary. When the attack is detected and fails, the adversaries participating in will be punished. The more adversaries involved, the greater the probability of failure. Based on the operational cost model of the utility, Cardenas et al. (Cardenas et al., 2012) expressed the problem of attack detection as a game between adversaries and the utility. Adversaries aim to achieve the best benefit and not be found, while the utility want to detect attacks as much as possible at a lower cost. Paul et al. (Paul et al., 2020) formulated interactions between defenders and adversaries as a repeated game, of which the solution is designed based on the reinforcement learning algorithm. Wei et al. (Wei et al., 2018) modeled interactions between defenders and attackers as a resource allocation stochastic game and introduce a novel learning algorithm to enable players to reach their equilibrium. Wei et al. (Wei et al., 2017) leveraged the Stackelberg game-theoretic model to model interactions between a single defender and multiple attackers, and then conduct a Likelihood Ratio Test (LRT) to detect malicious meters.
The third category is based on classification (Jokar et al., 2016; Singh et al., 2017; Ismail et al., 2018; Yeckle and Tang, 2018; Zheng et al., 2018; Fernandes et al., 2019; Jakaria et al., 2019; Punmiya and Choe, 2019; Zheng et al., 2019; Rouzbahani et al., 2020; Tehrani et al., 2020; Yan and Wen, 2021). For example, Singh et al. (Singh et al., 2017) proposed a detection scheme based on the principal component analysis (PCA) technology. The PCA was used to convert high-dimensional data to low-dimensional data, after which anomaly scores were calculated and compared with predefined thresholds to find out attacks. Yan et al. (Yan and Wen, 2021) proposed a detection model based on the extreme gradient boosting algorithm including two phases. In the training phase, normal samples can be obtained after preprocessing, and then malicious samples were generated from normal data according to the attack type. After that, the normal and malicious samples were jointly trained in the classification model. In the application phase, the trained classifier is used to determine whether the new collected sample is normal or malicious. Jokar et al. (Jokar et al., 2016) proposed a SVM-based data integrity attack detection model. They compared the reported total consumption value with the actual total consumption value to find out the suspicious area. Then, the historical data and synthetic attack data were used to train a multiclass SVM to detect malicious data. Tehrani et al. (Tehrani et al., 2020) took collected consumption values of 24 h and their mean, standard deviation, minimum and maximum values as characteristics. Firstly, they used Kmeans for clustering, and then generated false data according to the synthetic attack method proposed in the literature (Jokar et al., 2016) to construct a complete dataset for training and testing the decision tree, random forest and gradient boosting. Zheng et al. (Zheng et al., 2019) developed a scheme combined the maximum information coefficient and CFSFDP for detecting malicious behaviors. Yeckle et al. (Yeckle and Tang, 2018) used seven outlier detection algorithms to detect anomalies. The same as literature (Tehrani et al., 2020), they preprocessed the data by using kmeans, and conduct simulation based on consumption of five customers, including seven different attack types. The comprehensive experiment results validate the effectiveness of data integrity attacks detection.
8 Conclusion
In this paper, we investigate a scaling attack detection model in AMI that considers consumption pattern diversity (SA2CPD), which can effectively distinguish normal data from false data. Specifically, we first perform Kmeans clustering to find out different power consumption patterns to avoid low detection efficiency. After the clustering is completed, the interval of each consumption pattern is used to binarize the power consumption data, so that most values of false data are 1, and all values in normal data are 0. Finally, 24 time periods are divided into two categories, that is Tin and Tout. The decision tree is constructed based on time periods in Tout and used as a classifier. Experimental results show that our proposed SA2CPD model can effectively detect false data. Compared with detection schemes that do not consider power consumption pattern diversity and other machine learning algorithms including the KNN model and the Naive Bayes model, the evaluation results show that our model has a higher F1 score, indicating that our approach is more efficient.
Data availability statement
Publicly available datasets were analyzed in this study. This data can be found here: http://blog.drhongtao.com/2016/07/gefcom2012-load-forecasting-data.html.
Author contributions
XZ: Conceptualization, Methodology, Investigation, Formal Analysis, Validation, Writing—Original Draft and Review and Editing, Funding Acquisition; DC: Investigation, Data Curation, Formal Analysis, Validation, Writing—Original Draft; XL: Investigation, Validation, Writing—Original Draft.
Funding
The work is supported in part by the National Science Foundation of China (NSFC) under grants: 62002210 and 62001273, and in part by the Key R and D program (international science and technology cooperation project) of Shanxi Province, China (No. 201903D421003), and in part by the Open Project Program of the Shaanxi Key Laboratory for Network Computing and Security Technology (NCST2021YB-02).
Conflict of interest
The authors declare that the research was conducted in the absence of any commercial or financial relationships that could be construed as a potential conflict of interest.
Publisher’s note
All claims expressed in this article are solely those of the authors and do not necessarily represent those of their affiliated organizations, or those of the publisher, the editors and the reviewers. Any product that may be evaluated in this article, or claim that may be made by its manufacturer, is not guaranteed or endorsed by the publisher.
References
Amara korba, A., and El Islem karabadji, N. (2019). “Smart grid energy fraud detection using svm,” in 2019 international conference on networking and advanced systems (ICNAS), 1–6. doi:10.1109/ICNAS.2019.8807832
Aziz, I. T., Abdulqadder, I. H., Alturfi, S. M., Imran, R. M., and Flaih, F. M. F. (2020). “A secured and authenticated state estimation approach to protect measurements in smart grids,” in 2020 international conference on innovation and intelligence for informatics, computing and technologies (3ICT), 1–5. doi:10.1109/3ICT51146.2020.9311984
Bhattacharjee, S., and Das, S. K. (2021). Detection and forensics against stealthy data falsification in smart metering infrastructure. IEEE Trans. Dependable Secure Comput. 18, 356–371. doi:10.1109/TDSC.2018.2889729
Bhattacharjee, S., Madhavarapu, P., and Das, S. K. (2021a). A diversity index based scoring framework for identifying smart meters launching stealthy data falsification attacks. Proc. 2021 ACM Asia Conf. Comput. Commun. Secur., 26–39. doi:10.1145/3433210.3437527
Bhattacharjee, S., Madhavarapu, V. P. K., Silvestri, S., and Das, S. K. (2021b). Attack context embedded data driven trust diagnostics in smart metering infrastructure. ACM Trans. Priv. Secur. 24, 1–36. doi:10.1145/3426739
Cardenas, A. A., Amin, S., Schwartz, G., Dong, R., and Sastry, S. (2012). “A game theory model for electricity theft detection and privacy-aware control in ami systems,” in 2012 50th annual allerton conference on communication, control, and computing (Allerton: IEEE), 1830–1837. doi:10.1109/Allerton.2012.6483444
Chaudhry, S. A., Yahya, K., Garg, S., Kaddoum, G., Hassan, M., and Zikria, Y. B. (2022). Las-sg: An elliptic curve based lightweight authentication scheme for smart grid environments. IEEE Trans. Ind. Inf. 1, 1–8. doi:10.1109/TII.2022.3158663
Choi, J. S., Lee, S., and Chun, S. J. (2021). A queueing network analysis of a hierarchical communication architecture for advanced metering infrastructure. IEEE Trans. Smart Grid 12, 4318–4326. doi:10.1109/TSG.2021.3088879
Fernandes, S. E. N., Pereira, D. R., Ramos, C. C. O., Souza, A. N., Gastaldello, D. S., and Papa, J. P. (2019). A probabilistic optimum-path forest classifier for non-technical losses detection. IEEE Trans. Smart Grid 10, 3226–3235. doi:10.1109/TSG.2018.2821765
Hong, T. (2014). Global energy forecasting competition 2012. Available at: http://blog.drhongtao.com/2016/07/gefcom2012-load-forecasting-data.html.
Hu, T., Guo, Q., Shen, X., Sun, H., Wu, R., and Xi, H. (2019). Utilizing unlabeled data to detect electricity fraud in ami: A semisupervised deep learning approach. IEEE Trans. Neural Netw. Learn. Syst. 30, 3287–3299. doi:10.1109/TNNLS.2018.2890663
Huang, C., Sun, C.-C., Duan, N., Jiang, Y., Applegate, C., Barnes, P. D., et al. (2022). Smart meter pinging and reading through ami two-way communication networks to monitor grid edge devices and ders. IEEE Trans. Smart Grid 13, 4144–4153. doi:10.1109/TSG.2021.3133952
Huang, S.-C., Lo, Y.-L., and Lu, C.-N. (2013). Non-technical loss detection using state estimation and analysis of variance. IEEE Trans. Power Syst. 28, 2959–2966. doi:10.1109/TPWRS.2012.2224891
Ibrahem, M. I., Nabil, M., Fouda, M. M., Mahmoud, M. M. E. A., Alasmary, W., and Alsolami, F. (2021). Efficient privacy-preserving electricity theft detection with dynamic billing and load monitoring for ami networks. IEEE Internet Things J. 8, 1243–1258. doi:10.1109/JIOT.2020.3026692
Ismail, M., Shahin, M., Shaaban, M. F., Serpedin, E., and Qaraqe, K. (2018). “Efficient detection of electricity theft cyber attacks in ami networks,” in 2018 IEEE wireless communications and networking conference (WCNC), 1–6. doi:10.1109/WCNC.2018.8377010
Jain, A. K. (2010). Data clustering: 50 years beyond k-means. Pattern Recognit. Lett. 31, 651–666. doi:10.1016/j.patrec.2009.09.011
Jakaria, A. H. M., Rahman, M. A., and Moula Mehedi Hasan, M. G. (2019). “Safety analysis of ami networks through smart fraud detection,” in 2019 IEEE conference on communications and network security (CNS), 1–7. doi:10.1109/CNS.2019.8802845
Jiang, R., Lu, R., Wang, Y., Luo, J., Shen, C., and Shen, X. (2014). Energy-theft detection issues for advanced metering infrastructure in smart grid. Tsinghua Sci. Technol. 19, 105–120. doi:10.1109/TST.2014.6787363
Jokar, P., Arianpoo, N., and Leung, V. C. M. (2016). Electricity theft detection in ami using customers’ consumption patterns. IEEE Trans. Smart Grid 7, 216–226. doi:10.1109/TSG.2015.2425222
Leite, J. B., and Mantovani, J. R. S. (2018). Detecting and locating non-technical losses in modern distribution networks. IEEE Trans. Smart Grid 9, 1023–1032. doi:10.1109/TSG.2016.2574714
Lo, C.-H., and Ansari, N. (2013). Consumer: A novel hybrid intrusion detection system for distribution networks in smart grid. IEEE Trans. Emerg. Top. Comput. 1, 33–44. doi:10.1109/TETC.2013.2274043
McLaughlin, S., Holbert, B., Fawaz, A., Berthier, R., and Zonouz, S. (2013). A multi-sensor energy theft detection framework for advanced metering infrastructures. IEEE J. Sel. Areas Commun. 31, 1319–1330. doi:10.1109/JSAC.2013.130714
Mudgal, S., Pranjale, S., Balaji, T., Ahmed, S. A. A., Singh, N. K., Gupta, P. K., et al. (2022). Impact of cyber-attacks on economy of smart grid and their prevention. UPjeng. 8, 51–64. doi:10.24840/2183-6493_008.002_0005
Park, K., Lee, J., Das, A. K., and Park, Y. (2022). Bpps:blockchain-enabled privacy-preserving scheme for demand-response management in smart grid environments. IEEE Trans. Dependable Secure Comput. 1, 1–12. doi:10.1109/TDSC.2022.3163138
Paul, S., Ni, Z., and Mu, C. (2020). A learning-based solution for an adversarial repeated game in cyber-physical power systems. IEEE Trans. Neural Netw. Learn. Syst. 31, 4512–4523. doi:10.1109/TNNLS.2019.2955857
Punmiya, R., and Choe, S. (2019). Energy theft detection using gradient boosting theft detector with feature engineering-based preprocessing. IEEE Trans. Smart Grid 10, 2326–2329. doi:10.1109/TSG.2019.2892595
Rouzbahani, H. M., Karimipour, H., and Lei, L. (2020). “An ensemble deep convolutional neural network model for electricity theft detection in smart grids,” in 2020 IEEE international conference on systems, man, and cybernetics (SMC), 3637–3642. doi:10.1109/SMC42975.2020.9282837
Safavian, S., and Landgrebe, D. (1991). A survey of decision tree classifier methodology. IEEE Trans. Syst. Man. Cybern. 21, 660–674. doi:10.1109/21.97458
Salinas, S., Luo, C., Liao, W., and Li, P. (2014). “State estimation for energy theft detection in microgrids,” in 9th international conference on communications and networking in China, 96–101. doi:10.1109/CHINACOM.2014.7054266
Sarenche, R., Salmasizadeh, M., Ameri, M. H., and Aref, M. R. (2021). A secure and privacy-preserving protocol for holding double auctions in smart grid. Inf. Sci. 557, 108–129. doi:10.1016/j.ins.2020.12.038
Singh, N. K., and Mahajan, V. (2021). End-user privacy protection scheme from cyber intrusion in smart grid advanced metering infrastructure. Int. J. Crit. Infrastructure Prot. 34, 100410. doi:10.1016/j.ijcip.2021.100410
Singh, S. K., Bose, R., and Joshi, A. (2017). “Pca based electricity theft detection in advanced metering infrastructure,” in 2017 7th international conference on power systems (ICPS), 441–445. doi:10.1109/ICPES.2017.8387334
Sun, C.-C., Sebastian Cardenas, D. J., Hahn, A., and Liu, C.-C. (2021). Intrusion detection for cybersecurity of smart meters. IEEE Trans. Smart Grid 12, 612–622. doi:10.1109/TSG.2020.3010230
Tehrani, S. O., Moghaddam, M. H. Y., and Asadi, M. (2020). “Decision tree based electricity theft detection in smart grid,” in 2020 4th international conference on smart city, Internet of things and applications (SCIOT), 46–51. doi:10.1109/SCIOT50840.2020.9250194
Verma, G., Gope, P., Saxena, N., and Kumar, N. (2022). Cb-da: Lightweight and escrow-free certificate-based data aggregation for smart grid. IEEE Trans. Dependable Secure Comput. 1, 1–13. doi:10.1109/TDSC.2022.3169952
Wei, L., Sarwat, A. I., Saad, W., and Biswas, S. (2018). Stochastic games for power grid protection against coordinated cyber-physical attacks. IEEE Trans. Smart Grid 9, 684–694. doi:10.1109/TSG.2016.2561266
Wei, L., Sundararajan, A., Sarwat, A. I., Biswas, S., and Ibrahim, E. (2017). “A distributed intelligent framework for electricity theft detection using benford’s law and stackelberg game,” in 2017 resilience week (RWS), 5–11. doi:10.1109/RWEEK.2017.8088640
Yan, Z., and Wen, H. (2021). Electricity theft detection base on extreme gradient boosting in ami. IEEE Trans. Instrum. Meas. 70, 1–9. doi:10.1109/TIM.2020.3048784
Yang, X., He, X., Lin, J., Yu, W., and Yang, Q. (2016). “A game-theoretic model on coalitional attacks in smart grid,” in 2016 IEEE trustcom/BigDataSE/ISPA, 435–442. doi:10.1109/TrustCom.2016.0094
Yao, D., Wen, M., Liang, X., Fu, Z., Zhang, K., and Yang, B. (2019). Energy theft detection with energy privacy preservation in the smart grid. IEEE Internet Things J. 6, 7659–7669. doi:10.1109/JIOT.2019.2903312
Yeckle, J., and Tang, B. (2018). “Detection of electricity theft in customer consumption using outlier detection algorithms,” in 2018 1st international conference on data intelligence and security (ICDIS), 135–140. doi:10.1109/ICDIS.2018.00029
Zanetti, M., Jamhour, E., Pellenz, M., Penna, M., Zambenedetti, V., and Chueiri, I. (2019). A tunable fraud detection system for advanced metering infrastructure using short-lived patterns. IEEE Trans. Smart Grid 10, 830–840. doi:10.1109/TSG.2017.2753738
Zheng, K., Chen, Q., Wang, Y., Kang, C., and Xia, Q. (2019). A novel combined data-driven approach for electricity theft detection. IEEE Trans. Ind. Inf. 15, 1809–1819. doi:10.1109/TII.2018.2873814
Keywords: smart grid, smart meter, advanced metering infrastructure (AMI), scaling attack detection, consumption pattern diversity, binarize
Citation: Zhang X, Chang D and Liao X (2023) A detection model of scaling attacks considering consumption pattern diversity in AMI. Front. Energy Res. 10:1046756. doi: 10.3389/fenrg.2022.1046756
Received: 17 September 2022; Accepted: 31 October 2022;
Published: 13 January 2023.
Edited by:
Dou An, MOE Key Laboratory for Intelligent Networks and Network Security, ChinaCopyright © 2023 Zhang, Chang and Liao. This is an open-access article distributed under the terms of the Creative Commons Attribution License (CC BY). The use, distribution or reproduction in other forums is permitted, provided the original author(s) and the copyright owner(s) are credited and that the original publication in this journal is cited, in accordance with accepted academic practice. No use, distribution or reproduction is permitted which does not comply with these terms.
*Correspondence: Xialei Zhang, eGwuemhhbmdAc3h1LmVkdS5jbg==