 S. Jin1,2†
 S. A. Brown
 D. M. Greaves
- 1School of Engineering, Computing and Mathematics, University of Plymouth, Plymouth, United Kingdom
- 2Ocean Institute, Northwestern Polytechnical University, Taicang, China
In offshore renewable energy design procedures, accurate predictions of extreme responses are required in order to design for survivability whilst minimising associated costs. At present, the established method for predicting extreme responses is to conduct a large number of long-duration simulations, which is practical only in cases where the structural behaviour is captured by a computationally efficient linear approach. Many applications, however, will require a nonlinear approach, which significantly increases the computational cost, and hence the time required to analyse a problem. Should high-fidelity numerical approaches be the appropriate analysis tool, the long-duration simulations are likely to be impractical and in many cases infeasible. Laboratory testing can be utilised to address this to some extent, but this still time-consuming and expensive from a financial perspective. Consequently, there has been considerable interest in the use of short design waves as an alternative method for speeding up the design process. Currently, standards advise that short design waves can be utilised in the design of fixed offshore structures, but application to floating offshore structures needs verification before it becomes an established procedure. This study considers application of single and constrained short design waves to a floating hinged-raft wave energy converter using a 1:50 scale physical modelling approach, and compares with equivalent irregular sea states. The single wave approaches considered here are “NewWave” and the “Most Likely Extreme Response” wave, which are derived from the frequency content of the wave spectrum and response spectrum, respectively. The constrained approach considered in this study is the “Conditional Random Response Wave,” where the Most Likely Extreme Response wave is embedded within a random short irregular background. Results show that the single wave approaches under-estimate the extreme loading for the hinge-angle and mooring system compared with the irregular and constrained approaches. The discrepancy between single and constrained waves implies that memory effects are non-negligible, and hence it is critical that they are accounted for when utilising short design waves for floating applications.
1 Introduction
In the pursuit of sustainable solutions to address the ongoing climate crisis, Offshore Renewable Energy (ORE) sources are recognised as being key components in future balanced energy systems (Jin and Greaves, 2021), and hence are currently receiving significant development and priority backing from governments worldwide (International Energy Agency, 2021). As more established fixed ORE solutions, such as fixed offshore wind, experience considerable growth in terms of size and scale, floating systems offer an opportunity to further expand the availability, versatility and cost-effectiveness of ORE resource by increasing the number of viable deployment sites. Unlike fixed structures, however, which can directly build upon the knowledge of mature sectors such as the oil and gas industry, there is considerable uncertainty regarding the typical extreme loads which a floating structure may experience due to large differences in the hydrodynamics and structural response. Therefore, considerable effort is currently being invested in accurate and efficient determination of design load conditions for floating ORE systems. In the present context, the design load is considered to be the response magnitude that a device must withstand to maximise the chances of survival, usually related to a return period of 50 years for unmanned floating ORE devices. Accurate prediction of design loads are essential for reliability analysis and design optimisation and can be any parameter that is of interest to the designer. For floating ORE devices common choices are the key components present in most devices; the station-keeping method; the floating structure; and the energy extraction mechanism.
At present, the established methods for determining design loads that are recommended by international standards for ORE devices (DNV, 2014; IEC, 2015) require the simulation of large quantities of data. The most rigorous approach is the direct-integration method, where short-term Extreme Value Distributions (EVDs) for many sea states within an envelope defined by the environmental characterization process are averaged (Coe et al., 2018a; Coe et al., 2018b). A short-term EVD provides a prediction for the largest response of a device that is in a particular sea state for a fixed-duration of time, which varies per application but is typically recommended to be 3-h for Wave Energy Converters (WECs). Using the expected number of peak loading events in the fixed-duration sea state, the EVD is obtained through fitting a distribution to the peak events observed in a sample of data (Michelen and Coe, 2015). The recommended size of the data sample required to produce the peaks distribution varies throughout the published standards and depends on the return period, but for WECs a common suggestion is 18-h (6 random seeds of 3-h) for sea states on the 50-year contour (IEC, 2015). The large number of simulations required to achieve this integration, therefore limits the practicality of the direct-integration method to scenarios with linear responses to ensure that low-order, computationally efficient numerical modelling approach can be used reliably. A challenge, however, is that floating ORE devices are generally deployed in highly-energetic environments and will therefore be continually subjected to strongly non-linear processes such as wave breaking, slamming and aerated flows. Consequently, the device is likely to exhibit large dynamic and non-linear responses, breaking down many of the fundamental assumptions upon which linear modelling approaches are based, making it necessary to use time-domain numerical modelling. Even the introduction of weakly nonlinear terms, which are dependent on calculating the wetted volume at each time step, makes the computational effort increase to such an extent that modelling a large number of sea states is impractical, particularly for multi-body devices as considered in this work. Should the problem require high-fidelity Computational Fluid Dynamics (CFD), a single sea state would require considerably more computational resource than most designers would have available to them, rendering the direct-integration approach completely infeasible. Laboratory testing can be utilised to overcome this problem to an extent but this resource has limited availability and is still very time-consuming, making it extremely expensive from a financial perspective.
A more practical alternative to the direct-integration method recommended by international standards (DNV, 2014; NORSOK, 2017) is the environmental contour method (Winterstein et al., 1993). Instead of fully-integrating the short-term response distributions for all sea states, the design load is estimated using a sample of irregular sea states on an environmental contour associated with a given return period. From this sample, the sea state that produces the largest response is used to obtain the EVD, and the design load is selected as either a high-percentile (α) of this distribution (DNV, 2014), or the average largest value (IEC, 2015; IEC, 2019). Although sampling on a given contour does reduce the number of sea states that need to be modelled to obtain the characteristic extreme load, the use of irregular sea states still makes high-fidelity numerical modelling impractical. From a laboratory testing perspective, the environmental contour method improves feasibility, but this is still a financially expensive option and hence any reduction in simulation time would be highly beneficial.
To minimise the limitations of high-cost physical and numerical modelling approaches, considerable research interest has been invested into Short Design Waves (SDWs), which aim to bypass modelling a long-duration irregular sea state by only simulating a single wave profile (or short group of waves) that produces an extreme response. One popular option is the NewWave (NW) method developed for fixed structures for the oil and gas industry (Tromans et al., 1991), obtained by treating the generation of a sea state profile as a Gaussian process. Using the spectral density and scaling according to the energy contribution of each frequency component, NW can considered to be the average profile of an extreme wave, often referred to as a focused wave, and has been applied extensively in WEC literature as a laboratory (Hann et al., 2015) and numerical (Ransley et al., 2020b; Ropero-Giralda et al., 2020) technique to assess survivability. The use of NW, for fixed structures is common practice since large waves are likely to lead to an extreme loading event, but previous research has shown that this does not necessarily hold for floating structures since the dynamics of the structure are non-negligible (Hann et al., 2018). Response-conditioned methods are alternative SDW approaches that aim to address this problem by considering the device’s response rather than the incident wave. The Most Likely Extreme Response (MLER) wave is an example of a response-conditioned focused wave that uses the linear Response Amplitude Operator (RAO) to estimate the average wave profile leading to extremes (Adegeest, 1998; Quon et al., 2016). It has been demonstrated through CFD simulations for various WECs (Coe et al., 2019; Van Rij et al., 2019) but the method still produces responses that are significantly smaller than the long-duration irregular sea states recommended by standards (Rosenberg et al.,2019).
To include these history effects, constrained SDW approaches have been developed where a single SDW profile is embedded within a background wave condition, typically a short section of a random irregular sea state. The Constrained NewWave (CNW) method (Taylor et al., 1997; Bennett et al., 2012) is one example of a constrained SDW that embeds a NW profile within the background wave. It has previously been demonstrated for floating ORE devices using a regular wave background by Göteman et al. (2015), who reported a large variability in the maximum loads on a single point mooring point-absorber WEC. Hann et al. (2018) conducted experiments with CNWs, using both regular waves and random irregular sea states, to study the influence of the background wave on the extreme mooring loads of taught moored, bottom referenced point-absorber WECs. Although the regular background waves allowed for a more systematic study, the irregular sea state CNW results exhibited larger mooring loads and surge motions, leading to Hann et al. (2018) to conclude that monochromatic waves are not sufficient to model the load history. The natural progression from CNW is an analogous method that embeds the MLER rather than NW. This approach is often referred to as the Conditional Random Response Wave (CRRW), originally developed by Dietz (2005) and has been previously demonstrated for extreme events for ships dynamics (Drummen et al., 2009; Seyffert et al., 2020), concluding that the responses are in-line with those in irregular sea states. The results from these studies are promising but further investigations are necessary, with emphasis on floating ORE devices in particular, before constrained SDWs can become established tools within ORE recommended design practices.
The present study considers the application of SDWs to a floating hinged-raft WEC through a physical modelling campaign conducted at the Coastal, Ocean and Sediment Transport (COAST) Laboratory at the University of Plymouth, United Kingdom. To date, the number of studies which have applied constrained SDWs to floating WECs is quite small, and typically limited to CNW interactions with point-absorbers (Hann et al., 2018), and numerical (Göteman et al., 2015; Tagliafierro et al., 2022) investigations. Tosdevin et al. (2021) studied snatch loading of the Mocean Energy’s Blue Star device in SDWs based on 1-year return conditions at the European Marine Energy Centre (EMEC), which was the first study of constrained SDW impacts on a floating hinged-raft WEC to the best of the author’s knowledge. In the work reported here, a 1:50 scale model of a generic floating hinged-raft is examined for 1-h irregular sea states and three SDW approaches: NW; MLER; and CRRW. The scale of the device is selected to be smaller than that considered in the Mocean Energy study (Tosdevin et al., 2021) to allow for assessment in sea-states with larger return period (50-year). The crucial design loads for floating hinged-raft WECs are considered to be the tension in the mooring system, and the maximum hinge-angle (i.e., relative pitch between the two bodies), which was not reported in Tosdevin et al. (2021). The aim of the study is to determine the effectiveness of the SDWs at modelling extreme loading events, using the established method (the irregular sea state data) as a benchmark. This assessment includes determining conditions where the method works well, the limitations of the approach, and identification of potential areas for improvement.
The paper is structured such that Section 2 establishes the experimental case study, environmental test conditions and SDW approaches considered; Section 3 presents the results for the short-term irregular sea states; Sections 4, 5 present the results for the single and constrained SDWs, respectively; Section 6 discusses the performance of the various techniques with suggestions on future improvements that could be made; and finally, the recommendations and conclusions are drawn in Section 7.
2 Physical modelling campaign
Experiments are conducted in the Ocean Basin at the COAST Laboratory; a facility that is 35 m in length, 15.5 m wide and has an adjustable floor to allow for a range of operating water depths up to a maximum of 3 m. The operational water depth is set to 1.5 m in this work, based on the EMEC Billia Croo Wave Test Site and consistent with previous work conducted on a similar device through the Marinet-2 project (Davey et al., 2021).
2.1 Model and instrumentation
A 1:50 scale model of a floating hinged-raft WEC is used in this work, consisting of two structures (0.72 m in length; 0.435 m in width) connected via a hinge. The mass properties of each raft is provided in Table 1), with the “front raft” considered to be the upstream structure (see Figure 1). The device has a draft of 0.0915 m and 13 Degrees Of Freedom (DOFs): 6 DOFs (surge, sway, heave, roll, pitch, and yaw) for each raft and the relative hinge-angle between the rafts. Since the focus of this study is on extreme responses, it is assumed that the device is in a survivability mode where the power take-off is disconnected. Station-keeping is achieved via a four-point mooring system connected to the front raft, which is initially in a horizontal configuration through the centre of mass of the front raft (z = 0.0385 m; see Figure 1A). Each mooring line consists of a linear spring, with calibrated stiffness of 7.35 N/m, attached to a rope constructed from polyethylene fibres which is considered to be inextensible. The aft raft is not constrained other than through the hinge connection to the front raft.
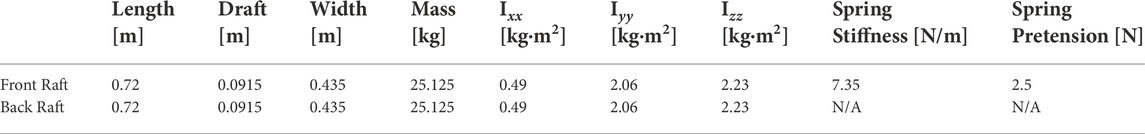
TABLE 1. Dimensions, mass and mooring properties of each raft. Moment of inertia (I) is provided relative to the centre of mass.
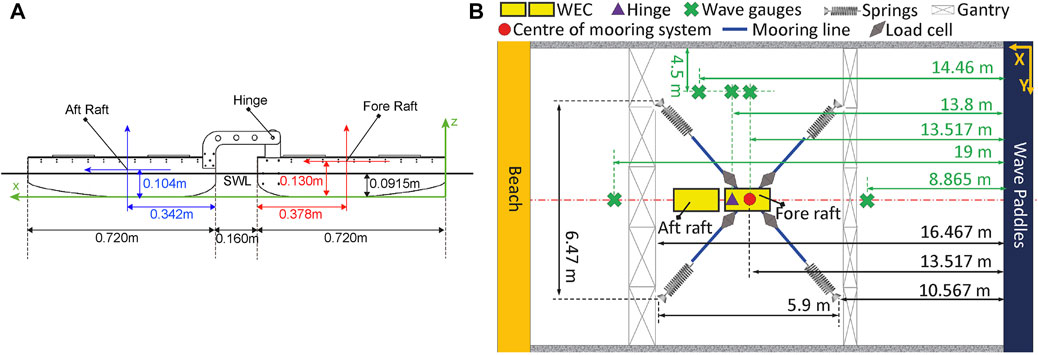
FIGURE 1. Diagrams of the device dimensions (A) and the experimental setup (B) in the COAST Laboratory.
The motion of the device is measured using a Qualisys optical tracking system calibrated to track each raft with a right-hand coordinate system defined such that positive x is in the direction of wave propagation; y is the transverse horizontal component; and z is the vertical dimension. The relative hinge-angle is measured using a rotary sensor. The mooring load at each fairlead is captured using single-axis S-type load cells with a maximum capacity of 445 N. Since the focus of this study.
2.2 Test programme
The Billia Croo site (58.96°N, 3.38°W) at the EMEC in the UK is selected as the operational site, for which reanalysis data from the European Centre for Medium-Range Weather Forecasts (ECMWF) has been demonstrated previously to agree well with physically measured data (Jin and Greaves, 2021). The ECMWF hourly reanalysis data from 1979-present (European Centre for Medium-Range Weather Forecasts, 2022) are therefore used to obtain the extreme sea states relating to the 50-year return period in this study. The estimation of the environmental contour is based on the Inverse First Order Method (IFORM) (Winterstein et al., 1993), together with a Weibull distribution for Hs and conditional log-normal distribution for Tp∣Hs (DNV, 2013). As a result, the 50-year environmental contour line is obtained and plotted in Figure 2, which gives a set of Hs − Tp to represent the extreme sea states that are likely to generate large responses.
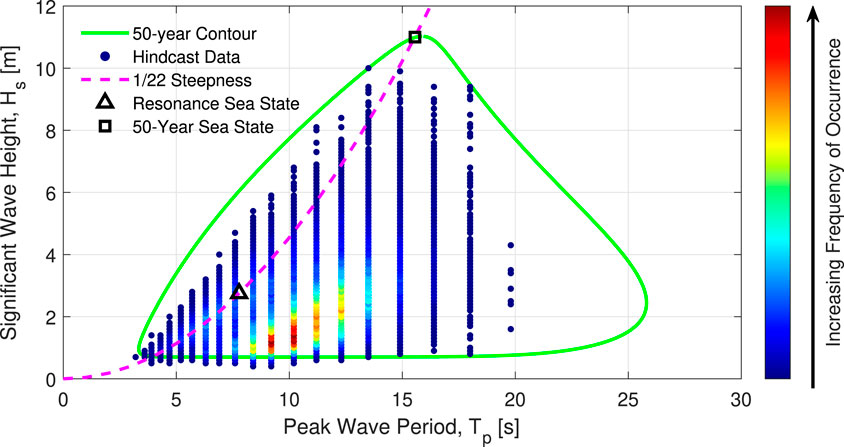
FIGURE 2. Environmental conditions for the EMEC site. The 50-year contour (green solid line), 1/22 steepness contour (magenta dashed line) and the two sea states considered in this study are presented: 50-year sea state (black square); Resonance sea state (black triangle).
To avoid complexities induced by breaking waves, two non-breaking environmental conditions along the 1/22 steepness line are selected for this study, as indicated on Figure 2 and summarised in Table 2. The first wave condition is the maximum Hs intersection point with the 50-year contour line, referred to as the “50-year sea state.” The second is the wave at the targeted hinge-angle resonance frequency for the device, referred to as the “Resonance sea state” (Figure 2). The waves are modelled using a JONSWAP spectrum with two peak enhancement factor (γ) values.
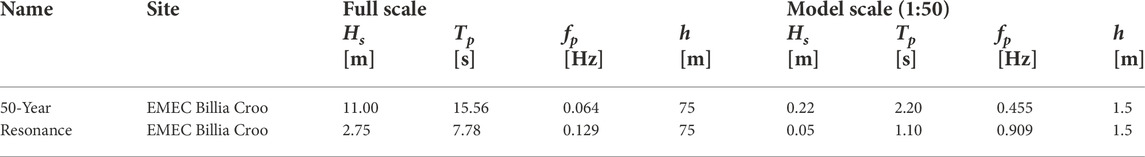
TABLE 2. Parameters of each sea state considered in this study. Each is tested for γ = 1 and γ = 3.3.
2.3 Short design waves
In the literature, SDWs are typically used for three purposes: to study extreme responses in a generic way by scaling the wave amplitude to the most probable maximum (Quon et al., 2016); for direct characteristic load predictions (Van Rij et al., 2018; Wang et al., 2021); and prediction of characteristic loads through short-term EVDs (Taylor et al., 1997). SDWs can consist of a single focused wave group, or a focused wave group embedded within a random irregular wave background, referred to as “single SDWs” and “constrained SDWs,” respectively. In an ORE context, occasional studies have compared single SDWs with other methods of predicting design loads with the aim of using them in place of long irregular waves e.g., Van Rij et al. (2018). The application of constrained SDWs in ORE, however, is a recent development and hence previous studies are extremely limited (Tosdevin et al., 2021). In related fields (such as ocean engineering and naval architecture), constrained SDWs have been demonstrated to predict the short-term EVD of the response instead of long irregular waves (Taylor et al., 1997; Dietz, 2005).
In this study, three existing SDWs methodologies are evaluated, derived from the wave conditions identified in 2.2. Two single SDWs are considered (NW and MLER) and one constrained SDWs method (CRRW). Please note that the derived equations for each method are quite involved and are therefore omitted for brevity. For further details including equations, the reader is referred to Tromans et al. (1991) for NW; and Dietz (2005) for MLER and CRRW. The main peak of each SDW occurs at 45 s, and the constrained waves are embedded within a 120 s random irregular sea state. As proposed by Tosdevin et al. (2022), the response-conditioned SDW approaches (MLER, CRRW) considered in this work are scaled to the 99th percentile of the EVDs for the targeted response based on a 3-h exposure time. Scaling in this way helps to alleviate the importance of history effects, which are unaccounted for in any of the methods, since the profiles will be more likely to produce high-percentile responses (Tosdevin et al., 2021; Tosdevin et al., 2022). The NW approach, however, is scaled to the 70th percentile of the wave amplitude EVD, due to difficulties in physically producing the higher percentile profile. Although this removes the possibility of direct comparison between the two single SDW methods, it is more in-line with the typical approach taken when designing waves for survivability studies and hence is considered a benchmark in this work. RAOs of the hinged raft obtained from the 1-h irregular sea states, and the corresponding phase angles are plotted in Figure 3, with surge, heave and pitch presented for the front raft only. There are also discrepancies between the target and physically realised wave amplitudes (experimental error) and so a range of values around the target will be generated in practice. The response-conditioned SDWs are generated using the RAOs of the device (Figures 3G,I) and associated phases (Figures 3H,J), obtained here through six one-hour irregular sea states with varying random seeds for the phases. This one-hour irregular sea state data is also used as the benchmark for the SDW analysis throughout. The CRRW approach is tested for 20 different seeds for each irregular sea state.
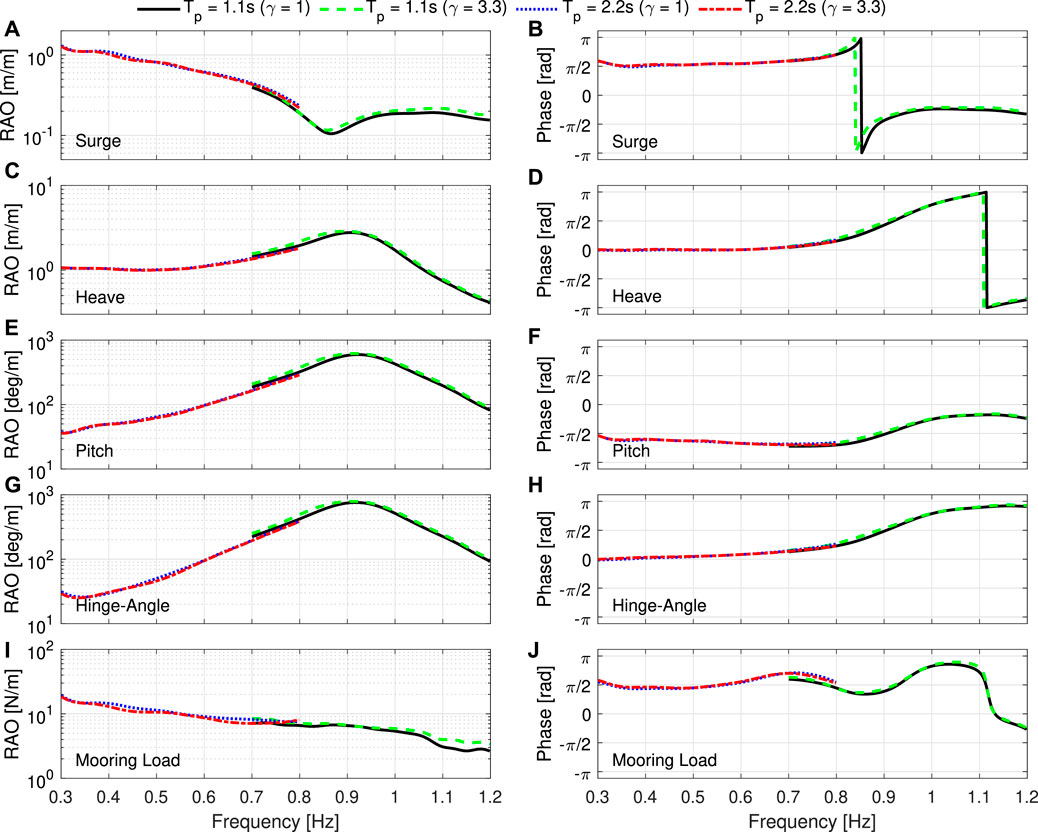
FIGURE 3. The surge (A), heave (C), pitch (E) hinge-angle (G) and mooring load (I) RAOs obtained from the 1-h irregular sea states, and the corresponding phase angles (B,D,F,H,J). Surge, heave and pitch is presented for the front raft only. Each line is a different sea state: 50-year sea state, γ = 1 (black solid), γ = 3.3 (green dashed); and Resonance sea state γ = 1 (blue dotted), γ = 3.3 (red dash-dotted).
2.4 Post-processing
The presented data is collected at a sampling frequency of 128 Hz and experimental noise is removed using a low-pass Butterworth digital and analog filter Butterworth (1930). The irregular spectra are calculated through the Welch’s power spectral density estimate method (Welch, 1967) using a window size of 2,000.
The maxima recorded in the constrained SDWs are limited to a 10 s window centred on the main peak (40 s–50 s), due to the possibility of the background irregular sea state producing a larger response than the embedded SDW itself. By limiting analysis to this time window, the aim is to isolate the response of the embedded focused wave (with varying history) rather than the short irregular time series, for which the random extreme events would be difficult to analyse.
The mooring load reported in this work is the total load on the whole mooring system, obtained using the sum of the measurements on each individual mooring line, and analogous with the total hydrodynamic loading on the device.
3 Short-term irregular sea states
3.1 Device spectral response
Figure 4 compares the spectral response (red) of the hinge-angle (Figures 4A,B) and mooring load (Figures 4C,D) with the incident wave spectra (black). The results for the Resonance sea state are on the left (Figures 4A,C), with the 50-year sea state on the right (Figures 4B,D). The γ value is indicated by the line style: γ = 1 (solid); and γ = 3.3 (dashed). The hinge-angle response is dominated by the resonant frequency of the device rather than the incident wave frequency. This can be seen in the 50-year sea state (Figure 4B), which although there is a small peak in response at the peak wave frequency (for γ = 3.3), exhibits a significantly larger response at the hinge-angle resonance frequency. The mooring load, on the other hand, is dominated by the response at the wave frequency and low frequency surge effects, as can be observed in the similarity between the RAO profiles for the two parameters (Figures 3A,I).
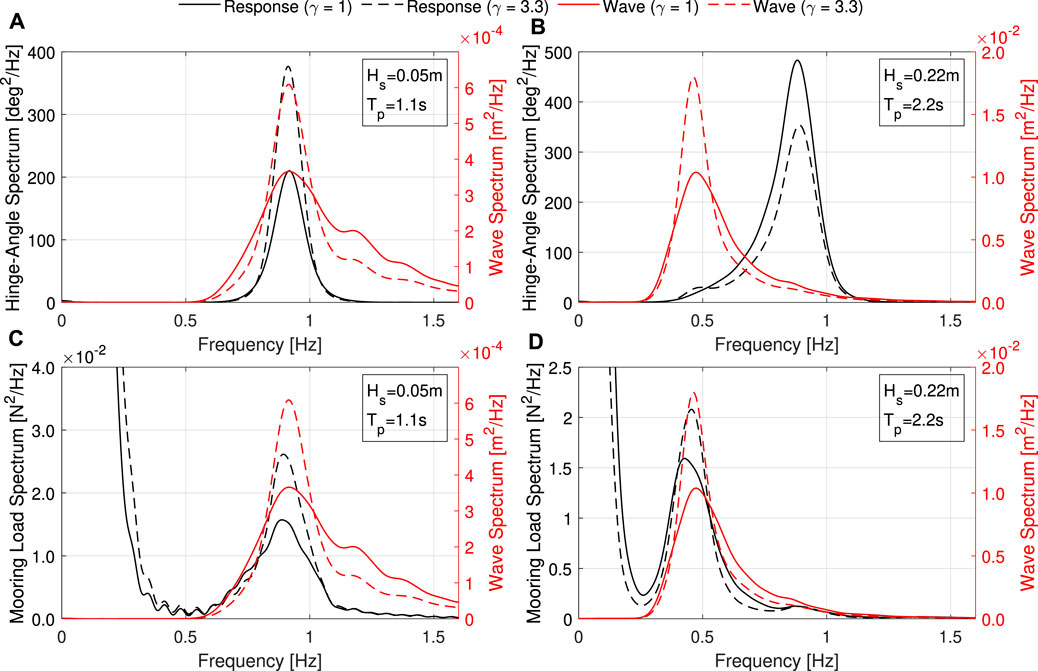
FIGURE 4. Spectral response (black) of the hinge-angle (A,B) and mooring load (C,D) compared with the incident wave spectra (red). The results for the Resonance sea state are on the left (A,C), with the 50-year sea state on the right (B,D). The γ value is indicated by the line style: γ = 1 (solid); and γ = 3.3 (dashed).
3.2 Extreme Value Distributions
Figure 5 presents the distribution of the observed peaks for the hinge-angle (Figure 5A) and mooring load (Figure 5B) using the time series from the six one-hour irregular sea states. The empirical distributions for these peaks are presented with grey markers, with the marker style indicating the wave conditions: Resonance sea state, γ = 1 (circle) and γ = 3.3 (square); 50-year sea state, γ = 1 (upwards triangle) and γ = 3.3 (left triangle). Using a threshold of 90%, the empirical data has been fitted using a peak over threshold method and Generalised Pareto Distribution (GPD) as indicated by the lines on the plot: Resonant wave, γ = 1 (red solid), and γ = 3.3 (magenta dashed); 50-year sea state, γ = 1 (blue solid) and γ = 3.3 (cyan dashed). For the hinge-angle (Figure 5A) the GPD fits the data well, and hence is expected to be a realistic description for this parameter. For the mooring load (Figure 5B), on the other hand, the GPD does not fit particularly well, especially for the Resonance sea state cases. This is due to the occurrence of a small number of much higher loading events that appear to follow a different distribution compared with the remaining peaks. A larger threshold value has been tried for the Resonance sea state cases in an attempt to capture the distribution of the highest peaks only, but the fit did not improve significantly. Distributions such as this are often produced for moored floating structures in moderate conditions due to the influence of low frequency surge motion (Song et al., 2019). As this effect is caused by approximately 5 large events over the 6 h of data, it is likely that further data would be beneficial in order to provide a more representative distribution for the peak mooring loads in this case. This is in-line with IEC recommendations of 18-h of data (IEC, 2019; IEC, 2015). Alternatively, hybrid distributions may provide a better fit in some scenarios (Song et al., 2019).
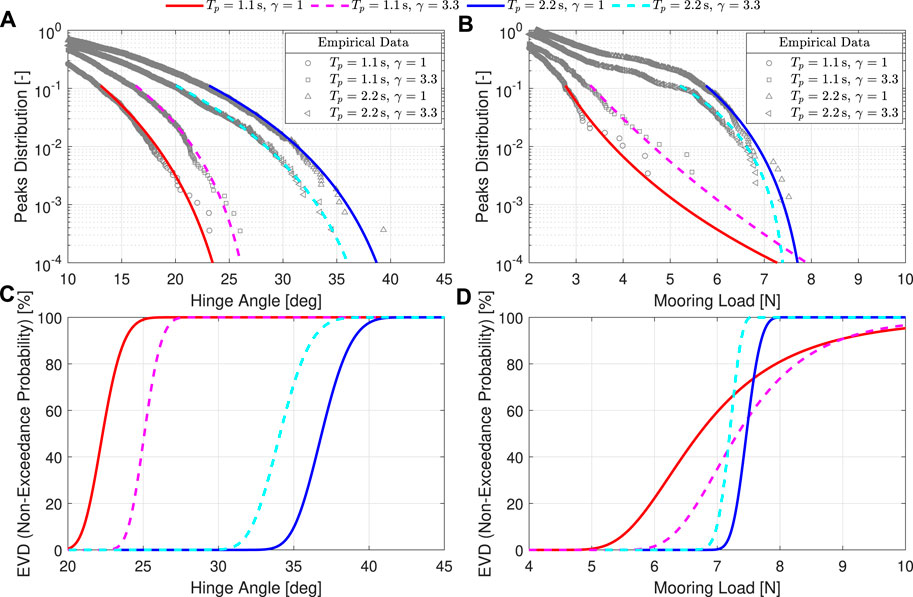
FIGURE 5. Empirical distributions (grey markers) and Generalised Pareto Distribution fit (solid lines, γ = 1; dashed lines γ = 3.3) of the observed peaks for the hinge-angle (A) and mooring load (B) for the 1-h irregular sea states. The corresponding non-exceedance EVDs is also presented for the hinge-angle (C) and mooring load (D).
The corresponding EVDs, based on the expected number of peaks in a 3-h window, are also presented for the hinge-angle (Figure 5C) and mooring load (Figure 5D). The EVD provides the non-exceedance probability for a particular response value. For the mooring load, the non-exceedance values are only representative for the 50-year sea state due to the poor GPD fit for the Resonance sea state. The EVDs will be used in the SDW analysis in Section 5.
4 Single short design waves
Building upon the experience of loading on fixed structures, such as studied in the oil and gas industry, single SDWs are commonly utilised to assess survivability and behaviour of floating ORE devices in extreme conditions (Ransley et al., 2020a). The validity of extending the single wave methodologies to floating applications is uncertain, however, since memory effects and transient dynamics can be significant. For example, previous floating WEC studies have shown that drift forces lead to low frequency surge motions (Retzler, 2006; Fonseca et al., 2008), which impact the instantaneous position of the device when the wave arrives, consequently altering the response and maximal loading. This section investigates the response of the present hinged-raft WEC to single SDWs.
4.1 Hinge-angle
The positive hinge-angle is considered first. Figure 6 presents time series of the surface elevation and hinge-angle response for single SDWs based on the NW and MLER methods. The waves have been generated based on the spectra of the four irregular sea states identified in Section 2.2: the Resonance sea state (Tp = 1.1 s, Hs = 0.05 m) is presented on the top row (Figures 6A,B); the 50-year sea state (Tp = 2.2 s, Hs = 0.22 m) on the bottom row (Figures 6C,D); and the value of γ has been varied for each, indicated by solid (γ = 1) and dashed (γ = 3.3) lines in each plot.
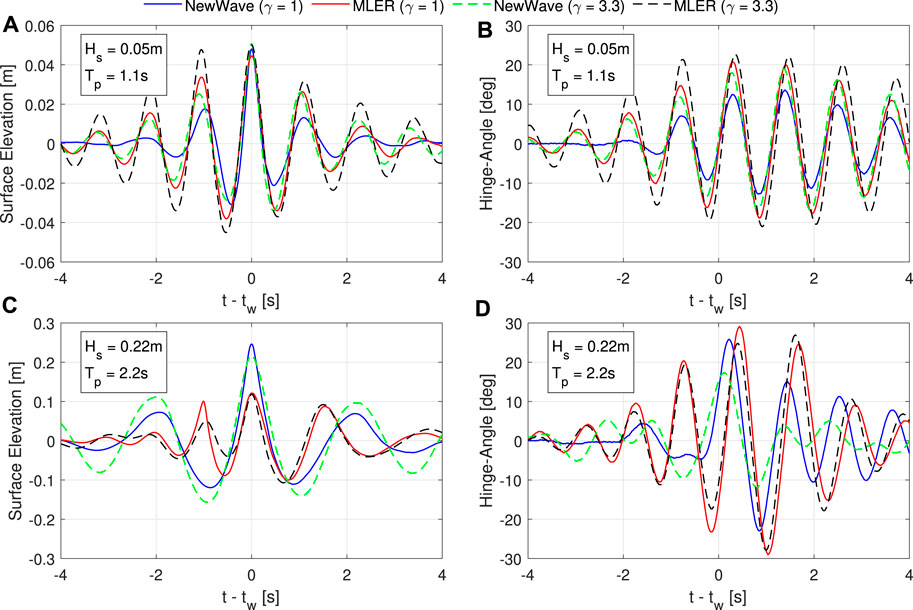
FIGURE 6. Surface elevation (A,C) and hinge-angle (B,D) time series for each single SDWs: NewWave, γ = 1 (blue solid); MLER, γ = 1 (red solid); NewWave, γ = 3.3 (green dashed); MLER, γ = 3.3 (black dashed). The top row (A,B) presents the Resonance sea state (Tp = 1.1 s, Hs = 0.05 m) and the bottom row (C,D) the 50-year sea state (Tp = 2.2 s, Hs = 0.22 m). Time is relative to the maximum surface elevation, tw.
In the Resonance sea state, it is observed that the measured peak surface elevation is similar for all SDW approaches and gamma value combinations (Figure 6A). The magnitude of the response, however, varies significantly (Figure 6B), from a maximum response of 13.6° for NW (γ = 1), to 22.7° for MLER (γ = 3.3). In the 50-year sea state, the peak surface elevation is significantly larger than the Resonance sea state (Figure 6C), but the hinge-angle response is not proportionally larger (Figure 6D). In one case it is even observed to reduce: for NW (γ = 3.3), the maximum hinge-angle is 19° in the Resonance sea state (Figure 6B), whereas a 17.2° is recorded in the 50-year sea state (Figure 6D), despite having a peak surface elevation
The value of the peak enhancement factor, γ, alters the bandwidth of a spectrum, with larger values relating to a narrower-banded spectrum. Comparing the responses, it is observed that the value of γ does alter the response. In the Resonance sea state (Figure 6B), γ = 3.3 leads to a larger hinge-angle response than γ = 1 for both NW and MLER. In the 50-year sea state, the opposite is observed, i.e., γ = 1 produces a larger hinge-angle response than γ = 3.3. This is likely due to the energy content at the hinge-angle resonant frequency, which dominates the response as seen in Figures 4A,B (see Section 3.2). More specifically, the energy content in the Resonance sea state is greater for the larger γ value (Figure 4B) due to the narrower bandwidth since the peak coincides with the resonant frequency. Conversely, in the 50-year sea state the spectral peak is at a lower frequency and hence the wider bandwidth generated by γ = 1 leads to a higher energy content at the resonant frequency. Further data for additional sea states and γ values would be beneficial to more fully understand the effect of bandwidth. The present data implies that the preceding waves must be taken into consideration when designing a SDW for extreme events. Taking the Resonance NW as an example, although the main peak of the wave is similar, the preceding waves differ significantly between γ = 1 and γ = 3.3 (Figure 6A). Since the response also differs, it is hypothesised that the preceding waves are responsible for the discrepancy. The floating structure’s response to these preceding waves will affect the relative velocity, position and orientation of the structure when the interaction with the main wave peak occurs, which will consequently alter the response. In short, the present problem contains memory effects which are non-negligible, at least for the present variable.
Considering the mooring load (Figure 7), the trends in the data are generally similar to those observed for the hinge-angle. In the Resonance sea state, the largest waves do not necessarily produce the highest mooring loads. For example, the MLER (γ = 3.3) SDW produces the largest response but the peak surface elevation is significantly lower than the NW SDWs (Figure 7B). However, unlike for the hinge-angle, all of the SDWs based on the 50-year sea state produce significantly larger mooring loads than the Resonance sea state (Figure 7D).
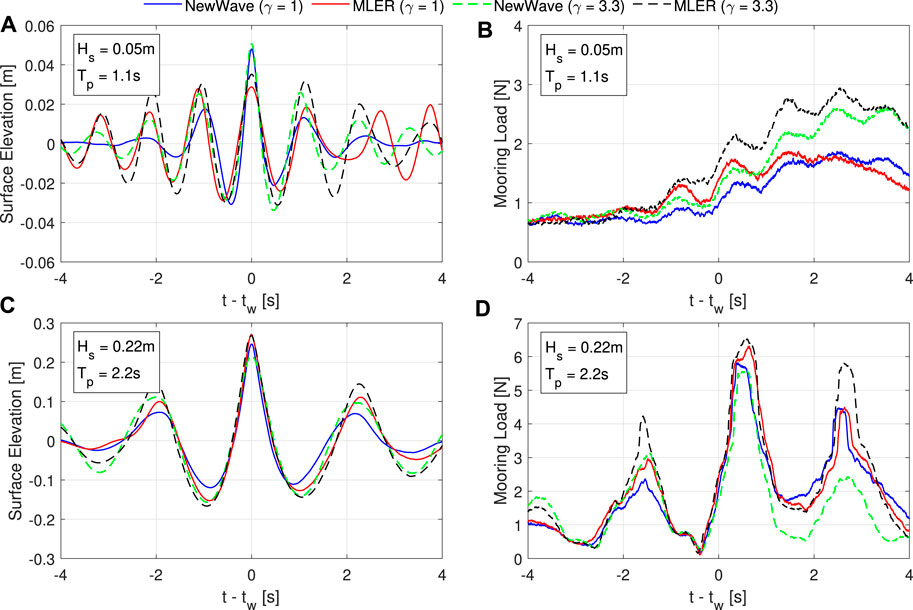
FIGURE 7. Surface elevation (A,C) and mooring load (B,D) time series for each single SDWs: NewWave, γ = 1 (blue solid); MLER, γ = 1 (red solid); NewWave, γ = 3.3 (green dashed); MLER, γ = 3.3 (black dashed). The top row (A,B) presents the Resonance sea state (Tp = 1.1 s, Hs = 0.05 m) and the bottom row (C,D) the 50-year sea state (Tp = 2.2 s, Hs = 0.22 m). Time is relative to the peak wave elevation, tw.
5 Constrained short design waves
In the single SDWs (Section 4), it is observed the transient dynamics of the floating structure cannot be neglected when designing SDWs. The response of the structure to the preceding waves will alter the relative velocity, position and orientation of the device at the time of impact with the main wave peak, which consequently affects the response. When attempting to obtain extreme responses, these memory effects significantly increase the parameter space of the problem since each response is also a function of the response to the preceding waves. Since there is an infinite number of possible combinations of preceding waves, this problem lends itself towards a stochastic approach, where the SDW is embedded within a short background sea state (with random phases). This is the subject of the present section.
5.1 Hinge-angle
Figure 8 presents surface elevation (a) and hinge-angle (b) time series for each of the 20 individual CRRW runs (grey solid) for the 50-year sea state (Tp = 2.2 s, Hs = 0.22 m, γ = 3.3). The maximum response for each run is indicated as a red circle, and the range of maximum responses for all runs is indicated by the red shaded region. Consistent with the previous research utilising constrained SDWs (Göteman et al., 2015; Hann et al., 2018), each individual run produces a significantly variation in the hinge-angle response despite having similar wave statistics, with maximum responses ranging from 20.1° to 32.3°. There is also some variation in the peak wave elevation (Figure 8A), but there is no correlation between this and the maximum response as shown in Figure 8C. The large range observed in the hinge-angle data, and lack of correlation with wave height, reinforces the aforementioned point that the response is very sensitive to memory effects in the present application. The MLER result is also provided for reference (green dashed line in Figure 8). It is observed that the MLER is similar to the mean of the individual CRRW runs, which is to be expected since the waves have been conditioned based on the linear RAOs. Consequently, larger values can be achieved using the CRRW approach, although there is an element of risk since it is possible that the extreme responses may be missed due to the stochastic nature of the problem.
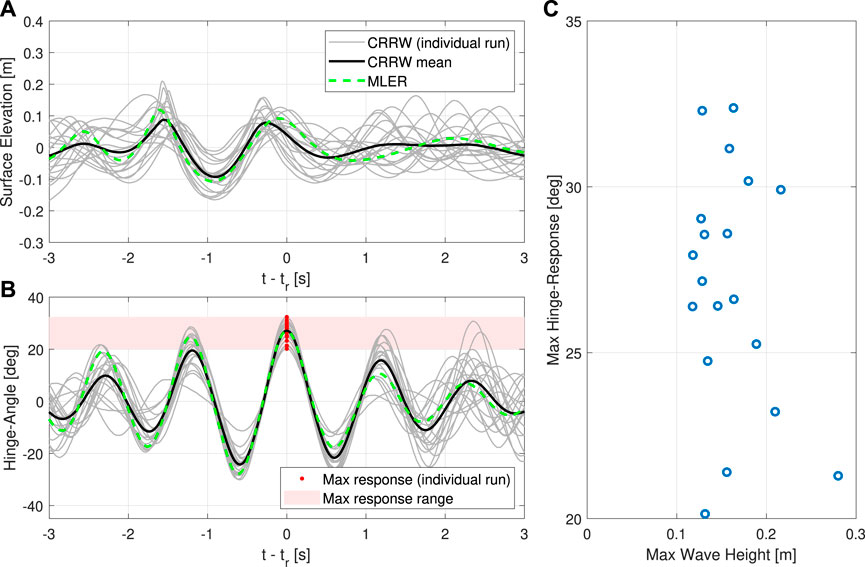
FIGURE 8. Surface elevation (A) and hinge-angle (B) time series for the CRRWs around the time of maximum response (tr) for the 50-year sea state (γ = 3.3). Each grey line is a single CRRW run and the mean profile is given by the black solid line, with the corresponding MLER provided for reference (green dashed). The maximum hinge-angle achieved for each run is indicated by the red dots, along with the range of these responses (red shaded region). Variation of maximum hinge angle response with maximum wave height is also shown (C).
Figure 9 presents the maximum hinge-angle responses for each sea state obtained from the single SDWs; each run of the constrained SDWs; and each seed of the irregular sea states. The average maxima from each of the different methods is also presented (1-h irregular sea state in red dotted; CRRW in blue dashed), along with the 95% confidence interval (shaded region) obtained from a bootstrapping method using 10,000 samples. Each bar is coloured based on the non-exceedance probability obtained from the EVDs presented in Section 3.2. A different sea state is presented in each plot: Hs = 0.05 m, Tp = 1.1 s, γ = 1 (a); Hs = 0.05 m, Tp = 1.1 s, γ = 3.3 (b); Hs = 0.22 m, Tp = 2.2 s, γ = 1 (c); and Hs = 0.22 m, Tp = 2.2 s, γ = 3.3 (d). It is observed that there is a large range of maxima across the CRRW runs in all sea states, further reinforcing the importance of memory effects. The MLER result, generally has good agreement with the calculated mean of the 20 CRRW runs and is within the 95% confidence interval in all cases. As previously noted, however, there is still a significant range of values observed in the CRRW runs, and naturally there are responses significantly larger than MLER, indicating that a constrained approach is beneficial in the present application.
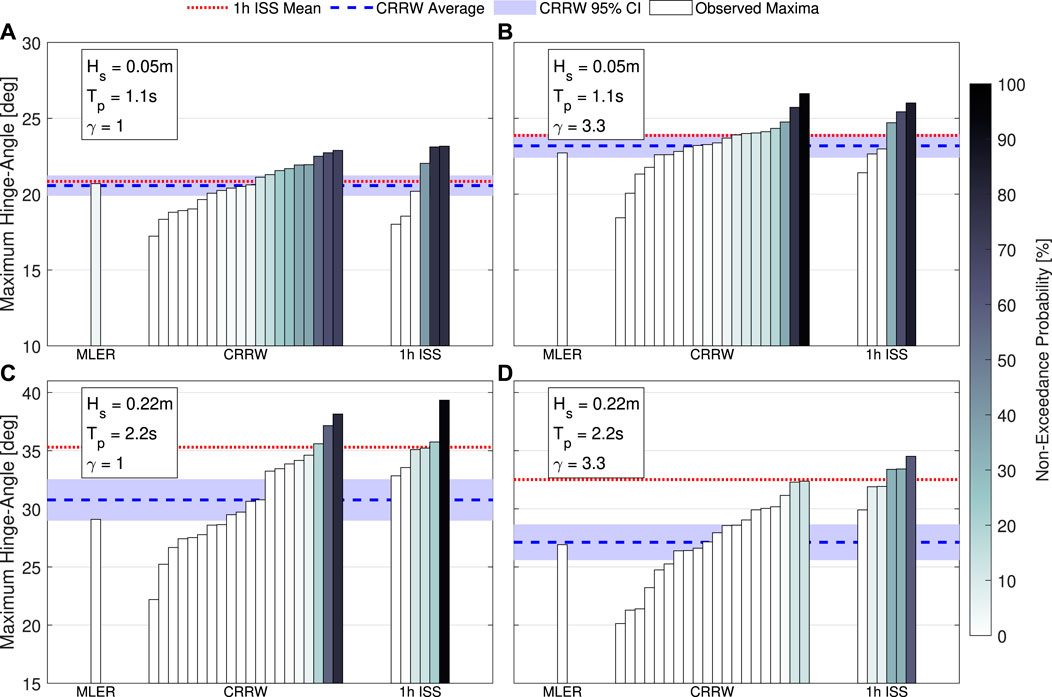
FIGURE 9. Maximum hinge-angle response obtained from the single and constrained SDWs, and irregular sea states. The average maximum response from each of the CRRW runs is also presented (blue dashed lines), along with the 95% confidence interval (shaded region), and average maxima from the 1-h irregular sea state. Each bar is coloured based on the non-exceedance probability. Each subplot (A–D) is a different sea states (parameters shown in the top left).
Comparing the CRRW runs with the irregular sea state results for the Resonance cases (Hs = 0.05, Tp = 1.1 s), it is observed that the largest values are similar to those irregular sea state and even exceed these in the γ = 3.3 case (Figure 9B). The non-exceedance probability of the largest response in the γ = 3.3 case is 95.7%, which is above the 75% that is often targeted (DNV, 2014). Conversely, the γ = 1 case has smaller non-exceedance probability
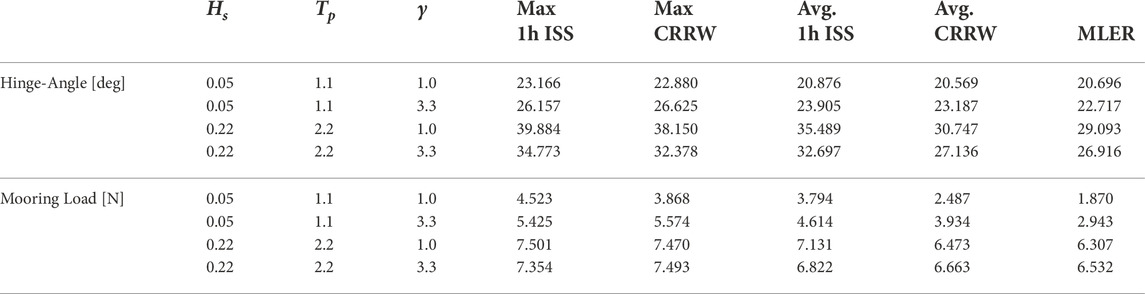
TABLE 3. Largest and average “maximum response” for the irregular sea states and CRRW runs. The maximum response values for the MLER are also presented for reference.
For the 50-year sea state (Hs = 0.22 m, Tp = 2.2 s) the performance of the CRRW approach is considerably reduced with both the largest and average values for the maximum response in each individual run approximately 5° lower than the irregular sea state equivalent (Figures 9C,D; Table 3). This is due to poor agreement of the CRRW profiles with the average profile from the irregular waves observed to lead to the extreme pitch response (Figure 10C). Typically, if the response-conditioning method is valid (i.e., can be predicted by linear RAOs) then the average profiles of the waves leading to the extreme loading events in the irregular sea state and CRRWs will be comparable, similar to observed in the Resonance sea state in this work (Figure 10A). In cases where the comparison between the two profiles is poor, this generally indicates that important additional effects that are not provided by the RAOs are being neglected, such as history effects or higher-order effects leading to changes in behaviour. In the 50-year sea state, the influence of the moorings is thought to be the cause since the average CRRW profile in the second before the extreme response is more in-line with the average irregular sea state profile when considering the mooring load (Figure 10D). Further sea states should be studied in the future to better understand the conditions in which the approach provides the best results for the present application. This also highlights a key consideration with the constrained SDW and long-duration irregular sea state methods: there is always an element of uncertainty regarding the obtained deterministic values due to the randomness associated with the seeds. In all cases it is possible that the conditions leading to the extreme values are missed completely. Increasing the quantity of data (i.e. more random seeds) would help reduce the uncertainty and this should be conducted in future work.
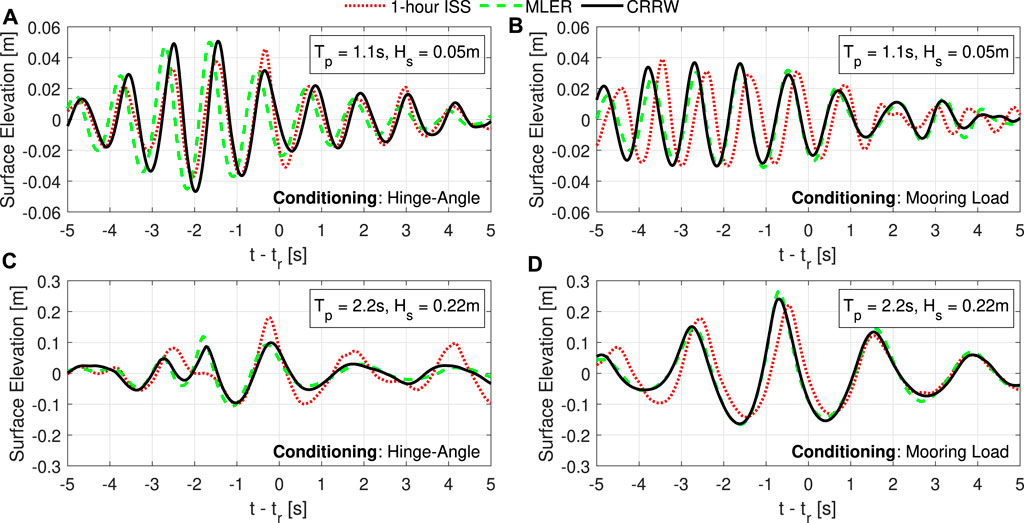
FIGURE 10. Average wave profiles leading to the largest event in each 1-h irregular sea state run (red dotted) compared with the average CRRW (black solid) and MLER (green dashed) wave profiles. Each plot is a different response-conditioning and sea state combination: Hinge-angle in the resonance (A) and 50-year (C) sea states (γ = 3.3); mooring load in the resonance (B) and 50-year (D) sea states (γ = 3.3).
5.2 Mooring load
Figure 11 presents the maximum mooring load values from the SDWs and irregular sea states. The format is the same as the equivalent plot for the hinge-angle (Figure 9; Section 5.1). Interestingly, the trends noted in the hinge-angle are now reversed for the CRRW approach with significant under-estimates in the mean extreme mooring load for the Resonance sea state (Figures 11A,B) compared with the long-duration irregular sea state, and better agreement in the 50-year sea state (Figures 11C,D). This is due to the contribution of the low frequency surge motion, which peaks at the pitch resonant period with the mean drift force. The maximum values in the Resonance γ = 3.3 case, however, are larger than the long-duration equivalent (Table 3). In fact, many of the others are larger than the mean of the long-duration irregular sea state, but there seems to be a step in the results which consequently reduces the mean value. It is unclear whether this is simply due to the random nature of the problem or whether certain conditions must occur in order to achieve this higher-step value. The EVDs produced from the long-duration irregular sea states (Section 3.2; Figure 5D) exhibited low gradient due to the sporadic occurrence of very large maxima in the 1-h time series. This has consequences in the present analysis: firstly, the non-exceedance probability is very low for these cases
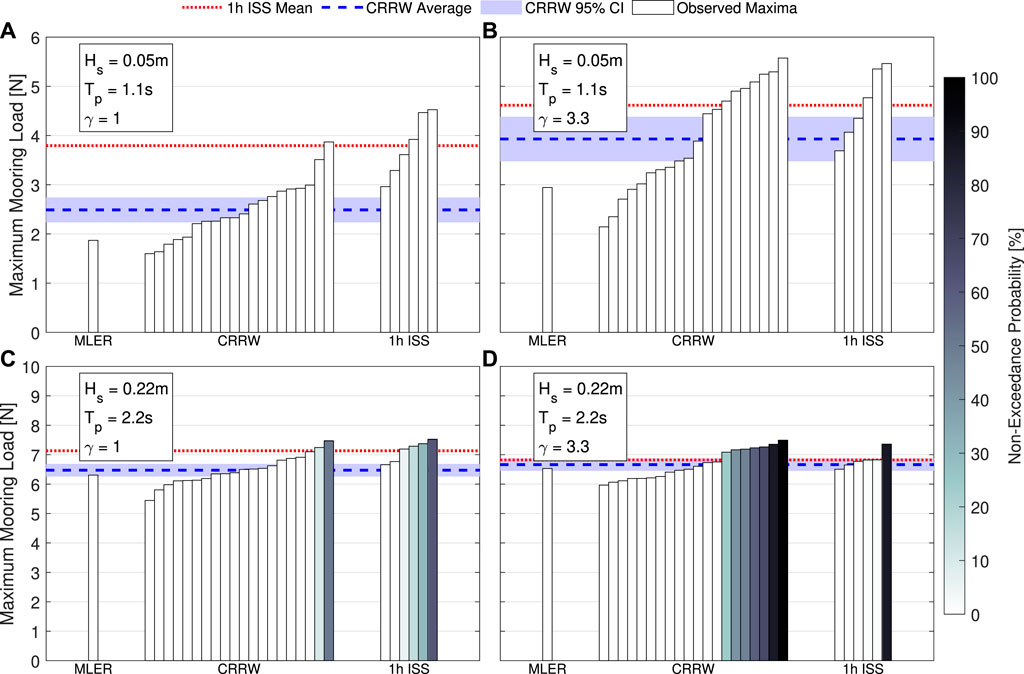
FIGURE 11. Maximum mooring load response obtained from the single and constrained SDWs, and irregular sea states. The average maximum response from each of the CRRW runs is also presented (blue dashed lines), along with the 95% confidence interval (shaded region), and average maxima from the 1 h irregular sea state. Each bar is coloured based on the non-exceedance probability. Each subplot (A–D) is a different sea states (parameters shown in the top left).
6 Discussion
The results presented in Section 5 indicate that SDWs can be an effective method to assess extreme loading of WECs under certain conditions, and consequently have potential to streamline design processes. Before this potential can be realised, however, a number of issues must be addressed and standardised SDW procedures developed in order to ensure reliable results in optimal time.
One particular area for improvement is how best to handle the large variation in maxima observed over the constrained SDW runs. For instance, in the 50-year γ = 1 wave, CRRW generally provides lower maximum hinge-angles (Figure 9C) than the 1-h irregular sea state, but there are two runs that provide a much larger value than the others, similar to the largest value from the 1-h irregular sea state run. This is clearly due to an element of random chance for both the constrained waves and irregular sea states, but most importantly it indicates that the constrained approaches are capable of providing extreme loads given the “correct” preceding wave conditions occur. The crucial question is whether it is possible to identify the reasons that these particular preceding waves cause a larger response. If this can be achieved then it opens up the possibility of tailoring the wave profile such that extreme loads are provided more frequently across the constrained SDW runs, improving the reliability and efficiency of the method. This would be especially useful if the response is dependent on information that is known a priori such as the target wave, or can be obtained through minimal additional simulations (e.g., a single irregular sea state). For example, considering the aforementioned step in CRRW mooring load results (Section 5.2; Figure 11D) for the Resonance sea state (γ = 3.3), it is observed that the high-loading events tend to positively correlate with derived process maxima (Seyffert et al., 2016) of the target wave elevation (Figure 12A), obtained using the five preceding waves at the peak period. This correlation is due to large offsets in surge, a parameter that mooring load is closely linked with (Figure 3A) which tends to occur if the derived process maxima is large in this specific sea state. Although, this identified trend based on information available prior to the simulation could theoretically be used to improve the efficiency of the background wave selection, it is noted that the correlation in the 50-year sea state (Figure 12B) is comparatively weaker. This inconsistency limits the practical application of this observation to an extent, but it could still be used to provide constraints on the random background waves. Only considering the waves with derived process maxima over a given threshold, for example, would not adversely affect the 50-year sea state result, while improving it significantly for the Resonance sea state. Further SDW data are required for other sea states, however, in order to determine any generic trends which could help optimise SDW procedures. This will be the focus of future work, along with obtaining additional irregular sea state data to provide a more reliable target load which is in-line with present design standards.
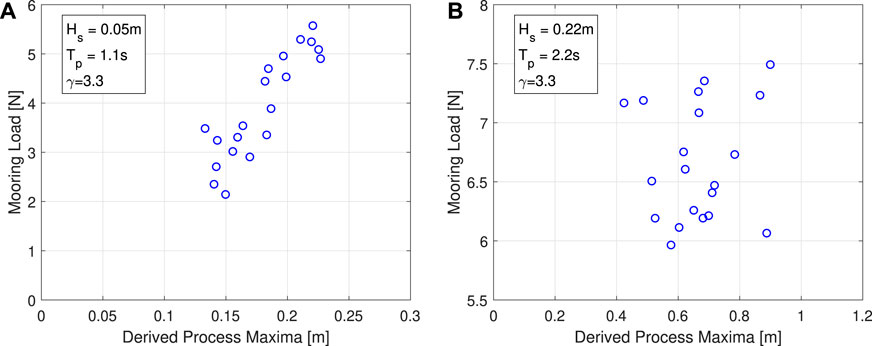
FIGURE 12. Maximum mooring load response as a function of derived process maxima for the CRRW runs, generated using the target wave profile (five preceding peaks with time interval Tp). Each SDW run for the Resonance sea state (A) and 50-year sea state (B), are presented both with γ = 3.3.
The identification of trigger conditions for high-loading events in a particular sea state also raises questions as to whether design process efficiency could be improved by only analysing sea states with previously identified trends. For instance, selecting a single specific sea state where the wave conditions leading to high loads are known would reduce the required number of constrained SDWs runs. Furthermore, selecting sea states in this manner could potentially be a more reliable approach than selecting multiple sea states with completely random background waves since it removes the risk of larger loading events not occurring. Taking the prior derived process example (Figure 12), if analysis is limited to derived process maxima greater than 0.2 m, the Resonance sea state provides 5 N reliably. Although this is lower than the average 50-year sea state results, it is noted that the significant wave height is considerably smaller. Furthermore, there is a large range in the results for the 50-year sea state (4.5 N–7.5 N), which increases uncertainty if only a small number of random seeds can be simulated. Assuming the positive correlation with the derived process maxima holds for all sea states at the resonance frequency, however, it could be possible to obtain reliably high loads in-line with or exceeding the 50-year case by selecting a larger Hs resonant sea state on the 50-year contour (or more likely, the largest Hs value possible without exceeding the breaking limit). This will be investigated as part of future work.
General utilisation of trends in the data to optimise constrained SDWs would likely rely on information being transferable to other similar concepts. Assuming this is not possible, or the trends are too complicated to reproduce reliably, then optimisation of the present constrained SDW procedures would be required. Improved results may be obtained by only selecting the largest responses from the constrained SDW runs to determine the design load. The optimal number of random seeds required to be within a given confidence interval needs to be determined for the present device, and compared with alternative concepts. Building upon previous SDW research in alternative applications (Taylor et al., 1997; Dietz, 2005), a probabilistic method analogous to that currently used for irregular sea states may be beneficial, where a high-percentile loading is determined based on the EVDs, obtained through distribution fitting and extrapolation of the SDW data. Another potential area for improvement is the inclusion of Quadratic Transfer Functions (QTFs) in the SDW approaches, which have been demonstrated to be important for modelling extreme responses of attenuator WECs in some sea states due to low frequency motions (Retzler, 2006; Fonseca et al., 2008). The MLER approach previously has been successfully modified to include QTFs (Lim and Kim, 2018), with application to a semi-submersible floating wind device. Future work will consider all of the aforementioned potential improvements for SDW approaches with reference to both hinged-raft WECs and a range of alternative floating ORE devices.
7 Conclusion
The use of SDWs for predicting extreme loading events on a floating hinged-raft WEC is investigated through a 1:50 scale physical modelling campaign. SDWs are shorter duration wave profiles consisting of single or multiple wave groups, designed to produce extreme loading events on a device. The present study aims to evaluate whether SDWs can provide reliable extreme loading predictions that are in-line with those obtained using current design standards, which are based on long-duration irregular sea states. Three existing SDW concepts are considered: NW and MLER both of which are single wave groups; and CRRW which is a constrained wave groups, i.e., MLER embedded within a short random irregular background wave. Each concept is tested for predictions of hinge-angle and mooring load in two sea states (and two γ values) with the same steepness but one is at the pitch resonant frequency, and the other on the 50-year return contour.
The results indicate that the both single SDW approaches generally under-predict the maximum loading compared with present design standards. The constrained SDW runs show large variation in the observed maximum loading highlighting that memory effects are an important consideration when predicting extreme loading on floating, stationed devices. The CRRWs generally compares well with the irregular data for the extreme hinge-angle loading in the Resonant wave. Otherwise, it tends to under-estimate the average maximum response of the device.
Although the SDWs do tend to under-predict the average maxima response, the constrained runs also generally exhibit similar, and sometimes larger, maximal values as those observed in the 1-h irregular sea state data in the majority of cases. This implies that SDW are able to produce large loading events given the “correct” wave conditions. Should the wave conditions that trigger these extreme events be identified through trends in the data, then SDWs have potential as a viable and more efficient alternative to established techniques. For instance, it is shown that it is possible to pre-determine the random background wave such that large mooring loads will be more likely to occur in the Resonant sea state based solely on the preceding waves of the target surface elevation profiles. Future work will aim to determine further trends through data collection in additional sea states, devices and variables. Furthermore, effort to optimise SDW procedures by considering the number of constrained SDW runs are required in order to satisfy particular confidence intervals; whether more reliable results can be obtained from only averaging a set number of the largest responses from all the separate runs; the potential benefits of including QTFs in the SDW approaches; and high-percentile probabilistic approaches based on distribution fitting.
Data availability statement
The raw data supporting the conclusion of this article will be made available by the authors, without undue reservation.
Author contributions
SJ, TT, MH, and DG contributed to conception and design of the study. SJ collected the physical dataset. SB, TT, and SJ performed analysis and interpretation of the data. SB wrote the first draft of the manuscript. All authors contributed to manuscript revision, read, and approved the submitted version.
Funding
The authors gratefully acknowledge that this work was funded by the Engineering and Physical Sciences Research Council, UK, through the “Supergen ORE Hub” grant (EP/S000747/1).
Conflict of interest
The authors declare that the research was conducted in the absence of any commercial or financial relationships that could be construed as a potential conflict of interest.
Publisher’s note
All claims expressed in this article are solely those of the authors and do not necessarily represent those of their affiliated organizations, or those of the publisher, the editors and the reviewers. Any product that may be evaluated in this article, or claim that may be made by its manufacturer, is not guaranteed or endorsed by the publisher.
References
Adegeest, L. (1998). “Use of nonlinear sea-load simulations in the design of ships,” in Proceedings of PRADS’1998, Delft.
Bennett, S., Hudson, D., and Temarel, P. (2012). A comparison of abnormal wave generation techniques for experimental modelling of abnormal wave–vessel interactions. Ocean. Eng. 51, 34–48. doi:10.1016/j.oceaneng.2012.05.007
Coe, R. G., Michelen, C., Eckert-Gallup, A., and Sallaberry, C. (2018a). Full long-term design response analysis of a wave energy converter. Renew. Energy 116, 356–366. doi:10.1016/j.renene.2017.09.056
Coe, R. G., Yu, Y.-H., and Van Rij, J. (2018b). A survey of WEC reliability, survival and design practices. Energies 11, 4. doi:10.3390/en11010004
Coe, R. G., Rosenberg, B. J., Quon, E. W., Chartrand, C. C., Yu, Y.-H., Van Rij, J., et al. (2019). CFD design-load analysis of a two-body wave energy converter. J. Ocean. Eng. Mar. Energy 5, 99–117. doi:10.1007/s40722-019-00129-8
Davey, T., Sarmiento, J., Ohana, J., Thiebaut, F., Haquin, S., Weber, M., et al. (2021). Round robin testing: Exploring experimental uncertainties through a multifacility comparison of a hinged raft wave energy converter. J. Mar. Sci. Eng. 9, 946. doi:10.3390/jmse9090946
Dietz, J. S. (2005). Application of conditional waves as critical wave episodes for extreme loads on marine structures. PhD thesis. Copenhagen, Denmark: Technical University of Denmark.
DNV (2014). Environmental conditions and environmental loads. Recommended Practice DNV-RP-C205 182. Høvik, Norway: Det Norske Veritas AS.
Drummen, I., Wu, M., and Moan, T. (2009). Numerical and experimental investigations into the application of response conditioned waves for long-term nonlinear analyses. Mar. Struct. 22, 576–593. doi:10.1016/j.marstruc.2008.12.002
[Dataset] European Centre for Medium-Range Weather Forecasts (2022). Era5 hourly data on single levels from 1959 to present. Available at: https://cds.climate.copernicus.eu/cdsapp#!/dataset/reanalysis-era5-single-levels?tab=overview (Last accessed 10 10, 2022).
Fonseca, N., Pascoal, R., Marinho, J. o., and Morais, T. (2008). “Analysis of wave drift forces on a floating wave energy converter,” in International Conference on Offshore Mechanics and Arctic Engineering, 831–839. 48234.
Göteman, M., Engström, J., Eriksson, M., Hann, M., Ransley, E., Greaves, D., et al. (2015). “Wave loads on a point-absorbing wave energy device in extreme waves,” in The Twenty-fifth International Ocean and Polar Engineering Conference (International Society of Offshore and Polar Engineers).
Hann, M., Greaves, D., and Raby, A. (2015). Snatch loading of a single taut moored floating wave energy converter due to focussed wave groups. Ocean. Eng. 96, 258–271. doi:10.1016/j.oceaneng.2014.11.011
Hann, M., Greaves, D., Raby, A., and Howey, B. (2018). Use of constrained focused waves to measure extreme loading of a taut moored floating wave energy converter. Ocean. Eng. 148, 33–42. doi:10.1016/j.oceaneng.2017.10.024
IEC (2015). Marine energy—wave, tidal and other water current converters—Part 101: Wave energy resource assessment and characterization, IEC TS 62600-101:2015. Geneva, Switzerland: International Electrotechnical Commission.
IEC (2019). Marine energy—Wave, tidal and other water current converters—Part 2: Marine energy systems—Design requirements, IEC TS 62600-2:2019. Geneva, Switzerland: International Electrotechnical Commission.
Jin, S., and Greaves, D. (2021). Wave energy in the UK: Status review and future perspectives. Renew. Sustain. Energy Rev. 143, 110932. doi:10.1016/j.rser.2021.110932
Katsidoniotaki, E., Nilsson, E., Rutgersson, A., Engström, J., and Göteman, M. (2021). Response of point-absorbing wave energy conversion system in 50-years return period extreme focused waves. J. Mar. Sci. Eng. 9, 345. doi:10.3390/jmse9030345
Lim, D.-H., and Kim, Y. (2018). Design wave method for the extreme horizontal slow-drift motion of moored floating platforms. Appl. Ocean Res. 71, 48–58. doi:10.1016/j.apor.2017.12.004
Michelen, C., and Coe, R. (2015). “Comparison of methods for estimating short-term extreme response of wave energy converters,” in OCEANS 2015-MTS/IEEE Washington (IEEE), 1.
Quon, E., Platt, A., Yu, Y.-H., and Lawson, M. (2016). “Application of the most likely extreme response method for wave energy converters,” in ASME 2016 35th International Conference on Ocean, Offshore and Arctic Engineering (American Society of Mechanical Engineers Digital Collection).
Ransley, E., Greaves, D., Raby, A., Simmonds, D., and Hann, M. (2017). Survivability of wave energy converters using CFD. Renew. Energy 109, 235–247. doi:10.1016/j.renene.2017.03.003
Ransley, E., Brown, S., Hann, M., Greaves, D., Windt, C., Ringwood, J., et al. (2020a). Focused wave interactions with floating structures: A blind comparative study. Proc. Institution Civ. Eng. - Eng. Comput. Mech. 174, 46–61. doi:10.1680/jencm.20.00006
Ransley, E., Yan, S., Brown, S., Hann, M., Graham, D., Windt, C., et al. (2020b). A blind comparative study of focused wave interactions with floating structures (CCP-WSI Blind Test Series 3). Int. J. Offshore Polar Eng. 30, 1–10. doi:10.17736/ijope.2020.jc774
Retzler, C. (2006). Measurements of the slow drift dynamics of a model Pelamis wave energy converter. Renew. Energy 31, 257–269. doi:10.1016/j.renene.2005.08.025
Ropero-Giralda, P., Crespo, A. J., Tagliafierro, B., Altomare, C., Domínguez, J. M., Gómez-Gesteira, M., et al. (2020). Efficiency and survivability analysis of a point-absorber wave energy converter using DualSPHysics. Renew. Energy 162, 1763–1776. doi:10.1016/j.renene.2020.10.012
Rosenberg, B. J., Mundon, T. R., Coe, R. G., Quon, E. W., Chartrand, C. C., Yu, Y.-H., et al. (2019). Development of WEC design loads: A comparison of numerical and experimental approaches. Tech. rep. Golden, CO (United States): National Renewable Energy Lab.
Seyffert, H. C., Kim, D.-H., and Troesch, A. W. (2016). Rare wave groups. Ocean. Eng. 122, 241–252. doi:10.1016/j.oceaneng.2016.05.053
Seyffert, H., Kana, A., and Troesch, A. (2020). Numerical investigation of response-conditioning wave techniques for short-term rare combined loading scenarios. Ocean. Eng. 213, 107719. doi:10.1016/j.oceaneng.2020.107719
Song, X., Wang, S., Hu, Z., and Li, H. (2019). A hybrid Rayleigh and Weibull distribution model for the short-term motion response prediction of moored floating structures. Ocean. Eng. 182, 126–136. doi:10.1016/j.oceaneng.2019.04.059
Tagliafierro, B., Göteman, M., Engström, J., Martínez-Estévez, I., Domínguez, J., Crespo, A., et al. (2022). “Investigation into embedded focused wave group suitability for assessment of extreme hydrodynamics loads on point-absorber WECs,” in Trends in Renewable Energies Offshore: Proceedings of the 5th International Conference on Renewable Energies Offshore (RENEW 2022), 421–429. doi:10.1201/9781003360773-48
Taylor, P. H., Jonathan, P., and Harland, L. A. (1997). Time domain simulation of jack-up dynamics with the extremes of a Gaussian process. J. Vib. Acoust. 119 (4), 624–628. doi:10.1115/1.2889772
Tosdevin, T., Jin, S., Cao, A., Simmonds, D., and Hann, M. (2021). “Extreme responses of a hinged raft type wave energy convertor,” in Proceedings of the 14th European Wave and Tidal Energy Conference Plymouth, UK.
Tosdevin, T., Jin, S., Simmonds, D., Hann, M., and Greaves, D. (2022). “On the use of constrained focused waves for characteristic load prediction,” in Proceedings of the 5th International Conference on Renewable Energies Offshore (RENEW) Lisbon, Portugal.
Tromans, P. S., Anaturk, A. R., and Hagemeijer, P. (1991). “A new model for the kinematics of large ocean waves-application as a design wave,” in The first international offshore and polar engineering conference (International Society of Offshore and Polar Engineers).
Van Rij, J., Yu, Y.-H., and Coe, R. G. (2018). “Design load analysis for wave energy converters,” in International Conference on Offshore Mechanics and Arctic Engineering (American Society of Mechanical Engineers ASME), V010T09A031.
Van Rij, J., Yu, Y.-H., Guo, Y., and Coe, R. G. (2019). A wave energy converter design load case study. J. Mar. Sci. Eng. 7, 250. doi:10.3390/jmse7080250
Wang, S., Larsen, T. J., and Bredmose, H. (2021). Ultimate load analysis of a 10 MW offshore monopile wind turbine incorporating fully nonlinear irregular wave kinematics. Mar. Struct. 76, 102922. doi:10.1016/j.marstruc.2020.102922
Welch, P. (1967). The use of fast Fourier transform for the estimation of power spectra: A method based on time averaging over short, modified periodograms. IEEE Trans. Audio Electroacoust. 15, 70–73. doi:10.1109/tau.1967.1161901
Keywords: MLER, CRRW, WEC, hinge-angle, mooring load, ORE design procedures, newwave
Citation: Jin S, Brown SA, Tosdevin T, Hann MR and Greaves DM (2022) Laboratory investigation on short design wave extreme responses for floating hinged-raft wave energy converters. Front. Energy Res. 10:1069108. doi: 10.3389/fenrg.2022.1069108
Received: 13 October 2022; Accepted: 02 November 2022;
Published: 23 November 2022.
Edited by:
Madjid Karimirad, Queen’s University Belfast, United KingdomReviewed by:
Dezhi Ning, Dalian University of Technology, ChinaCarlos Pérez-Collazo, University of Vigo, Spain
Shan Wang, Universidade de Lisboa, Portugal
Copyright © 2022 Jin, Brown, Tosdevin, Hann and Greaves. This is an open-access article distributed under the terms of the Creative Commons Attribution License (CC BY). The use, distribution or reproduction in other forums is permitted, provided the original author(s) and the copyright owner(s) are credited and that the original publication in this journal is cited, in accordance with accepted academic practice. No use, distribution or reproduction is permitted which does not comply with these terms.
*Correspondence: S. A. Brown, c2NvdHQuYnJvd25AcGx5bW91dGguYWMudWs=
†These authors have contributed equally to this work and share first authorship