 Li Wang1,2
 Xin-Hua Zhang1*
- 1School of Economics and Management, Changsha University of Science and Technology, Changsha, China
- 2School of Intelligent Engineering and Intelligent Manufacturing, Hunan University of Technology and Business, Changsha, China
Under China’s “comprehensive two-child” policy (UTCP) and “three-child” policy (TCP), household’s age structure is bound to change, and this change will further have an impact on household demand for electricity. In order to accurately forecast the impact of fertility policy on residential household electricity demand, we firstly construct a prediction model with annual household electricity consumption as the dependent variable and average electricity price and household-level old-age dependency ratio (HODR) as the independent variables. Second, we use the cohort-component projection model (CCPM) to construct a population prediction model to obtain the macrolevel old-age dependency ratio (MODR). Third, based on the interactive ritual chain (IRC) theory, we explore the statistical relationship between macrolevel old-age dependency ratio and household-level old-age dependency ratio to obtain a prediction method for the household-level old-age dependency ratio. Finally, we take five households as examples and predict their electricity demand from 2022–2035. The following conclusions are obtained: 1) the average electricity price and the household-level old-age dependency ratio have a significant suppressive effect on the electricity demand; 2) for households without the pressure of old-age dependency, the Under China’s “comprehensive two-child” policy’s contribution to electricity demand is pregnant, while “three-child” policy’s is limited; 3) the Under China’s “comprehensive two-child” policy and “three-child” policy cannot fundamentally curb the declining trend of residential electricity demand of China in the long term.
1 Introduction
With the ongoing economic development and the enormous population base, China’s electricity consumption has experienced a high-speed growth in recent decades. The overall quantity of consumption rises from 4.19 trillion kWh in 2010 to 8.31 trillion kWh in 2021, with an average annual growth rate of 12.52%, since China became the largest electricity consumer in 2011. If the constituents are examined further, it is discovered that the ratio from households accounts for a significant percentage in the total electricity consumption and demonstrates an increasing trend, with a yearly growth rate of 27.85% in the pasting 5 years. However, a number of experts predict that the above trend will slow down and even reverse as China transitions into an aging society.
In order to deal with the population aging and prolong its demographic dividend, a series of fertility policies have been introduced by China’s central government, from the initial “comprehensive two-child” policy (UTCP) of 2013 to the more aggressive “three-child” policy (TCP) of 2021. Nevertheless, the efficacy of these stimulation policies is still up for debate. For example, Chen and Sun (2021) and Wang and Wang (2022) asserted that the impact of the TCP on China’s birth population and fertility level would be very limited, while Chen (2021) believed that the implementation of the TCP could mitigate the aging degree in some extent. This ambiguity about the future population quantity and structure of China poses a significant challenge to the electricity sector, which must set plans for power plants and the electricity grid network again.
The studies on the relationship between residential households and electricity consumption currently concentrate on the analysis of the factors influencing residential electricity demand. For instance, Jia and Xu (2021) used a double logit model to estimate the relationship between China’s residential electricity demand elasticity and household total incomes, getting the results that the income elasticity of demand is inelastic in the short run and would turn elastic in the long run. Lin and Wang (2020) estimated the price elasticity of residential electricity demand based on the same model, using household electricity data of 286 cities in China from 2006 to 2016 and found that electricity prices did matter for residential electricity consumption behavior. In terms of measuring the impact of household composition on electricity consumption, Liddle and Lung (2010) and Liddle (2014) divided the U.S. household population by age group into 20–34, 35–49, and 50–64 years and concluded that the older age group had a negative impact on residential electricity consumption. Utilizing the data of China and Korea respectively, Hu and Gong (2020) and Ryu et al. (2021) got similar results. In general, there are many factors affecting residential electricity demand, e.g., household income (Campbell A., 2018; Csereklyei Z., 2020), electricity tariff (He and Reiner 2016; Wang et al., 2017), household make-up (Matar W., 2018; Hessam et al., 2019), household size (Allcott H., 2011; Wang et al., 2022) and so on. Yet, these studies all did not account for the influence of fertility policy.
To address this problem, this paper conducts a specialized research aiming to measure the impact of the China’s fertility policies on its residential electricity demand. Compared with existing studies, the contribution of this paper could be summarized as follows:
(1) The impact of the fertility policy on the electricity demand is measured;
(2) A electricity-demand prediction model considering the influence of the fertility policy is proposed.
The remainder of this paper is organized as follows: In Section 2, we construct a residential electricity demand model and a population prediction model. Section 3 introduces the data and main parameter settings. Section 4 puts forward and discusses the prediction results. Section 5 concludes the paper and offers suggestions.
2 Model and methodology
2.1 Model framework
Though a lot of models have been set forth and applied in electricity demand prediction, due to the detailed data acquisition limitations of households especially in terms of their fertility planning, some methods, such as time-series algorithms (Chou and Tran, 2018), artificial neural networks (Kim and Cho, 2019), or others needing large-sample (Somu et al., 2021), don’t suit the study. For this reason, this article employs an approach that firstly deconstructing the study issue into two sub-issues (i.e., household population prediction and the electricity demand); then constructing their respective corresponding models; at last building a integrated model system to prediction the electricity demand of residential household under the influence of fertility policy. The main logic is shown in Figure 1.
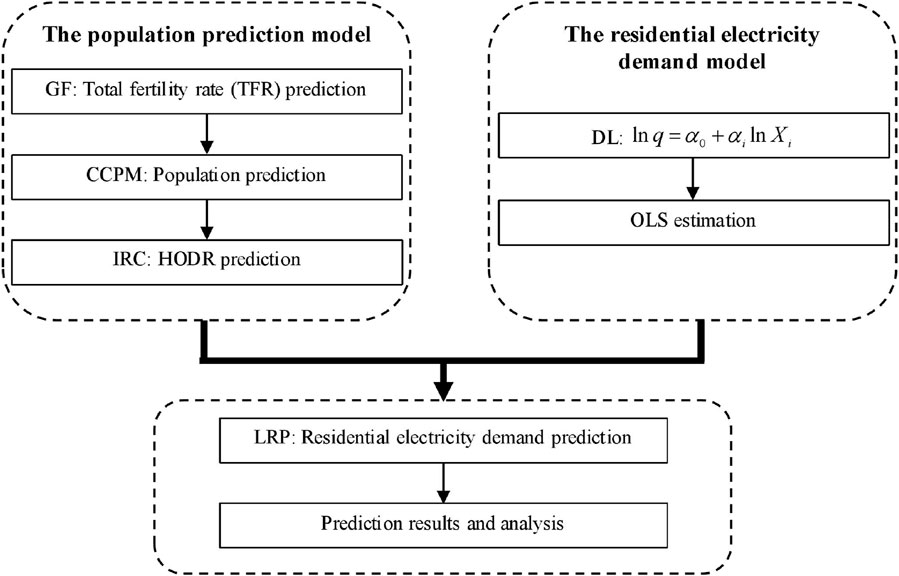
FIGURE 1. Schematic diagram of this paper.
As Figure 1 demonstrates, the cohort-component projection model (CCPM), the grey forecasting algorithm (GF), and the interactive ritual chain (IRC) method are used in the population prediction; on the other hand, the double logit model (DL) based on the China Family Panel Studies (CFPS) database is adopted for forecasting the residential electricity demand and to obtain the logarithmic linear relationship between electricity consumption (
2.2 Phase division
The UTCP and the TCP might well affect the age structure of households and household electricity demand by influencing the fertility intention and behavior of women of childbearing age (reflected by the fertility rate). To explore the relationship between fertility policy and residential electricity demand, we take the release time (year) of the UTCP and the TCP as two time points, hence forming the three time phases: before the UTCP, after the UTCP, and between the two policies.
Phase Ⅰ: 2010–2015, the period before the UTCP. The National Bureau of Statistics (NBS) released annual TFR and age-specific fertility data of women of childbearing age during this period.
Phase Ⅱ: 2016–2021, the first 6 years of the implementation of the UTCP. The NBS has not released fertility data since 2015.
Phase Ⅲ: After 2022, the period after the TCP.
2.3 The cohort-component projection model for population prediction
The CCPM and other simplified variations remain in common use because of their simplicity and low data requirements (Wilson, 2016; Li and Wang, 2021). In this section, the CCPM is adopted to predict the household population. In prediction, assume that the population system is closed-loop with no migration during the prediction cycle. The relevant variables are defined as shown in Table 1.
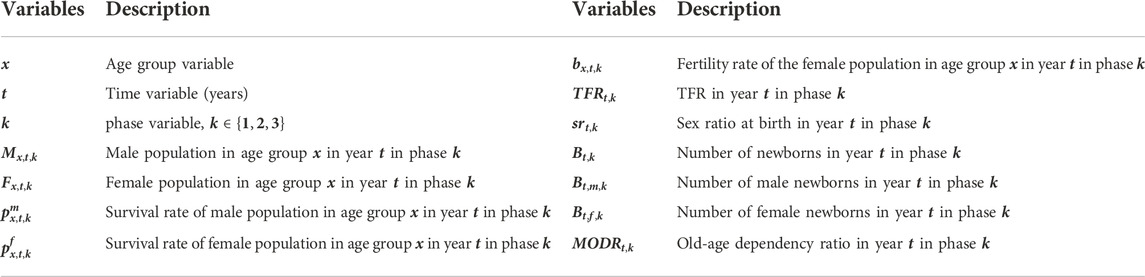
TABLE 1. Description of model variables.
The CCPM is shown below:
where Eqs. 1, 2 predict the male population and the female population in year
2.4 The residential electricity demand model
In this paper, the residential electricity consumption is used as the dependent variable, average electricity price, annual household income, average annual temperature and household-level old-age dependency ratio (HODR) are used as household attribute variables, and then a double logit model for the three phases is constructed, as shown in Eq. 8.
where
To encourage childbirth further, some administrative regions of China, like Zhejiang province and Guangdong province introduced a “multi-population” tiered electricity pricing (TEP) system in 2021. For instance, to the family owning more than seven family members, if they consume 750 kWh a month, a subsidy of 30 RMB will be given under that policy. The other provinces such as Hunan and Yunnan also introduced maternity allowance and subsidy policies in 2022. However, seeing from the outcomes so far, with the development of China’s economic level and the improvement in residents’ living standards, but the effects of these measures are limited. Thus, we can rewrite Eq. 8 as follows:
Furthermore, we can obtain:
3 Data sources and main parameter settings
3.1 Data sources of population
The population-related data in this paper are obtained from World Population Prospects 2022, the 2015–2021 China Population and Employment Statistics Yearbooks and the 2015 National 1% Population Sample Survey. Specifically, the life expectancy of men and women for 2022–2050 is obtained from World Population Prospects 2022; the age-specific sex ratio is obtained from the Yearbooks 2015–2021; the fertility rate of women of childbearing age by age group, the population by age and sex, and the MODR are obtained from the 2015 National 1% Population Sample Survey.
3.2 Data sources of residential electricity consumption
The residential electricity consumption data used in this paper include household microdata and climate data, where household microdata are obtained from the CFPS for 2014, 2016 and 2018, and climate data are obtained from the statistical yearbooks of the provinces and municipalities for 2015, 2017 and 2019. The CFPS can provide the monthly electricity charges, annual income, household size, and household structure of residential households. In addition, we also collate the data about households that already have young children aged 0–14 from 15 provinces and municipalities, including Beijing, Tianjin, Shanghai, Gansu and Liaoning. The distribution of samples is shown in Figure 2, from which we can see that Gansu province has the largest sample size, accounting for 30.4%, and Beijing has the smallest proportion, accounting for 0.4%. The variables are described in Table 2.
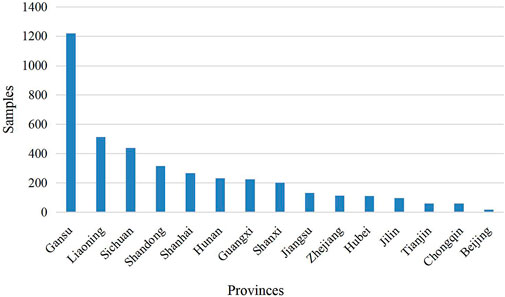
FIGURE 2. The distribution of samples.
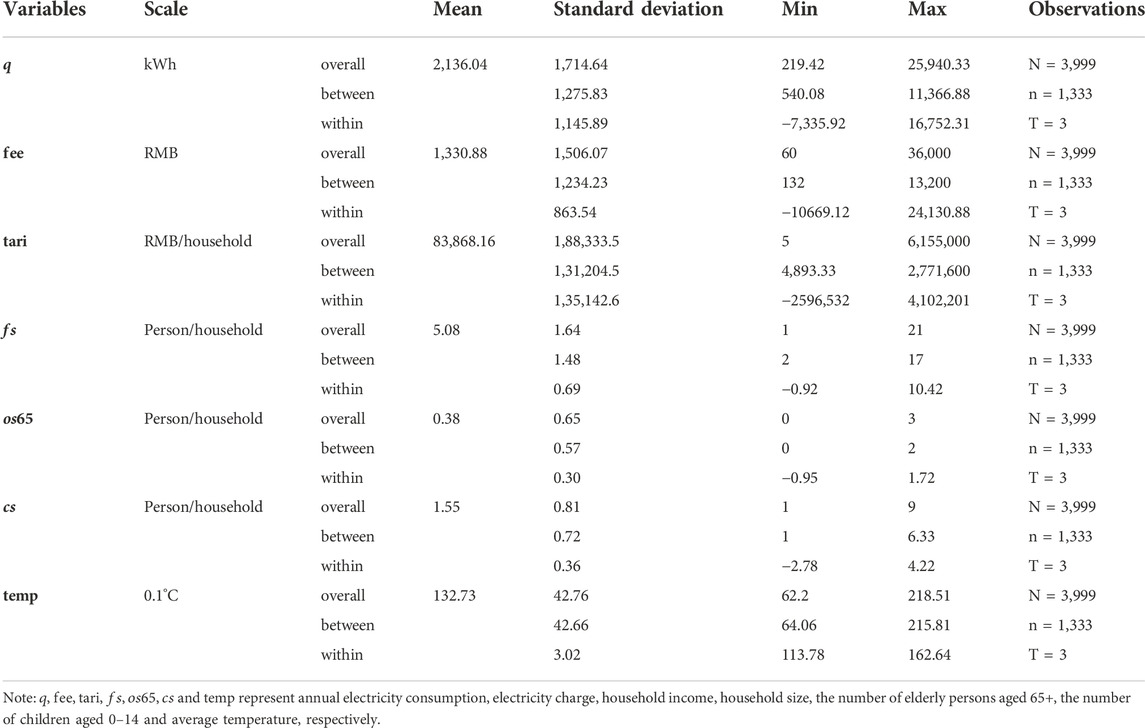
TABLE 2. Descriptive statistics of the data.
Given that the monthly electricity charges are provided in the CFPS database, the annual electricity consumption and the average electricity price should be calculated from Eqs. 11, 12, respectively. Let us define the monthly electricity charge of household
According to Qi and Liu (2020), the HODR can be further obtained as shown in Eq. 13.
where
3.3 Main parameter settings
According to the CCPM in Section 2.3, it is obvious that several important parameters should be obtained before solving the CCPM, including the forecast cycle, TFR, life expectancy, and sex ratio.
(1) Forecast cycle. Since 2015, the NBS has not released fertility data again. Therefore, we set 2016 as the beginning year of the forecast cycle and make 20-year predictions from 2016 to 2035.
(2) TFR. Due to high prediction accuracy and suitability for small data sets of the GF algorithm (Xie and Liu, 2009; Cui et al., 2013; Li and Zhang, 2021), it is used to predict the TFR in different phases.
Phase Ⅰ: Based on the TFR data released by the NBS from 2010 to 2015, the TFRs from 2016 to 2035 can be predicted through the GF algorithm.
Phase Ⅱ: Based on the TFR data estimated by Prof. Qiao for 2016–2020, the TFRs from 2021 to 2035 can be predicted through the GF algorithm.
Phase Ⅲ: Assuming that the TCP has a positive effect on fertility rate, this paper assumes the TFRs of no less than 1.3 from 2022 to 2035.
(3) Life expectancy. Based on the data in the World Population Prospects 2022, the life expectancy for men and women in 2022–2035 are obtained by the linear interpolation method.
(4) Sex ratio. Based on the age-specific sex ratio data from the Yearbooks 2015–2021, the sex ratios for 2022–2035 are obtained through the GF algorithm.
4 Results and analysis
4.1 Estimation of household electricity demand
The 3,999 residential electricity consumption samples from the CFPS database in 2014, 2016, and 2018 are modeled as a double logit model according to Eq. 8 and subjected to least squares (OLS) linear regression, and the results are shown in Table 3. In Table 3, column (I) shows the regression results of average electricity price and HODR with annual household electricity consumption, and column (II) shows the regression results of average electricity price, HODR, annual income, and average temperature with annual household electricity consumption.
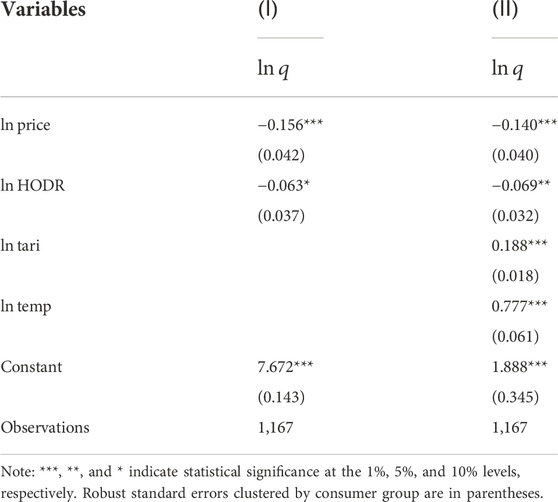
TABLE 3. OLS estimation results of annual household electricity consumption.
The main results are as follows:
(1) Residents are very sensitive to changes in electricity prices. When electricity prices rise, residents will consume less electricity. Columns (I) and (II) report that the average electricity price is statistically significant at the 1% level, with values of −0.156 and −0.140 respectively. This conclusion is in line with the law of the market (quantity discount); that is, the more electricity is consumed, the lower the price.
(2) The more individuals age 65 + in households, the less electricity the households consume. The explanatory variable
(3) Some households with high income tend to consume more electricity. Column (II) reports that the explanatory variable
(4) Residents are very sensitive to changes in temperature. When the temperature rises, residents use more electricity. Column (II) reports that the significance level of the explanatory variable
4.2 Statistical relationship between the macrolevel old-age dependency ratio and the household-level old-age dependency ratio
Based on the IRC theory, we regard that the MODR is the overall performance of the HODR, and the HODR is the radiative distribution of the MODR. So this paper tends to explore the statistical relationship between MODR and HODR. Through calculating the HODR in 3,999 samples, we have obtained some results: the skewness value of 2.66, the mean value
4.3 Prediction results of the macrolevel old-age dependency ratio in different phases
4.3.1 Prediction results of the macrolevel old-age dependency ratio
Table 4 reports the results of the MODR for 2016–2035 in three phases, where BTC, ATC and ARC denote Phase Ⅰ, Ⅱ and Ⅲ, respectively.
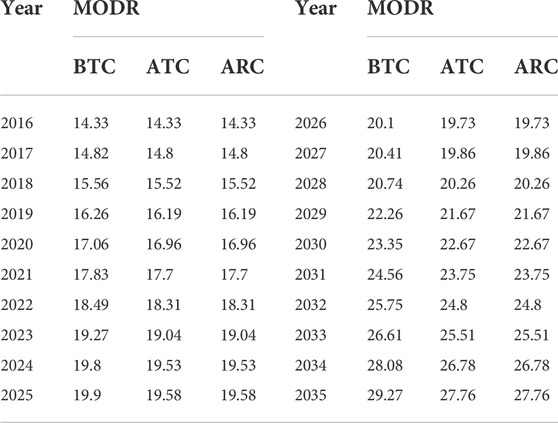
TABLE 4. Prediction results of the MODR for 2016–2035 (%).
The main results are as follows:
(1) From Columns BTC, ATC and ARC, we find that the MODR will increase year by year, indicating that the implementation of the UTCP and the TCP is still far from alleviating the problem of population aging in China.
(2) Comparing the MODR between Columns BTC and ATC, we can conclude that the UTCP is conducive to slowing down population aging, but the effect is limited. For example, in 2021, the fifth year of implementation of the UTCP, the MODR decreases by 4.09%. After 2022, the fertility level gradually stabilizes, based on wich it can be forecasted that the MODR in 2035 will decrease by 5.16%.
(3) Comparing the MODR between Columns ATC and ARC, we find that the values are identical, which indicates that the TCP has no effect on the future demographic structure. Taken the above analysis together, we draw a conclusion that the UTCP and the TCP can help to slow down the growth of the MODR, but the effect of the TCP is very limited. Based on the analysis, we make predictions for Phase Ⅰ and Ⅱ in the following discussion.
4.3.2 Prediction results of the household-level old-age dependency ratio
Based on the HODR value and the probability in normal distribution (see HODR and probability in Table 5), we select five households from the samples. In the five households, #1 has no seniors aged 65+, and the probability is 0.50; #2 has one senior aged 65+ and four members aged 16–64, whose HODR value is 25% and the probability is 0.60; #3 has one senior aged 65+ and three members aged 16–64, whose HODR value is 33.33% and the probability is 0.70; #4 has two senior aged 65+ and four members aged 16–64, whose HODR value is 50% and the probability is 0.85; #5 has two seniors aged 65+ and three members aged 16–64, whose HODR value is 66.67% and the probability is 0.95. Table 5 reports the attribute values in 2018 of the five households. Table 6 reports the prediction results of the HODRs from 2022 to 2035.
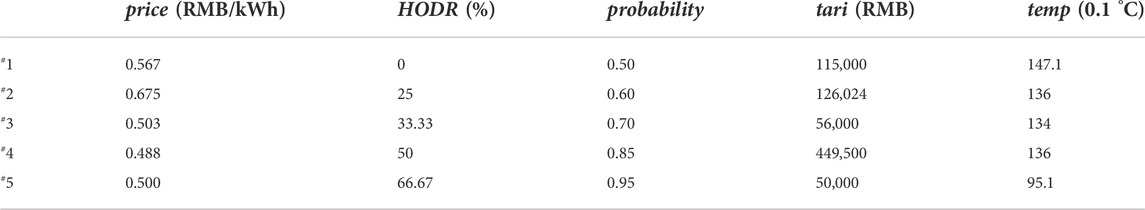
TABLE 5. Attribute values of the five selected families.
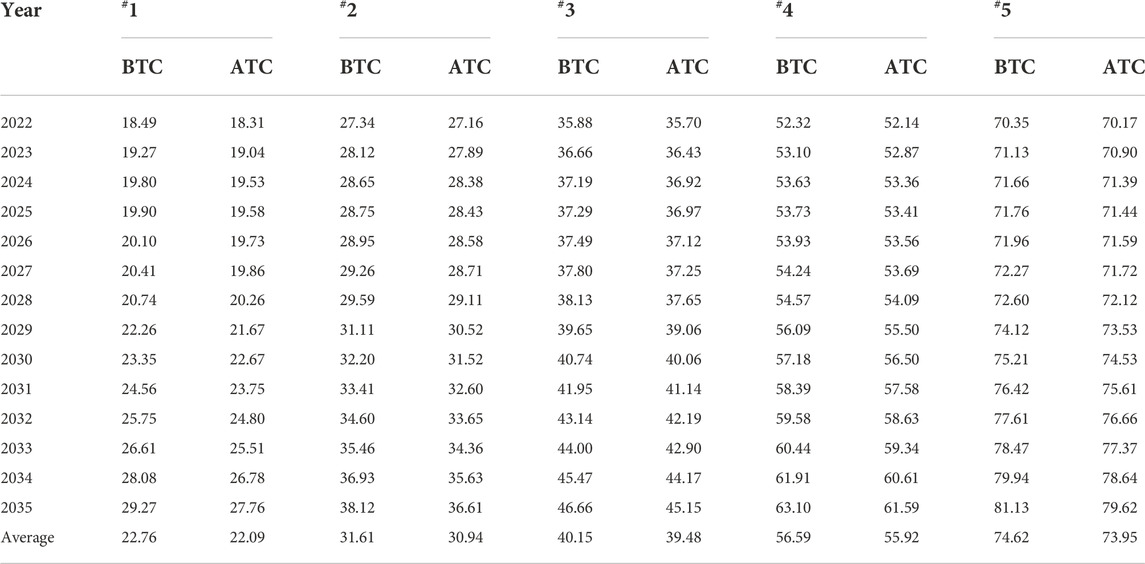
TABLE 6. The prediction results of the HODR for the five selected households in 2022–2035 (%).
We take the example of household #2 to validate the prediction method. From Section 4.2, we have known that the HODR conforms to the normal distribution with the MODR as the mean. We assume that this normal distribution relationship still holds in 2022; i.e.,
Table 6 shows that the UTCP helps to slow down the growth of HODR. Based on the analysis in Section 4.3.1, we can derive that the TCP is conductive to slowing down the growth of HODR, but with little effect. Specifically, among the five households, household #1 has the largest growth in the HODR, and household #5 has the smallest growth. Comparing the HODR in 2035 with that in 2022, in which household #1 increases by 58.30% (Column BTC) and 51.61% (Column ATC), and household #5 increases by 15.32% (Column BTC) and 13.47% (Column ATC). From Columns BTC and ATC, comparing the average values of the HODR, it is found that household #1 decreases the most, approximately 2.93%, and household #5 decreases the least, only 0.89%.
4.4 Prediction results of household electricity demand in different phases
Based on the results in Section 4.3, the electricity demand for the five selected households in 2022–2035 are obtained according to Eq. 10, as shown in Table 7.
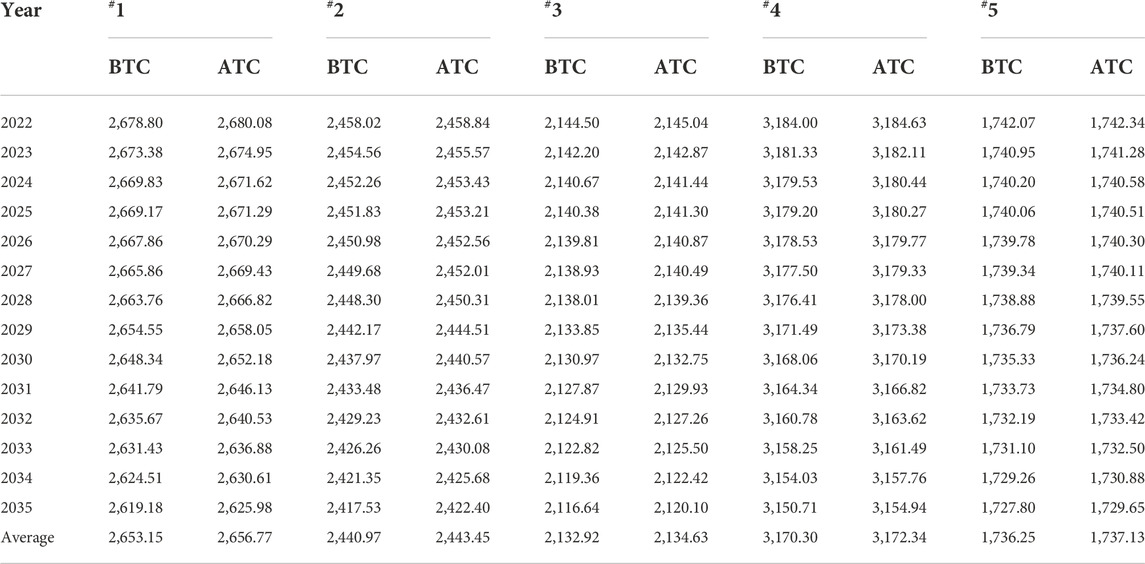
TABLE 7. Annual electricity demand for the five selected households from 2022–2035 (kWh).
According to Table 7, the following findings could be gained.
(1) The annual household electricity demand decreases year by year. By comparing the annual electricity consumption in 2035 and 2022, it is found that the annual electricity demand of household #1 decreases the most, with decreases of 2.23% (Column BTC) and 2.02% (Column ATC). The annual electricity consumption of household #5 has the smallest decline, with declines of 0.82% (Column BTC) and 0.73% (Column ATC).
(2) The UTCP can encourage residents to consume electricity. We focus on the average values in Columns BTC and ATC and find that household #1 has the largest growth range, with an average of 0.14%, while household #5 has the smallest growth range, with an average of 0.05%.
Based on the above analysis, it can be concluded that for households without the pressure of supporting the elderly, the fertility policies may encourage their electricity consumption to some extent, but over time the electricity demand will gradually diminish. For households with great pressure to support elderly individuals, the fertility policies have a very limited promotion effect and little impact on their electricity demand. The results show that the space for further energy savings is very large for households with less pressure of supporting the eldly.
5 Conclusion and suggestions
With the implementation of the UTCP and the TCP, the macrolevel old-age dependency ratio and household-level old-age dependency ratio have also changed, which has a certain impact on residential electricity demand. Studies on this impact are rare in the literature. To explore the impact of the fertility policies on household electricity demand, guide residents to use electricity reasonably, and better realize the rational allocation of electric power energy, we construct three phases in this paper: before the UTCP, after the UTCP, and between the two policies. Next, we predict the residential electricity demand in three phases. The conclusions and implications are as follows.
(1) We build a double logarithmic model of residential electricity demand and carry out OLS estimation based on CFPS data in 2014, 2016 and 2018. The results show that the average electricity price and old-age dependency ratio have significant negative effects on electricity demand.
(2) The implementation of the UTCP will promote residential electricity consumption, especially for households without the pressure to support elderly family members, and its effect is the most obvious. However, the implementation of the TCP has a limited impact on residential electricity demand. The results show that the space for further energy savings is very large for households with less pressure to support elderly family members, and energy-saving awareness should be further promoted in residential electricity consumption.
(3) The UTCP and TCP cannot fundamentally change the declining trend of electricity demand of residents in the future. This is mainly because the fertility policies cannot change the deepening process of population aging, the continuous upward trend of MODR and the HODR will lead to a more siginificant inhibition to residential electricity demand.
(4) The continuous decline in residential electricity demand will make the situation of power supply and demand more severe and will further highlight the problem of power overcapacity. At present, China’s power supply mainly comes from coal power, and the proportion of clean energy, such as hydropower, wind power, nuclear power and solar power, still remains relatively low. Therefore, the relevant power departments should further control the scale of coal power, develop clean power energy and solve the problem of power supply tension as soon as possible. Qiao, 2021, Collins, 2004.
Data availability statement
The original contributions presented in the study are included in the article/Supplementary Material, further inquiries can be directed to the corresponding author.
Author contributions
X-HZ: Conceptualization, Methodology, Supervision. LW: Data curation, Original draft preparation, Reviewing and Editing.
Funding
The Philosophy and Social Science Program of Hunan Province (No. 18YBA270), the Hunan Provincial Social Science Achievement Review Committee Project (No. XSP20YBC024), and the Science and Technology Innovation Program of Hunan Province (No. CX20200818). The key subject of the Science Research Project of Hunan Education Department (no. 22A0464).
Conflict of interest
The authors declare that the research was conducted in the absence of any commercial or financial relationships that could be construed as a potential conflict of interest.
Publisher’s note
All claims expressed in this article are solely those of the authors and do not necessarily represent those of their affiliated organizations, or those of the publisher, the editors and the reviewers. Any product that may be evaluated in this article, or claim that may be made by its manufacturer, is not guaranteed or endorsed by the publisher.
References
Allcott, H., 2011. Rethinking real-time electricity pricing. Resour. Energy Econ., 33(4): 820–842. doi:10.1016/j.reseneeco.2011.06.003
Campbell, A., 2018. Price and income elasticities of electricity demand: Evidence from Jamaica. Energy Econ., 69, 19–32. doi:10.1016/j.eneco.2017.10.040
Chen, W. 2021. China's low fertility and the three-child policy: Analysis based on the data of the Severth National Census. Popul. Econ., 5, 25–35.
Chen, Y. H., and Sun, Y. J., 2021. The three-child policy: Origin, expected effect and policy suggestions. Popul. Soc., 3, 1–12.
Chou, J. S., and Tran, D. S., 2018. Forecasting energy consumption time series using machine learning techniques based on usage patterns of residential householders. Energy, 165, 709–726. doi:10.1016/j.energy.2018.09.144
Csereklyei, Z., 2020. Price and income elasticities of residential and industrial electricity demand in the European Union. Energy Policy, 137, 111079. doi:10.1016/j.enpol.2019.111079
Cui, J., Liu, S., Zeng, B., and Xie, N. m. 2013. A novel grey forecasting model and its optimization. Appl. Math. Model., 37(6). 4399–4406. doi:10.1016/j.apm.2012.09.052
He, X., and Reiner, D., 2016. Electricity demand and basic needs: Empirical evidence from China's households. Energy Policy, 90, 212–221. doi:10.1016/j.enpol.2015.12.033
Hessam, G., Reza, K., Birgitte, B., and Radhakrishna Pillai, J. 2019. Optimization of household energy consumption towards day-ahead retail electricity price in home energy management systems. Sustain. Cities Soc., 47:101468. doi:10.1016/j.scs.2019.101468
Hu, Z., and Gong, X., 2020. Impact of household size and age structure of permanent population on electricity consumption of urban residents. Environ. Pollut. Control, 42(10), 1252–1258.
Jia, J. J., and Xu, J. H., 2021. Estimating residential electricity demand’s response to price policy and income dynamics in China. Energy Effic., 14(7), 65–23. doi:10.1007/s12053-021-09974-9
Kim, T. Y., and Cho, S. B., 2019. Predicting residential energy consumption using CNN-LSTM neural networks. Energy, 182, 72–81. doi:10.1016/j.energy.2019.05.230
Li, A. H., and Wang, D. W., 2021. Application of cohort component method in population projection. Statistics Decis., 37(22), 36–40.
Li, K., and Zhang, T., 2021. A novel grey forecasting model and its application in forecasting the energy consumption in Shanghai. Energy Syst., 12(2), 357–372. doi:10.1007/s12667-019-00344-0
Liddle, B., 2014. Impact of population, age-structure, and urbanization on carbon emissions/energy consumption: Evidence from macro-level, cross-country analyses. Popul. Environ., 35(3), 286–304. doi:10.1007/s11111-013-0198-4
Liddle, B., and Lung, S., 2010. Age-structure, urbanization, and climate change in developed countries: Revisiting STIRPAT for disaggregated population and consumption-related environmental impacts. Popul. Environ., 31(5), 317–343. doi:10.1007/s11111-010-0101-5
Lin, B., and Wang, Y., 2020. Analyzing the elasticity and subsidy to reform the residential electricity tariffs in China. Int. Rev. Econ. Finance, 67, 189–206. doi:10.1016/j.iref.2020.01.005
Matar, W., 2018. Households’ response to changes in electricity pricing schemes: Bridging microeconomic and engineering principles. Energy Econ., 75: 300–308. doi:10.1016/j.eneco.2018.08.028
Qiao, X. C., 2021. China’s population development, changes and current situation, reference to data of the seventh population census. Popul. Dev., 27(4), 74–88.
Ryu, J. Y., Kim, D. W., and Kim, M. K., 2021. Household differentiation and residential electricity demand in Korea. Energy Econ., 95, 105090. doi:10.1016/j.eneco.2020.105090
Somu, N., Gauthama, R. M., and Ramamritham, K., 2021. A deep learning framework for building energy consumption forecast. Renew. Sustain. Energy Rev., 137, 110591. doi:10.1016/j.rser.2020.110591
Wang, C., Zhou, K., and Yang, S., 2017. A review of residential tiered electricity pricing in China. Renew. Sustain. Energy Rev., 79: 533–543. doi:10.1016/j.rser.2017.05.097
Wang, J., and Wang, G. Z., 2022. The low fertility willingness research under China’s three-child policy and its policy implications. J. Tsinghua Univ. (Philosophy Soc. Sci., 37(2), 201–212+217.
Wang, L., Zhang, X. H., and Zhang, Y. J., 2022. Designing the pricing mechanism of residents’ self-selection sales electricity based on household size. Int. Rev. Econ. Finance, 83, 860–878. doi:10.1016/j.iref.2022.10.015
Wilson, T., 2016. Evaluation of alternative cohort-component models for local area population forecasts. Popul. Res. Policy Rev., 35(2), 241–261. doi:10.1007/s11113-015-9380-y
Keywords: D13,Q41,Q48 household electricity demand, fertility policy, old-age dependency ratio, cohort component projection method, CFPS data
Citation: Wang L and Zhang X-H (2023) The impact of China’s fertility policies on the future electricity demand of residential households. Front. Energy Res. 10:1081304. doi: 10.3389/fenrg.2022.1081304
Received: 27 October 2022; Accepted: 16 November 2022;
Published: 10 January 2023.
Edited by:
Shi Lefeng, National Center for Applied Mathematics in Chongqing, ChinaCopyright © 2023 Wang and Zhang. This is an open-access article distributed under the terms of the Creative Commons Attribution License (CC BY). The use, distribution or reproduction in other forums is permitted, provided the original author(s) and the copyright owner(s) are credited and that the original publication in this journal is cited, in accordance with accepted academic practice. No use, distribution or reproduction is permitted which does not comply with these terms.
*Correspondence: Xin-Hua Zhang, eHl1NzMwMkAxNjMuY29t