 Zheng Duan
 Yifan Zhang
- 1Research Center for Economy of Upper Reaches of the Yangtse River, Chongqing Technology and Business University, Chongqing, China
- 2Business School, Chongqing College of Electronic Engineering, Chongqing, China
Introduction: The Public-Private Partnership (PPP) model has the advantages of enhancing the efficiency of social infrastructure construction and reducing the risk of government liabilities, and has been widely used and developed in China. In the current securitization of PPP project assets, the question of how to price them is key to whether the Asset-backed Securities (ABS) products can be issued successfully.
Methods: This study analyzes the pricing process and influencing factors of PPP project ABS in the context of PPP projects in China by collating the relevant literature on PPP project ABS products and collating the advantages and disadvantages of the static discounted cash flow (SCF), static spread (SS), and option-adjusted spread (OAS) methods. The study finds that the SCF and SS methods, primarily used in pricing PPP project ABS products, lack consideration of interest rate changes, early repayment rates, and multiple interest rate path options, leading to biased results. This study introduces the Monte Carlo simulation pricing method (MCSM) and conducts an empirical analysis based on the case of the Heating income right ABS of Huaxia Happiness PPP Project ABS.
Results: It is concluded that the Monte Carlo simulation method can more flexibly and accurately price PPP project ABS products with revenue rights as the underlying assets.
Discussion: This study has reference significance for the pricing of ABS products in future PPP projects and the construction of PPP projects in integrated energy service industrial parks, and can promote the development of new integrated energy service industrial parks, thereby helping to improve the energy consumption structure of enterprises in industrial parks, improve energy use efficiency, ensure the safety of energy use by enterprises, and further enhance the application of new energy by enterprises, thereby reducing their Greenhouse gas emissions.
1 Introduction
The PPP model has been in development for more than a hundred years, and Lance Liebman. (1984) was the first to discuss how the role of government, as well as business, should be played in the PPP model and how governments and businesses should allocate their obligations and responsibilities, and made recommendations on these in his study of social capital in PPP projects. Doh and Ramamurti. (2003) found that governments often ignore the risk tolerance of social enterprises when cooperating, which may lead to social enterprises taking on more risks than they can bear. This can lead social enterprises to take on more risks than they can bear, including systemic risks such as interest rate and exchange rate risks, which is why many early PPP projects failed. Hoppe et al. (2013) shows that government-led PPP projects and inter-enterprise cooperation have better control over costs and are thus more efficient, making PPP projects more attractive than other forms of financing, attracting investment attention from society. Albalate et al. (2015) points out in her study that if the benefits in a PPP project are higher than the costs, the increase in profits will bring a great increase in motivation, and the relative cost of labor is also an essential factor. For the government, introducing social capital can significantly reduce the costs incurred, increase the efficiency of infrastructure development, and improve the delivery of public service functions, thereby requiring more ways to increase motivation. Spackman. (2002) argues that collaboration between the two parties can lead to higher benefits for both parties and that each can bring expertise to better support the project. The expertise of each party supported this project.
Asset-backed Securities (ABS) products first appeared in the United States in 1968 when the US Federal National Mortgage Association introduced the world’s first ABS product. Since then, ABS has become widespread, and Gardener and Revell. (1988) defines it broadly as a means or process by which the borrower and the lender of funds can be matched in whole or in part in the capital markets. Frost. (1997) raises the issue of risk segregation and argues that ABS enables securitized and other risky assets to be segregated, thus avoiding some losses due to insolvency. This is done by utilizing a true sale of the underlying assets to a special institution in the ABS process, isolating the original beneficiary’s other assets. Thus, even if the original underlying asset holder goes bankrupt, the underlying assets that have been sold are not covered by bankruptcy liquidation, so the investors in the ABS are not implicated by the bankruptcy of the original asset owner, thus avoiding the risk.
In their research on pricing methods, Dunn and McConnell. (1981) were the first to propose an option-adjusted spread method for mortgage securities, using historical data on the underlying assets to forecast cash flows and determine the likelihood of early repayment based on changes in interest rates. The option-adjusted spread method was also studied by Kalotay et al. (2004), which collates and modifies the option-adjusted spread method to extend its pricing scope and make the option-adjusted spread method more in line with the reality of capital markets. To address the issue of the drawdown rate, which has been mentioned in previous studies, McConnell and Singh. (1993) proposed an early paydown model based on reasonable assumptions, which indicates that issuers generally tend to liquidate early when the present index of the outstanding principal on the future interest rate path is greater than the refinancing cost and outstanding principal.
McConnell and Singh. (1994) used a Monte Carlo simulation pricing method to study the pricing of PPP ABS. The Schwartzblum model calculated the movement of claims and fixed interest rate. This study shows that even small changes in the early repayment rate can significantly impact on prices.
In the study of pricing influences, Ambrose and LaCour-Little. (2001) found an insignificant relationship between early repayment rates and loan maturity, but if there is a rise in discounting, the probability of early repayment increases. Dunsky and Ho. (2007) concluded that the basic method of determining price through ABS is to analyze the expected future cash flows of the project. The analysis of the evolution of the interest rate as a discount rate leads to the conclusion that the basic method of determining price through ABS is to analyze the expected cash flows to derive the net present value of the project. According to Fermanian. (2013), that the model is built by two lines, upper and lower, as per the characteristics of the price classification of securitized products.
At this stage, the theoretical basis of PPP project ABS and related industry practices (including market, issuance, trading, and regulatory aspects) are being explored in China, especially concerning pricing mechanisms and methods; however, pricing is a key step in the overall PPP projects ABS process. Pricing is the basis for the successful distribution and circulation of the product, allocation of profits between the issuer and investors, and link between assets and the market. Therefore, studying the pricing of PPP securitization products is of great practical importance.
As one of the first PPP projects ABS product in China and the first model project approved by the Ministry of Finance of China, the Huaxia Happiness Gu’an Industrial Park PPP heating tariff rights ABS products will be a good reference for future ABS projects of this kind. It will be a good reference and guide for the pricing of such PPP projects in the future, as well as for the pricing of PPP projects ABS product in other sectors.
2 ABS and pricing theory underlying PPP projects
2.1 PPP projects ABS process
The operational process of PPP project ABS is very complex. It needs to be coordinated with each other according to a strict process, which can be divided into the links in Figure 1: conducting due diligence, asset pool design, SPV construction, transfer of underlying assets, credit enhancement method selection, credit rating, asset-backed securities issuance, and follow-up management services and securities repayment.
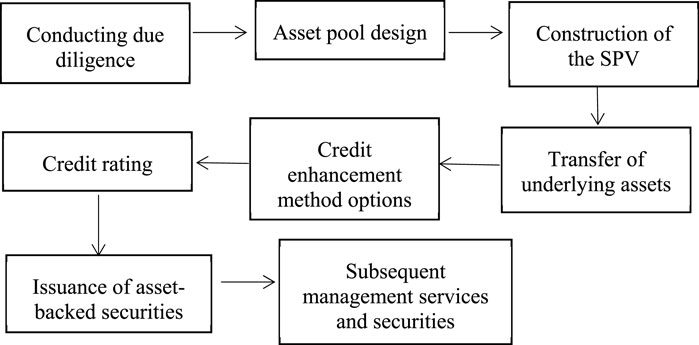
FIGURE 1. ABS process for PPP projects.
2.2 Traditional pricing methods for PPP project ABS products
2.2.1 Static discounted cash flow method
Ordinary static cash flow is a method of discounting future cash flows generated by an asset at a fixed discount rate using a simple model without considering the effects of changes in interest rates and fluctuations in the early repayment rate.In asset securitization pricing studies, for the issue of cash flows, Dunsky and Ho. (2007) proposed to analyze the expected future cash flows that can be generated by the project and determine the discount rate at which the cash flows are discounted in order to obtain the net present value of the underlying project.
The static discounted cash flow method (SCF) method has the simplest expression, and the basic formula for this model is
In this model, the price of the securitized product is denoted by P, the number of periods of the product is denoted by n, CF is the expected cash flow in period i, and r is the discount rate.
The biggest advantage of the static discounted cash flow method is that it is simple to use and easy to calculate to obtain the desired result quickly. However, this method also has the disadvantage that it does not consider any changes in interest rates in the best-case scenario, so the results obtained by this method may deviate significantly from the actual situation. In the actual pricing of PPP projects ABS product, changes in interest rates and early repayment rates are often considered. Thus, the pricing of PPP asset products obtained from this model can only be used as a basic reference and cannot be applied to the actual pricing of PPP projects ABS product.
2.2.2 Static spread method
The biggest optimization between the static spread (SS) method and the original static discounted cash flow method is that it considers the yield to maturity of treasury bonds. This method sets the discount rate as the yield of each maturity on the yield-to-maturity curve of Treasury bonds, plus a set fixed spread. The price of the bond is determined using this method as a measure of the entire yield-to-maturity curve.
The most concise formula for the Static Spread Method (SS) is:
In this model, the product price is denoted by P, CF is the expected cash flow in period i, r is the yield of treasury bonds with different maturities, and S is the static spread.
The static and static cash flow methods do not differ significantly when cash flows are concentrated but can differ significantly when cash flows are more dispersed.
The static spread method considers the changes in yields to maturity of different treasury bonds and adds changes in interest rates to the application of the model, yielding more accurate results than the cash flow model. However, the spread model does not consider fluctuations in early repayment rates caused by different interest rate paths, which are not well addressed by the spread model because of the uncertainty of future cash flows in PPP projects ABS product and the refinancing interest rates may change, which will affect the pricing of the overall PPP projects ABS product. However, the static spread method does not consider these factors in the model and therefore does not accurately measure the price of the PPP projects ABS product.
2.2.3 Option-adjusted spread method
The option-adjusted spread (OAS) method is better than the static spread method, which considers early repayment of future cash flows from the underlying asset. This method combines the static cash flow method and static spread method and integrates interest rate risk by considering as many interest rate paths as possible, with the main paths utilized being the binomial tree pricing model interest rate path, Monte Carlo model interest rate path, and finite difference interest rate path.
Dunn and McConnell. (1981) predicted the likelihood of early repayment based on the movement of interest rates and proposed an option-adjusted spread method applied to mortgage-backed securities. Subsequently, they proposed an early repayment model based on the assumption of rationality in 2001. Researchers such as Kalotay et al. (2004), adapted and modified the method to broaden its pricing scope.
The option attribute in the OAS method applied in the pricing of PPP projects ABS product, in the concept of an option, for the purchaser of a call option, the purchaser has the right to buy a certain underlying amount at a price specified by the seller during the agreed period. For the buyer of a call option, the gain is derived from the increase in the price of the option due to an increase in the price of the underlying option and the gain from the exercise of the option. Still, if there is a fall in the price, the buyer’s loss will only be the cost of buying the call option. By analogy with a debtor who raises money in capital markets, the risk of early repayment is treated as a call option.
The basic form of the option-adjusted spread (OAS) method model is
In this model, P refers to the price of the securitized product, R is the interest rate for period S under the Tth path, T is the total number of bars in the simulated interest rate, and CF is the cash flow for period i under the Sth path.
The key to this method is how to use the binomial tree model to determine the path of the interest rate, set to build a binomial tree where the value of the change is
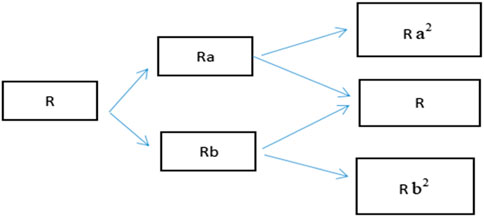
FIGURE 2. Interest rate binomial tree structure.
In its application, the OAS method can simulate early repayment and default behavior under different interest rate change paths and can obtain more reasonable forecasts of future cash flows in the pricing of PPP securitization products. The OAS model considers changes in early repayment rates and interest rates and is closer to reality than the static cash flow and static spread methods. The scenarios considered using this model are more complex, and thus, the requirements for the overall model are high, requiring the design of an option-adjusted spread model suitable for the operation of the product in the pricing of the product.
2.3 Monte Carlo simulation method
2.3.1 Reasons for introducing the Monte Carlo simulation method
The Monte Carlo model is currently widely used in finance as a representation of high value, and high flexibility in the field of finance, and the method was first applied to the pricing of financial securitization products by Paulier in 1977.McConnel and Singh. (1994) used a Monte Carlo simulation pricing method for fixed-rate and variable-rate mortgage bonds. In an exploration of PPP project financing, Yuan et al. (2011) constructed a Monte Carlo-based model for optimising the financing structure and analysed the main influencing factors and their mechanism of action.
Compared with other models, it is clear that the Monte Carlo model is more comprehensive in its consideration of factors, especially the choice of interest rates under multiple paths, and is more in line with changes in financial markets, making it highly applicable. The Monte Carlo model ensures independence of the predicted standard errors, and the results are more realistic.
In its current application, the Monte Carlo model relies heavily on computers to simulate several possible paths to obtain the value of the asset under the current path, and the risk-free rate can be applied to discount the current value of the entire asset.
2.3.2 The basic form of a Monte Carlo model
In the pricing of ABS products, it is the value at the moment T = 0 that is required, that is, the unconditional expectation of the discounted payment. The probability distributions of the parameter estimates calculated by Monte Carlo model simulations are complex; therefore, the workload of calculating the simulation parameter estimates using probability distribution methods is high, and in practice, the first-order moments of the discounted payments are generally used.
Paulier systematically described the methodology regarding the use of Monte Carlo models in the pricing of financial securitization products. The basic formula for the model is:
Where
2.3.3 Steps of the Monte Carlo simulation method
In the pricing of ABS products, it can be assumed that the ABS product’s underlying asset is C, the risk-free interest rate is assumed to be a constant N, and this product pays out at the end of the period. We analyze the application of the Monte Carlo model to the pricing of PPP ABS products and calculate the present value of the product by following these steps.
1. Simulation of the stochastic process obeyed by all underlying assets of the PPP ABS product.
2. Calculate the price path of underlying asset C using a simple random sampling method.
3. The product value is calculated.
4. Steps 2 and 3 of the sampling cycle are repeated to obtain many samples.
5. Discount PPP ABS products through the risk-free rate.
6. The discounted sample mean is calculated, and following the law of large numbers, this sample mean is used as the point estimate of the limits of the securitized asset.
7. Confidence intervals at a given level of significance are obtained according to the central limit law to obtain interval estimates of the securitized asset’s current index.
However, the Monte Carlo model also has great limitations, the main one of which is that the experimental difficulty is relatively large because Monte Carlo needs to perform a large number of simulation experiments; if it encounters complex securitization products, it will certainly increase the experimental difficulty substantially, and the processing of obtaining more data is also more troublesome. Therefore, in response to this problem, scholars at home and abroad have made some improvements, most of which lie in the basic variance in the experiment, which commonly includes importance sampling, pairwise variables, and control variables.
2.4 Analysis of pricing model strengths and weaknesses
Regarding the four models for pricing PPP project ABS product, Table 1 provides a unified comparison of the advantages and disadvantages of these models.
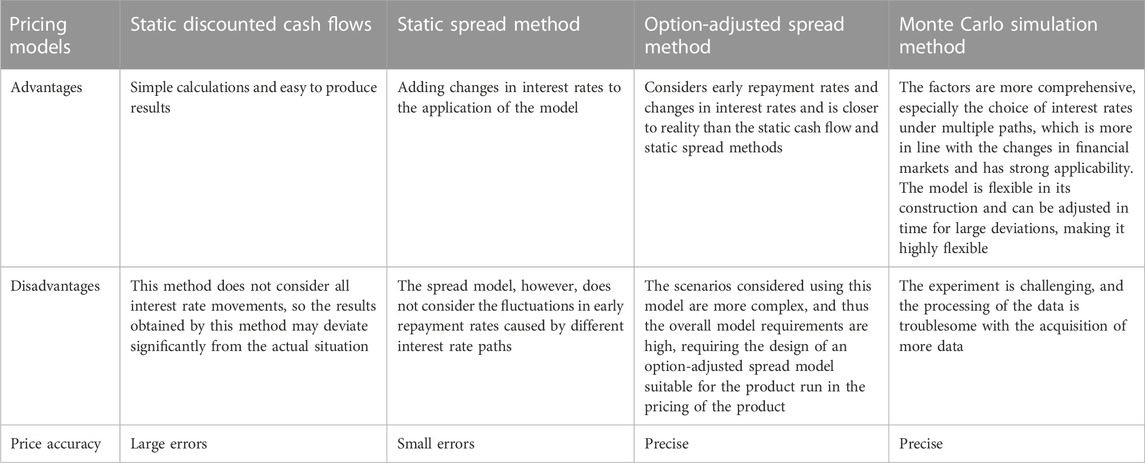
TABLE 1. Comparison of different pricing methods.
In terms of the strengths and weaknesses of the above table and the accuracy of the results, it can be seen that the static cash flow method and the static spread method do not accurately determine the price of the PPP project ABS product, as these two models are not complete in their consideration of factors, particularly interest rate movements, and early repayment rates. For the option-adjusted spread method and Monte Carlo simulation method, both methods can accurately obtain the actual price of the product, but the two methods use different simulation paths and may yield different results.
3 Huaxia Happiness Heating Revenue Right PPP ABS project
3.1 Project overview
3.1.1 Basic information of the PPP ABS project of Huaxia Happiness Heating Revenue Right
As the first PPP ABS project in China, this project has good reference value for developing PPP projects in China and the ABS of PPP projects. Table 2 shows the basic information about this particular scheme.
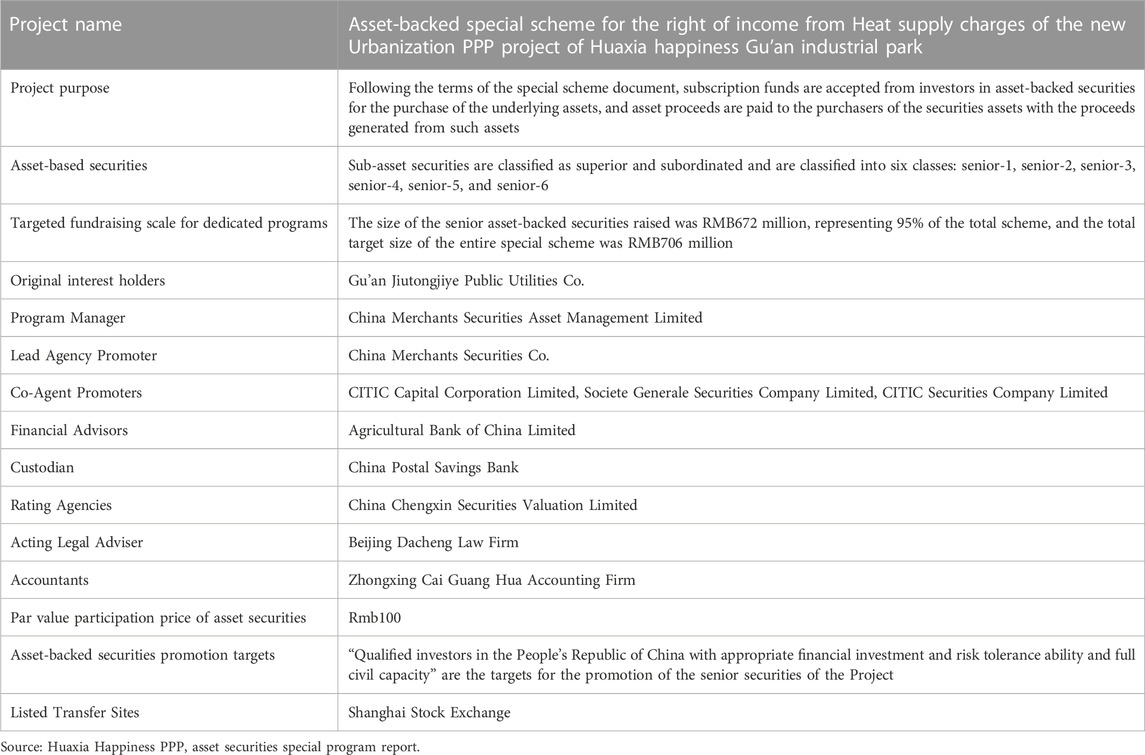
TABLE 2. Basic project information.
3.1.2 Issuance of Huaxia’s special schemes
Figure 3 shows the transaction structure of the special scheme.In the whole plan issue, the whole plan is proposed by China Merchants Capital Management as the initiator of the whole plan, the project is set up, Huaxia Happiness Party as the guarantor is providing external credit enhancement, and Jutong Public Utilities as the original equity owner and the service provider of the assets, which entrusts China Postal Savings Bank as the supervising bank to manage the funds for it, and Postal Savings Bank as the custodian, and China Merchants Securities Company.
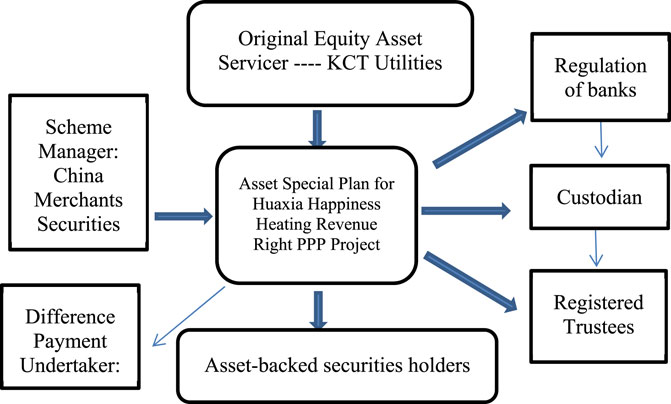
FIGURE 3. Diagram of the transaction structure.
As the first PPP ABS project issued in China, the overall transaction structure and issuance method of the asset securities of the Huaxia Happiness Gu’an PPP project, from the initial construction to the start of the issuance and finally identified as the first exemplary PPP ABS project in China, has high reference value for subsequent PPP ABS projects.
3.1.3 Asset-backed securities maturity and expected annual yield
The total target size of the Huaxia Happiness PPP ABS Special Programme is RMB 706 million. Table 3 provides basic information on this securities issue.The target size of senior asset-backed securities is RMB 672 million, representing 95% of the total size. The target size of Tier 1 asset-backed securities was RMB58 million, representing 8% of the total size; the target size of Tier 2 asset-backed securities was RMB 80 million, representing 11% of the total size; the target size of Tier 3 asset-backed securities was RMB 102 million, representing 14% of the total size; the target size of Tier 3 asset-backed securities was RMB 128 million, representing 18% of the total size; the Tier 5 asset-backed securities project size was RMB 143 million, accounting for 20% of the total size; and the target size of the Level 6 asset-backed securities project was RMB 159 million, accounting for 23% of the total size. The size of subordinated asset-backed securities raised was RMB 36 million, accounting for 5% of the total size.
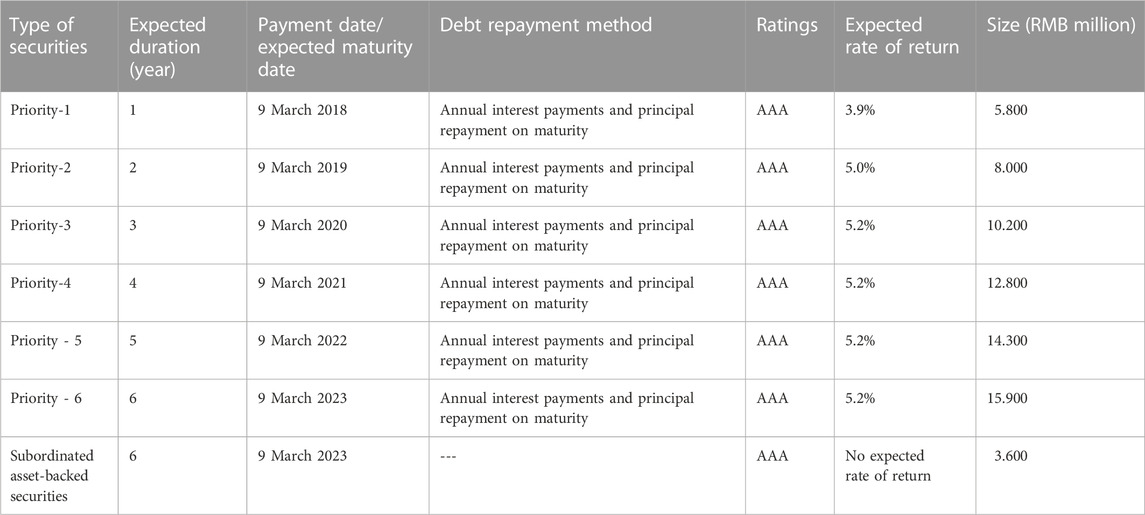
TABLE 3. Asset-backed securities issuance information.
3.2 Analysis of underlying asset profile and cash flow projections
3.2.1 Information on the underlying assets
Throughout the special plan, the underlying assets are the rights of the original equity holders to collect heating charges from heating customers for a specific period as a result of the provision of heating services in the Gouan Industrial Park, which are allocated to the special plan by the original equity holders on the delivery date and are still recorded in the underlying asset documents.
In the Huaxia PPP project, according to the standard terms and conditions entered into, the underlying assets are the heat supply service provided by the original equity holders to the industrial park on the delivery date following the relevant documents and the heat supply fee income charged to the special plan, set for the period from 2017 to March 2023.
The PPP project heating tariff rights refer to the heating tariff revenue enjoyed by Jutong utilities for the provision of heating services under the PPP project.
After the project is put into operation, a fee agreement is signed with the residents in September-November each year, with cash or credit cards as the method of payment, and with the companies in September-December to collect the heating fee by transfer. According to the agreements signed and the negotiations with the authorities, the price per square meter of heat was 22 RMB for residents and 38 RMB per square meter for non-residents, looking for statistics Table 4 shows the from 2013 to 2016 before the project was signed.
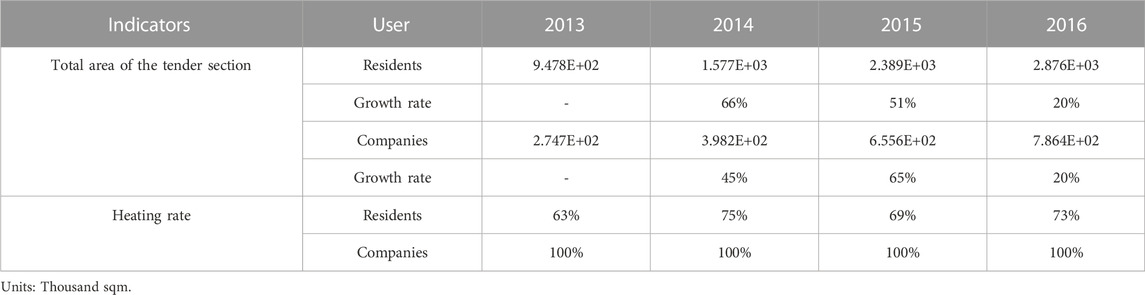
TABLE 4. Overview of heating in JWT utilities 2013–2016.
3.2.2 Cash flow projections for the underlying assets
Based on statistical information, as well as the project’s publicly available accounting reports, the forecast assumptions are divided into two segments for residents and businesses and are assumed separately when making the forecast.
The main factors underlying projections regarding future cash flows for residents are the total area of residential heating bids, heating rates, and tariffs. The main assumptions regarding cash flow projections are as follows.
1. No legal risks are associated with the right to receive proceeds and the entire valuation base date.
2. The plan for the entire campus will be to add 14,359,667 square meters of heating bids in 2017, 5,677,775 square meters in 2018, and 1,363,130 square meters in 2019, and is expected to remain the same overall for 2020-2022.
3. The heating rate will be used as a baseline for the entirety of the previous 2013-2016 period and is expected to increase by 3% per year in 2017–2019 at the time of the assumptions and remain consistent with assumption two in 2020–2022, assuming no overall change.
4. The payback rate will be set to the ideal state of 100% for the entire set period of 2017–2022.
5. Lastly, it does not consider national policy changes, industrial policies, and other unavoidable factors.
The final overall resident projection assumption assumes that 80% of the completed homes are occupied and under contract in the current year, with the remaining 20% expected to contract the next year. The total forecast resulted in a combined cash flow of RMB551,443,500 from 2017 to 2022.
For enterprise heating, the main elements considered are the total area of the tender section and the tariff, where the main factors that will have an impact on the tariff are local GDP, local fiscal revenue, the number of enterprises in the park, and the amount of fixed asset investment completed in the park. The following assumptions are made for enterprise cash flow.
1. No legal risks are associated with the right to receive proceeds and the entire valuation base date.
2. The heating rates were assumed to be 100% and remained the same from 2017 to 2022.
3. Its payback ratio is set at 100% to remain unchanged for future years.
4. The remittance rate is set at 100% from 2017-2022.
5. Compound growth assumption of 27% for the heating tender area.
6. Free from any other force majeure factors.
Using the above assumptions on the total surface of the impact factors of the heating section of the enterprise, the weights are assigned to 20% of the regional GDP, 15% of the amount of fixed asset investment, 35% of the fiscal revenue, and 30% of the number of enterprises in the park. The data are adjusted and collated for events that are highly likely to have an impact. Table5 shows the income forecasts for residents and companies.
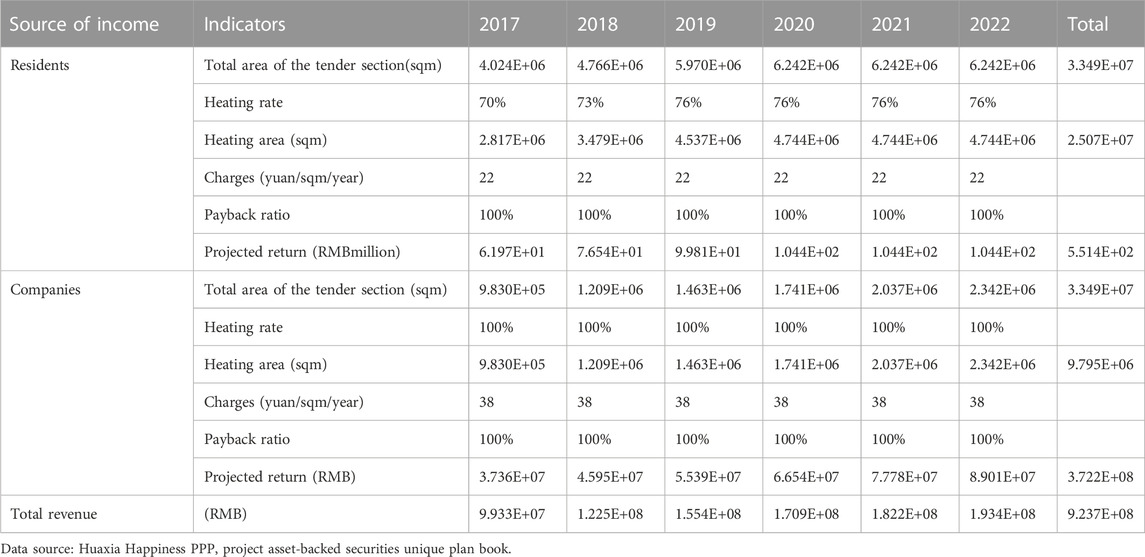
TABLE 5. Resident and companies income.
It is possible to see the totals for 2017–2022 for the overall income of residents and businesses for 2017–2019, which can then be used as a reference for pricing products when pricing assets.
3.2.3 Cash flow forecasting and stress testing of underlying assets
Based on the overall project analysis, the cash flow projections for the PPP projects under normal circumstances are made into a chart from 2017-2022, as shown in Table 6 below.
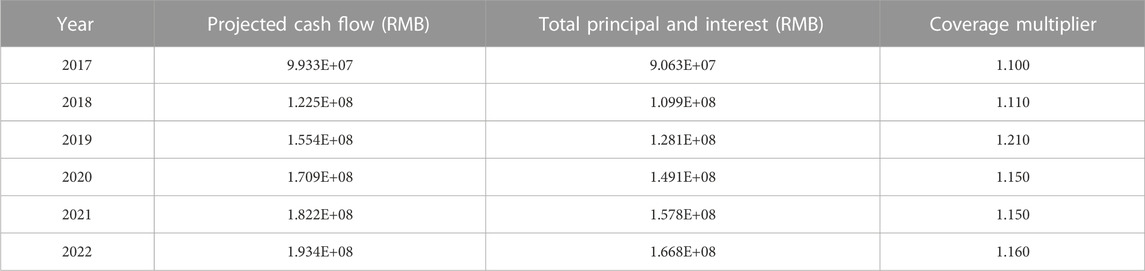
TABLE 6. Cash flows under normal conditions.
Conduct a first test cash flow analysis of a simulated scenario stress situation.
In this scenario, cash flow is projected to be under pressure if there is an increase in yield, and the cash flow is projected to continue from year four to year 6, with the expected yield increasing by 10 BP based on each additional year of the measured yield according to the issue term, on which the measured yield increases by 50 BP per tranche, as shown in Table 7 below.
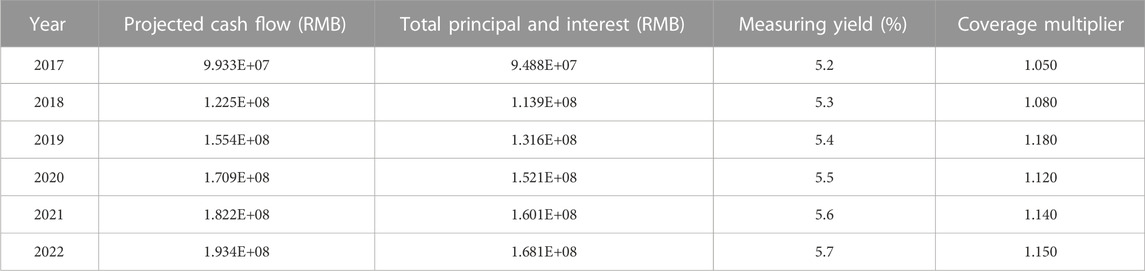
TABLE 7. Cash flow under stress scenario 1.
As seen from the Table 7 above, in this scenario, all the underlying assets generate cash flows to cover each tranche of senior asset-backed securities a multiple of one time or more to pass the stress test.
Conducting a simulated scenario stress situation in the second test cash flow analysis.
Changes in heating cash flow income may be affected by changes in the total heating tender area, heating charges, heating tariffs, and payback rates.
For the changes in the total residential heating bid area, the residential heating area for 2017-2022 will be increased according to the average of the annual increase in heating area from 2013-2016, and the bid area will not be increased after 2020.
For businesses, another criterion is used to increase their heating area from 2017-2022 to in increments of 1.1 times the average annual increase in heating area from 2013-2016.
Another important influence is in the adjustment of the heating rate, through the statistics for past historical data, as the heating rate increased in the first 5 years and has remained stable since then, Table 8 shows the cash flow measurement.
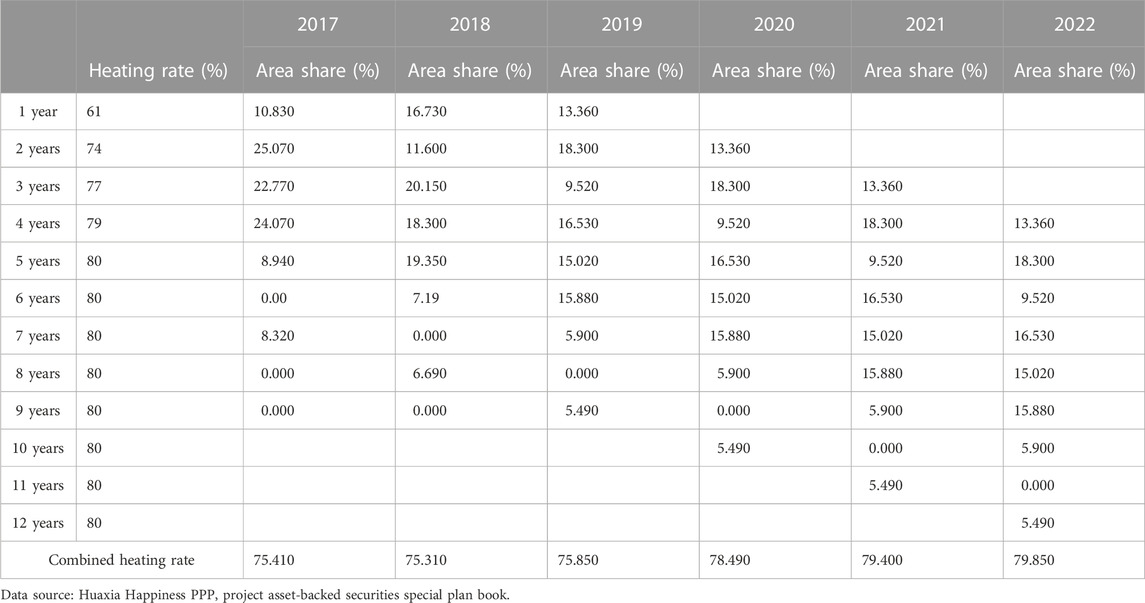
TABLE 8. Combined heating rate scenarios 2017–2022.
The heating fee collection rate refers to historical data, both residential and non-residential heat are 100%, combined with the heating rate change scenario, it is reasonable to assume that the heating fee collection rate is 97%, assuming that the special plan continues to survive from the fourth to the sixth year, the expected yield is increased by 10BP for each additional year of the issue term, and a new cash flow forecast Table 9 is made for comparison.
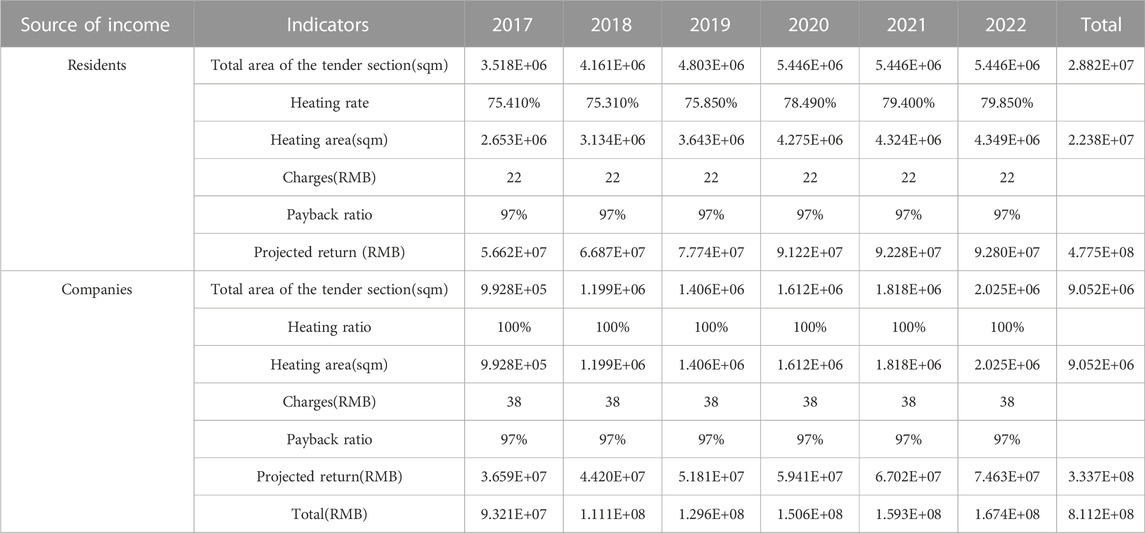
TABLE 9. Scenario 2 with 2017–2022 Ninth Avenue utilities heating revenue.
The calculations based on the above table and various assumptions made in the current stress environment result in the following Table 10 of cash flows.
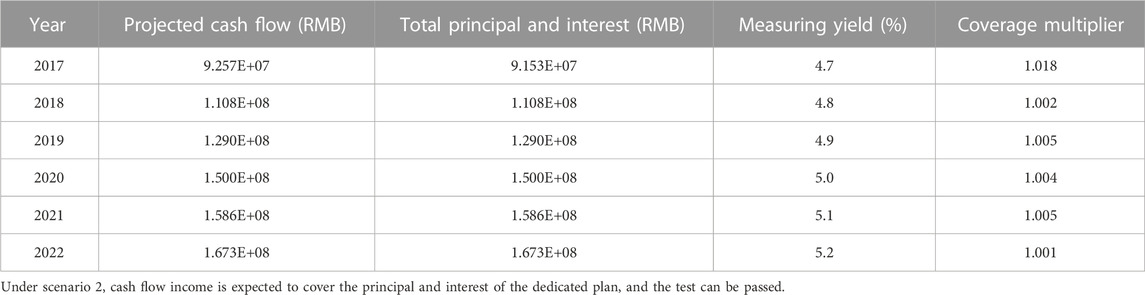
TABLE 10. Cash flows under scenario two.
3.3 Empirical analysis data
In project pricing, the issuer of the project uses cash flow forecasting and stress testing to demonstrate the viability of the project’s returns and prices the product using a static discounted cash flow method, to which the option-adjusted spread method and Monte Carlo simulation method will be added in this study. Based on the data from Table 3 to Table 10, the underlying cash flow forecasts used are extracted, Table 11 shows the main relevant data used in the subsequent pricing methodology.
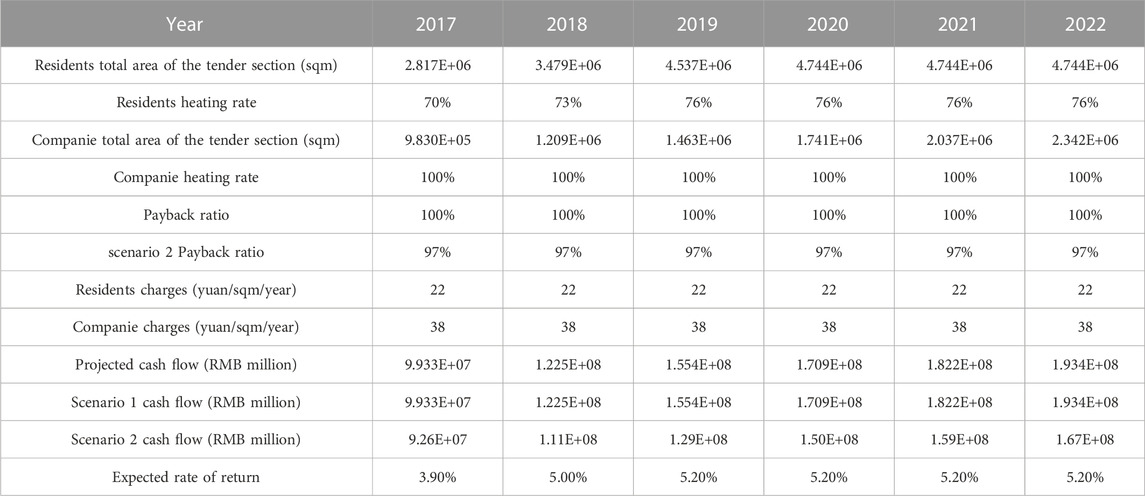
TABLE 11. The main data used in the empirical evidence.
4 Empirical analysis of ABS product pricing for Huaxia Happiness PPP projects
4.1 Option-adjusted spread method pricing
4.1.1 Construction of a binary tree interest rate path
The Huaxia Happiness Heating Revenue PPP Asset Securitisation Project, based on the cash flow forecast from 2017 to 2022, the project issue is expected to arrive at the interest rate in 2018–2023. This project issue has a senior-1 interest rate of 3.9%, a senior-2 rate of 5.0%, and the senior 3–6 rate of 5.2%; from this information, we can see that senior-1 and senior-2 are the first 2 years of interest payment rate; the project does not open for an interest rate adjustment, repurchase, and sale back until the end of the third year, so with a target interest rate of 5.2% for the project, the overall term of the project is 6 years.
The 6-year Treasury yield in the bond market is the underlying factor for the risk-free rate in the model, with an average rate r of approximately 3.1%, as shown in Figure 4 below.

FIGURE 4. Treasury bond interest rate yields Source: China Bond Network.
The volatility of interest rates was used in the research of Lin Hai and Zheng Zhenlong, which set the volatility of interest rates at 0.4%, that is,
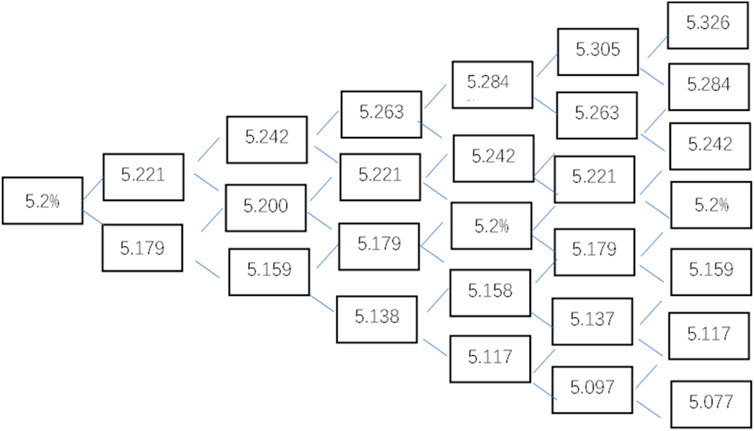
FIGURE 5. Binomial tree of interest rates Unit %.
4.1.2 Binomial tree solver product prices
From this, it can be seen that, under multiple interest rate paths, the interest rate on each path is obtained by adding the interest rate changes and plotted in Figure 6. There are 64 interest rate paths in total. The asset-backed security price volatility is set to 10.5% of the corporate bond volatility index using the DerivaGem software designed explicitly for option pricing,and plotted in Figure 6.
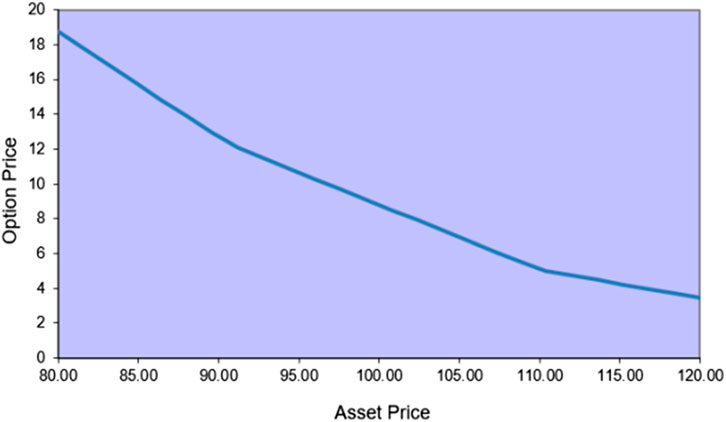
FIGURE 6. Asset price and option price curves. From: DerivaGem.
The value of the option at the zero moment is calculated, and the cash flows are discounted separately for each period to obtain the theoretical price on each path, call option price, and put option price. And the binomial tree of option prices is drawn based on the interest rate binomial tree as shown in Figure 7.
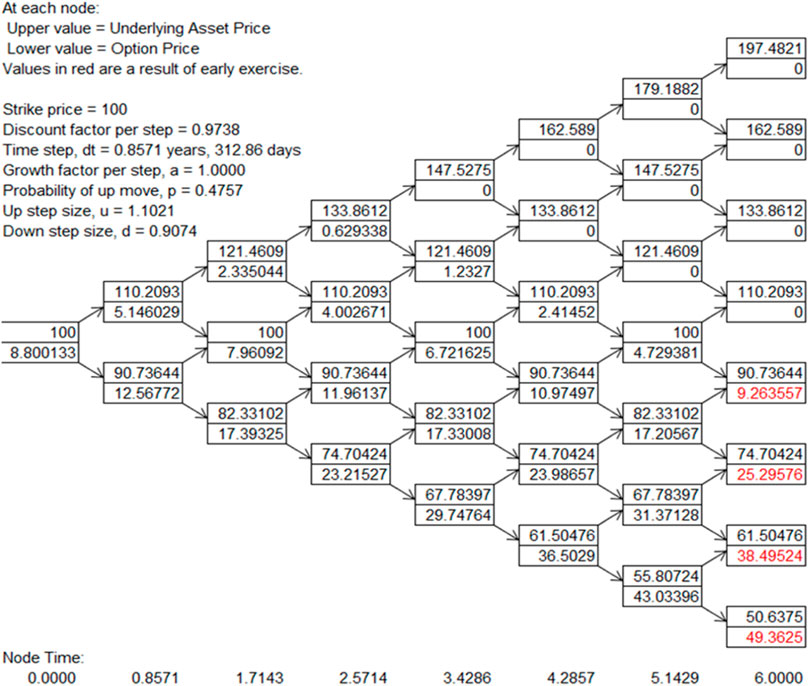
FIGURE 7. Interest rate binomial tree solving option prices. Data source: DerivaGem.
From the binomial tree model of option prices, the price under 64 paths can be obtained, with the second cell on the graph representing the price of the lookalike option. The posting limit for the option was found to be RMB 105.63 using arithmetic averaging. The previous pricing theory on ABS, which is equivalent to a call option for project redeemers, so the final price of the ABS product = the discounted value of the expected future cash flows - the option value of the early repayment by the originator. Therefore, the final price of the ABS product is 105.63–8.8 = 96.83.
Compared to the issue price of RMB 100 for the Huaxia Happiness PPP ABS project, the price of RMB 96.83 obtained using the option-adjusted spread method is less than that of RMB 100.
4.2 Monte Carlo simulation method
4.2.1 Parameterization of price influencing factors
In the Monte Carlo simulation method, the underlying idea is to build a probabilistic model or stochastic process first, such that its parameters are equal to the solution of the problem. The statistical characteristics of the stochastic parameters were then computed by observation and random sampling of the model or process, and an approximation of the solution was obtained. The newly developed software Oracle-Crystal Ball was used to obtain a better experiment structure.
Based on the data in the previous section on cash flow projections and factors affecting the pricing of ABS products for PPP projects, changes in the total area of heating bids, heating fees, heating tariffs, and payback ratios may affect changes in heating cash flow revenue, according to the plan for the whole park will be 1,435,967 square meters of new heating bids in 2017, 5,67,775 square meters in 2018 square meters in 2017, 5,67,775 square meters in 2018, and 136,310 square meters in 2019, and is expected to remain the same overall for 2020–2022. The heating rates will be used as a baseline for the entirety of the previous 2013-2016 period and are expected to increase by 3% per annum in 2017–2019 at the time of the assumptions and remain consistent with assumption 2 in 2020–2022, assuming no change overall. The rate of return will be set to the ideal state, that is, 100% for the entire set period of 2017–2022, and no consideration will be given to national policy changes, industry policies, and other unavoidable factors. This led to the construction and derivation of the model. The hypothetical parameter estimation was performed as shown in Table 12.
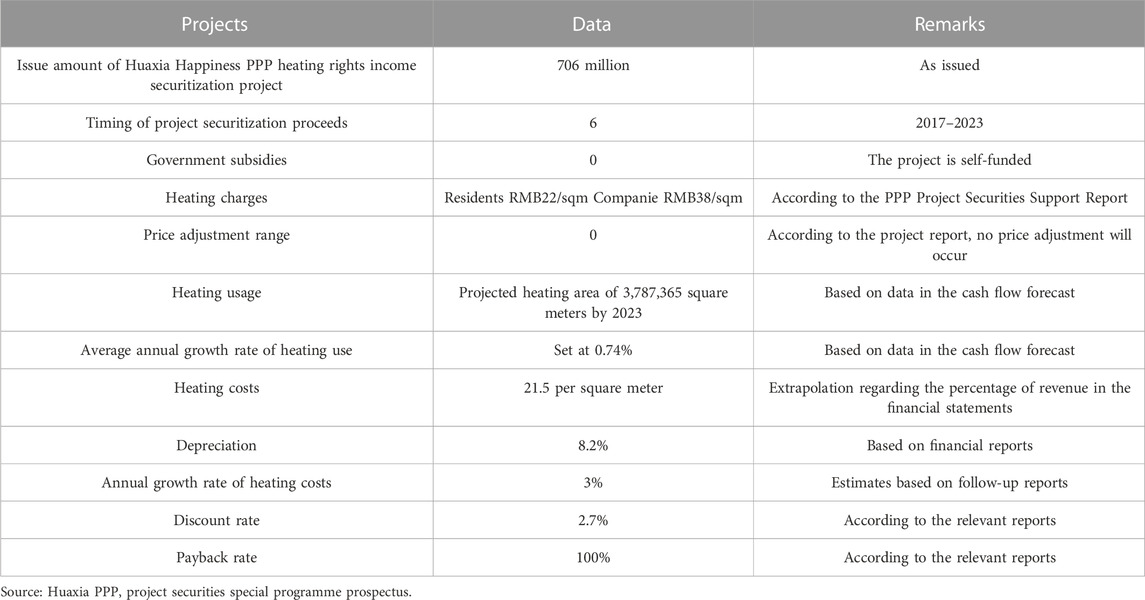
TABLE 12. Basic information on each parameter.
4.2.2 Mathematical model construction
Based on the actual situation of the Huaxia PPP Project heating project, a mathematical model was constructed to determine the required hypothetical parameters and the variables affecting the final expected rate of return. The specific equations are as follows:
Operating income in a year, N = monthly heating income per square meter × heating area × number of heating months per year × payback rate × heating rate.
Heating revenue per square meter in year N: business and residential weights set at 25% and 75%
Overall heating area per year.
Year N cost = depreciation + heating cost, year N heating cost per square foot.
Depreciation expense in year N.
Total profit in year N.
Discounted net profit in year N.
As can be seen from the above equation, for annual discounting, the overall price of the project is influenced by the average annual growth rate of heating using
4.2.3 Model pricing process and results
Simulations were conducted using Crystal Ball software, and the entire model was set to run 1,000 times, with the rate of return for the time interval of the PPP securitization project obtained in each simulation. Table 13 shows the set variables, the quantities that may change in each simulation are the average annual growth rate of heating use
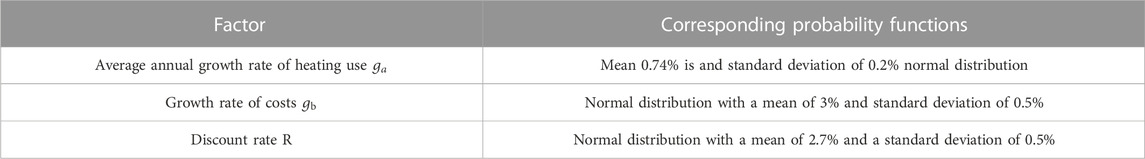
TABLE 13. Corresponding probability functions for the factors.
The model was imported into the software, and each parameter was assigned a value corresponding to the rate of return, and the process was repeated 1,000 times. The assumptions regarding the probability variables are as follows: Monte Carlo simulations are performed using the software, and the entire process is run 1,000 times and plotted using EXCELL. The results are shown in Figure 8
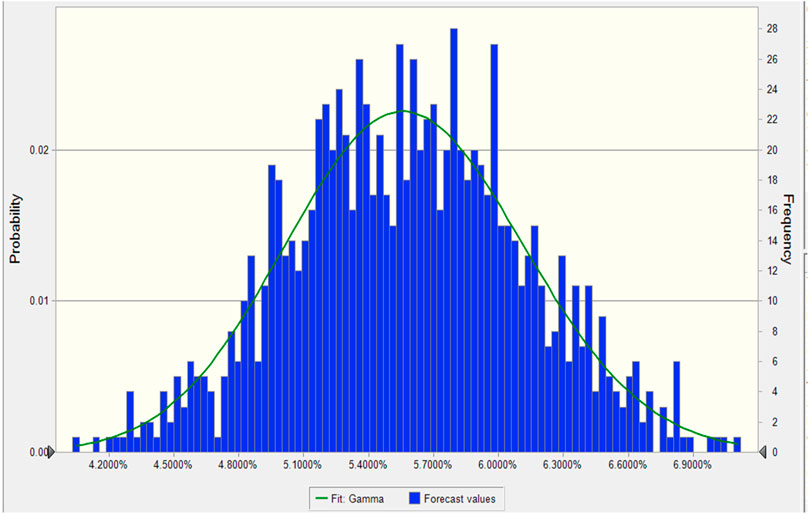
FIGURE 8. Yield Monte Carlo simulation results.
The results of the Crystal Ball data are as shown in Figure 9.
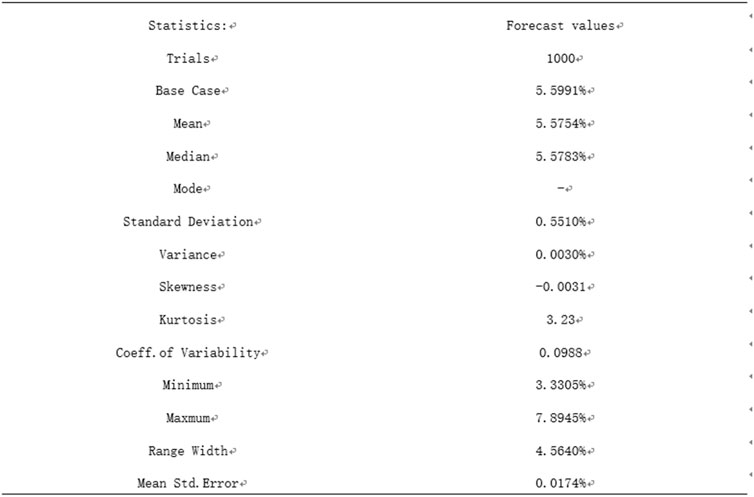
FIGURE 9. Monte Carlo simulation data results.
From the arithmetic results report, the fundamental values were collated, found, and collated as shown in Table 14.
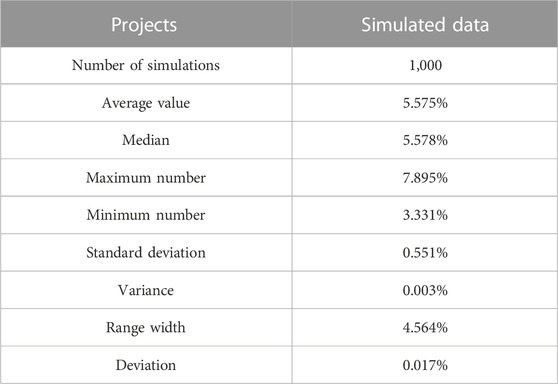
TABLE 14. Monte Carlo simulation data.
As can be seen from the Figure 10 above, the mean value of the return is 5.5754%, and its deviation of 0.0174% is greater than zero, indicating that this result has a heavy tail on the right-hand side and the distribution is right-skewed. The right-hand side is more concentrated, and the result is feasible based on the numerical results, as well as the cumulative probability distribution of the model.
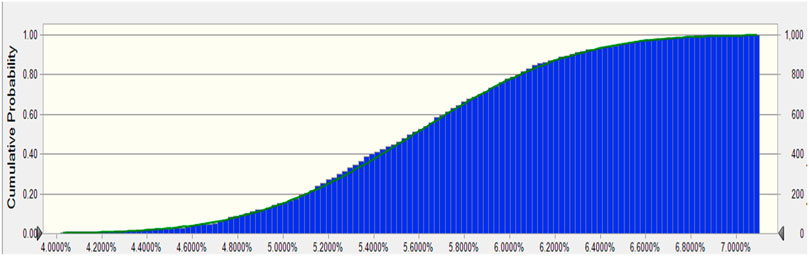
FIGURE 10. Cumulative probability diagram.
4.3 Analysis of results
4.3.1 Analysis of empirical results
Combining the information in Table 14, with Figures 8, 9, 10 the analysis of the statistical results following the Monte Carlo simulation leads to the following conclusions.
1. Combining Table 14 with Figures 8, 9, it can be seen that the maximum value of the heating tariff yield for this PPP project is 7.89%, the minimum value is 3.33%, and the mean expectation of the yield is approximately 5.5754%, which provides a selected range of yields for the entire PPP ABS project. Compared to the actual rate of 5.2% achieved in the actual issue, the mean yield of 5.5754% obtained from this simulation was greater than the actual issue result.
2. The probability of the interval for this simulation experiment is shown in Figures 8, , where the probability of a return between 3.9% and 7.1% reaches 100%, indicating that the return values are selected within it. A further careful division in which the probability between 4.8% and 6.0% is 70% and the probability of 5.1%–5.7% in the figure is 51% over 50%, which after analysis, gives an accurate idea of the probability of each return.
3. Based on the results of the above analysis, it can be concluded that the results of this simulation can effectively match the yield of the ABS product of the Huaxia happiness PPP project. The actual issue had three yields from senior-1 to senior-6 of 3.9%, 5.0%, and 5.2%, respectively. All the yields are within the determined range, so the Monte Carlo simulation method has implications for the pricing of PPP ABS products. From the results of this experiment, an expected mean value of 5.5754% can be used as the basis for pricing the issued products, and the selected yield range is between 3.9% and 7.1%.
4. The comparison between the results of this experiment and those obtained by the option-adjusted spread method and the actual issue of the product is the same, indicating that the experimental results of the two pricing methods are isotropically verifiable.
4.3.2 Analysis of the reasons for deviations between empirical results and actual prices
The pricing results obtained through the option-adjusted spread method and the Monte Carlo simulation method are both lower than the actual issue price; that is, the yield of the empirical results is higher than that of the actual issue product. For this reason, the reasons for this situation are analyzed in the context of the basic situation of the Huaxia Happiness PPP project as follows.
1. Project assets are of superior quality, which reduces the risk of default. The Huaxia Happiness PPP project was repaid by the right of return on heat supply, and Gu’an Jiutong and the government signed a stable exclusive heat supply agreement. According to the agreement, the probability of default risk is low during the offering and repayment of the ABS products of this project, and this project has a relatively stable cash flow; therefore, the actual yield of the final issue is lower.
2. Project senior/subordinated layering mechanism with tiered issuance. When the ABS products of the Huaxia Happiness PPP ABS project were issued, they were divided into senior and subordinated products, where the senior securities products were further divided into senior-1, senior-2, senior-3, senior-4, senior-5, and senior-6, each with a 1-year maturity based on time. The model time used in the experiment was selected as the overall project time of 6 years, which reduced the product issuance repayment risk, increased the liquidity of the product, and improved the actual price valuation so that the actual issue ended up with a lower pricing rate.
3. The original equity holders’ differential payment and third-party institution guarantee a mechanism. The multiple project support guarantees that the Huaxia PPP project has a better credit profile and the risk of default is further reduced, so it will finally cause the actual issue price to be higher than the experiment and the yield to be lower.
4.4 Implications of the empirical results for the pricing of ABS products
4.4.1 More flexible pricing for project products
When securitizing assets, the projection of cash flows is subject to more risk factors; therefore, it is necessary to measure the annual risk factors when forecasting cash flows. The use of Monte Carlo simulation in pricing such projects allows for flexibility in modifying risk factors according to project circumstances and changes, allowing for better adaptation to changes in project cash flows.
4.4.2 More reasonable pricing yields for project products
The use of Monte Carlo simulation to price the ABS products of the heating yield class can yield a more reasonable price range, as can be seen from the ABS products of the Huaxia Happiness PPP project, which have a senior/subordinate classification and issue several senior products with different yields, fluctuating from 3.9% to 5.2%. The use of Monte Carlo simulation can accurately predict a reasonable range of prices and obtain a yield that is suitable for the current situation of the project within a reasonable range. The overall pricing to obtain a more reasonable yield meets the requirements of the characteristics of the heating revenue rights class of projects. Therefore, the Monte Carlo simulations have a high reference value.
5 Discussion
Currently, the pricing of ABS products issued in the market mainly adopts the static discounted cash flow method and the static spread method. The underlying assets of ABS are mostly real estate, receivables and credit assets, unlike traditional ABS products, the underlying assets of PPP projects ABS products are mostly future income, and the traditional method does not accurately price them. Scholar Guo introduced the option-adjusted spread method for analysis, but it cannot be applied to all PPP projects ABS products. By introducing the Monte Carlo simulation method and conducting a comparative analysis of the empirical results, this study argues that the option-adjusted spread method and the Monte Carlo simulation method should be applied to different projects.
5.1 Items to which the option-adjusted spread method applies
The traditional option-adjusted spread method determines the price of a product by simulating the interest rate path through a binomial tree, relying on an analysis of cash flow forecasts to determine the specific price. If the cash flow forecast of the project is adjusted, it will affect the subsequent interest rate path as well as the final price determination; therefore, projects with less grading and fixed interest rates for the issuance of securities and projects with stable cash flows are more suitable for the option-adjusted spread method.
According to the PPP projects that have been implemented, the road, bridge, and tunnel projects have a stable cash flow for various reasons, such as government funding and social participation, so the use of the option-adjusted spread method for such projects can more accurately obtain the product price and yield.
5.2 Monte Carlo simulation applicable items
From the first PPP ABS projects issued in China so far, such as the Huaxia Happiness Heating Revenue Right PPP Project, New Water Source Sewage Treatment Revenue Right PPP Project, Shougang Sewage Treatment Revenue Right PPP Project, and Luyuan Sewage Treatment Revenue Right PPP Project, the ABS projects using heating and sewage treatment revenue rights as underlying assets have multi-grade senior securities with a wide choice of interest rates A typical one is the First Creation Sewage Treatment PPP Project with 18 graded rates.
A major reason for such graded projects is that there are more risk factors for cash flows to be received, so making cash flow forecasts requires setting multiple assumption parameters, which can effectively reduce the risk of default and the impact of cash flow changes.
Monte Carlo simulation modeling allows flexibility in adjusting the model to obtain a suitable price range, which is helpful for senior/subordinated types of PPP ABS products. Therefore, these types of wastewater treatment and heating revenue rights projects are well suited to pricing using Monte Carlo simulations.
This study uses a single case for empirical analysis, which can be expanded to include more cases for empirical analysis to improve the operability and accuracy of the methodology. This study can solve the financial problems in the construction of integrated energy service industrial parks, better help enterprises to solve energy use problems, promote the use of new energy in industrial parks, and help energy saving and emission reduction.
6 Conclusion
This study introduces four different methods of pricing PPP projects ABS products and analyzes their advantages and disadvantages. Based on the case of the Huaxia Happiness PPP ABS project, two methods–the option-adjusted spread method and the Monte Carlo simulation method–are selected for empirical research. A comparative analysis based on the research results concludes that the Monte Carlo simulation method is more suitable for pricing the PPP projects ABS products where the underlying asset is the right to income of heating. The Monte Carlo simulation method in such projects allows for accurate product pricing and the flexibility to adapt the model to financial market changes to obtain an appropriate price for the product.By successfully issuing ABS products based on the right of return on heat supply, it can help the construction of new energy industrial parks, provide integrated energy services for enterprises and residents, improve energy security and efficiency while achieving economic and sustainable profitability, and increase the application and development of new energy technologies to meet the needs of residents for low-carbon living and enterprises for energy conservation and emission reduction.
This study is based on the case of the Huaxia Happiness PPP ABS project to study the pricing method of the product, and the conclusions obtained have some reference value for and similar PPP projects with heating revenue rights as the underlying assets. However, the empirical results examine PPP project ABS products where the underlying assets are future income rights, and whether this applies to ABS projects where the other underlying assets are real estate, loan contracts and receivables cannot be accurately concluded from the empirical results alone. A large number of empirical tests are needed to correct the results and conclusions. Due to the limitations of this paper, a large number of cases have not been tested empirically, so further research and exploration is needed to analyse the applicability of the conclusions.
Data availability statement
The original contributions presented in the study are included in the article/supplementary material, further inquiries can be directed to the corresponding author.
Author contributions
This article was jointly completed by ZD and YZ. ZD was responsible for the paper construction and model processing, while YZ was responsible for data collection and peer review.
Funding
This research was supported by the Research Center for Economy of Upper Reaches of the Yangtse River, Chongqing Technology and Business University.
Conflict of interest
The authors declare that the research was conducted in the absence of any commercial or financial relationships that could be construed as a potential conflict of interest.
Publisher’s note
All claims expressed in this article are solely those of the authors and do not necessarily represent those of their affiliated organizations, or those of the publisher, the editors and the reviewers. Any product that may be evaluated in this article, or claim that may be made by its manufacturer, is not guaranteed or endorsed by the publisher.
References
Albalate, D., Bel, G., Bel-Piñana, P., and Geddes, R. R. (2015). Risk mitigation and sharing in motorway PPPs: A comparative policy analysis of alternative approaches. J. Comp. Policy Analysis Res. Pract. 17 (5), 481–501. doi:10.1080/13876988.2015.1010788
Ambrose, B. W., and LaCour-Little, M. (2001). Prepayment risk in adjustable rate mortgages subject to initial year discounts: Some new evidence. Real Estate Econ. 29, 305–327. doi:10.1111/1080-8620.00012
Doh, J. P., and Ramamurti, R. (2003). Reassessing risk in developing country infrastructure. Long. Range Plan. 36 (4), 337–353. doi:10.1016/S0024-6301(03)00069-4
Dunn, K. B., and McCONNELL, J. J. (1981). Valuation of GNMA mortgage-backed securities. J. Finance 36, 599–616. doi:10.1111/j.1540-6261.1981.tb00647.x
Dunsky, R. M., and Ho, T. S. Y. (2007). Valuing fixed rate mortgage loans with default and prepayment options. J. Fixed Income 16 (4), 7–31. doi:10.3905/jfi.2007.683315
Fermanian, J. D. (2013). A top-down approach for asset-backed securities: A consistent way of managing prepayment, default and interest rate risks. J. Real Estate Finan Econ. 46, 480–515. doi:10.1007/s11146-011-9331-2
Frost, C. W. (1997). Asset securitization and corporate risk allocation. Law Fac. Sch. Artic. 72 (1)101–157.
Gardener, E. P. M., and Revell, J. (1988). Securitisation: History, forms and risks”, research monograms in banking and finance, no. 5. Bangor: Institute of European Finance (University College of North Wales): L.
Hoppe, E. I., Kusterer, D. J., and Schmitz, P. W. (2013). Public–private partnerships versus traditional procurement: An experimental investigation. J. Econ. Behav. Organ. 89, 145–166. doi:10.1016/j.jebo.2011.05.001
Kalotay, A., yang, D., and Fabozzi, F. J. (2004). An option-theoretic prepayment model for mortgages and mortgage-backed securities. Int. J. Theor. Appl. Finance 07 (08), 949–978. doi:10.1142/S0219024904002785
Liebman, L. (1984). Political and economic markets: The public, private and not-for-profit sectors. Bull. Am. Acad. Arts Sci. 38 (2), 6–29.
McConnell, J. J., and Singh, M. (1994). Rational prepayments and the valuation of collateralized mortgage obligations. J. Finance 49 (3), 891–921. doi:10.1111/j.1540-6261.1994.tb00082.x
McConnell, J. J., and Singh, M. (1993). Valuation and analysis of collateralized mortgage obligations. Manag. Sci. 39 (6), 692–709. doi:10.1287/mnsc.39.6.692
Spackman, M. (2002). Public–private partnerships: Lessons from the British approach. Econ. Syst. 26 (3), 283–301. doi:10.1016/s0939-3625(02)00048-1
Keywords: PPP project, ABS pricing, Huaxia Happiness PPP project, option-adjusted spread, Monte Carlo simulation method
Citation: Duan Z and Zhang Y (2023) Research on the pricing of PPP project ABS products based on the right of income of heating. Front. Energy Res. 10:1112972. doi: 10.3389/fenrg.2022.1112972
Received: 30 November 2022; Accepted: 29 December 2022;
Published: 24 January 2023.
Edited by:
Zbigniew M. Leonowicz, Wrocław University of Technology, PolandReviewed by:
Grigorios L. Kyriakopoulos, National Technical University of Athens, GreeceSamuel Sunday Idowu, Caleb University, Nigeria
Copyright © 2023 Duan and Zhang. This is an open-access article distributed under the terms of the Creative Commons Attribution License (CC BY). The use, distribution or reproduction in other forums is permitted, provided the original author(s) and the copyright owner(s) are credited and that the original publication in this journal is cited, in accordance with accepted academic practice. No use, distribution or reproduction is permitted which does not comply with these terms.
*Correspondence: Zheng Duan, emhlbmdkdWFuNzc3QDE2My5jb20=