 Lianshan Lin
 David Lanning
 James R. Keiser1
 Jun Qu
- 1Oak Ridge National Laboratory, Materials Science and Technology Division, Oak Ridge, TN, United States
- 2Forest Concepts, Auburn, WA, United States
A Crumbler® rotary shear system was recently developed to process fuel-grade woodchips into feedstocks having more uniform particle sizes for improved flowability and higher thermochemical output yield than a traditional hammer mill. It represents a significant innovation in the state of the art of biomass comminution equipment. However, the milling unit has experienced significant abrasive wear of the feeding teeth and cutters when processing hard and dusty feedstocks, such as logging residue and corn stover. Here, we present initial simulation results from a finite-element stress analysis of the rotary shear, which is used to investigate the dynamics of interaction between the cutters and woodchips. This is the first step for optimizing the cutter design to improve the system lifetime and processing efficiency, thus reducing downtime and improving overall productivity.
Introduction
Variability in the size and shape of fuel-grade woodchips is a major source of inconsistent feed rate, flow plug, and poor flow into bioconversion reactors. Biomass flowability is one of the major barriers for efficient supply of feedstock (Mani et al., 2006; Shaw, 2008; Felix and Tilley, 2009; Miao et al., 2011; Rezaei et al., 2016). In addition to flow issues, particle length and thickness variability makes it difficult to achieve optimal yields of condensable vapors or non-condensable gases in thermochemical reactors (Schell and Harwood, 1994; Bitra et al., 2009; Oyedeji et al., 2016; Oyedeji et al., 2020). The particle size and shape of biomass particles after grinding are important for downstream processing (Mani et al., 2004; Lam et al., 2008; Guo et al., 2012; Ämmälä et al., 2018). The International Organization for Standardization (ISO) Solid Biofuel Standard 17,225-9 “Graded hog fuel and woodchips for industrial use” allows a percentage of chips up to 150 mm length in each liter of the sample (International Organizatio, 2020). Although allowable, such chips trigger bridging and jams in feed-handling systems. The solution is to replace the traditional hammer or knife mills with rotary shear mills, which can reduce the size and shape variability such that yields of desired chemicals are maximized and feeding issues are minimized.
Wide particle size distribution and a high aspect ratio are characteristic features of hammer-milled lignocellulosic biomass (Oyedeji et al., 2020). The undesired flatter particle size distributions and undesired shardy particle shapes exacerbate flowability issues. Hammermills consume more energy than desired due to high frictional losses within the grinding chamber. Hammermills are also operationally unworkable at a chip moisture content of about over 20 wt%.
Forest Concepts (FC), LLC has developed comminution and screening equipment, commercially known as the Crumbler® rotary shear system, which can process fuel-grade woodchips into much more uniform feedstocks with improved flowability and improved thermochemical output yields (Oyedeji et al., 2020). The Crumbler® rotary shear system (see Figure 1A) is more efficient than the traditional hammermills in comminuting high moisture biomass and producing very narrow particle size distributions to maximize reactor yields, low aspect ratios to improve flowability, and minimal fines that are not useful in the reactor. All of these factors represent significant innovations in biomass comminution equipment.
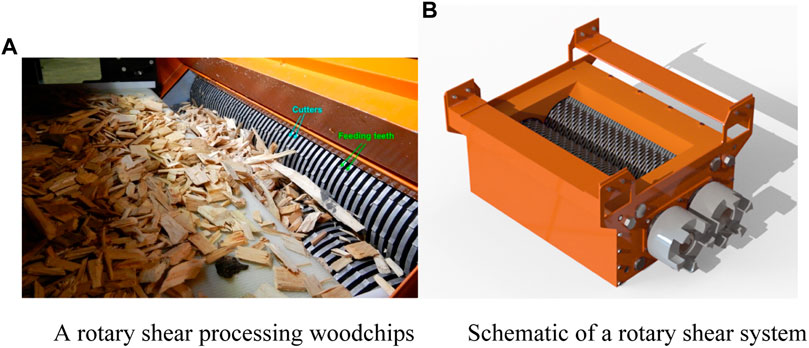
FIGURE 1. Crumbler® rotary shear biomass comminution system.
However, the rotary shear unit experiences significant abrasive wear, especially when processing hard and dirty biomass, such as dirty logging residue and recycled railroad ties. Figure 2 shows an example of worn cutters, and more detailed worn component characterization can be found in our earlier report (Lee et al., 2021). The desired cutter life is in excess of 1,200 operating hours. However, in as few as 300 h, cutter worn out had been observed in Forest Concepts (FC), LLC’s field experience in processing dirty southern hardwood. The current cutters and teeth are made of through-hardened A2 tool steel heat treated to a hardness of HRC 60. The specified HRC 60 hardness was selected as a trade-off between brittleness and abrasion resistance for this tool steel. Several cutter materials have been tested in search of optimized wear-resistance components, but it has not been possible to identify the controlling wear mechanisms or to identify “economically maximum-life” cutters and other wear parts because of lack of resources and expertise.
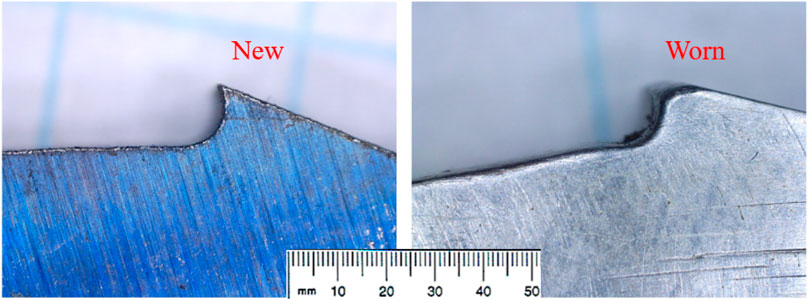
FIGURE 2. New and worn A2 tool steel cutter tooth.
The objective of this article is to present initial FEA simulation results to investigate the contact pressures at the cutter–biomass interface. Based on the rotary shear system’s CAD model, loading data, and material properties of woodchips (Glass, Zelinka; David), finite element models of a representative rotary tribosystem were built to establish the baseline design of the feeding teeth and cutters and to determine the ranges of contact pressure at the cutter–biomass interfaces. The dynamic simulations provide the means for revealing various ways that cutters break woodchips into smaller pieces, which provides useful information for identifying and implementing advanced materials and/or surface treatments for improved cutter life. Details and results are reported in the following sections.
Geometry
Three rotatory cutters (Figure 3) were exported from full CAD geometry to build representative components of the tribosystem. Cutter diameter, thickness, and tooth shape are tailored to the processed material and target output particle size. In the first analysis, 1.6- and 6.35-mm thick cutters with square corner teeth evenly distributed around the circumference were selected to investigate their dynamic behavior. These cutters with different thicknesses have the same outer diameter of approximately 54 mm and inner diameter of approximately 35 mm. Different shapes (sheet, plate, cubic, and bar) and dimensions of woodchips were investigated. Figure 4 shows a plate-shaped woodchip particle with a representative dimension of 27.5 × 17.5 × 3 mm. In addition, woodchip particles of dimensions 27.5 × 17.5 × 1, 27.5 × 16 × 6, and 27.5 × 14.5 × 10 mm were used in this investigation in order to cover the statistical range of thicknesses. In addition, bar-like 6 × 3 × 3 mm and cubic-shaped (6 × 6 × 6 mm) woodchips were considered with the thin cutter (1/16″ or 1.6 mm) system and parallelepiped-shaped 15 × 6 × 6 mm and plate-like 50 × 20 × 10 mm woodchip particles were considered with the thick cutter (1/4″ or 6.35 mm) system. Consideration of these additional woodchip geometries (shown in Figure 5) addresses the real woodchips flowing in a two-stage rotary cutter system in a real working scenario: larger woodchips (thickness of 6–10 mm) from the upper stream go through the first-stage cutter (thick cutter, ¼”); smaller woodchips (thickness of 3–6 mm) sheared by first-stage cutters then go through the second stage cutters (thin cutter, 1/16”), which are broken into even smaller particles (e.g., thickness <3 mm). The size of new particles generated by the cutters should be closer to the cutters’ thickness since the gap between every pair of cutters is almost equal to the thickness of the cutter. A two-stage cutter system might put the 6.35-mm cutters on the upstream and the 1.6-mm cutters on the downstream, which can break large woodchips more efficiently while avoiding jams in the woodchip stream.
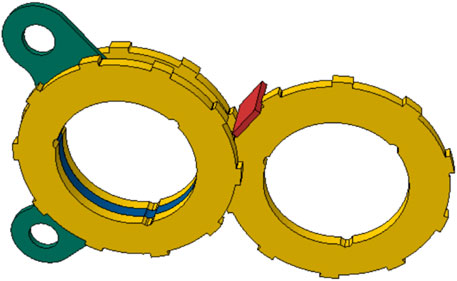
FIGURE 3. Tribosystem model for a 3-mm thick woodchip (red) sitting on three 6.35-mm thick cutters (yellow), assembled with a clearing plate (green) and a spacer (blue).
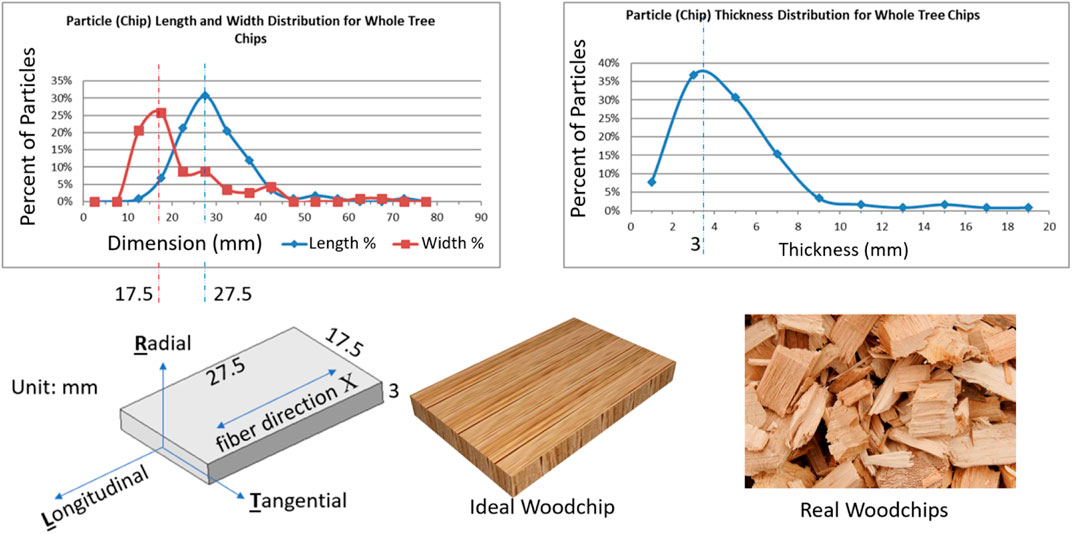
FIGURE 4. Representative dimensions of a plate-shaped woodchip. Unit in mm.
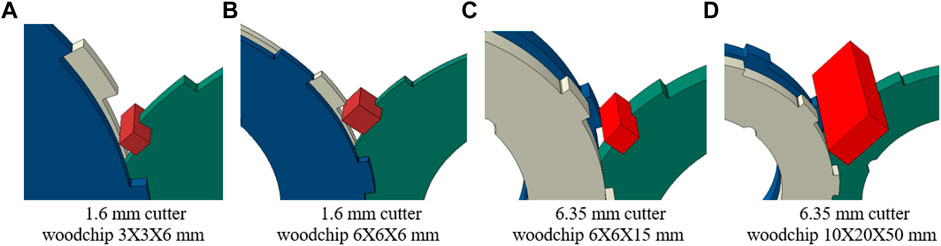
FIGURE 5. Woodchips in parallelepiped and cubic shapes (cutters in green, blue, and gray, and woodchips in red).
Initial simulations were focused on the contact pressure between the steel cutters and woodchip. As shown in Figure 6, the possible contact interfaces between a single woodchip and three 6.35-mm thick cutters are identified as regions 1, 2, 3, and 4. The rotation direction and speed (315 rpm) are also illustrated in Figure 6, which drive the woodchip into contact with the cutters’ teeth and edges. The 1.6-mm thick cutters have the same rotation direction, speed, and contact regions.
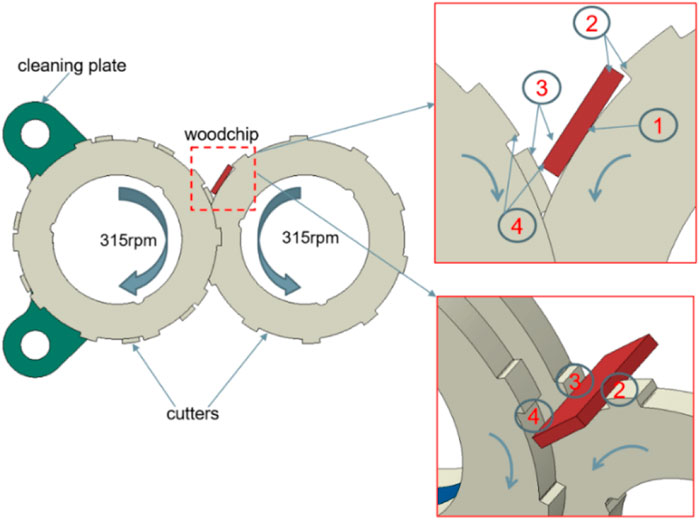
FIGURE 6. Contact regions between a woodchip and three cutters.
FE Model
Based on the geometry illustrated in Figure 3, the tribosystem is meshed into a finite element model to investigate the contact pressure between the steel cutter and woodchip. Figure 7 shows the meshes of three cutters and a woodchip in this finite element model. Since a hexahedral mesh with reduced integration points is preferred for dynamic simulation (ABAQUS Interactions, 2017), ABAQUS’s C3D8R elements have been used to mesh both the cutter and woodchip. A total of 30,500 elements and 39,444 nodes were used to model the three 6.35-mm thick cutters, while 1,725 elements and 2,304 nodes were used to model the 27.5 × 17.5 × 3 mm woodchip. Mesh size sensitivity and convergence were not the major concern of this work, but the contact area on the cutter blade edges were refined with smaller size elements than most of the other locations to capture the contact pressure distribution. The woodchip had homogenous size of elements, and the size was also fine enough to capture the large deformation and stress distribution. Due to the shaped edges, the mesh kept away from using superfine elements at the contact regions to avoid any stress singularity. More importantly, the mesh size was kept consistent for all the cases in the simulation, therefore making the results comparable.
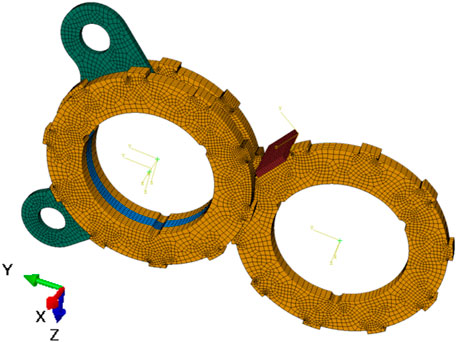
FIGURE 7. Finite element model of the tribosystem (6.35-mm thick cutters).
The rotation speed of three cutters was applied on their centers, which are shown in Figure 7 as the local coordinate origin for each cutter. Through kinematic coupling between each rotating center and corresponding cutter, the entire cutter body rotates along with its geometry center in the working speed of 315 rpm. The explicit dynamics analysis of this rotary cutters and woodchip system follows the govern equation of motion
where u is displacement,
where M is the diagonal lumped mass matrix, F is the applied load vector, and I is the internal force vector. More details of these equations can be found in reference to Explicit dynamics, (2017).
To set up the four contact regions between woodchip and three cutters, three contact pairs were created in this FE model. Figure 8 illustrates these contact pairs, with red square dots for the first/master surface and pink area for the second/slave surface in one pair. The contact regions ➀ and ➁ are included in Figure 8A, while Figures 8B,C have contact regions ➂ and ➃, respectively. All these contact pairs used the kinematic contact method and finite sliding setting, along with the tangential friction coefficient of 0.5 and normal behavior in “hard” contact for pressure overclosure.
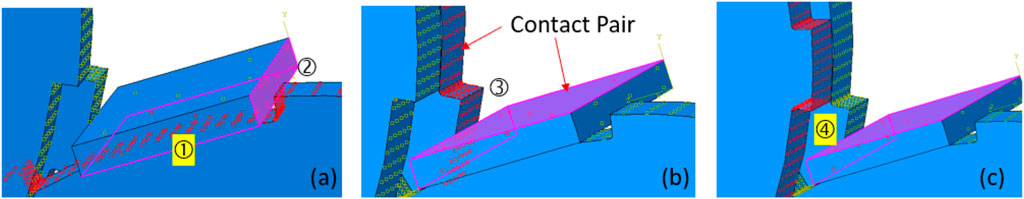
FIGURE 8. Contacts between a woodchip and cutters in the sFE model.
General Technical Report FPL–GTR–190 Chapter 4 (Glass, Zelinka) states that coefficients of kinetic friction for smooth, dry wood against hard, smooth surfaces commonly range from 0.3 to 0.5; at intermediate moisture content, 0.5 to 0.7; and near fiber saturation, 0.7 to 0.9. Considering the woodchip’s moisture level in this analysis, which is neither the dry case nor the near fiber saturation case, an intermediate value of 0.5 was assumed to be a reasonable start point for the calculations.
The “hard” contact pressure–overclosure relationship in ABAQUS implies that (ABAQUS Interactions, 2017) 1) the surfaces transmit no contact pressure unless the nodes of the slave (second) surface contact the master (first) surface; 2) no penetration is allowed at each constraint location (depending on the constraint enforcement method used, this condition will either be strictly satisfied or approximated); and 3) there is no limit to the magnitude of contact pressure that can be transmitted when the surfaces are in contact. This “hard” contact mode agrees with the assumed behavior on the normal interface between woodchip and cutters; therefore, we adopt it for all the dynamic simulations in this project.
The current cutters and teeth are made of through-hardened A2 tool steel, which was heat treated to RC 60. The basic material properties of the A2 tool steel are listed in Table 1, according to the Granta’s CES Selector database (GRANTA, 2014). As for the strength of A2 tool steel, its yield strength (YS) is 1.97 GPa, and ultimate tensile strength (UTS) is 2.36 GPa. Unlike isotropic elastic behavior of the tool steel, the mechanical properties of woodchips are anisotropic and thus are presented by multiple parameters. Five woodchips ranking by their hardness, i.e., 12% moisture yellow birch, 12% moisture red oak, 12% moisture coast Douglas-fir, green coast Douglas-fir, and green northern white cedar were selected as representatives of the very strong, strong, medium strong, medium soft, and very soft wood species, respectively (David). Geometry of the woodchip is determined by the particle size distribution in Figure 4. The parallelepiped and cubic shapes of the woodchip model (shown in Figure 5) cannot include all the features shown in a real woodchip but still be very close. The fiber direction of the woodchip is aligned with the rotary axis of cutter blades, which will produce the strongest resistance when the woodchip is stuck into two or three cutter edges. The woodchip material properties are extracted from references ((Glass, Zelinka) and (David)). Basically, the references provide big tables to cover all the wood species and available moisture conditions, and their mechanical properties are decided by the specific species and moisture level by looking for data in the tables. Their mechanical properties are listed in Table 1 (Glass, Zelinka; David).
TABLE 1. Mechanical properties of the cutter and wood materials used in the FE model (Glass, Zelinka; David).
A total of nine independent constants are needed to describe the elastic behavior of wood: three moduli of elasticity E, three moduli of rigidity G, and six Poisson’s ratios μ (David). The subscripts L, R, and T in Table 1 represent the three principal axes (Longitudinal, Radial, and Tangential as shown in Figure 4) of the woodchip with respect to its grain direction and growth rings. The longitudinal direction is parallel to the fiber grain direction or axis X in the FE model, which has the highest elastic modulus. The radial direction is perpendicular to the circle rings, while the tangential direction is the one perpendicular to radial direction in the wood’s cross-section surface. The moduli of wood in R and T directions are generally much lower than the strongest EL. The Poisson’s ratios are denoted by μLR, μLT, and μRT. The first letter of the subscript refers to the direction of applied stress and the second letter to the direction of lateral deformation. For example, μLR is the Poisson’s ratio for deformation along the radial axis caused by stress along the longitudinal axis. Similar combinations of subscripts are used in wood’s shear moduli such as GLR, GLT, and GRT. Erupture in Table 1 stands for the rupture modulus on the woodchip’s strongest direction, the fiber direction. In the finite element model, the direction of the wood fiber, i.e., direction of EL in Table 1, was aligned with the X-axis in Figure 7. The other two directions, T and R, were locally lined up with the width and thickness directions of the woodchip model. A local coordinate system for the woodchip was used for these direction assignments.
The finite element model simulates the dynamic behavior of this tribosystem for 0.0002 s. All the simulations were performed using the 2019 Golden (base) version of FEA software ABAQUS/Explicit (© Dassault Systèmes, 2018). The results shown later suggest that at about 0.14 ms the maximum contact pressure in the linear elastic regime (Figure 10, tension stress reached the rupture strength of 114 MPa) was recorded for the cutter–woodchip reaction from the initial contact. Based on the practice, a fine time interval of 4–5 µs is set to collect the stress change throughout the simulation.
Simulation Results
The stress results of the woodchip and cutter interaction were collected to verify the contact pressures at the interface during the simulation time span of 0.2 ms. Figures 9A–F show the stress along the fiber direction at different times. Without cutters displayed in these figures, contact regions 2 and 3 are pointed out in Figure 9A to indicate the woodchip’s location in this system. The contact regions illustrated in Figure 6 with the corresponding regions in Figure 9 show that the woodchip was first contacted by a cutter tooth in region 2, and then sheared in region 3. Figure 10 plots the history of the maximum tensile stress of the woodchip along the fiber direction (S11 in ABAQUS). Considering the 12% moisture yellow birch’s modulus of rupture 114 MPa, we believe that at 0.140 ms the tensile stress on the woodchip reached its elastic limit. Through the time span between 0 and 0.140 ms, a small-time interval (Δt) of 5 μs was set to trace the contact pressure between the cutter and woodchip interface. The maximum contact pressure due to shear was observed at 0.12 ms in contact region 3, which was 187.7 MPa as shown in Figure 11.
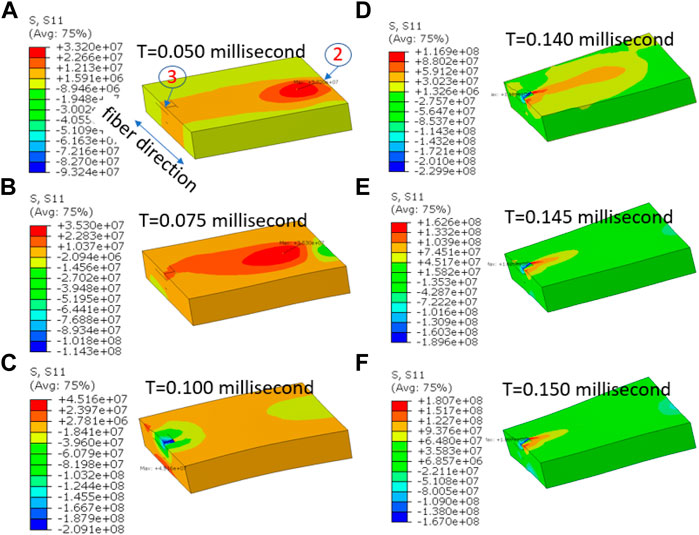
FIGURE 9. Woodchip stress in the fiber direction. Stress unit in MPa.
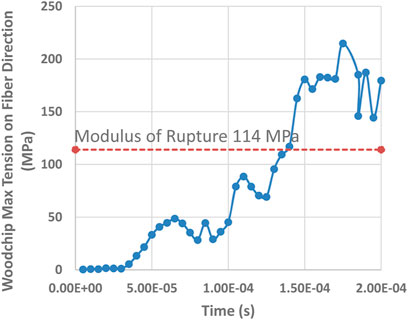
FIGURE 10. Maximum tensile stress on woodchip’s fiber direction, Δt = 5 µs
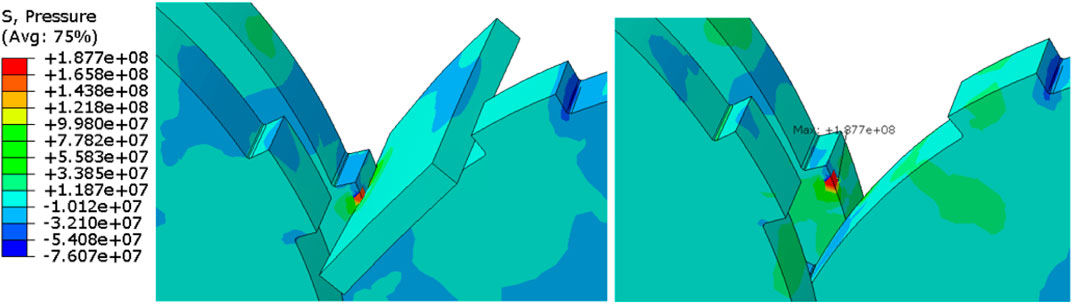
FIGURE 11. Maximum contact pressure 187.7 MPa on 6.35-mm cutters. The woodchip used is 12% moisture yellow birch and time = 0.12e-3 s, left, woodchip displayed; right, woodchip hidden.
By repeating the workflow, we identified the components’ elastic regime of 26 cases and collected the maximum contact pressures while the cutter and woodchip contacted through either cutter’s tooth or edge. Figure 12 shows another example of the maximum contact pressure on the thin cutters (1.6 mm thickness) while shearing a 3-mm thick green northern white cedar woodchip, which is 215.9 MPa at the moment of 16 µs. Table 2 summarizes the maximum contact pressure for these two different thickness cutter designs in cutting woodchips of various thicknesses.
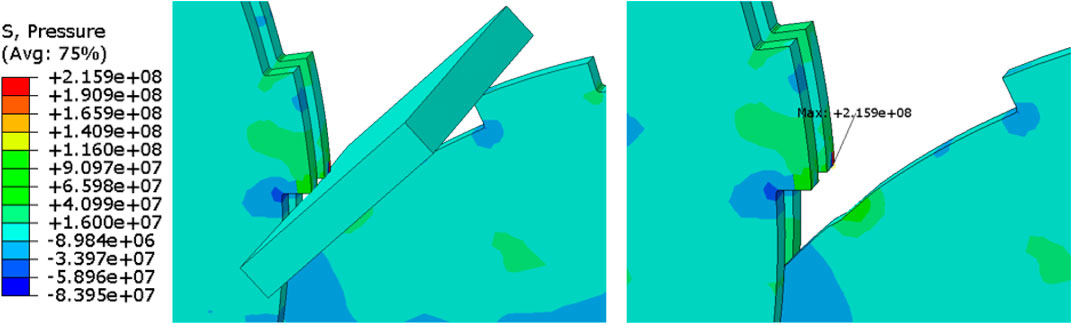
FIGURE 12. Maximum contact pressure 215.9 MPa on 1.6-mm cutters. The woodchip used is green northern white cedar and time = 0.016e-3 s, left, woodchip displayed; right, woodchip hidden.
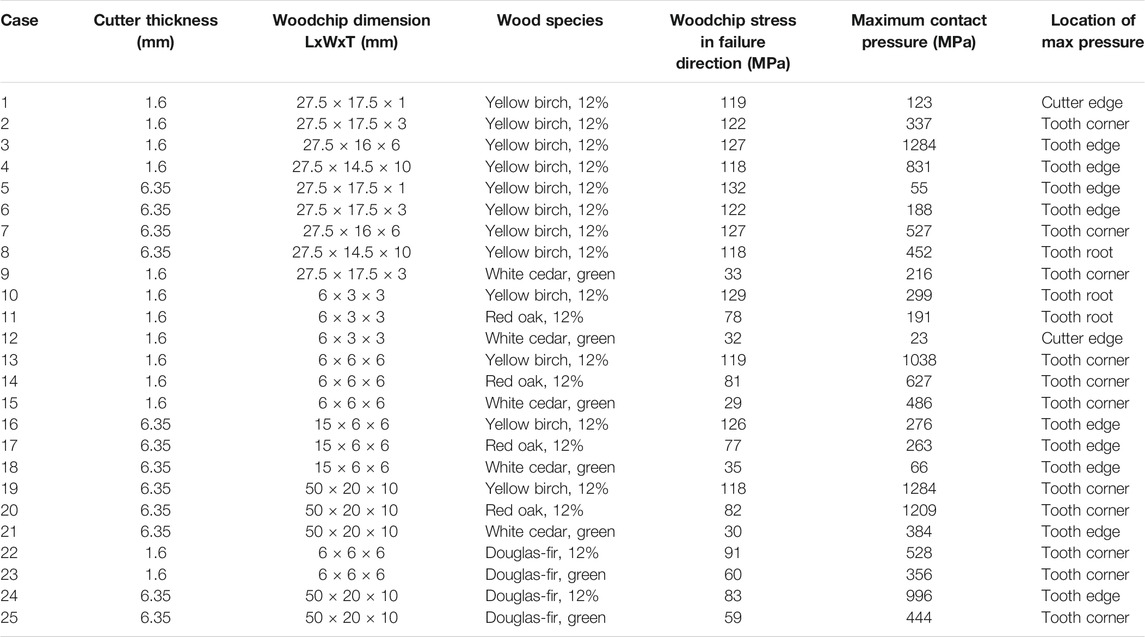
TABLE 2. Maximum contact pressure between the woodchip and cutters in the elastic regime.
Discussion
In summary, sliding velocity has been calculated, and dynamic analysis has been conducted for the Crumbler® rotary shear system to understand the contact pressure at the cutter–biomass interface. A finite element model based on the FC’s cutter design, loading data, and materials’ mechanical properties was established. The relative sliding velocity between the cutter and woodchip was calculated to be 1.78 m/s at the cutting edge and 1.86 m/s at the tooth tip, for a 4″ diameter cutter and specified rotation speed of 315 rpm. The dynamic simulation results showed different contact pressures for 4″ diameter and 1/16” (1.6 mm) thickness cutters processing different species of woodchips, for e.g., up to 1284 MPa for 12% moisture yellow birch in case 3, and low to 23 MPa for green northern white cedar in case 12. For thicker cutters (1/4″ or 6.35 mm), the maximum contact pressure went up to 1284 MPa as well in case 19 with 10-mm thick 12% moisture yellow birch and down to 55 MPa in case 5 with 1-m thick 12% moisture yellow birch. In general, a thicker woodchip will result in a higher contact pressure given the same wood species and similar shape. The only exceptions are cases 3 and 4, where the thicker woodchip (10 mm) in case 4 had a lower maximum contact pressure (831 MPa) than the thinner woodchip (6 mm) in case 3 (1284 MPa). The reversed tendency between woodchip thickness and maximum contact pressure could be explained by the location of maximum contact pressure (highlighted as red spots in Figure 13). Due to the thickness difference, the cutter contact was on the tooth edge with the 10-mm woodchip’s rim in case 4, while in case 3 the contact pressure was more focused on the cutter’s tooth corner.
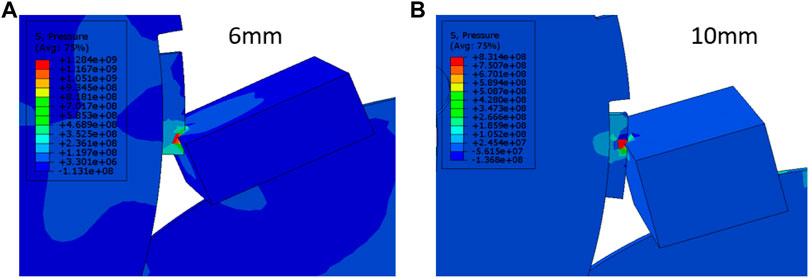
FIGURE 13. Contact pressure difference between case 3 (A) and case 4 (B).
All these simulation cases revealed another correlation between the wood species and the maximum contact pressures in the linear elastic stage. The ranking of the five types of woodchips, from the hardest to softest is the 12% moisture yellow birch, 12% moisture red oak, 12% moisture coast Douglas-fir, green coast Douglas-fir, and green northern white cedar. Harder woodchips seemed to induce a higher maximum contact pressure against the cutters. This correlation is illustrated in Figure 14 by using one series of thin cutters and one series of thick cutters. Given the same dimension of woodchips (50 × 20 × 10 mm) and the same 6.35-mm thick cutters, the strongest 12% moisture yellow birch had the highest maximum contact pressure, while the softest green white cedar had the lowest value. A similar trend was observed for the 6 × 6 × 6 mm cubic woodchips being processed by 1.6-mm thick cutters. Case 15 (green white cedar, 6 × 6 × 6 mm woodchip, 1.6-mm cutter) appears to be an exception that had a higher maximum contact pressure than the equivalent green coast Douglas-fir one (case 23). This could be caused by the different locations of the maximum contact pressure in cases 15 and 23. Initial investigation also indicated that the relative position between the woodchip and cutters would lead to woodchip’s local failure initiated at different contact regions, such as the cutter’s tooth corner (case 2), tooth edge (case 6 in Figure 11 and case 3 and case 4 in Figure 13), or circumferential edge.
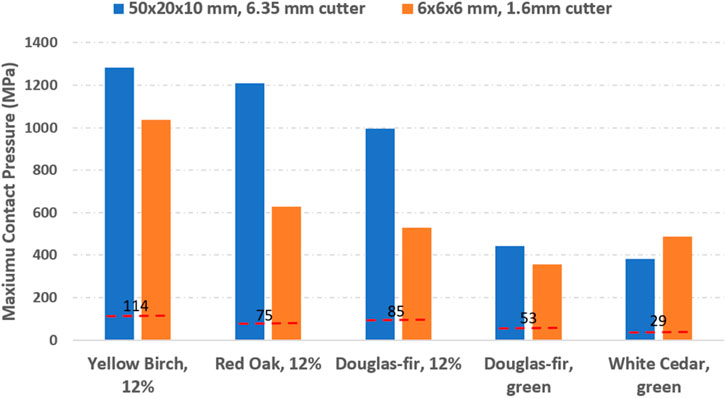
FIGURE 14. Correlation between woodchip species and maximum contact pressure, dash line for wood species’ rupture stress.
As shown in Figure 14, the contact pressure is higher than the strength of the wood but still below that of the steel material. The major reason of such high contact pressure here is that we consider both woodchip and steel materials as elastic materials, so the stress increases linearly with strain. We understand the drawback of such an assumption. First, the actual contact pressures would be different from current simulation results because of the linear elastic assumption on all material directions for the anisotropic wood materials. Furthermore, due to the linear elastic material assumption, the calculated normal stress for the woodchip at the contact region is above its compressive strength. Specifically, the calculated high contact pressures in radial and tangential directions are not realistic. The actual contact pressure should be significantly lower since the woodchip will rupture on the normal contact direction much earlier than reaching the elastic limit in the fiber direction. The dash line in Figure 14 shows that the rupture stress for each wood species is much lower than the maximum contact pressure recorded in simulation. Based on the linear elastic material assumption, what we really focused on was the tensile stress applied on the woodchip’s fiber direction due to the shear or bending effect from nearby cutter blades, which provided the strongest resistance to the rotary cutters. The tensile stress on the woodchip’s fiber direction has been carefully tracked against time to record the maximum contact pressure before the moment when fiber’s tensile stress is larger than its tensile strength.
High contact pressure at these contact locations brings up continuum damage to the cutters and gradually downgrades their functionality. The wear mechanisms could include several types, such as abrasive wear, surface fatigue, erosive wear, and corrosion wear, as detailed in Lee et al., (2021). However, a high contact pressure on the cutter surface is expected to result in high tangential friction on the cutter surface and accumulate more heat under continuous working conditions. Therefore, the contact pressure, particularly the maximum value that cutter can experience in each rotation is a good metric to evaluate the cutter’s loading level. The identified high contact pressure locations on the cutter teeth and edges also indicate the most needed regions for material enhancement for cutters to improve the useful life. In terms of fatigue wear, the maximum contact pressure can be used as a peak value to predict the fatigue life at those local regions since the cutter’s cycling speed is known. Dynamic simulations provide a way to correlate the maximum contact pressure from simulation results with experimental observations in future work. Once the numerical method is validated, the well-configured FE model will help understand the wear mechanisms more rapidly.
Experimental validation of the cutter–woodchip contact pressure on an actual rotary cutting machine is difficult due to the following reasons: 1) it is too difficult, if not impossible, to install a sensor on either the cutter blade or woodchip to measure the pressure/force; 2) the woodchip breaks into pieces after touching the blades in a very short time, making it rather challenging to capture the real contact response in the elastic stage. Still, this finite element analysis made it possible to compare the contact pressures for different wood species and/or woodchip shapes, thereafter to provide useful information for the cutter blade design. For example, such an analysis suggested that the current square cutter tooth (DZ design) can break woodchips more efficiently than the previous sharp curvy tooth design in our earlier report (Lee et al., 2021). The improved performance of the DZ design has been validated on actual rotary shear systems at Forest Concepts, and the new version of Crumbler® now is equipped with DZ design cutters.
Utilizing this finite element simulation method, initial effort has been carried out for optimizing the DZ tooth design. As shown in Figure 15, four different tooth height adjustments are proposed: from reduction by 0.5 mm to increases by 1, 2, and 3 mm. Calculated contact pressures against Douglas-fir with 12% moisture are listed in Table 3 for both the thick (6.35 mm) and thin (1.6 mm) cutters. For the thick cutter processing the large woodchip (10 × 20 × 50 mm3), the current DZ tooth height (0 mm) results in the highest contact pressure (996 MPa), and either increasing or decreasing the tooth height is expected to substantially reduce the contact pressure (450–550 MPa). For the thin cutter processing small woodchip (6 × 6 × 15 mm3), a lower tooth would increase the contact pressure, but a taller tooth would reduce the contact pressure with a significant drop for a 3 mm height increase. Since a taller tooth is also expected to provide better grip for feeding the woodchip based, the DZ tooth height is proposed to increase by 1–3 mm for the thick cutter and by 3 mm for the thin cutter (3 mm is maximum restricted by the clearance between two adjacent set of cutters in the assembly). Further simulations with different types of woodchips are underway to confirm the tooth height optimization, and corresponding prototype cutters will be fabricated for experimental validation. Such a simulation–optimization–validation approach will be applied for optimizing other key components, for e.g., clearing plate of the rotary shear system as well.
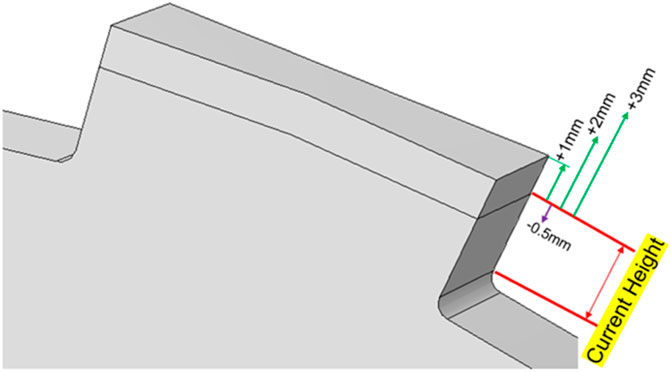
FIGURE 15. Proposed design idea for cutters: adjusting cutter tooth height.
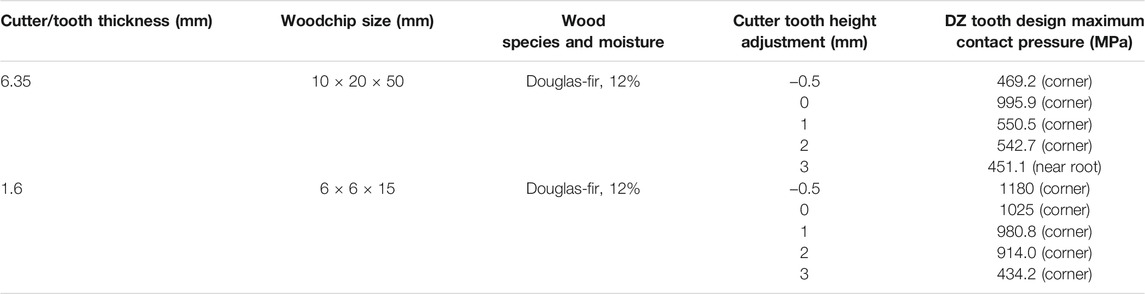
TABLE 3. Max contact pressures for cutters with various tooth height adjustments.
Current simulation of the rotary shear tribosystem includes only three cutters and one model woodchip. While significantly simplified, the simulation sets a foundation for further analysis for finding potential geometrical changes or loading conditions that could reduce the cutter wear. The simulation model can be used to optimize the cutter design, such as the shape of the tooth, to reduce the contact pressure. Simulations of various cutter designs shearing the same model woodchip will provide a clear comparison for extending cutter working life, improving cutter efficiency, and reducing costs, etc. Investigation on woodchip behavior under contact, such as the time needed to reach its elastic rupture limit, the possible deformation, and failure modes from this FE model can also be utilized to optimize the woodchip breaking.
Though various sizes of the woodchip were used in the current simulations, they are still “ideal” cases that cannot match with the actual woodchips with irregular shapes. The metric of maximum contact pressures assumes that the strongest resistance comes from tension in the woodchip’s fiber direction. More experimental work is needed to validate this assumption. The simulation considers woodchip’s anisotropic behavior in the elastic stage only in this material model, which differs from real woodchip’s intrinsic behavior. Woodchips might delaminate earlier along the weaker direction before reaching such a maximum contact pressure; however, the local failure has not been taken into consideration yet. The complex woodchip material behavior beyond the elastic stage could also bring variance in the maximum contact pressure. In all these simulations, only one woodchip was employed in the model. In actual operation, there are always multiple groups of cutters working against bunches of randomly orientated woodchips (see Figure 1). Examination of the used cutters also indicated that extrinsic inorganic particles included in the woodchips could bring severe abrasive wear or polishing wear on the cutters’ edge and surfaces. All these limitations in current FE models point to the direction of our future work. Further studies in cutter wear tests, surface coating design, structural optimization design, and numerical simulations will be combined to reveal the wear mechanisms and improve the lifetime of this rotary shear system.
Conclusion
A FEA model was built for the Crumbler® rotary shear system. Taking the assumption of woodchip’s elastic orthotropic behavior before reaching its rupture stress in the strongest fiber direction, dynamic analysis has been conducted for this rotary shear system to understand the contact pressure between the interface of the woodchip and cutter. Simulation cases showed ranges and trends of maximum contact pressures for different cutter designs and different species of woodchips.
From dynamic simulation, it can be concluded that the highest contact pressure was observed in the case with the hardest woodchip, the 12% moisture yellow birch, for the same cutters and the same size of woodchips. Similarly, the softest case, green northern white cedar, had the lowest contact pressure in the elastic stage. The woodchip’s thickness also played an important role in the contact pressure. In general, a thicker woodchip introduces more resistance to tension, compression, bending, and shear, leading to a higher contact pressure. In addition, the woodchip’s shape and relative location to the cutters also had some effects on the amplitude and position of the contact pressure on the cutters.
In conclusion, such a finite element analysis is an effective, quantitative approach to evaluate the interaction between the tool and feedstock in absence of direct contact measurement to guide tool design optimization.
Data Availability Statement
The original contributions presented in the study are included in the article/Supplementary Material, further inquiries can be directed to the corresponding authors.
Author Contributions
LL is the major contributor of this manuscript who did most of the simulation work and data analysis; DL provided original rotary cutter design geometry, working parameters, material properties, and all the other information related to cutter’s wear; JK and JQ guided the research work in this project and gave important revisions to this manuscript.
Funding
This research was sponsored by the Feedstock Conversion Interface Consortium (FCIC) of the Bioenergy Technologies Office, Office of Energy Efficiency and Renewable Energy, United States Department of Energy (DOE).
Conflict of Interest
DL was employed by Forest Concepts.
The remaining authors declare that the research was conducted in the absence of any commercial or financial relationships that could be construed as a potential conflict of interest.
Licenses and Permissions
This manuscript has been authored by UT-Battelle, LLC under Contract No. DE-AC05-00OR22725 with the U.S. Department of Energy. The United States Government retains and the publisher, by accepting the article for publication, acknowledges that the United States Government retains a non-exclusive, paid up, irrevocable, world-wide license to publish, or reproduce the published form of this manuscript, or allow others to do so, for United States Government purposes. The Department of Energy will provide public access to these results of federally sponsored research in accordance with the DOE Public Access Plan (http://energy.gov/downloads/doe-public-access-plan).
Publisher’s Note
All claims expressed in this article are solely those of the authors and do not necessarily represent those of their affiliated organizations, or those of the publisher, the editors, and the reviewers. Any product that may be evaluated in this article, or claim that may be made by its manufacturer, is not guaranteed or endorsed by the publisher.
Acknowledgments
The authors thank Drs. Fang Han, Hong Wang, and Edgar Lara-Curzio of ORNL for reviewing the manuscript.
References
Ämmälä, A., Pääkkönen, T. M., and Illikainen, M. (2018). Role of Screen Plate Design in the Performance of a Rotor Impact Mill in fine Grinding of Biomass. Ind. Crops Prod. 122, 384–391.
Bitra, V. S. P., Womac, A. R., Chevanan, N., Miu, P. I., Igathinathane, C., Sokhansanj, S., et al. (2009). Direct Mechanical Energy Measures of Hammer Mill Comminution of Switchgrass, Wheat Straw, and Corn stover and Analysis of Their Particle Size Distributions. Powder Techn. 193, 32–45. doi:10.1016/j.powtec.2009.02.010
David, E. Kretschmann, General Technical Report FPL–GTR–190 Chapter 5 Mechanical Properties of Wood.
Felix, E., and Tilley, D. R. (2009). Integrated Energy, Environmental and Financial Analysis of Ethanol Production from Cellulosic Switchgrass. Energy 34 (4), 410–436. doi:10.1016/j.energy.2008.10.013
Glass, Samuel. V., and Zelinka, Samuel. L. General Technical Report FPL–GTR–190 Chapter 4 Moisture Relations and Physical Properties of Wood.
Guo, Q., Chen, X., and Liu, H. (2012). Experimental Research on Shape and Size Distribution of Biomass Particle. Fuel 94, 551–555. doi:10.1016/j.fuel.2011.11.041
International Organization for Standardization (2020). Solid Biofuels — Fuel Specifications and Classes — Part 9: Graded Hog Fuel and wood Chips for Industrial Use. Available at: https://www.iso.org/standard/75158.html.
Lam, P. S., Sokhansanj, S., Bi, X., and Lim, C. J. (2008). Effect of Particle Size and Shape on Physical Properties of Biomass Grinds. Providence, Rhode Island: American Society of Agricultural and Biological Engineers. doi:10.13031/2013.24879
Lee, K., Lanning, D., Lin, L., Cakmak, E., Keiser, J. R., and Qu, J. (2021). Wear Mechanism Analysis of a New Rotary Shear Biomass Comminution System. ACS Sust. Chem. Eng. 9 (35), 11652–11660. doi:10.1021/acssuschemeng.1c02542
Mani, S., Tabil, L. G., and Sokhansanj, S. (2006). Effects of Compressive Force, Particle Size and Moisture Content on Mechanical Properties of Biomass Pellets from Grasses. Biomass and bioenergy 30 (7), 648–654. doi:10.1016/j.biombioe.2005.01.004
Mani, S., Tabil, L. G., and Sokhansanj, S. (2004). Grinding Performance and Physical Properties of Wheat and Barley Straws, Corn stover and Switchgrass. Biomass and Bioenergy 27, 339–352. doi:10.1016/j.biombioe.2004.03.007
Miao, Z., Grift, T. E., Hansen, A. C., and Ting, K. C. (2011). Energy Requirement for Comminution of Biomass in Relation to Particle Physical Properties. Ind. Crops Prod. 33, 504–513. doi:10.1016/j.indcrop.2010.12.016
Oyedeji, O., Fasina, O., Adhikari, S., McDonald, T., and Taylor, S. (2016). The Effect of Storage Time and Moisture Content on Grindability of Loblolly pine (Pinus Taeda L.). Eur. J. Wood Prod. 74, 857–866. doi:10.1007/s00107-016-1070-x
Oyedeji, O., Gitman, P., Qu, J., and Webb, E. (2020). Understanding the Impact of Lignocellulosic Biomass Variability on the Size Reduction Process: A Review. ACS Sust. Chem. Eng. 8, 2327–2343. doi:10.1021/acssuschemeng.9b06698
Rezaei, H., Lim, C. J., Lau, A., and Sokhansanj, S. (2016). Size, Shape and Flow Characterization of Ground wood Chip and Ground wood Pellet Particles. Powder Technol. 301, 737–746. doi:10.1016/j.powtec.2016.07.016
Schell, D. J., and Harwood, C. (1994). Milling of Lignocellulosic Biomass. Appl. Biochem. Biotechnol. 45-46, 159–168. doi:10.1007/bf02941795
Keywords: biomass comminution, finite element simulation, tool wear, woodchip, contact pressure
Citation: Lin L, Lanning D, Keiser JR and Qu J (2022) Investigation of Cutter–Woodchip Contact Pressure in a New Biomass Comminution System. Front. Energy Res. 10:754811. doi: 10.3389/fenrg.2022.754811
Received: 07 August 2021; Accepted: 21 January 2022;
Published: 14 February 2022.
Edited by:
Allison E. Ray, Idaho National Laboratory (DOE), United StatesReviewed by:
Bheru Lal Salvi, Maharana Pratap University of Agriculture and Technology, IndiaOluwafemi Oyedeji, Oak Ridge National Laboratory (DOE), United States
Oladiran Fasina, Auburn University, United States
Copyright © 2022 Lin, Lanning, Keiser and Qu. This is an open-access article distributed under the terms of the Creative Commons Attribution License (CC BY). The use, distribution or reproduction in other forums is permitted, provided the original author(s) and the copyright owner(s) are credited and that the original publication in this journal is cited, in accordance with accepted academic practice. No use, distribution or reproduction is permitted which does not comply with these terms.
*Correspondence: Lianshan Lin, bGlubEBvcm5sLmdvdg==; Jun Qu, cXVqbkBvcm5sLmdvdg==