 Yawer Jafri1*
 Johan M. Ahlström2Erik Furusjö1,2
 Simon Harvey3Karin Pettersson2
 Elin Svensson4
 Elisabeth Wetterlund1,5*
- 1Department of Energy Science, Division of Energy Engineering, Luleå University of Technology, Luleå, Sweden
- 2RISE Research Institutes of Sweden, Stockholm, Sweden
- 3Department of Space, Division of Energy Technology, Earth and Environment, Chalmers University of Technology, Gothenburg, Sweden
- 4CIT Industriell Energy AB, Gothenburg, Sweden
- 5International Institute for Applied Systems Analysis (IIASA), Laxenburg, Austria
As fossil-reliant industries turn to sustainable biomass for energy and material supply, the competition for biogenic carbon is expected to intensify. Using process level carbon and energy balance models, this paper shows how the capture of residual CO2 in conjunction with either permanent storage (CCS) or biofuel production (CCU) benefits fourteen largely residue-based biofuel production pathways. With a few noteworthy exceptions, most pathways have low carbon utilization efficiencies (30–40%) without CCS/U. CCS can double these numbers and deliver negative emission biofuels with GHG footprints below −50 g CO2 eq./MJ for several pathways. Compared to CCS with no revenue from CO2 sequestration, CCU can offer the same efficiency gains at roughly two-third the biofuel production cost (e.g., 99 EUR/MWh vs. 162 EUR/MWh) but the GHG reduction relative to fossil fuels is significantly smaller (18 g CO2 eq./MJ vs. −99 g CO2 eq./MJ). From a combined carbon, cost and climate perspective, although commercial pathways deliver the cheapest biofuels, it is the emerging pathways that provide large-scale carbon-efficient GHG reductions. There is thus some tension between alternatives that are societally best and those that are economically most interesting for investors. Biofuel pathways vent CO2 in both concentrated and dilute streams Capturing both provides the best environomic outcomes. Existing pathways that can deliver low-cost GHG reductions but generate relatively small quantities of CO2 are unlikely to be able to finance the transport infrastructure required for transformative bio-CCS deployment. CCS and CCU are accordingly important tools for simultaneously reducing biogenic carbon wastage and GHG emissions, but to unlock their full benefits in a cost-effective manner, emerging biofuel technology based on the gasification and hydrotreatment of forest residues need to be commercially deployed imminently.
1 Introduction
Sustainable biofuels are gaseous or liquid biofuels that are not considered to have a detrimental effect on the environment (The European Commission 2021), (The European Commission 2020). Whether a biofuel product can be classified as sustainable varies by jurisdiction and is typically determined by whether it meets pertinent environmental benchmarks. As an example, in the European Union, a biofuel is currently considered sustainable if it is manufactured from a feedstock that is listed in Part A of Annex IX of the European Renewable Energy Directive (RED II) (The European Commission 2018). Examples of such feedstock include sawdust, bark, lignin, tall oil, straw, used cooking oil, and other biomass types defined as waste streams.
The need for biofuels as a climate change mitigation tool has been repeatedly stated by numerous researchers, organizations and legislative powers. Daioglou et al. (2019) state that achieving climate targets is contingent on the use of advanced bioenergy technology (Daioglou et al., 2019). Similar conclusions are reached by multiple studies (see e.g. (Fulton et al., 2015)). According to the International Energy Agency’s roadmap to net zero GHG emissions by 2050, worldwide bioenergy supply will exceed 100 EJ 2050, thereby covering ∼19% of the total energy supply, ∼25% of which is expected to be in the form of liquid and gaseous biofuels (Bouckaert et al., 2021). The International Panel on Climate Change (IPCC) has asserted similarly and estimated that 30–310 EJ/a of primary bioenergy is required to meet the 1.5°C temperature increase target (Masson-Delmotte et al., 2018).
Biomass is a limited resource, leading to two observations: 1) the demand for biofuels will increase in several sectors and careful balancing is required as to where they will most benefit society, 2) the biofuel industry will increasingly come under greater pressure to reduce wastage and maximize the utilization of biogenic carbon. This study is concerned with the implications of the second observation. Besides efficiency improvements in feedstock conversion and utilization of by-products, there are two key options for reducing the wastage of carbon in any biofuel production process, carbon capture and storage (CCS) and carbon capture and utilization (CCU).
CO2 is present in off-gas streams in all thermochemical conversion processes for fuel production (Fridahl and Lehtveer 2018). Storing CO2 emissions from biomass conversion processes lowers the GHG concentration in the atmosphere; the emissions are thus negative. This concept is often referred to as bioenergy carbon capture and storage (BECCS). Atmospheric CO2 removal (CDR) might be required to reach stringent climate target and BECCS is highlighted as a key enabling technology (Azar et al., 2013). In IPCC’s sixth assessment report, two out of five scenarios reach the well below 2°C temperature increase target, both of those scenarios are reliant on net negative GHG emissions after 2050 through CDR (Masson-Delmotte et al., 2022).
The CO2 streams that are captured can also be used as feedstock for producing additional biofuels. This concept is referred to as bioenergy carbon capture and utilization (BECCU) (Koytsoumpa et al., 2021). BECCU can improve the utilization of biogenic carbon in advanced biofuel production pathways. Several routes are available for utilizing captured CO2, one of which is conversion to biofuels with the help of renewable (electrolysis-based) hydrogen, often also referred to as the Power-to-X route (Lehtveer et al., 2019). Examples of BECCU concepts include the production of bio-methane via the Sabatier process (Ahlström et al., 2018) and the synthesis of methanol (Guil-López et al., 2019) from CO2 and hydrogen, with subsequent conversion to bio-gasoline through the MTG (Methanol to Gasoline) process (Hennig and Haase 2021).
BECCU and BECCS are relatively new fields of study and much of the research has been directed at pathways where biomass is combusted for heat and power generation (Rootzén et al., 2018; IEA Bioenergy 2020; Fuss and Johnsson 2021). The research base on combining CCS/U with biofuel pathways is more limited (Babin et al., 2021; Emenike et al., 2021; Koytsoumpa et al., 2021; Ritchie and Efstathios-Al 2021; Shahbaz et al., 2021). Alamia et al. (Alamia et al., 2017) investigated the potential of increasing bio-methane production by adding an electrolyzer to a dual fluidized bed (DFB) gasification process. They quantified production gains but did not perform a full techno-economic evaluation. With a starting point in well-established pathways, an important recent contribution to BECCU literature came from Rodin et al. (Rodin et al., 2020) who, reviewed the literature on the capture and upgrading of CO2 from ethanol and biogas plants. They estimated that 69.7 Mt/y of CO2 are produced by biogas upgrading, biogas combustion and fermentation processes, which is close to currently available estimates for the potential European industrial CO2 demand. Their study did not cover well-established and widely deployed commercial pathways such as diesel from crude tall oil and tallow. Nor did it examine the growing number of sustainable biofuel pathways built around emerging conversion processes such as gasification, pyrolysis, lignocellulosic fermentation, and biomass hydrotreatment, which either require or can be integrated with existing industries, and which are at a relatively advanced stage in their development cycle.
There is a gap in the research literature on combining BECCS and BECCU with biofuel production. While specific biofuel processes have been studied, there are no comparisons of the potential benefits of CCS and CCU that cover multiple types of emerging and commercial biofuel pathways. This study investigates the potential benefits of adding a CCS and CCU option to fourteen biofuel production pathways based mainly on biomass residue feedstocks. The purpose is to identify which biofuel pathways are suitable candidates for BECCS and/or BECCU and which can offer the lowest cost of GHG reductions. Specifically, the aim is to quantify and comparatively evaluate GHG footprints, the share of feedstock carbon in biofuel products and in sequestered CO2, biofuel production costs and GHG reduction costs.
Commercial alternatives for biofuel production, such as anaerobic digestion of sewage sludge differ from emerging biofuel production technologies such as biomass gasification, both in the type of feedstocks and by-products. This study covers both commercially widespread pathways, such as anaerobic digestion and diesel from tallow, and relatively novel but technically well-demonstrated pathways, such as drop-in biofuels from the gasification of black liquor or the hydro-pyrolysis of forest residues. It investigates if there are any discrepancies, such as divergences in carbon, cost and climate outcomes, between pathways that are currently dominant and those that may offer the best value in terms of carbon utilization and GHG reduction under future BECCS and BECCU implementations. Such information is crucial in the development of new strategies for large-scale adoption of biofuel production. Although the study is anchored in a Swedish context, the results and findings are generalizable to other localities with access to biomass residues.
Extensive process models based on data primarily from the open literature are used to compile carbon and energy balances for each biofuel process with and without CCS/U. These balances form the foundation for investigating resource and environomic performance based on a basket of techno-economic metrics. An energy market scenario model is adapted to generate possible energy market scenarios for 2030. The energy and mass balances, capital- and operation cost calculations as well as GHG balances provide a useful database of performance metrics for some of the most discussed biofuel processes. Such data can greatly aid other researchers in further exploration of biofuel production in combination with different BECCS and BECCU concepts.
2 Biofuel Pathways Investigated
The biofuel pathways examined in this study are listed in Table 1 and are referred to throughout the study with their designated abbreviation. The first two letters in each abbreviation denote the biofuel product–ethanol (bio)-methane, drop-in biofuels (one or more of gasoline, diesel, LPG) -, the middle two letters denote the biomass feedstock–sawdust, wheat grain, food waste and manure, sewage sludge, forest residues, lignin, crude tall oil, tallow (meat industry residue), black liquor, bark –, and the final two letters denote one or more of the principal conversion technologies–fermentation, anaerobic digestion, fast pyrolysis, hydrothermal liquefaction, hydrodeoxygenation, hydropyrolysis–the last three are referred to as hydrotreatment collectively–gasification, methanol synthesis, methane synthesis, and Fischer-Tropsch synthesis. An overview of biomass feeds, biofuel products, and principal conversion technologies is provided in Figure 1. Covering a broad array of biomass residues, the feedstock base differs significantly in terms of potential amounts available for biofuel production. The feedstock potential of crude tall oil or food waste and manure, for example, is relatively small compared to black liquor or forest residues. However, these feedstocks are all either already in commercial use or are in receipt of serious development interest.
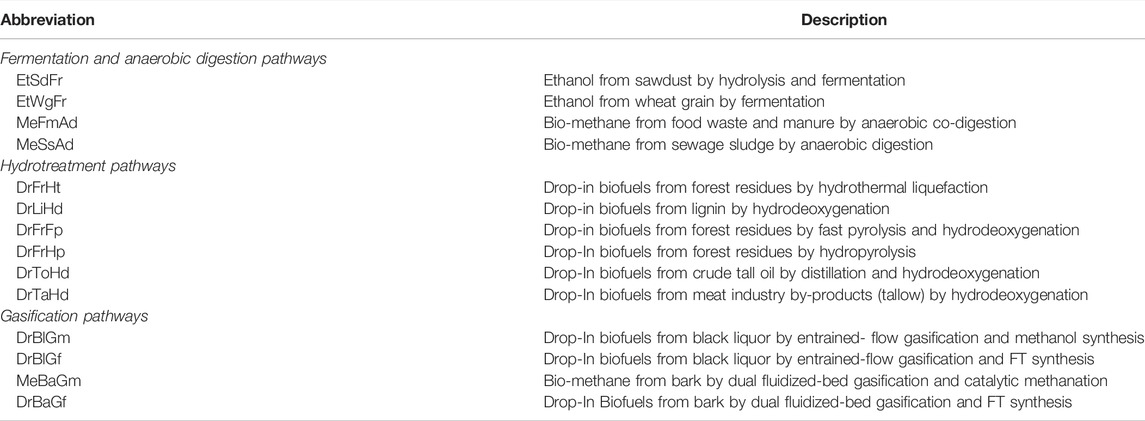
TABLE 1. Complete list of examined biofuel pathways. See the text for the abbreviation key.
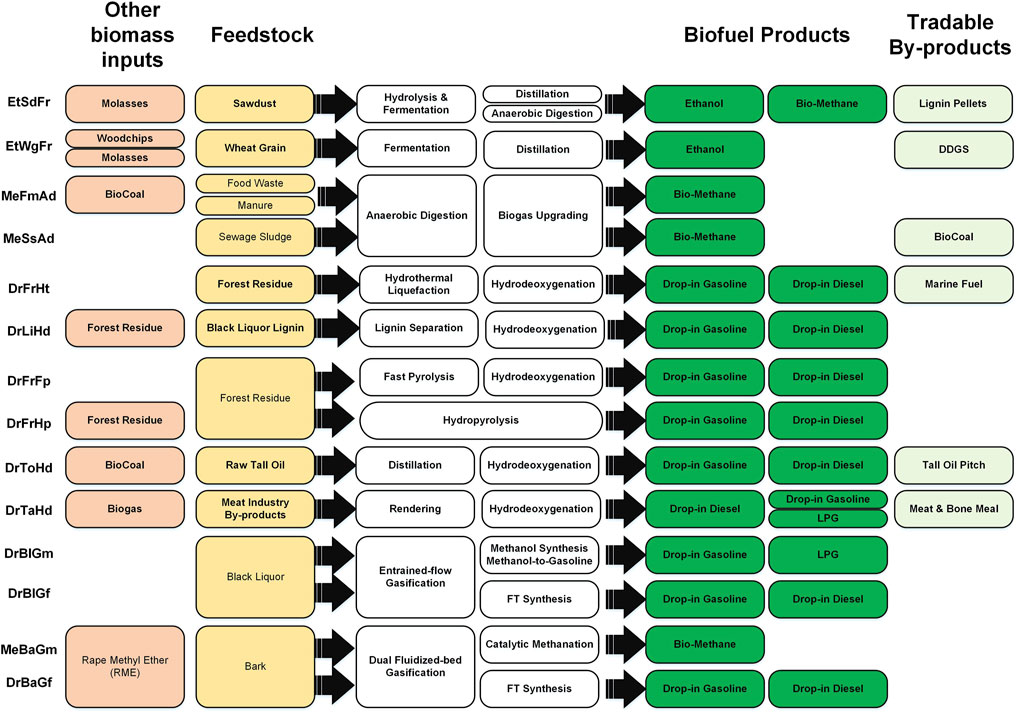
FIGURE 1. Feedstocks, biofuel products and principal conversion technologies for the pathways studied.
In addition to biofuels, several pathways also produce economically valuable by-products, collectively referred to as tradable by-products. Besides acronyms, development status (commercial or emerging) and technology track (fermentation, anaerobic digestion, hydrotreatment, gasification) are also used as classifiers in the discussion.
The process configurations for which the carbon and energy balances have been compiled are presented in the next section. Apart from ethanol from wheat grain (EtWgFr), all other pathways use biomass feedstocks classified as residues or wastes. EtWgFr is currently implemented commercially in Sweden and the environmental sustainability of the process is considered to be high (Lantz et al., 2018).
EtWgFe, MeFmAd, MeSsAd, DrToHd and DrTaHd have been deployed commercially. The remaining pathways have not seen much commercial deployment but have in general undergone significant research and development work. Several of the emerging pathways, such as MeBaGm, the core processes in DrBlGm, and DrFrHp have been tested extensively in pilot facilities.
3 Materials and Method
3.1 Study Design
The various evaluations presented in this study were based on carbon and energy balance models of a typical representative example for each of the examined pathways under three options:
• base,
• CCS, and
• CCU.
Under the base option, biofuels were produced without CO2 capture. Under the CCS option, depending on the pathway, one or more of the CO2 streams generated during biofuel production were captured and transported to a permanent storage location by ship or by ship and truck. Under the CCU option, the captured CO2 was upgraded to either bio-methane (EtSdFr, EtWgFr, MeFmAd, MeSsAd, MeBaGm) or drop-in gasoline and LPG (all other pathways).
Principal references for the biofuel process models are provided in Table 2. Pathways were classified into two types: stand-alone and integrated. Stand-alone plants were characterized by the absence of exchange of material and/or energy streams generated during the biofuel production process with nearby industrial facilities. Integrated plants were characterized by the co-location of some or all parts of the production process with one or more industrial facilities. Table 2 also lists the size of the biofuel plant for each pathway in terms of the total feedstock input, which was kept the same under the base, CCS and CCU options to provide a consistent frame of reference. An important parameter in the economic analyses is the choice of plant sizes, discussed in the next section.
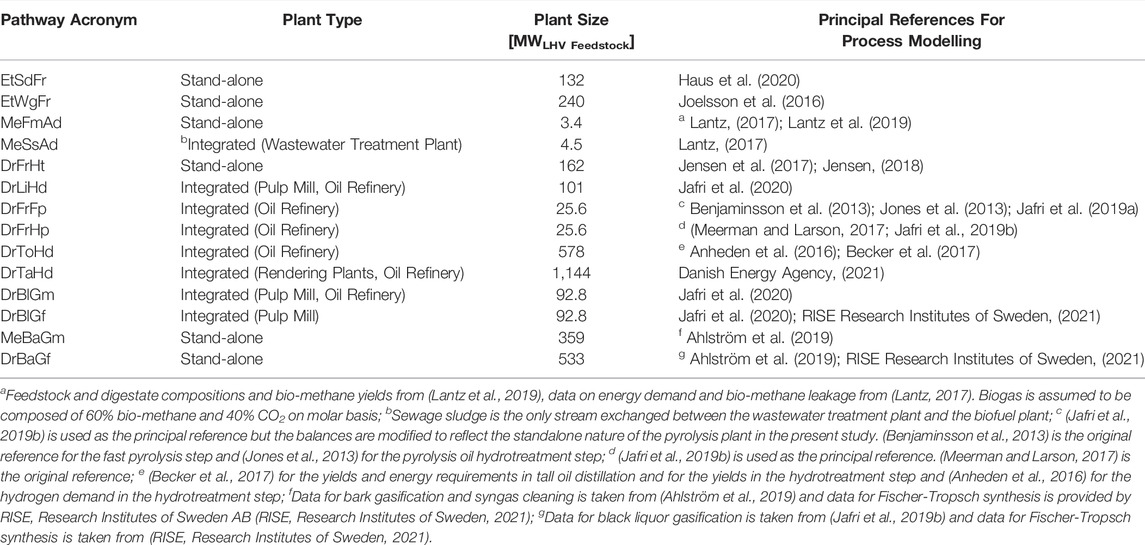
TABLE 2. Principal references for biofuel pathway process models.
3.2 Biofuel Pathway Process Models
Carbon and energy balances were compiled using detailed spreadsheet models created following the principle of using publically available studies as primary references and of using the same study, to the extent possible, for representing the entire base process configuration. Schematic process configurations are provided in the Supplementary Material. A consistent set of composition and thermochemical data for biomass materials were used across pathways to reduce inconsistencies in assumptions. Lack of data in combination with some of the pathways, e.g. DrToHd and DrTaHd, being party to multiple processing steps integrated with different industry segments entailed that multiple references could not be wholly avoided.
3.2.1 Fermentation and Anaerobic Digestion Pathways
Simplified schematic overviews of the fermentation (EtSdFr, EtWgFr) and the anaerobic digestion (MeFmAd, MeSsAd) pathways are shown in Figure 2. Equaling ∼10% of the Swedish sawdust potential, the biofuel plant in EtSdFr was sized for a sawdust input of 25 t/h (Haus et al., 2020). With a wheat grain input equaling 55 t/h, the biofuel plant in EtWgFr was sized the same as in (Joelsson et al., 2016), which is in the same range as Lantmännen Agroethanol’s commercial facility near Norrköping, Sweden (Andersson 2015). The heat demand of the ethanol plant is met by combusting biomass and under the CCS/U options it is assumed that the resulting dilute CO2 stream can be captured.
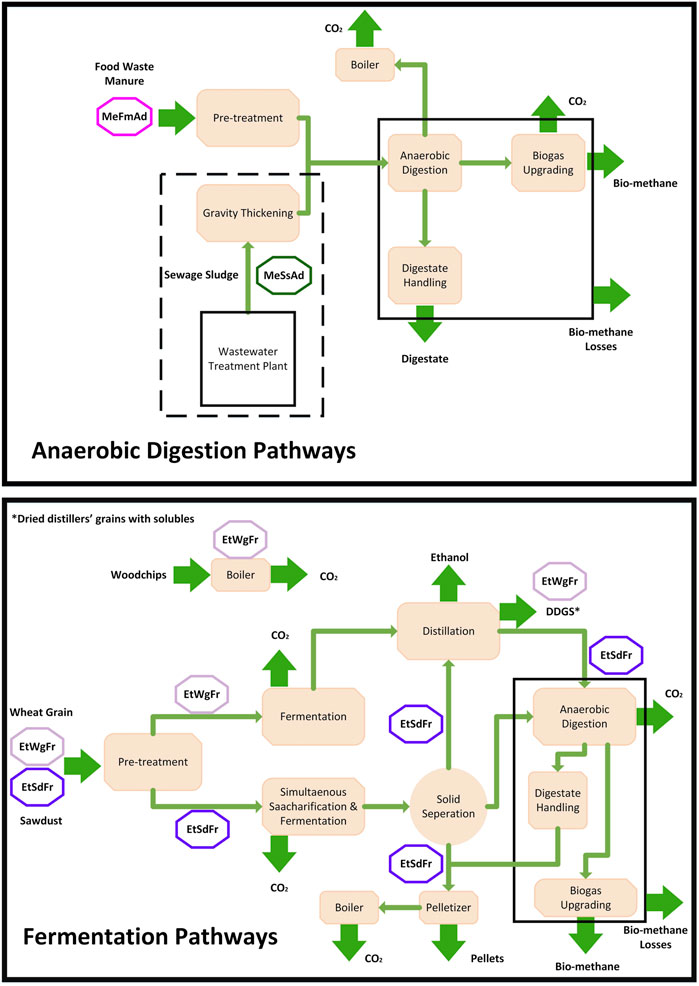
FIGURE 2. Simplified schematic overviews of the fermentation and anaerobic digestion pathways. Abbreviations are used to separate process steps and inputs/outputs that are specific to a pathway from those that are common to two or more pathways. Only biogenic carbon flows are shown. Dashed lines indicate physical boundaries. For detailed process configurations, see the Supplementary Material.
MeFmAd was sized to resemble an “average” plant of the co-digestion type, based on (Energigas Sverige 2021). A typical wastewater treatment plant in Sweden produces ∼100 kWh of biogas per person-equivalent and year. The biofuel plant in MeSsAd was sized to process 100,000 person-equivalents worth of sewage sludge (Balmér 2018).
It was assumed that the use of sewage sludge digestate as fertilizer will continue through to the year 2030. This is currently only allowed to a limited extent in Sweden and is disallowed in several European countries. An alternative is to convert the sludge to biocoal for use as heating fuel or as a medium, through ground burial, of carbon capture. MeFmAd was modelled with sewage sludge digestate as fertilizer under the base and CCS options, and with the conversion of digestate to biocoal under the CCU option. Some of the biocoal produced was used to meet the parasitic heat demand, while the remaining bulk was treated as a tradable by-product.
3.2.2 Hydrotreatment Pathways
Simplified schematic overviews of the hydrotreatment pathways (DrFrHt, DrLiHd, DrFrFp, DrFrHp, DrToHd, DrTaHd) are shown in Figure 3. DrFrHt was sized for a forest residue input of ∼250,000 t/y following the scale chosen by (Jensen et al., 2017). Although DrFrHt was modelled as a standalone plant, it was assumed that the petrol, diesel and heavy residue from the hydrotreatment unit are delivered to a crude oil refinery for finishing and blending with refinery blendstocks. DrLiHt was sized for a lignin input equal to 18.5% of the black liquor flow to the recovery boiler for a market pulp mill with a pulp production capacity of 2000 t/d. 18.5% is around the upper limit for removing lignin without undue impact on recovery boiler and other pulp mill operations (Jafri et al., 2020).
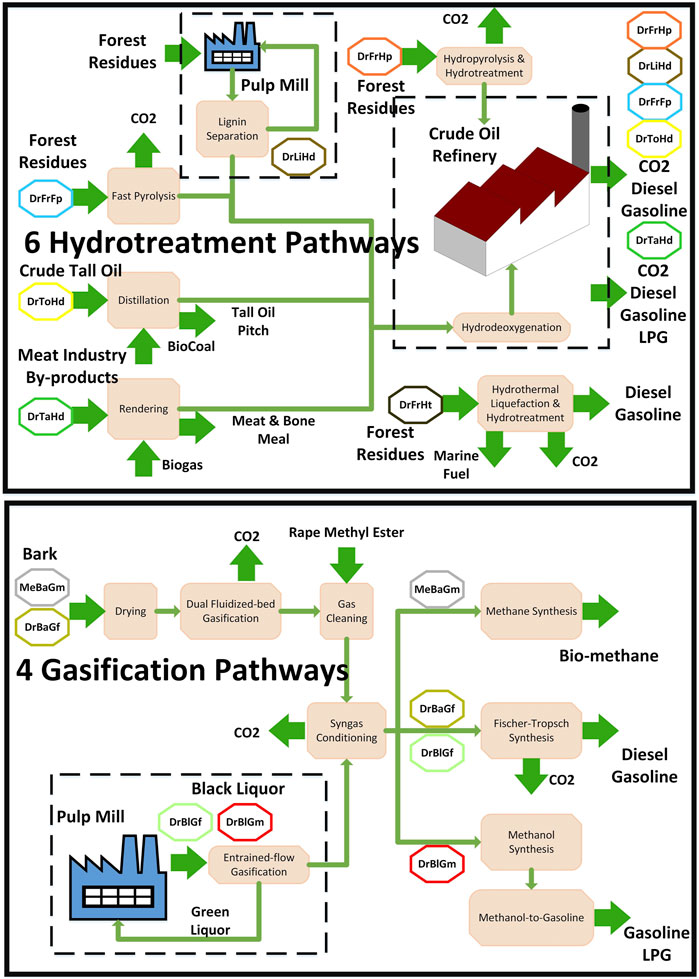
FIGURE 3. Simplified schematic overviews of the hydrotreatment and gasification pathways. Abbreviations are used to separate process steps and inputs/outputs that are specific to a pathway from those that are common to two or more pathways. Only biogenic carbon flows are shown. Dashed lines indicate physical boundaries. For detailed process configurations, see the Supplementary Material.
Biofuel plants in the two pyrolysis pathways (DrFrFp, DrFrHp) were sized to process 10 t/h of forest residue, which is close to the capacity of the large commercial fast pyrolysis plant in Joensuu, Finland (PyroWiki 2020). The biofuel plant for DrToHd was sized to process 200,000 t/y of crude tall oil, which is the size of the state-of-the-art crude tall oil biorefinery slated for construction in Kotka, Finland (International 2021). With a meat industry by-product feed input equivalent to ∼50,000 t/y of drop-in diesel, the plant size for DrTaHd was similar to a plant in the middle of the commercial plant range provided in (Danish Energy Agency 2021).
3.2.3 Gasification Pathways
Simplified schematic overviews of the gasification (DrBlGf, DrBlGm, MeBmGm, DrBaGf) pathways are shown in Figure 3. The biofuel plants in DrBlGf and DrBlGm were sized to process 18.5% of the black liquor flow to the recovery boiler for a market pulp mill with a pulp production capacity of 2000 t/d in accordance with the reference study (Jafri et al., 2019a). Their plant capacities correspond to relatively small gasification plants that can be integrated with a pulp mill without capital intensive and potentially disruptive operational changes. The biofuel plants in MeBmGm and DrBaGf were both sized to match the bark input required to produce 200 MWth of bio-methane, based on the conversion efficiencies provided in (Ahlström et al., 2019). 200 MW represents the inflection point at which feedstock availability and handling logistics start being significant at most geographical locations, following the argument outlined in (Thunman et al., 2019).
3.3 Modeling Assumptions for Bioenergy Carbon Capture, Storage and Utilization
Important features of the carbon and energy balance models under the CCS and CCU options are summarized in Table 3. Concentrated streams was chosen as a collective term for CO2 streams of high purity, assumed to have a concentration of 100%, typically generated in fermentation or when CO2 is removed from syngas produced in the course of biofuel production. In eight of the pathways (EtSdFr, EtWgFr, MeFmAd, MeSsAd, DrBlGm, DrBlGf, MeBaGm and DrBaGf), it is assumed that the available concentrated streams can be captured without additional use of energy. Dilute stream was chosen as a collective term for CO2 streams of low purity such as flue gases from biomass boilers, methane reforming units and multifuel boilers at crude oil refineries. Dilute streams subject to CO2 capture were directed to a capture unit operating with monoethanolamine (MEA) solvent. Alternatives such as membrane processes for CO2 separation are not presently considered to be economically competitive in large-scales today and future developments are uncertain. The data on energy demand of CO2 capture from different types of dilute streams is provided in the Supplementary Material.
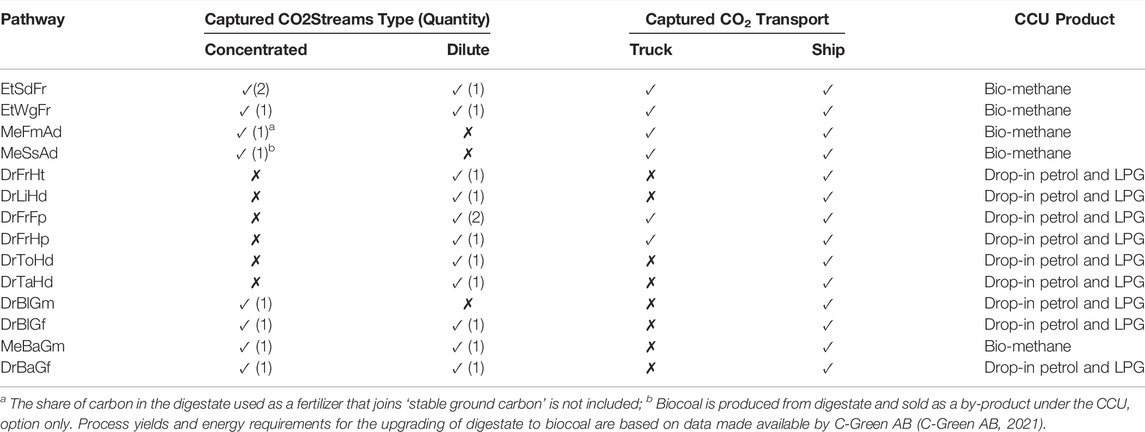
TABLE 3. Logistics and design of CO2 capture, transport and upgrading under the carbon capture and storage (CCS) and carbon capture and utilization (CCU) options.
3.3.1 Bioenergy Carbon Capture and Storage
Depending on the pathway, CO2 was transported from the capture site to the final storage facility by ship, which applied to all capture sites located close to harbor facilities, or by truck and ship, which applied to all capture sites located inland. Plants in the majority of pathways were assumed to be located adjacent to harbor facilities. Exceptions included fermentation plants, biogas plants and pyrolysis plants, which were assumed to be located inland on account of traditional siting choices and local feedstock uptake possibilities.
Transport by both truck and ship was in liquefied form at medium pressure conditions (−30°C, 15 bar(g)) (Element Energy Limited 2018). Liquefaction was carried out using a propane-base refrigeration unit. The electricity demand for liquefaction was taken from (Decarre et al., 2010) and the sizing of the temporary storage tanks was carried out in accordance with the options presented in (Noh et al., 2019).
When the capture site was located inland, 40 t trucks transported the captured CO2 to a harbor facility for temporary storage in 4,500 t tanks in vapor form before conveyance to the storage site. The storage site was assumed to be an offshore gas field, 80% depleted, at a depth of 1,000 m, based on a survey of the data and the results in (Neele et al., 2017). Transport to the injection well was by ship, the transport distance was fixed at 1,200 km for all pathways, and the total time a ship was at sea for a complete turn-around was estimated to be 128 h. See the Supplementary Material for further information on CO2 transport assumption.
Two important factors that influence the economics of CCS are the capacity of the CO2-carrying ship and how injection is carried out at the storage destination. Ship sizes in the present study varied between 2000 t and 20,000 t. Reference (Element Energy Limited 2018) indicates that the dimensions and requirements for ships up to 10,000 t CO2 are within the range of standard fully pressurized LPG ships with shipping designs therefore being fully available. Given transport time constraints, it was assumed that 20,000 t ships will be available in 2030 and could be used if warranted by the CO2 transport load. The quantities of transported CO2 varied greatly among the pathways. On the one hand, the anaerobic digestion pathways (MeFmAd, MeSsAd) delivered only 2–4 kt/y of CO2. On the other hand, the bark gasification pathways offer 0.6–0.9 mt/y of CO2. It was assumed that plants generating enough CO2 to enable a ship to be utilized at 4,000 h/y or more had their own dedicated ships. Smaller plants, in contrast, shared the capital cost of the transport and storage infrastructure with same-sized plants.
At the storage site, the ship carrying the CO2 offloaded it into a 40,000 t/y platform moored adjacent to the storage well for temporary storage. Further data and information on CO2 transport design can be found in the Supplementary Material.
3.3.2 Bioenergy Carbon Capture and Utilization
As one of the two alternatives under the CCU option, chemical-grade methanol was catalytically synthesized from the captured CO2 and H2 from electrolysis and was upgraded to drop-in petrol and LPG through the methanol-to-gasoline process (MTG). Process data for the modelling of catalytic methanol synthesis and MTG was taken from (Nyári et al., 2020) and (Jafri et al., 2020), respectively. In the other alternative, bio-methane was produced from electrolysis H2 and captured CO2 by catalytic methanation, which was modelled using process data from a report by Haldor Topsoe A/S (Haldor Topsøe 2018). Hydrogen was assumed to be produced by polymer electrolyte membrane (PEM) electrolysis with a nominal system efficiency of 60% on LHV basis, based on the literature surveyed in (Buttler and Spliethoff 2018; Rego de Vasconcelos and Lavoie 2019). Further information on the process data for the CCU option can be found in the Supplementary Material.
3.4 Greenhouse Gas Footprint Assessment
GHG footprints from a well-to-wheel perspective were compiled in accordance with the standards specified in RED II (Noh et al., 2019). Following the RED II procedure, value-chain emissions were allocated to process streams equally on an energy basis up until the point where they diverged from each other. For pathways with multiple biofuel products, i.e. the majority of the pathways investigated in this study, emission allocation were separated at the point in the process where the product streams diverged. Hence, emissions from the electricity used in the CCU part of the process were only allocated to the CCU biofuel products and not to the base biofuel products. Likewise, emissions from the final distribution of different products were also differentiated. However, unlike in CCU, negative emissions from CCS were allocated, on an energy basis, to all biofuel products. Displaying the GHG footprint of every biofuel product in 14 different pathways under three different options was considered too complex for the objectives being studied. An average carbon footprint (on energy basis) of the biofuel products of each pathway is therefore used when presenting the results. See the Supplementary Material for a full breakdown of the GHG footprint evaluation.
The most important GHG emission factors are presented in Table 4. Emissions linked to land use change and carbon accumulation from improved agricultural management were omitted for all pathways where the feedstock is classified as a residue. For the only pathway not based on a feedstock classified as a residue, EtWgFr, emissions linked to indirect land use change and wheat cultivation were also omitted following Börjesson et al. (Börjesson et al., 2010) who assume the availability of un-used farmland in Sweden.
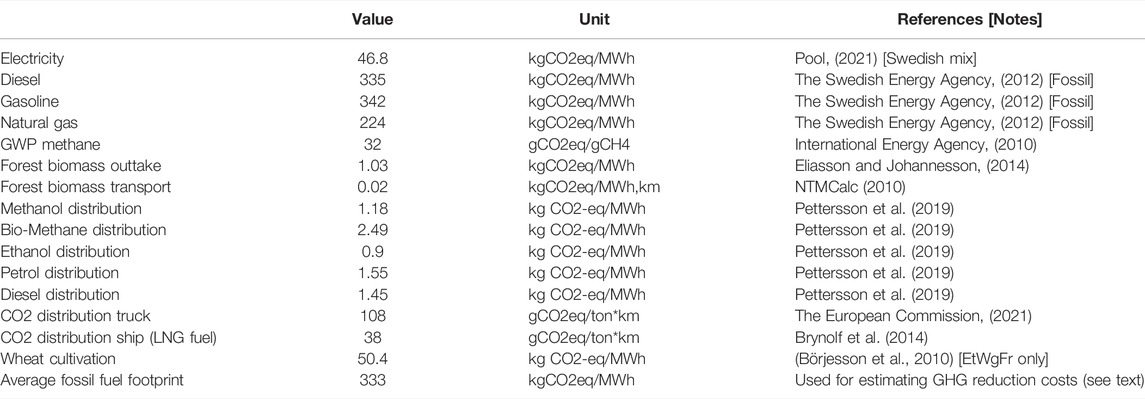
TABLE 4. Overview of the most important emission factors.
3.5 Economic Performance Assessment
With biofuel production with CCS/U currently in the pre-commercialization stage, the economic performance assessment was set in the year 2030. Potential revenues from the storage of CO2 were not included. The energy price and carbon balance scenario (ENPAC) tool was used to estimate the prices of selected energy carriers in the target year (Harvey and Axelsson 2010). All prices were denominated in EUR2020 using exchange rates of 0.88 EUR/USD, 0.095 EUR/SEK and 1.13 EUR/GBP. Throughputs for biofuels and other energy carriers were computed in MWLHV.
3.5.1 Capital Costs
The capital expenditure (CAPEX) estimates for some of the pathways relied on data from multiple studies with wide-ranging, and sometimes opaque, assumptions on scaling and granularity. CAPEX estimates should therefore be treated as indicative estimates, not absolute numbers. Principle references for capital cost estimates are provided in the Supplementary Material. Where some studies provided scaling factors, balance of plant, component costs, installed costs and indirect costs for each part of the production process, others only presented aggregate results, often as total capital investments, with wide confidence intervals. Some estimates were the result of comprehensive costing exercises, with involvement from technology developers. Others were put together using cost data from, e.g., Aspen Plus simulations.
Where detailed data on capital costs were missing completely in the reference publication, it was not possible to determine whether estimates for process equipment such as pumps, heat exchangers and compressors in secondary sources were in the correct scale. Investment costs for pathways lacking the necessary costing information were scaled with total biofuel production following eq. 1 (Remer and Chai 1990):
where C is the cost of the process or specific unit operation, C0 the base cost, P0 the base scale and P the scale. SF is the scaling factor, which, unless otherwise specified, was set to 0.67.
To account for inflation and price changes over time, the chemical engineering plant cost index (CEPCI) was applied to recalculate all capital cost estimates to 2020 monetary value (Chemical Engineering 2021). The CEPCI equation is presented in Eq. 2.
Where C2020 is the cost in 2020, Cx the base cost at the given year x, and CEPCI the cost index at year 2020 and year x, respectively.
3.5.2 Operational Costs
Operational expenditure (OPEX) was separated into OPEXMaterials and Energy and OPEXO&M, with the former covering the cost of energy and material, and the latter covering the cost of personnel and maintenance. In keeping with established practice, OPEXO&M costs were expressed as a fraction of the capital cost, with the fraction being set at 5% for the CO2 intermediate storage tanks and the CO2 offshore platform units (Element Energy Limited 2018) and at 3% for all other cost components.
To calculate OPEXMaterials and Energy, prices for biomass and other energy carriers were modelled using the Energy Price and Carbon Balance Scenarios (ENPAC) tool, first developed by (Harvey and Axelsson 2010). ENPAC handles the uncertainty in future energy market conditions by generating scenarios consisting of sets of future energy prices based on user-defined input and key assumptions. The resulting energy market scenarios consist of consistent sets of data that capture expected interrelations between different parameters given certain scenario conditions. The energy prices calculated by ENPAC are presented in Table 5, which also provides a selection of material and energy carrier prices that could not be estimated based on ENPAC data, and therefore were taken from other sources. A fuller list of relevant ENPAC inputs, assumptions and outputs is provided in the Supplementary Material.

TABLE 5. Prices for energy and material streams.
The inputs to the ENPAC tool included fuel commodity prices (crude oil, coal and natural gas) and CO2 emission charges representative for Northern Europe. The input data for the present study was based on the Sustainable Development (SD) scenario from the IEA’s World Energy Outlook (WEO) 2017 (International Energy Agency 2017). Input data to ENPAC also included assumptions such as which electricity technologies were available for new grid capacity additions, subsidies for production of renewable electricity and biofuels and whether biomass was to be considered a limited resource. These assumptions followed previous work (Pettersson et al., 2020). Using these inputs, ENPAC calculated future prices for large-volume industrial consumers for various energy carriers. In particular, the highest Willingness-To-Pay (WTP) for biomass by a potential marginal user determined the price of low-grade forest biomass. Marginal users were estimated to be pellets producers in the ENPAC SD scenario. The pellets were assumed to replace coal in a condensing power plant, and consequently, the price of biomass was related directly to the price of coal, including CO2 emission charges.
3.6 Performance Indicators
The consequences of adding a CCS or CCU option to biofuel pathways were examined with the help of performance indicators that captured competing trade-offs, such as those between biogenic carbon utilization, GHG emission reductions, and economic performance.
Feedstock carbon constitutes the predominant source of biogenic carbon in all pathways. Significant quantities of non-feedstock biomass inputs were, however, present in several pathways, with three principal applications: chemical, feed substrate, and process heating. The first two applications, exemplified by the use of RME for scrubbing syngas in bio-methane from bark (MeBaGm), and the use of molasses as a feed substrate in the fermentation pathways (EtSdFr, EtWgFr), played a marginal role in the carbon balances. The predominant application was process heating, particularly for pathways without residual flows suitable for combustion.
Carbon utilization was studied using two different efficiency measures hCarbon-Biofuel+CCS was used as the primary measure of biogenic carbon efficiency. Also referred to as the carbon utilization efficiency, it was defined in eq. 3 as the share of feedstock carbon that ends up in either the biofuel products, or in permanent CO2 storage. Note that the carbon that ends up in biofuels, which were assumed to replace fossil equivalents and thereby contribute to reduction in GHG emissions, follows a different path than the carbon effectively removed from the carbon cycle for millennia through CCS.
where CBiofuel Product(S) is the carbon in the biofuel products, CPermanent Storage the carbon in the CO2 captured for permanent storage, and CFeedstock the carbon in the biomass feedstock(s).
ηCarbon-System was defined in eq. 4 as the share of a pathway’s total biogenic carbon input that ends up in biofuel product(s), tradable by-product(s) and permanent CO2 storage. Also referred to as the carbon system efficiency, it captured the contributions of both other biomass inputs and useful by-products.
where CTradable by-products is the carbon in commercially traded by-products and COther Biomass Inputs is the carbon in all biomass inputs not classified as feedstocks.
GHG footprints were calculated according to RED II by allocating GHG emissions based on the energy content of the products (MJ Biofuel Products). The emission factors taken into consideration are presented in Eq. 5 (see also section 3.4):
Where E denotes the total value-chain emissions from the production and use of the biofuel, eec emissions from extraction and cultivation of raw materials, ep emissions from processing the feedstock(s), etd transport and distribution emissions, eCCS emissions savings from CO2 capture and geological storage.
The economics of biofuel production with and without CCS/U were evaluated with levelized cost of production (LCOP). Providing an indication of the minimum biofuel selling price, LCOP was calculated by combining annual OPEX and annualized CAPEX with annual biofuel production, as defined in Eq. 6:
where CRF is the capital recovery factor, CAPEXTotal the total capital investment, OPEXMaterials and Energy the annual operational expenditure on energy and material streams, OPEXO&M the annual operational expenditure on operational personnel and maintenance, RevenueBy-products the annual revenue from by-product sales, P the biofuel production capacity in MWth with all biofuel products aggregated together, and h the annual plant operating hours, set at 8,000 for all pathways under all options.
CRF is calculated according to eq. 7:
where i is the real discount rate and n the economic lifetime of the investment. i and n are set to 11% and 20 years, respectively.
The costs for separation, transporting and storing CO2 (CO2 sequestration costs) under the CCS option were included in the LCOP but potential revenues from CO2 sequestration were not considered. Considering the policy discussion around the support levels CCS may require, CO2 sequestration costs are taken up separately in the results.
GHG Reduction Cost was used in conjunction with Carbon Utilization Efficiency to identify pathways that did not necessarily have the best biofuel economics but that still offered good possibilities for reducing GHG emissions at low cost. GHG reduction cost is defined in eq. 8:
Where Annual Product CostBiofuel is the combined annual biofuel CAPEX and OPEX, Annual Production CostFossil the reference fossil equivalent, calculated by multiplying the annual biofuel production capacity with the average of fossil gasoline and diesel gate prices for the year 2030 in the ENPAC SD scenario (Table 5), GHG FootprintBiofuel the biofuel GHG footprint calculated according to Eq. 5 and GHG FootprintFossil the reference fossil fuel GHG footprint (92.5 gCO2 eq./MJ). The relatively small difference in the distribution costs of biofuels and fossil fuels was not considered when calculating the Annual Production CostFossil.
4 Results and Discussion
Biogenic carbon flows under the base, CCS and CCU options are presented in section 4.1. The impact of CCS and CCU on biofuel production, carbon utilization efficiency and GHG performance is presented in section 4.2. LCOPs and GHG footprints are presented in section 4.3. GHG reduction costs are discussed in section 4.4. All figures in this section use the same colors for each pathway. Empty and filled markers are used to represent emerging and commercial pathways, respectively.
4.1 Biogenic Carbon Flows
The biogenic carbon flows for the base, CCS and CCU options are summarized in Table 6 and Table 7. See the Supplementary Material for complete carbon and energy balances.
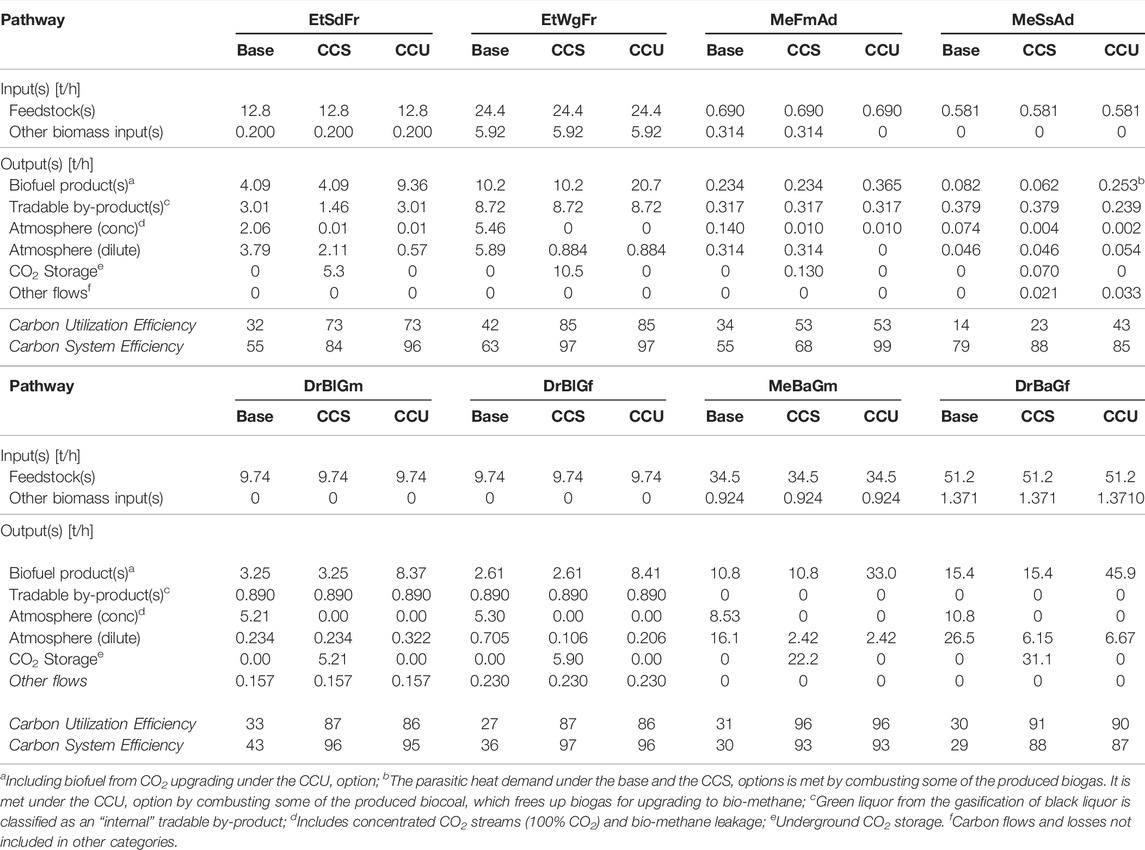
TABLE 6. Biogenic carbon flows for fermentation (EtSdFr, EtWgFr), anaerobic digestion (MeFmAd and MeSsAd) and gasification pathways (DrBlGm, DrBlGf, MeBaGm and DrBaGf). See Table 1 for explanation of pathway abbreviations.
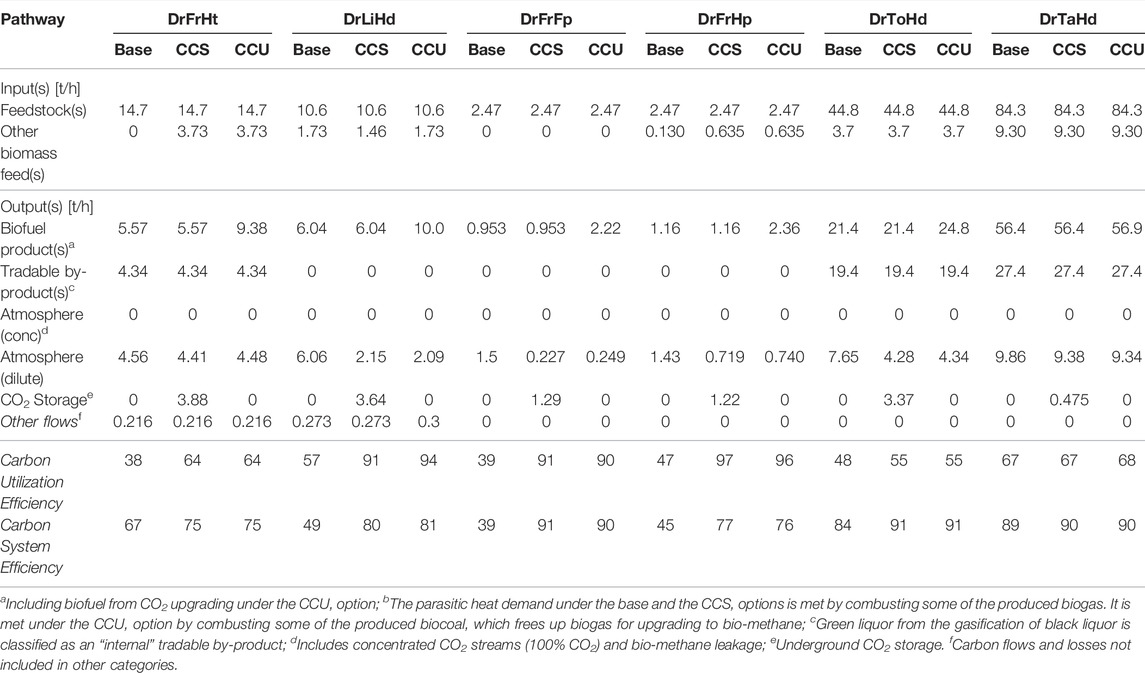
TABLE 7. Biogenic carbon flows for hydrotreatment pathways: DrFrHt, DrLiHd, DrFrFp, DrFrHp, DrToHd and DrTaHd. See Table 1 for explanation of pathway abbreviations.
The beneficial impact of CCS/U on carbon utilization is well-illustrated by the case of ethanol from wheat grain (EtWgFr). In an efficient but relatively energy-intensive production process, the bulk of the carbon in wheat grain ends up in ethanol and dried distillers’ grains with solubles, sold as animal feed. The remainder is released in a concentrated CO2 stream. Energy demand is met by importing lower-grade biomass equivalent to 24% of the total biogenic carbon input. Carbon utilization can therefore be improved in two ways: by replacing biomass with electricity as the heat source (not considered), or by capturing the concentrated stream of CO2 generated during fermentation. Accordingly, CCS/U can transform EtWgFr from a pathway with relatively modest biogenic carbon utilization into one where 97% of the process biogenic carbon is either permanently stored or ends up in biofuel products.
In addition to producing biofuels, all but three hydrotreatment pathways (DrLiHd, DrFrFp, DrFrHp) also produce tradeable by-products. In carbon terms, some by-product flows are very significant. As much as 43% of the feedstock carbon in drop-in biofuels from crude tall oil (DrToHd) and 32% of the same in drop-in biofuels from cattle by-products (DrTaHd) ends up in, respectively, tall oil pitch and meat and bone meal. With the majority of the remaining feedstock carbon making its way into the biofuel products, CCS/U can only deliver modest modal shifts. With the exception of green liquor, which is returned to the host pulp mill in DrBlGm and DrBlGf, gasification pathways do not generate notable quantities of by-products.
Dilute CO2 streams in the form of flue gas from either combustion applications or steam-methane reforming are featured in all pathways and dominate several balances. In drop-in biofuels from lignin (DrLiHd), for example, 57% of the feedstock carbon leaves in dilute CO2 streams under the base option. The corresponding figures for drop-in FT biofuels from bark (DrBaGf), bio-methane from bark (MeBaGm) and bio-methane from food waste and manure (MeFmAd) are 52, 47 and 46%, respectively. When taken in aggregate, CO2 streams exceed 50% of the feedstock carbon input to MeFmAd, DrLiHd, DrFrFp, DrBlGm and DrBlGf, and 70% of the same to MeBaGm and DrBaGf. Each of these pathways could therefore be particularly suited to CCS/U.
The carbon utilization efficiency varies from 14 to 67% under the base option with a majority of pathways in the 30–40% interval. Efficiencies increase to 23–97% with CCS/U. Bio-methane from sewage sludge (MeSsAd) ends up with the lowest efficiency under all options, followed closely by bio-methane from food waste and manure (MeFmAd) under the CCS and CCU options. 65% of the feedstock carbon in MeSsAd and 46% of the same in MeFmAd ends up in the digestate, which is assumed to be used as a fertilizer except under the CCU option for MeSsAd, where it is carbonized to biocoal. Some of this biocoal is used to replace the bio-methane combusted for the generation of process heat under the base and CCS options. The resulting CO2 is captured and upgraded, leading to a 20 percentage point increase in the carbon utilization efficiency. An interesting feature that applies to both MeFmAd and MeSsAd but is not considered in the present study is that some of the carbon in the digestate stream can enter the soil carbon reservoir, which can be viewed as a form of permanent carbon storage. This can happen both when the digestate is buried in carbonized form and when it is used as a fertilizer.
An alternative perspective on carbon utilization that considers the contribution of other biomass inputs and tradable by-product is provided by the carbon system efficiency, which varies between 29 and 89% under the base option. Gasification pathways register the lowest efficiencies (29–43%) due to a combination of significant CO2 streams and small-to-zero tradable by-product flows. However, these attributes also make them particularly suited to CO2 capture, which is evidenced by system efficiencies of 87–97% under the CCS/U options. With high system efficiencies under the base option but with modest relative increases under CCS/U on account of a lack of appropriate streams, the converse applies to drop-in biofuels from crude tall oil (DrToHd) and meat processing by-products (DrTaHd).
4.2 Negative Emission Biofuels and Double Yields
Figure 4 shows how carbon utilization efficiencies increase to 96–97% and GHG footprints decrease to levels approaching −150 g CO2 eq./MJ when the CCS option is added to some biofuel pathways. What is also evident is that not all pathways can deliver “negative” emissions and that there are large differences between them, especially in terms of their GHG footprints.
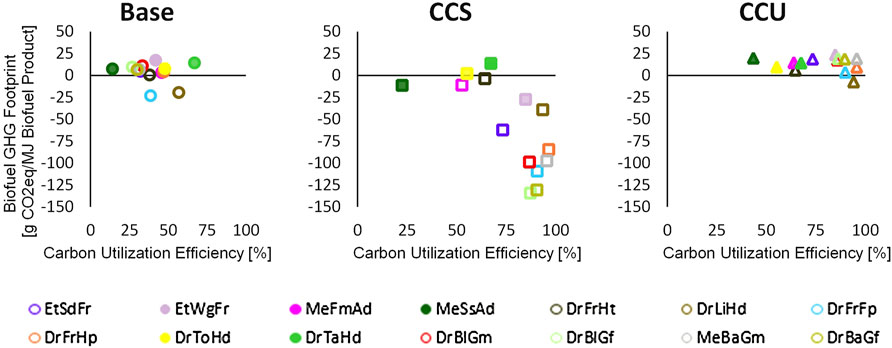
FIGURE 4. Carbon utilization efficiencies and greenhouse gas footprints under the base (circles), carbon capture and storage (CCS) (squares) and carbon capture and utilization (CCU) (triangles) options. Empty markers represent emerging pathways and filled markers represent commercial pathways. See the text for an explanation for why some of the pathways offer negative emissions under the CCU option.
One pathway that is widely deployed commercially but that does not deliver negative emissions is DrTaHd, as feedstock carbon almost wholly ends up in either the biofuel product or the tradable by-product, thus limiting the flow of carbon that can be stored through CCS. In comparison, the emerging gasification pathways, with their CO2 outflows, particularly those in concentrated streams that can be captured at relatively low energy cost, are better able to deliver negative emissions.
Compared to the CCS option, GHG footprints under the CCU option are much less dispersed. An atypical example is that of drop-in biofuels from lignin (DrLiHd), which is alone in being able to deliver (relatively modest) negative emissions under the CCU option. During hydrotreatment at the crude oil refinery, 57% of the biogenic carbon ends up in energy gases, which substitute for natural gas and deliver GHG savings, while the CO2 generated during their combustion is captured through the implementation of post-combustion capture.
Naturally, the CCS and CCU options both offer similar carbon utilization efficiencies for the same processes; essentially, CO2 is either stored or used for biofuel production without noteworthy carbon loss, although there are minor differences regarding which CO2 streams are utilized under what option. However, owing to the CO2 emissions associated with electricity use, pathways with large negative carbon footprints in the CCS case increase their total carbon dioxide emissions with a number corresponding to the electricity required for hydrogen production through electrolysis when considering CCU. This implies that, although there are slight differences in hydrogen consumption between the two CCU technologies–catalytic methanation and MTG–the electricity required to convert one unit of CO2 to biofuel product is roughly the same. The main difference is rather the share of feedstock carbon that ends up in the biofuel product or in CO2.
Figure 5 displays actual and relative increases in biofuel production under the CCU option. With the exception of drop-in biofuels from meat processing by-products (DrTaHd) and from tall oil (DrToHd), all pathways can increase biofuel production by more than 50%. Several pathways with medium-to-large biofuel capacities under the base option can more than double their biofuel yields. The CCU option can therefore significantly enhance biomass resource utilization in the transport sector in the short-to-medium term.
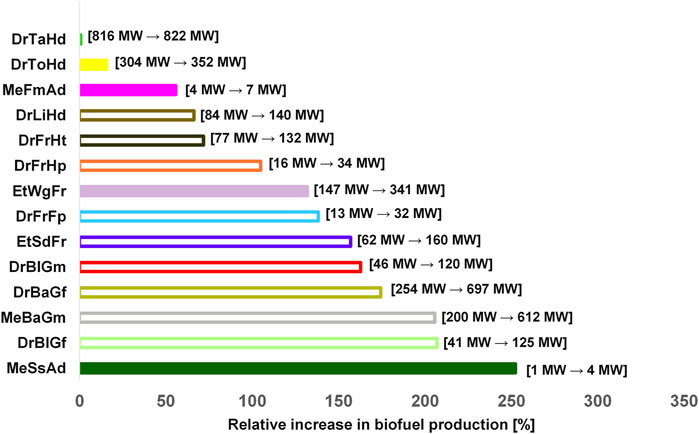
FIGURE 5. Relative increase in biofuel production by rank order under the carbon capture and utilization (CCU) option. Absolute numbers are given in bold text. Empty bars represent emerging pathways and filled bars represent commercial pathways.
4.3 Environmental and Economic Trade-offs for BECCS and BECCU
Figure 6 (top) shows the LCOP and GHG footprints for the commercial pathways EtWgFr, MeFmAd, MeSsAd, DrToHd, DrTaHd. Note that potential revenues from CO2 sequestration are not considered when calculating LCOPs under the CCS option.
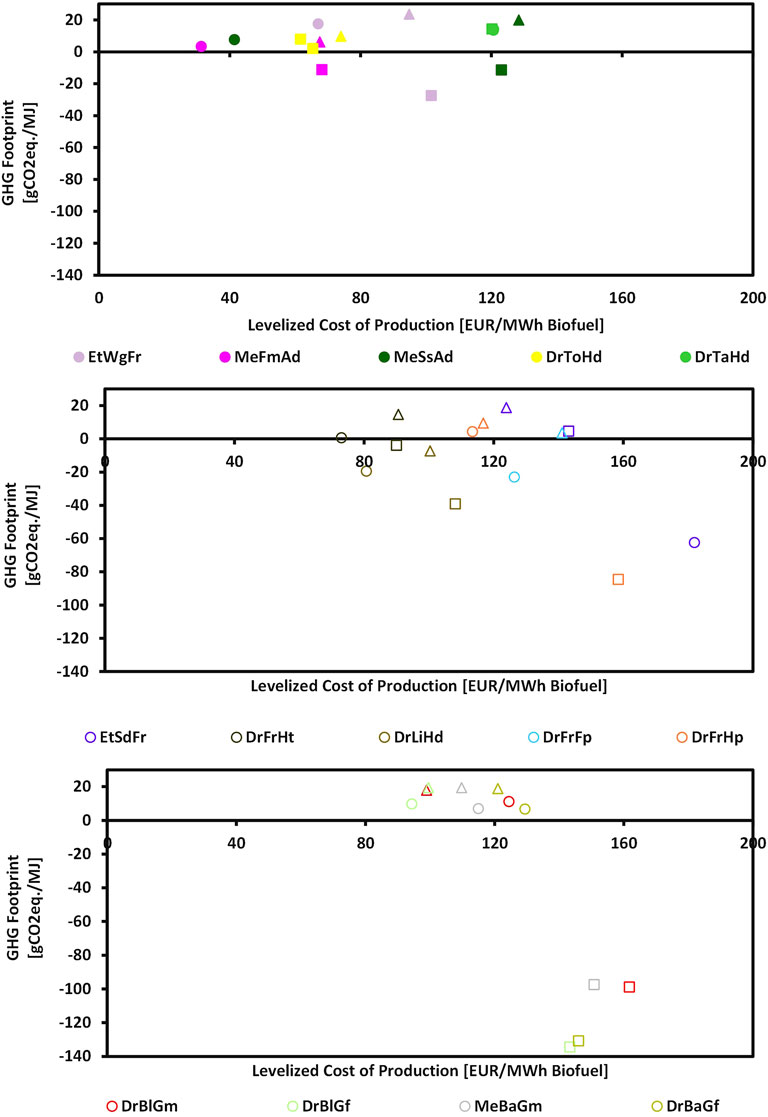
FIGURE 6. GHG Footprints (y-axis) and levelized costs of biofuel production (x-axis) for the commercial biofuel pathways: EtWgFr, MeFmAd, MeSsAd, DrToHd and DrTaHd (top) and the emerging biofuel pathways: EtSdFr, DrFrHt, DrLiHd, DrFrFp and DrFrHp (middle), and DrBlGm, DrBlGf, MeBaGm and DrBaGf (bottom), under the base (circle), carbon capture and storage (CCS) (square), and carbon capture and utilization (CCU) (triangle) options. Empty markers represent emerging pathways and filled markers represent commercial pathways. See Table 1 for explanation of pathway abbreviations and the Supplementary Material for a tabular presentation of the results.
MeFmAd offers the lowest LCOP (31 EUR/MWh) under the base option, followed by MeSsAd (42 EUR/MWh). With GHG footprints of –11 gCO2eq./MJ, both pathways can deliver “negative emission” biofuels under the CCS option. MeFmAd also offers the lowest LCOP (68 EUR/MWh) and the smallest GHG footprint (6 g CO2eq./MJ) among the commercial pathways under the CCU option. As noted previously, the feedstocks for MeFmAd and MeSsAd are assumed to be available at no cost, which is clearly an optimistic assumption, particularly for MeSsAd. Among the commercial pathways, EtWgFr has the smallest biofuel GHG footprint (−28 gCO2eq./MJ) under the CCS option, which is explained by the relatively larger share of CO2 generated. However, EtWgFr performs comparatively poorly under the CCU option, with the largest GHG footprint of all commercial pathways and a relatively high LCOP. Comparing EtWgFr to, e.g. MeFmAd that has a lower potential for CCS but offers low cost biofuels under the CCU option indicates that the suitability of a pathway for CCS does not necessarily correlate with its suitability for CCU.
With LCOPs and GHG footprints that are very similar under all three options, the commercial pathway DrTaHd, which uses tallow from the meat industry as feedstock, is not able to deliver biofuels with a negative GHG footprint. It also has the largest GHG footprint of all pathways under the CCS option. The reason DrTaHd is less suitable for CCS is explained by the fact that less than 1% of the feedstock carbon is converted to CO2. This does not mean that CCS is necessarily a bad option for DrTaHd. Given the size of the typical plant, there are still relatively large levels of CO2 that can be sequestered. However, CCS will not have any noticeable impact on the GHG footprint of the products. DrTaHd is currently one of the most important pathways for the production of drop-in biofuels globally. Although not evaluated in the present study, carbon utilization can be further improved if the biomass used for process heat at the meat rendering plants is replaced with electricity or if post-combustion capture is implemented. Given the decentralized nature of rendering plants, both alternatives present challenges and offer an interesting avenue for future study.
The second of the two commercial hydrotreatment-based pathways, DrToHd, uses crude tall oil from the pulp industry as feedstock and is also unable to deliver negative emission biofuels. With the second lowest LCOPs among the commercial pathways under the CCU option, what stands out more with DrToHd is the good economic performance. DrToHd and DrTaHd share many similarities, but it is worth noting that their LCOPs differ by a factor of ∼2 under the base option. The CAPEX estimates and the material and energy balances for DrToHd were compiled in part from different sources. Since high quality data on the industrial hydrotreatment of biomass fractions is typically not provided in the open literature due to reasons of commercial sensitivity, the product yields and energy balance for DrTaHd were on a typical plant for the hydrotreatment of oleochemical residues. Results are therefore subject to a high degree of uncertainty and should be interpreted with care.
Figure 6 (middle and bottom) show the LCOPs and GHG footprints for the emerging fermentation-based pathway EtSdFr, the emerging hydrotreatment-based pathways EtSdFr, DrFrHt, DrLiHd, DrFrFp and DrFrHp, and the emerging gasification-based DrBlGm, DrBlGf, MeBaGm and DrBaGf pathways. Between the two fermentation-based pathways, the emerging EtSdFr offers better GHG footprints but worse LCOPs than the commercial EtWgFr under all CO2 capture options. EtSdFr is also one of few pathways where the CCU option has a lower LCOP than the base option. This suggests that pathways with relatively low biofuel yields may be able to use the CCU option to lower their LCOPs, subject to acceptable electricity prices.
The hydrothermal liquefaction pathway DrFrHt performs quite well with regards to the GHG footprint under the base option, although the negative emissions offered under the CCS option are relatively modest. However, the quantity of CO2 that can be sequestered is relatively large; therefore, the LCOP remains low. The lignin-based DrLiHd and the forest residue-based DrFrFp, are alone in being able to offer biofuels with negative emissions under the base option (−19 and −23 gCO2eq./MJ, respectively). As mentioned previously, DrLiHd is also the only pathway that offers negative emissions under the CCU option. Both pathways generate significant quantities of energy gases during hydrotreatment, which contribute to the reduction of natural gas use at the refineries with which they are integrated. Consequently, both DrLiHd (−39 gCO2eq./MJ) and DrFrFp (−109 gCO2eq./MJ) can potentially deliver large negative emissions under the CCS option.
From a combined cost and climate perspective, with the second lowest LCOP (108 EUR/MWh) among the emerging pathways, and with significant potential for negative emissions (−39 gCO2eq./MJ), DrLiHd appears to be a favorable pathway for the addition of CCS. In comparison, DrFrFp has a significantly higher LCOP (201 EUR/MWh) but achieves negative emissions of −109 gCO2 eq./MJ. This suggests that both pathways might be suitable for CCS, but their relative attractiveness could be decided by the size of the potential revenue gain from storing biogenic CO2. The lignin-based pathway also offers a significantly lower-cost CCU option (100 EUR/MWh) than the forest residue-based pathway (141 EUR/MWh). The diverging fortunes of DrLiHd and DrFrFp thus appear to indicate, again, that pathway suitability for CCS does not have to correlate with suitability for CCU.
The hydropyrolysis-based DrFrHp does not stand out in terms of cost or GHG footprint under the base and the CCU options. However, the quantity of CO2 sequestered is large in relation to the total biofuel production and the total energy input, which means that the CCS option can offer relatively large negative emissions, although at a relatively high LCOP (158 EUR/MWh) due to small plant size.
Led by DrBlGf with a GHG footprint of -134 gCO2eq./MJ, all the gasification pathways offer negative emissions of ∼100 gCO2eq./MJ or less under the CCS option. Among other pathways, only DrFrFp provides negative emissions of similar magnitude. However, the large quantity of CO2 that can be sequestered also entails that the electricity demand under the CCU option is high relative to biofuel production under the base option, resulting in relatively large GHG footprints. Based on the same bark gasification concept but targeting different biofuel products, MeBaGm and DrBaGf present interesting results. The bio-methane focused MeBaGm has lower LCOPs than the drop-in biofuel producing DrBaGf under the base (115 EUR/MWh vs. 129 EUR/MWh) and the CCU (110 EUR/MWh vs. 121 EUR/MWh) options. A comparison of the relative change from the base to the CCU option for the two pathways also suggests that upgrading the captured CO2 to drop-in biofuels with the FT process is more expensive than opting for additional methane production with a Sabatier reactor. At the same time, DrBaGf is able to deliver significantly greater negative emissions than MeBaGm (−131 gCO2eq./MJ vs. −97 gCO2eq./MJ) under the CCS option at a comparable LCOP, which suggests that it could be a suitable candidate for CO2 capture and sequestration.
In summary, from a cost perspective alone, the two commercial anaerobic digestion pathways (MeFmAd and MeSsAd) offer the lowest LCOPs under the base option, followed by the hydrotreatment-based DrToHd and the fermentation-based EtWgFr, both of which are also in commercial operation. With the ability to deliver negative emission biofuels at a relatively moderate LCOP, the lignin hydrotreatment-based DrLiHd is an interesting alternative under the CCU option, while the hydrothermal liquefaction-based DrFrHt has the lowest LCOP under the CCS option.
Turning to the climate perspective, the commercial pathways generally offer no-to-modest negative emissions. The emerging gasification and hydrotreatment-based pathways have the largest negative emission potentials, led by drop-in FT biofuels from black liquor (DrBlGf). Notably, drop-in biofuels from lignin (DrLiHd) is the only pathway that achieves negative emissions under all three CO2 capture options.
An examination of costs from the perspective of CO2 sequestration potential under the CCS option shows that the cost of storing 1 ton of CO2 is 43–102 EUR for the gasification pathways, 115–125 EUR for the ethanol pathways, 334–363 EUR for the anaerobic digestion pathways, 92–209 EUR for the emerging hydrotreatment pathways, and 92–210 EUR for the commercial hydrotreatment pathways. See the Supplementary Material for further information. While the underlying cost assumptions differ, these numbers are comparable to the costs of post-combustion CCS (∼65–130 EUR/tCO2) for large biogenic emission point sources in Sweden in e.g. (Johnsson et al., 2020; Statens Offentliga Utredningar 2020).
Realizing the potential of BECCS requires new policy instruments. The introduction of a new policy instrument for BECCS in 2022 has been suggested in Sweden (Finansdepartementet and Miljödepartementet 2021). The possibility of including BECCS in the EU Emissions Trading System is being considered. However, there are no concrete suggestions for the near future. Implementation is challenging (Zetterberg et al., 2021) and is unlikely to be achieved before 2030. A goal for the European Union is to be climate neutral by 2050 and BECCS could be important for reaching the goal. The current cost level for CO2 emission allowances (∼50–60 EUR/tCO2) is too low to motivate investments in BECCS. However, with emission caps set to decrease in the coming years, the cost of emission allowances–or the value of corresponding credits for negative emissions–will increase, which could make investment in BECCS profitable in the future.
4.4 Options for Reducing Greenhouse Gas Emissions and Improving Carbon Utilization
Figure 7 displays the cost of reducing 1 kgCO2eq. of GHG emissions relative to a fossil reference as defined in eq. 8.
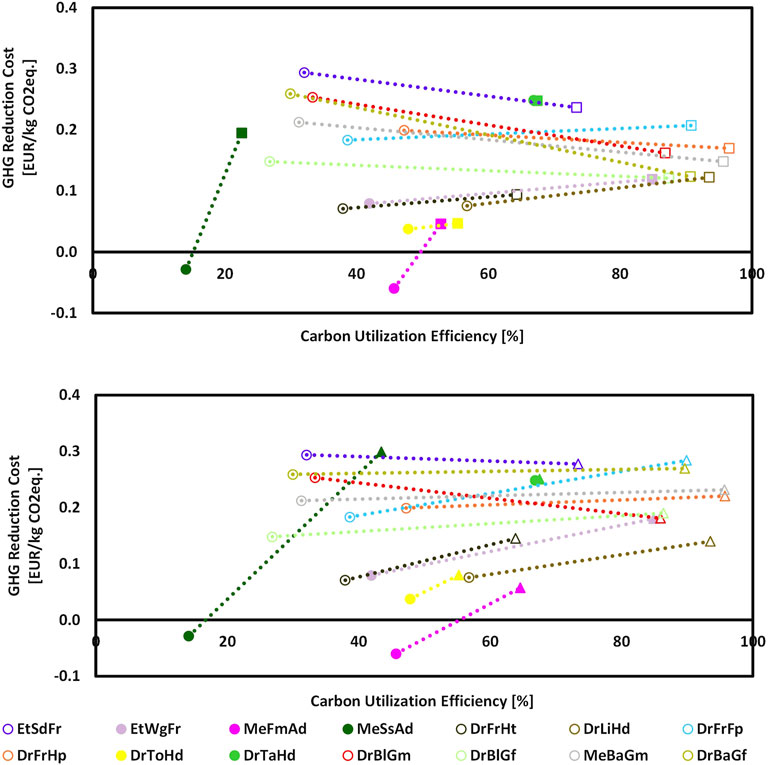
FIGURE 7. Cost of reducing 1 kg CO2eq of greenhouse gas emissions with each pathway under the base (circle), carbon capture and storage (CCS) (square, top), and carbon capture and utilization (CCU) (triangle, bottom) options. Empty markers represent emerging pathways and filled markers represent commercial pathways.
The top figure relates the base option (circle) to the CCS option (square) and the bottom figure relates the base option to the CCU option (triangle). GHG reduction costs range from −0.060 EUR/kgCO2 for the anaerobic digestion-based MeFmAd under the base option, to 0.30 EUR/kgCO2 for the anaerobic digestion-based MeSsAd under the CCU option.
Commercial pathways with the lowest LCOPs (MeFmAd, MeSsAd, DrToHd) also have the lowest GHG reduction costs under the base option. Low costs reflect, naturally, their commercialization status, but these pathways have lower carbon utilization efficiencies than their best performing emerging counterparts. A similar trend is observed for the CCS option, where MeFmAd offers the lowest GHG reduction cost, but at a carbon utilization efficiency that is significantly lower (53%) than the corresponding values for the emerging gasification pathways (87–96%).
Relative to the base option, the emerging gasification pathways (DrBlGm, DrBlGf, MeBaGm, DrBaGf) offer some of the largest relative decreases (22–109%) of GHG reduction costs under the CCS option. Furthermore, together with the lignin hydrotreatment (DrLiHd) and forest residue hydrothermal liquefaction (DrFrHt) pathways (0.094–0.12 EUR/kgCO2), the black liquor (DrBlGf) and bark (DrBaGf) FT pathways (0.12 EUR/kgCO2) have the lowest GHG reduction costs among the emerging pathways. This suggests that the best performing gasification and forest residue-based hydrotreatment pathways might be among the most suitable options for combining biofuel production with negative GHG emissions and high carbon utilization through CCS. These GHG reduction costs are, however, higher than those offered by the best commercial pathways, which further suggests that increasing the production of carbon efficient biofuels that deliver GHG reductions at low cost may require initial policy support for the most promising emerging biofuel pathways. These policy support initiatives could take the form of a government-administered reverse auction in a carbon capture and storage program, which is currently being explored in Sweden. Another alternative would be incorporate negative emissions within emission reduction quota frameworks.
Generating proportionally very small quantities of CO2, the tallow hydrotreatment-based DrTaHd is an important commercial pathway that does not offer low GHG reduction costs and is therefore less suitable for reducing climate impact cost-efficiently. As noted in the previous section, the tall oil hydrotreatment-based DrToHd has among the lowest LCOPs of all pathways. Despite a relatively modest GHG footprint and poor carbon utilization efficiency, it is thus able to offer low GHG reduction costs under the base and the CCS/U options. Whether DrToHd is using its feedstock carbon efficiently is, however, a matter of perspective, since the share of feedstock carbon that ends up in non-fuel by-products such as tall oil pitch is relatively high.
Pathways that produce small amounts of biofuel are both sensitive to, and relatively disadvantaged by, the economies-of-scale for CO2 transport and storage infrastructure, illustrated by the case of the anaerobic digestion-based MeFmAd, the pathway with the lowest GHG reduction cost under all options. According to the main assumption for how CO2 transport costs are allocated for smaller pathways, a MeFmAd plant takes on approximately 6% of the CAPEX of the ship carrying its captured CO2 to the storage site. This is the equivalent of the cost being shared between 18 MeFmAd plants. If, on the other hand, each plant was to have a dedicated ship, the GHG reduction cost would increase by a factor of ∼3. There are no corresponding increases for gasification pathways since they each have their own ship on account of their large size under the study assumptions, suggesting greater robustness with respect to cost assumptions. Adding a CCS option to small MeFmAd plants thus appears to be a very cost-effective means of reducing GHG emissions, subject, however, to collaborations between multiple CO2 generating sources that do not currently exist.
Transport economies-of-scale are also part of the explanation for why, relative to the base option, GHG emission reduction costs for some of the gasification pathways are lower under the CCS option and higher under the CCU option. The change in GHG reduction costs is typically smaller when moving from the base option to the CCU option. In general, the difference between CCS and CCU is the cost of the CO2-to-product upgrading and the cost of CO2 transportation and injection; CO2 separation is common to both options. Electrolysis costs are a significant component in the cost of CO2 upgrading and are impacted by the economy-of-scale effect to a lesser extent than the cost of CO2 transportation. This implies that for the relatively large gasification pathways, with lower specific costs of CO2 transportation, the difference between CCS and CCU can become significant.
A certain discrepancy exists between pathways that offer the lowest LCOPs and those that offer the most promising combinations of high carbon utilization efficiencies and low GHG reduction costs. There is thus a risk that the priorities of biofuel investors, principally interested in low production costs, and the policymakers, primarily concerned with maximizing climate and carbon performance, might not fully align.
Figure 8 shows the cost of GHG reduction with and without dilute CO2 capture for pathways that also generate a concentrated stream under the CCS and CCU options. Capturing dilute CO2 in addition to concentrated CO2 further reduces the cost of capture significantly under the CCS option for three of the four pathways, indicating that the storage of diluted CO2 streams can also be of value. However, what is also evident is that, for all pathways except EtSdFr, the slope of the curve evens out with the inclusion of the dilute CO2 stream. Thereby, the marginal economic gain of storing the CO2 in the dilute streams is somewhat smaller, which can be attributed to the additional cost of CO2 separation. The opposite, however, is true for the EtSdFr pathway, where capturing the diluted CO2 stream delivers a slightly steeper decrease in the GHG reduction cost. With transport and storage costs dominating the GHG reduction cost under the CCS option, and with some of these costs being sensitive to economy-of-scale effects, it is possible that the significantly greater amounts of CO2 on offer in the dilute stream leads to a lower specific cost of transport and storage.
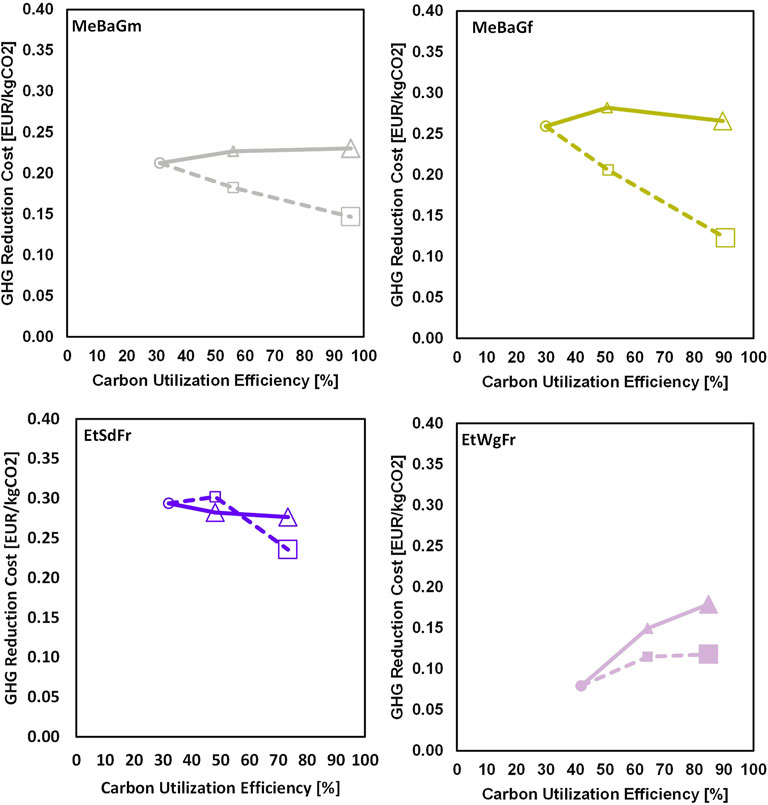
FIGURE 8. GHG reduction cost with and without the capture of dilute CO2 streams for MeBaGm (bio-methane from bark), DrBaGf (drop-in Fischer Tropsch biofuels from bark), EtSdFr (ethanol from sawdust) and EtWgFr (ethanol from wheat) under the CCS (dashed line, square) and CCU (solid line, triangle) options. Base option (leftmost marker on each plot) is marked by circles. Moving right, smaller markers show results when only the concentrated CO2 streams are captured, and larger markers show results when CO2 is captured from both concentrated and dilute streams. Emerging and commercial pathways are represented by empty and filled markers, respectively. See Table 1 for explanation of pathway abbreviations.
More generally, for pathways where the CO2 quantities in dilute streams exceed the CO2 in concentrated streams, there appears to exist a point beyond which the economies-of-scale driven reduction in the specific cost of transport and storage offsets the volume-driven increase in the CO2 separation cost.
A similar, economy-of-scale-driven effect is seen under the CCU option, in that the change in GHG reduction cost evens out when opting to utilize the diluted CO2 stream; in one pathway (DrBaGf) it even decreases. The reason is that there are no additional costs of using more CO2 besides separating the CO2 and it becomes a trade-off between decreased specific cost of the CCU upgrading option (MTG or methanation) and increased cost of CO2 separation. These results clearly indicate that the former has a larger impact on the GHG reduction cost.
Finally, it is worth mentioning that the numerical results presented in this study are best interpreted as exploratory and indicative. The methodological approach does not as a matter of course attempt to account for unevenness and heterogeneity in the underlying process and cost data. The focus of the study is on the identification of recurring trends and key differences between the different CO2 capture options rather than on completeness and granularity. Hence, the techno-economic analysis does not consider cost items that are either relatively minor or are likely to be the same for all options, such as, wastewater and catalysts. The development of a costing approach for scoping techno-economic analyses of developing technologies that can consistently tackle unevenness in underlying data remains a challenge and might be an interesting avenue for future work.
5 Conclusion
This work studied the GHG emission and economic benefits of adding a CCS or CCU option to fourteen different pathways for road biofuel production. Carbon and energy balance models were utilized to calculate carbon utilization efficiencies and GHG footprints, to estimate biofuel production costs, and to identify pathways that can achieve GHG reductions at low costs.
Overall, adding a CCS or CCU option to road biofuel production pathways can offer large potential gains. Carbon utilization efficiencies can be doubled while keeping GHG reduction costs low. Several pathways reach carbon utilization efficiencies above 90% with both CCS and CCU, and for the most promising pathways this can be done without incurring major economic penalties.
The best commercial pathways offer lower biofuel production and GHG reduction costs than the best emerging pathways under both the CCS (68 EUR/MWh, 0.046–0.047 EUR/kgCO2eq. vs. 90 EUR/MWh, 0.094 EUR/kgCO2eq.) and the CCU (68 EUR/MWh, 0.057 EUR/kgCO2eq. vs. 91 EUR/MWh, 0.14 EUR/kgCO2eq.) options. However, with significantly lower carbon utilization efficiencies than the best emerging pathways (∼50–55% compared to ∼85–95%) and with modest feedstock potentials (not estimated in the present study), the commercial pathways are less suitable for large-scale BECCS and BECCU. Thus, there is a contradiction between pathways that produce carbon-efficient biofuels with low costs of GHG reduction on large scales and biofuel pathways that are economically interesting to investors. Given that some of the underlying data is uneven in quality and costs estimates are subject to heterogeneity of method, the economic results should be interpreted as indicative when comparing absolute numbers between pathways.
The performance of small plants under the CCS option is heavily influenced by CO2 transport and storage cost assumptions. An important assumption of the study is that small plants can share transport costs with other plants under a setup reliant on, for example, up to 18 co-digestion biogas plants located in close vicinity implementing CCS simultaneously. Without significant cost sharing, the enviro-economic ranking order heavily disfavors the commercially well-established but small-scale anaerobic digestion pathways. The larger plants, particularly the gasification-based pathways, are much more robust to CO2 transport cost assumptions, as each plant generates enough CO2 to justify investment in a dedicated ship. Therefore, assuming that the studied pathways are to be among the first to implement CCS, biofuel processes that generate relatively small quantities of CO2 but deliver low-cost GHG reductions are unlikely to be able to finance the infrastructure required for commercialization.
The smaller-scale pathways typically generate one or more concentrated CO2 streams, whereas several of the larger-scale pathways also generate dilute CO2 streams. While CO2 purity is the most important, albeit not predominant, determinant of the GHG reduction cost of CCS at relatively large gasification and fermentation plants, there is a point beyond which the scale of CO2 capture becomes a larger contributor to the cost of dilute streams than the cost of CO2 separation. Nonetheless, in the majority of the pathways examined, it is clear that the GHG reduction cost for BECCS decreases with the amount of CO2 captured regardless of the concentration.
The cost of CO2 sequestration ranges from 43–102 EUR/tCO2 for the best performing technology tracks (gasification) to 334–363 EUR/tCO2 for the worst performing technology tracks (anaerobic digestion). These numbers can be compared to the current carbon price of ∼60 EUR/t on the EU Emissions Trading System. It is unlikely that there will be economic interest in the CCS options for pathways studied under current policy. However, the cost of CCS in biofuel production plants are comparable to post-combustion CCS of large biogenic emissions, which are in the range of ∼65–130 EUR/tCO2.
CCS outcompetes CCU on cost of GHG reduction but lags behind on cost of biofuel production. Looking at GHG reduction costs, CCS stands out as the more proficient alternative, at least for the pathways for which CO2 capture is a favorable option. In comparison with the CCS option, CCU offers similar improvements in carbon utilization for most pathways, but with significantly lower LCOPs, often the same as the LCOPs of the base option. This suggests that investments in biofuel production with upgrading of CO2 to additional biofuels are economically viable and can enable better utilization of limited biomass resources, albeit at higher GHG reduction costs than most corresponding CCS investments. A discrepancy between results that benefit plant owners (LCOP) and those that may be more important from a societal perspective (GHG reduction costs and GHG footprints) can thus be observed.
The findings of this study indicate that if there is a societal interest in producing biofuels in a way where the biogenic carbon source is utilized efficiently, CCS and CCU are not financially viable alternatives for most currently dominant options for biofuel production. BECCS and BECCU are important tools, but to unlock their full benefits economically, it is important to facilitate the introduction of emerging biofuel production technologies based on either gasification or hydrotreatment of forest residues.
Data Availability Statement
The original contributions presented in the study are included in the article/Supplementary Material, further inquiries can be directed to the corresponding author.
Author Contributions
YJ, JA, EW, SH and EF contributed to the conception and design of the study. YJ and JA collected the data, compiled the results and performed the evaluations. ES generated the ENPAC dataset. All authors contributed to the analysis, discussion and interpretation of the results. YJ and JA wrote the first draft of the manuscript. ES and KP wrote sections of the manuscript. YJ finalized the manuscript. All authors contributed to manuscript revision, read, and approved the submitted version.
Funding
This study is the result of a project carried out within the collaborative research program Renewable transportation fuels and systems (förnybara drivmedel och system), Project no. [P48363-1]. The project has been financed by the Swedish Energy Agency and f3-Swedish Centre for Renewable Transportation Fuels. Economic support from Bio4Energy, a strategic research environment appointed by the Swedish government, is also gratefully acknowledged.
Conflict of Interest
ES was employed at CIT Industriell Energi AB at the time of the study. CIT Industriell Energi AB is a consulting company specializing in knowledge transfer between academia, industry and government agencies, focusing primarily on efficient and sustainable industrial energy use. It is a wholly owned subsidiary to the foundation Chalmers Industriteknik.
The remaining authors declare that the research was conducted in the absence of any commercial or financial relationships that could be construed as a potential conflict of interest.
Publisher’s Note
All claims expressed in this article are solely those of the authors and do not necessarily represent those of their affiliated organizations, or those of the publisher, the editors and the reviewers. Any product that may be evaluated in this article, or claim that may be made by its manufacturer, is not guaranteed or endorsed by the publisher.
Acknowledgments
Sennai Mesfun from RISE Research Institutes of Sweden is thanked for their collaboration and support.
Supplementary Material
The Supplementary Material for this article can be found online at: https://www.frontiersin.org/articles/10.3389/fenrg.2022.797529/full#supplementary-material
Abbreviations
BECCS, Bioenergy Carbon Capture and Storage; BECCU, Bioenergy Carbon Capture and Utilization; CAPEX, Capital Expenditure; CCS, Carbon Capture and Storage; CCU, Carbon Capture and Utilization; DFB, dual fluidized bed; GHG, Green-House Gas; IPCC, ; International Panel on Climate Change; LCOP, Levelized cost of production; LPG, Liquefied Petroleum Gas; OPEX, Operational Expenditure; RED II, European Renewable Energy Directive; *, Utilization is defined narrowly in the present study as conversion to drop-in gasoline or LPG or to bio-methane.
References
Afrin, T. (2018). The Role of Tall Oil in Finnish Bio-Economy Policy and Changing Value Network. Helsinki, Finland: University of Helsinki.
Ahlström, J. M., Alamia, A., Larsson, A., Breitholtz, C., Harvey, S., and Thunman, H. (2019). Bark as Feedstock for Dual Fluidized Bed Gasifiers-Operability, Efficiency, and Economics. Int. J. Energy Res. 43, 1171–1190. doi:10.1002/er.4349
Ahlström, J. M., Harvey, S., and Papadokonstantakis, S. (2018). Forest Residues Gasification Integrated with Electrolysis for Production of SNG - Modelling and Assessment. Comput. Aided Chem. Eng. 44, 109–114. doi:10.1016/B978-0-444-64241-7.50013-6
Alamia, A., Larsson, A., Breitholtz, C., and Thunman, H. (2017). Performance of Large-Scale Biomass Gasifiers in a Biorefinery, a State-Of-The-Art Reference. Int. J. Energy Res. 41, 2001–2019. doi:10.1002/er.3758
Anders, N. (2021). Spannmålspriset Fortsätter Att Stiga. Lantbruksnytt n.d. Available at: https://lantbruksnytt.se/spannmalspriset-fortsatter-att-stiga-3/ (accessed October 12, 2021).
Andersson, K. (2015). Bioenergy the Swedish Experience. Svebio. Available at: https://www.svebio.se/app/uploads/2017/06/Bioenergy_Swedish_experice_3rded_web-1.pdf (accessed October 5, 2021).
Anheden, M., Lundberg, V., Pettersson, K., Fugelsang, M., Hjerpe, C. J., Å, H., et al. (2016). Value Chains for Production of Renewable Transportation Fuels Using Intermediates. Gothenburg, Sweden: The Swedish Knowledge Centre for Renewable Transportation Fuels f3.
Azar, C., Johansson, D. J. A., and Mattsson, N. (2013). Meeting Global Temperature Targets-The Role of Bioenergy with Carbon Capture and Storage. Environ. Res. Lett. 8, 034004. doi:10.1088/1748-9326/8/3/034004
Babin, A., Vaneeckhaute, C., and Iliuta, M. C. (2021). Potential and Challenges of Bioenergy with Carbon Capture and Storage as a Carbon-Negative Energy Source: A Review. Biomass Bioenergy 146, 105968. doi:10.1016/j.biombioe.2021.105968
Becker, N., Björnsson, L., and Börjesson, P. (2017). Greenhouse Gas Savings for Swedish Emerging Lignocellulose-Based Biofuels-According to the EU Renewable Energy Directive Calculation Methodology. Lund: Lund University.
Benjaminsson, G., Benjaminsson, J., and Bengtsson, N. (2013). Decentraliserad Produktion Av Pyrolysolja För Transport till Storskaliga Kraftvärmeverk Och Förgasningsanläggningar. Stockholm: Energimyndigheten.
Börjesson, P., Tufvesson, L., and Lantz, M. (2010). Livscykelanalys Av Svenska Biodrivmedel, 118. Lund.
Bouckaert, S., Pales, A., McGlade, C., and Remme, U. (2021). Net Zero by 2050: A Roadmap for the Global Energy Sector. Paris: International Energy Agency.
Brynolf, S., Fridell, E., and Andersson, K. (2014). Environmental Assessment of Marine Fuels: Liquefied Natural Gas, Liquefied Biogas, Methanol and Bio-Methanol. J. Clean. Prod. 74, 86–95. doi:10.1016/j.jclepro.2014.03.052
Buttler, A., and Spliethoff, H. (2018). Current Status of Water Electrolysis for Energy Storage, Grid Balancing and Sector Coupling via Power-To-Gas and Power-To-Liquids: A Review. Renew. Sustain. Energy Rev. 82, 2440–2454. doi:10.1016/j.rser.2017.09.003
Chemical Engineering (2021). The Chemical Engineering Plant Cost Index. Chem Eng. Available at: https://www.chemengonline.com/pci-home (accessed October 18, 2021).
Daioglou, V., Doelman, J. C., Wicke, B., Faaij, A., and van Vuuren, D. P. (2019). Integrated Assessment of Biomass Supply and Demand in Climate Change Mitigation Scenarios. Glob. Environ. Change 54, 88–101. doi:10.1016/J.GLOENVCHA.2018.11.012
Danish Energy Agency (2021). Energinet. Technology Data - Renewable Fuels. Available at: https://ens.dk/sites/ens.dk/files/Analyser/technology_data_for_renewable_fuels.pdf (accessed October 5, 2021).
Decarre, S., Berthiaud, J., Butin, N., and Guillaume-Combecave, J.-L. (2010). CO2 Maritime Transportation. Int. J. Greenh. Gas Control 4, 857–864. doi:10.1016/j.ijggc.2010.05.005
Element Energy Limited (2018). Shipping CO2 – UK Cost Estimation. Cambridge, UK: Element Energy Limited.
Eliasson, L., and Johannesson, T. (2014). Effekten Av Olika Bottensåll På Prestation, Bränsleförbrukning Och Flisens Fraktionsfördelning För Flishuggarna Kesla 645 Och Eschlböck Biber 92. Uppsala: Skogsforsk.
Emenike, O., Michailos, S., Hughes, K. J., Ingham, D., and Pourkashanian, M. (2021). Techno-economic and Environmental Assessment of BECCS in Fuel Generation for FT-Fuel, bioSNG and OMEx. Sustain. Energy Fuels 5, 3382–3402. doi:10.1039/D1SE00123J
Energigas Sverige (2021). Statistik Om Biogas. Energigas Sverige. Available at: https://www.energigas.se/fakta-om-gas/biogas/statistik-om-biogas/ (accessed October 18, 2021).
Finansdepartementet, Miljödepartementet (2021). Nya Och Utökade Satsningar På Industrins Gröna Omställning. RegeringenSe. Available at: https://www.regeringen.se/pressmeddelanden/2021/09/nya-och-utokade-satsningar-pa-industrins-grona-omstallning/ (accessed October 12, 2021).
Fridahl, M., and Lehtveer, M. (2018). Bioenergy with Carbon Capture and Storage (BECCS): Global Potential, Investment Preferences, and Deployment Barriers. Energy Res. Soc. Sci. 42, 155–165. doi:10.1016/j.erss.2018.03.019
Fulton, L. M., Lynd, L. R., Körner, A., Greene, N., and Tonachel, L. R. (2015). The Need for Biofuels as Part of a Low Carbon Energy Future. Biofuels, Bioprod. Bioref. 9, 476–483. doi:10.1002/BBB.1559
Fuss, S., and Johnsson, F. (2021). The BECCS Implementation Gap–A Swedish Case Study. Front. Energy Res. 8, 553400. doi:10.3389/FENRG.2020.553400/FULL
Guil-López, R., Mota, N., Llorente, J., Millán, E., Pawelec, B., Fierro, J. L. G., et al. (2019). Methanol Synthesis from CO2: A Review of the Latest Developments in Heterogeneous Catalysis. Materials 12, 3902. doi:10.3390/ma12233902
Haldor Topsøe, A. (2018). Electrical Upgrading of Biogas. Kgs. Lyngby 47. Report. Available at: https://energiforskning.dk/sites/energiforskning.dk/files/slutrapporter/slutrapport_eudp_elupgraded_biogas.pdf.
Harvey, S., and Axelsson, E. (2010). Scenarios for Assessing Profitability and Carbon Balances of Energy Investments in Industry. Gothenburg.
Haus, S., Björnsson, L., and Börjesson, P. (2020). Lignocellulosic Ethanol in a Greenhouse Gas Emission Reduction Obligation System-A Case Study of Swedish Sawdust Based-Ethanol Production. Energies 13, 1048. doi:10.3390/en13051048
Hennig, M., and Haase, M. (2021). Techno-economic Analysis of Hydrogen Enhanced Methanol to Gasoline Process from Biomass-Derived Synthesis Gas. Fuel Process. Technol. 216, 106776. doi:10.1016/J.FUPROC.2021.106776
Iea Bioenergy (2020). New Publication – Deployment of BECCS/U Value Chains – Technological Pathways, Policy Options and Business Models. Paris: Bioenergy.
International, B. (2021). Fintoil Gets Green Light for Crude Tall Oil Biorefinery in the Port of HaminaKotka. Bioenergyinternational. Available at: https://bioenergyinternational.com/biofuels-oils/fintoil-gets-green-light-for-crude-tall-oil-biorefinery-in-port-of-haminakotka (accessed October 12, 2021).
Jafri, Y., Wetterlund, E., Anheden, M., Kulander, I., Håkansson, Å., and Furusjö, E. (2019a). Multi-Aspect Evaluation of Integrated Forest-Based Biofuel Production Pathways: Part 1. Product Yields & Energetic Performance. Energy 166, 401–413. doi:10.1016/j.energy.2018.10.008
Jafri, Y., Wetterlund, E., Anheden, M., Kulander, I., Håkansson, Å., and Furusjö, E. (2019b). Multi-Aspect Evaluation of Integrated Forest-Based Biofuel Production Pathways: Part 2. Economics, GHG Emissions, Technology Maturity and Production Potentials. Energy 172, 1312–1328. doi:10.1016/j.energy.2019.02.036
Jafri, Y., Wetterlund, E., Mesfun, S., Rådberg, H., Mossberg, J., Hulteberg, C., et al. (2020). Combining Expansion in Pulp Capacity with Production of Sustainable Biofuels - Techno-Economic and Greenhouse Gas Emissions Assessment of Drop-In Fuels from Black Liquor Part-Streams. Appl. Energy 279, 115879. doi:10.1016/j.apenergy.2020.115879
Jensen, C. U. (2018). PIUS - HydrofactionTM Platform with Integrated Upgrading Step. Aalborg: Aalborg Universitetsforlag.
Jensen, C. U., Rodriguez Guerrero, J. K., Karatzos, S., Olofsson, G., and Iversen, S. B. (2017). Fundamentals of Hydrofaction™: Renewable Crude oil From Woody Biomass. Biomass Conv. bioref. 7, 495–509. doi:10.1007/s13399-017-0248-8
Joelsson, E., Erdei, B., Galbe, M., and Wallberg, O. (2016). Techno-economic Evaluation of Integrated First- and Second-Generation Ethanol Production from Grain and Straw. Biotechnol. Biofuels 9, 1–16. doi:10.1186/s13068-015-0423-8
Johnsson, F., Normann, F., and Svensson, E. (2020). Marginal Abatement Cost Curve of Industrial CO2 Capture and Storage - A Swedish Case Study. Front. Energy Res. 8, 175. doi:10.3389/fenrg.2020.00175
Jones, S., Meyer, P., Snowden-swan, L., Padmaperuma, A., Tan, E., Dutta, A., et al. (2013). Process Design and Economics for the Conversion of Lignocellulosic Biomass to Hydrocarbon Fuels: Fast Pyrolysis and Hydrotreating Bio-Oil Pathway. United States: USDOE Office of Energy Efficiency and Renewable Energy (EERE), Transportation Office. Bioenergy Technologies Office.
Jordbruksverket (2021). Priser På Jordbruksprodukter - December 2020. Månadsbrev - Priser På Jordbruksprodukter. Available at: https://jordbruksverket.se/download/18.4f9dead71770f4e9ae04e021/1610977412495/Priset-pa-jordbruksprodukter-2021-01-05.pdf (accessed October 12, 2021).
Koytsoumpa, E. I., Magiri – Skouloudi, D. D., Karellas, S., and Kakaras, E. (2021). Bioenergy with Carbon Capture and Utilization: A Review on the Potential Deployment towards a European Circular Bioeconomy. Renew. Sustain. Energy Rev. 152, 111641. doi:10.1016/J.RSER.2021.111641
Lantz, M., Aldenius, M., and Khan, J. (2019). Styrmedel för en ökad produktion och användning av biogas. Lund: Lund University.
Lantz, M. (2017). Hållbarhetskriterier För Biogas: En Översyn Av Data Och Metoder, 100. Lund: Lund University.
Lantz, M., Prade, T., Ahlgren, S., and Björnsson, L. (2018). Biogas and Ethanol from Wheat Grain or Straw: Is There a Trade-Off between Climate Impact, Avoidance of iLUC and Production Cost? Energies 11, 2633. doi:10.3390/en11102633
Lehtveer, M., Brynolf, S., and Grahn, M. (2019). What Future for Electrofuels in Transport? Analysis of Cost Competitiveness in Global Climate Mitigation. Environ. Sci. Technol. 53, 1690–1697. doi:10.1021/ACS.EST.8B05243
Masson-Delmotte, V., Zhai, P., Pörtner, H., and Roberts, D. (2018). Global Warming of 1.5° C: Summary for Policy Makers. Geneva: Intergovernmental Panel on Climate Change.
Masson-Delmotte, V., Zhai, P., Pirani, A., Connors, S. L., Péan, C., Berger, S., et al. (2022). IPCC, 2021: Climate Change 2021: The Physical Science Basis. Contribution of Working Group I to the Sixth Assessment Report of the Intergovernmental Panel on Climate Change. Geneva: Intergovernmental Panel on Climate Change.
Meerman, J. C., and Larson, E. D. (2017). Negative-Carbon Drop-In Transport Fuels Produced via Catalytic Hydropyrolysis of Woody Biomass with CO2 capture and Storage. Sustain. Energy Fuels 1, 866–881. doi:10.1039/c7se00013h
Neele, F., de Kler, R., Nienoord, M., Brownsort, P., Koornneef, J., Belfroid, S., et al. (2017). CO2 Transport by Ship: The Way Forward in Europe. Energy Procedia 114, 6824–6834. doi:10.1016/j.egypro.2017.03.1813
Noh, H., Kang, K., Huh, C., Kang, S.-G., Han, S. J., and Kim, H. (2019). Conceptualization of CO2 Terminal for Offshore CCS Using System Engineering Process. Energies 12, 4350. doi:10.3390/en12224350
NTMCalc (2010). Network for Transport and Environment. Available at: https://www.transportmeasures.org/wp-content/uploads/2013/11/ft-model.pdf (Accessed May 29, 20222).
Nyári, J., Magdeldin, M., Larmi, M., Järvinen, M., and Santasalo-Aarnio, A. (2020). Techno-Economic Barriers of an Industrial-Scale Methanol CCU-Plant. J. CO2 Util. 39, 101166. doi:10.1016/j.jcou.2020.101166
Pettersson, K., Gåverud, H., and Görling, M. (2019). Well-to-Wheel Cost for Forest-Based Biofuels. Gothenburg, Sweden: f3-The Swedish Knowledge Centre for Renewable Transportation Fuels.
Pettersson, K., Axelsson, E., Eriksson, L., Svensson, E., Berntsson, T., and Harvey, S. (2020). Holistic Methodological Framework for Assessing the Benefits of Delivering Industrial Excess Heat to a District Heating Network. Int. J. Energy Res. 44, 2634–2651. doi:10.1002/er.5005
Pool, N. (2021). Market Data. Available at: https://www.nordpoolgroup.com/Market-data1/#/nordic/table (accessed October 18, 2021).
Pri.Eu.Mar, (2021). Meat Market Observatory - Beef and Veal. EU Remain Calves Young Cattle. Available at: https://ec.europa.eu/info/sites/default/files/food-farming-fisheries/farming/documents/beef-remainder_en.pdf (accessed October 12, 2021).
PyroWiki (2020). Commercial Plants. PyroknownEu. Available at: http://pyrowiki.pyroknown.eu/index.php/Commercial_plants (accessed October 12, 2021).
Rego de Vasconcelos, B., and Lavoie, J.-M. (2019). Recent Advances in Power-To-X Technology for the Production of Fuels and Chemicals. Front. Chem. 7, 392. doi:10.3389/fchem.2019.00392
Remer, D. S., and Chai, L. H. (1990). Design Cost Factors for Scaling-Up Engineering Equipment. Chem. Eng. Prog. 86, 77–82.
Rise Research Institutes of Sweden (2021). Internal Correspondence with RISE Research Institutes of Sweden AB. Stockholm: RISE Research Institutes of Sweden.
Ritchie, K., and Efstathios-Al, T. (2021). Potential for Carbon-Neutral Advanced Biofuels in UK Road Transport. J. Energy Eng. 147, 4021025. doi:10.1061/(ASCE)EY.1943-7897.0000775
Rodin, V., Lindorfer, J., Böhm, H., and Vieira, L. (2020). Assessing the Potential of Carbon Dioxide Valorisation in Europe with Focus on Biogenic CO2. J. CO2 Util. 41, 101219. doi:10.1016/J.JCOU.2020.101219
Rootzén, J., Kjärstad, J., Johnsson, F., and Karlsson, H. (2018). Deployment of BECCS in Basic Industry-A Swedish Case Study. Gothenburg: Chalmers University of Technology.
Shahbaz, M., AlNouss, A., Ghiat, I., Mckay, G., Mackey, H., Elkhalifa, S., et al. (2021). A Comprehensive Review of Biomass Based Thermochemical Conversion Technologies Integrated with CO2 Capture and Utilisation within BECCS Networks. Resour. Conservation Recycl. 173, 105734. doi:10.1016/j.resconrec.2021.105734
Statens Offentliga Utredningar (2020). Vägen till en klimatpositiv framtid. Stockholm: Regeringskansliet.
Stoltz, L. (2018). Behovsstyrd insamling av matavfall för biogasproduktion i regioner med stor del glesbygd. Uppsala, Sweden: Swedish University of Agricultural Sciences.
The European Commission (2018). Directive (EU) 2018/2001 of the European Parliment and of the Council of 11 December 2018 on the Promotion of the Use of Energy from Renewable Sources (Recast). Brussels: The European Parliment & The Council of the European Union.
The European Commission (2020). Regulation (EU) 2020/852 of the European Parliament and of the Council of 18 June 2020 on the Establishment of a Framework to Facilitate Sustainable Investment, and Amending Regulation (EU). Brussels: The European Commission.
The European Commission (2021). Annex C: Methodology for Calculation of GHG Emission Avoidance. Brussels: The European Commission.
The Swedish Energy Agency (2012). Vägledning till Regelverket Om Hållbarhetskriterier För Biodrivmedel Och Flytande Biobränslen. Sweden: Eskilstuna.
Thunman, H., Gustavsson, C., Larsson, A., Gunnarsson, I., and Tengberg, F. (2019). Economic Assessment of Advanced Biofuel Production via Gasification Using Cost Data from the GoBiGas Plant. Energy Sci. Eng. 7, 217–229. doi:10.1002/ese3.271
Zagklis, D., Konstantinidou, E., Zafiri, C., and Kornaros, M. (2020). Assessing the Economic Viability of an Animal Byproduct Rendering Plant: Case Study of a Slaughterhouse in Greece. Sustainability 12, 5870. doi:10.3390/su12145870
Keywords: BECCS, BECCU, bio-CCS, negative emissions, biofuels, carbon capture, GHG footprint, carbon utilization
Citation: Jafri Y, Ahlström JM, Furusjö E, Harvey S, Pettersson K, Svensson E and Wetterlund E (2022) Double Yields and Negative Emissions? Resource, Climate and Cost Efficiencies in Biofuels With Carbon Capture, Storage and Utilization. Front. Energy Res. 10:797529. doi: 10.3389/fenrg.2022.797529
Received: 18 October 2021; Accepted: 11 May 2022;
Published: 20 June 2022.
Edited by:
Abdul-Sattar Nizami, Government College University, Lahore, PakistanReviewed by:
Iskandar Halim, Institute of Chemical and Engineering Sciences (A∗STAR), SingaporeMuhammad Farooq, University of Engineering and Technology, Lahore, Pakistan
Arsalan Sepehri, University of Toledo, United States
Copyright © 2022 Jafri, Ahlström, Furusjö, Harvey, Pettersson, Svensson and Wetterlund. This is an open-access article distributed under the terms of the Creative Commons Attribution License (CC BY). The use, distribution or reproduction in other forums is permitted, provided the original author(s) and the copyright owner(s) are credited and that the original publication in this journal is cited, in accordance with accepted academic practice. No use, distribution or reproduction is permitted which does not comply with these terms.
*Correspondence: Yawer Jafri, eWF3ZXIuaC5qYWZyaUBnbWFpbC5jb20=; Elisabeth Wetterlund, ZWxpc2FiZXRoLndldHRlcmx1bmRAbHR1LnNl