 Mingyun Luo1,2
 Zhengguo Zhang
 Xiaoming Fang
- 1The Key Lab of Enhanced Heat Transfer and Energy Conservation, Ministry of Education, School of Chemistry and Chemical Engineering, South China University of Technology, Guangzhou, China
- 2Guangdong Engineering Technology Research Center of Efficient Heat Storage and Application, South China University of Technology, Guangzhou, China
- 3Zhuhai Institute of Modern Industrial Innovation, South China University of Technology, Zhuhai, China
High charge/discharge rates and high energy density require a greater cooling power and a more compact structure for battery thermal management systems. The Immersion cooling (direct liquid cooling) system reduces the thermal resistance between the cooling medium and the battery and greatly enhances the cooling effect of the system. However, the high viscosity and low specific heat capacity of dielectric fluid limit the cooling effect of immersion cooling. This study presents an immersion cooling system that uses water as the cooling medium. In this system, a special seal structure was designed to prevent contact between water and the battery’s electrodes. The cooling effect of the system on the battery pack was numerically studied. Even if the battery pack is discharged at 3 C rate, a small water flow rate (200 ml/min) can ensure that the maximum temperature of the battery pack falls below 50°C. However, a good cooling capacity will increase the temperature difference of the battery pack. The temperature difference of the battery pack is difficult to reduce to 5°C until the water flow rate exceeds 1,000 ml/min. Adding a buffer structure at the inlet/outlet can be reduced the negative effects of the turbulent flow and then improve the temperature uniformity of the battery pack. These findings provide a better understanding of the influencing factors of the water immersion cooling system and can help to design a better immersion cooling system.
1 Introduction
The promotion and development of electric vehicles is an important part of the world’s carbon neutrality. Lithium-ion battery is one of the main power sources of electric vehicles and the core components of electric vehicles, which is of great significance to the development of electric vehicles (Wu et al., 2019). However, the battery performance is greatly influenced by the temperature (Fan et al., 2021). Operating at a high temperature or low temperature will reduce the capacity and lifespan of lithium batteries (Lu et al., 2013; Feng et al., 2014). Excessive temperature or poor temperature uniformity may cause thermal runaway of the battery pack, resulting in combustion or explosion (Feng et al., 2015). Therefore, an effective thermal management system is necessary for the batteries to maintain in a comfortable operating temperature range.
According to the cooling mode, battery thermal management can be divided into active thermal management and passive thermal management. Active thermal management cools the battery by removing heat from it through a medium such as air (Park, 2013) or liquid (Ramotar et al., 2017; Li et al., 2018; Ling et al., 2018). Active cooling systems can continuously and effectively cool the battery, which has high reliability and is widely used in many electric vehicles (EVs) (Liu and Zhang, 2020). But active cooling systems often have complex structures and require some mechanical devices such as pumps or fans. Passive cooling systems rely on energy storage materials such as phase change materials (PCMs) to absorb the heat generated by the battery and thus cool the battery (Huang et al., 2019; Wu et al., 2020; Jilte et al., 2021). These passive cooling systems consume no energy, do not require any mechanical devices, having the advantages of compact structure, low cost, and no noise (Ping et al., 2018). On the downside, the passive cooling systems will be invalid when the heat that reserved in PCM cannot dissipate timely (Ling et al., 2015). Combined with active cooling such as air-cooling (Ling et al., 2015) and liquid cooling (Ling et al., 2018; Cao et al., 2020a, Cao et al., 2020b), the heat absorbed by the PCM can be quickly removed, which greatly improves the cooling performance and reliability of the system. Jiao et al. (Liu et al., 2014) pointed out that liquid cooling has better cooling effect, while PCM cooling has better temperature uniformity. Therefore, the thermal management strategy combined with liquid cooling and PCM cooling has the advantages of good cooling effect and temperature uniformity. Ling et al. (2018) propose a hybrid cooling system integrates liquid cooling into expanded graphite (EG) based PCM, effectively reducing the weight and complexity of the thermal management system.
The existing battery cooling system can effectively cool down the battery pack when discharged at a relatively low rate (1.5–2 C). However, the battery discharge rate could be over 3∼4 C in the future (Meintz et al., 2017), especially when the battery is used in the Electric truck or during fast-charging. These indirect cooling systems may not meet the cooling requirements of the battery when discharged/charged at a large rate.
Direct liquid cooling (immersion cooling) uses the liquid medium such as mineral oil or silicone oil to make direct contact with the battery cells for cooling. The battery cells are immersed or partially immersed in the cooling medium, which greatly reduces the contact thermal resistance and enhances the cooling effect of the systems (Chen et al., 2016; Suresh Patil et al., 2021). The immersion cooling system can reduce the temperature of the battery pack by 9.3% compared to the indirect cooling system (Suresh Patil et al., 2021). In addition, immersion cooling systems are simpler and more compact without complex cooling channels or cold plates (Tan et al., 2021). It has a good application value in the case of high discharge rate or fast-charge battery in the future.
Existing immersion systems often use a dielectric fluid as a cooling medium to prevent battery short circuits (Nelson et al., 2002; Hekmat and Molaeimanesh, 2020). However, dielectric fluids such as mineral oil or silicone oil is highly viscous, which increases the system power consumption. And the low specific heat capacity of the dielectric fluids also weakens the cooling performance of the systems. Water is an excellent cooling medium with high specific heat capacity and low viscosity. This study proposed an immersion system that use water as cooling medium. In this system, a special seal structure is designed to ensure the electrodes of the battery not to contact with the coolant.
In this study, a water immersion cooling system with a special seal structure was designed and its cooling performance was tested. A numerical model was also established to study the influence of the critical design parameters on the cooling system, including the discharge rate of the battery, water flow rate and temperature. At last, the inlet/outlet structure of the cooling channel was optimized to reduce the influence of turbulence on the cooling effect.
2 Experiment and Simulation
2.1 Single Battery Test System
Figure 1A shows the experimental test system of the immersion cooling. The thermostatic bath controlled the temperature of inlet water. The flow rate was controlled by a mainstream valve and measured by a rotor flowmeter. The temperature data logger (Agilent 34970A, United States) recorded the temperature of the battery and inlet/outlet water by the K-type thermocouples. The battery test system (BT-2018P, precision: ±0.1% V, Hubei Lanbo New Energy Equipment Co., Ltd., China) controlled the charge-discharge process of the battery and recorded the voltage and capacity of the charge-discharge process.
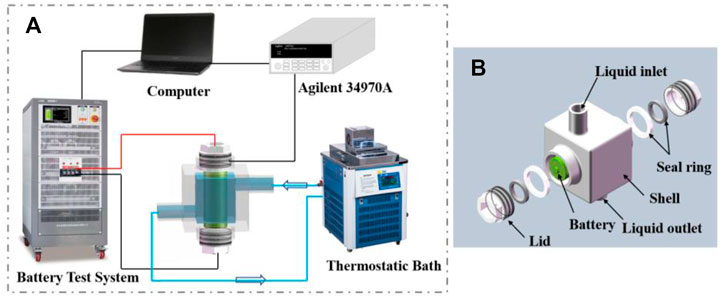
FIGURE 1. Battery test system (A) and the structure of the single-battery pack (B).
In the experimental part, a single cell cooling test was carried out to verify the numerical model. The structure of the single-cell pack and flow channel are shown in Figure 1B. The battery (NCR18650BP, Panasonic Corp., Japan) is placed in the flow channel and immersed in cooling water for cooling, as shown in the section of the battery pack. The seal ring and lid with screw thread can prevent the cooling water from leakage.
For the charge/discharge test, the battery pack was charged by constant current constant voltage (CC-CV) method, with 0.5 C (3.2 A) rate, cut-off voltage of 21.25 V and cut-off current of 0.05 C (0.32 A), and discharged at constant current to the cut-off voltage of 13.5 V. When the battery was discharged at 2 C (6.4 A), the inlet temperature of cooling water is 30°C and the water flow rate was set at 10 ml/min and 20 ml/min respectively. The temperature of the battery was recorded by the thermocouple.
2.2 Simulation
We developed a numerical model in Fluent to study the cooling effect of immersion cooling on the battery pack, include the maximum temperature and the maximum temperature difference of the battery pack. First, we validated the results from a single cell model with the experimental values. Then a battery pack model with 20-cells (five in series and four in parallel) was established to studies the performance of this cooling system on a large battery pack. The structure of the battery pack was shown in Figure 2.
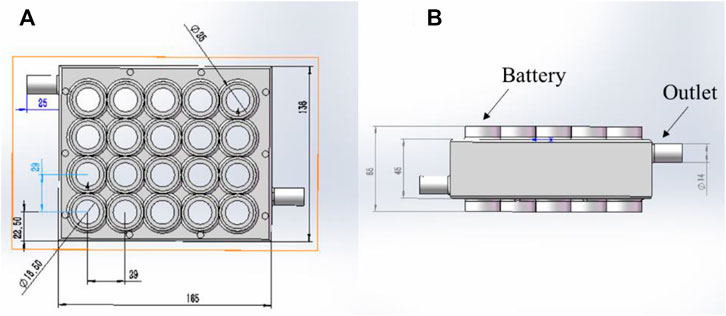
FIGURE 2. The structure of the 5s4p battery pack: (A) planform; (B) side view.
2.2.1 Battery Model
The battery energy conservation can be specified as the following equation:
where
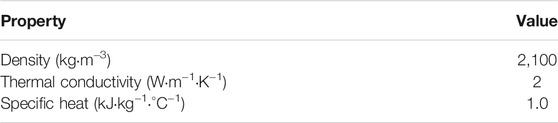
TABLE 1. Thermal physical properties of battery.
In line with existing studies [27], the
where V is the volume of each battery. U can be recorded during battery charge and discharge cycles, F is the Faraday constant, 96,485.3 C/mol.
2.2.2 Liquid Cooling Model
The liquid water was selected as the cooling medium in the battery cooling system. The energy conservation equation of the water is as follows:
The momentum conservation equation of cooling water is given as follows:
The continuity equation of the cold water is defined as:
where
2.2.3 Initial and Boundary Condition of the Cooling System
The initial state is given as t = 0; T (x, y, z) =
The boundary condition of the interface between the battery and the water is defined as:
The energy equation at the boundary between the batteries and water is defined as:
where
2.3 Numerical Method
Firstly, the reliability of the model is verified by simulation of single-cell cooling. Then the battery pack with 20-cells (five in series and four in parallel) was established to studies the performance of this cooling system on a large battery pack. As shown in Figure 2, the flow channel structure of the battery pack cooling is the same as that of single-cell cooling (shown in Figure 1), so that this model can be extend from single-cell cooling to the battery pack cooling. The simulation conditions were conducted as below:
1. The batteries were discharged at 1.5, 2, and 3 C respectively. During the cooling process, the flow rate of water was kept at 200 ml/min and the inlet temperature was kept at 30°C.
2. The inlet water temperature is maintained at 30°C, and then the flow rate of cooling water gradually increase from 100 ml/min until the maximum temperature and the temperature difference of the battery pack are less than 50°C and 5°C, respectively.
3. The influence of the inlet temperature on cooling performance was also investigated. The flow rate of the cooling water is maintained at 200 ml/min and then the inlet temperature of the water was adjust from 30 to 45°C.
4. The two types of inlet/outlet flow channel structure are shown as Figure 3. The structure 1 used circular tubes as inlet/outlet channel. Structure 2 adds a buffer structure between the circular and the battery pack which can reduce the influence of the flow sectional area mutation, as shown in Figure 3B.
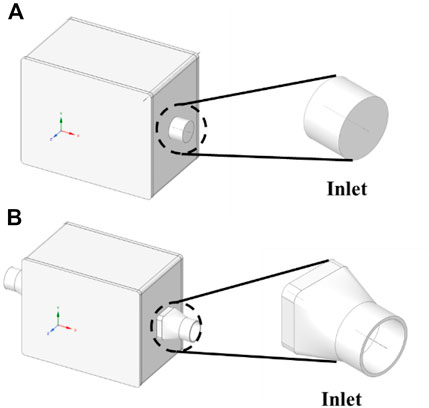
FIGURE 3. The structure of the inlet/outlet flow channel: (A) Structure 1; (B) Structure 2.
3 Results and Discussion
3.1 Experimental Results and Model Validation
The experimental unit of the water immersion cooling system for cylindrical battery is shown in Figure 4. The maximum temperature of the battery (discharged at 2 C) is 39.4°C and 37.3°C under the water flow rate of 10 ml/min and 20 ml/min respectively. The turbulence model used in this model is k-epsilon. The convergence criterion of flow equation is 1e-3 and the convergence criterion of the energy equation is 1e-6. The experimental results show that this water immersion cooling system can achieve excellent cooling effect under a small flow rate. Moreover, experimental results show that the structure of immersion cooling system can effectively prevent water leakage, and can be used for submersible cooling of cylindrical batteries.
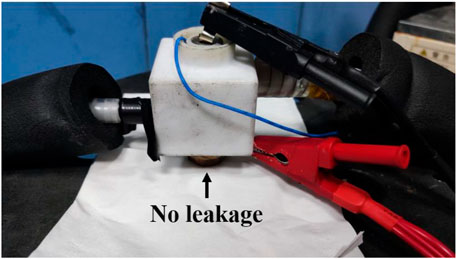
FIGURE 4. Schematic diagram of water immersion cooling system and leakage test.
In order to further investigate the cooling effect of water immersion system on battery pack, we develop a numerical model for the battery immersion cooling and compare the numerical results and experiment data to verify the battery heat production model and cooling model. A grid independent test study was required before the simulation, and the grid numbers of 3.9 × 10⁵, 4.5 × 10⁵, 6.7 × 10⁵, 1.2 × 10⁶ and 2.1 × 10⁶ were obtained. The same boundary conditions and initial conditions were used for the simulation calculation, and the battery temperature was monitored. Figure 5A shows the results of grid independent test study of the numerical model. When the number of grids is more than 6.7 × 10⁵, the temperature of the battery is basically unchanged. Therefore, we can consider that the results are highly accurate when the number of grids is greater than 6.7 × 10⁵. To ensure accuracy and to reduce the cost of simulation calculation, the mesh generation method and size requirements of 6.7 × 10⁵ grids were selected for subsequent mesh generation and simulation calculations.
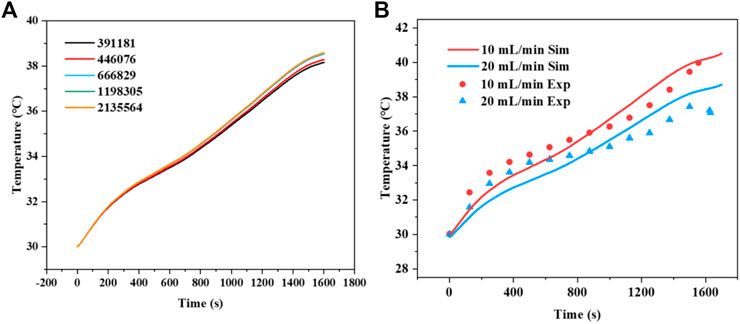
FIGURE 5. comparison of simulation results with different grid numbers (A); Comparison between the numerical and experimental results of battery pack cooling at flow rates of 10 ml/min and 20 ml/min (B)The influence of discharge rate.
As shown in Figure 5B, when the battery is cooled at a water flow of 10 ml/min and 20 ml/min, the average deviation of the battery temperature is 1.08°C and 1.12°C. The average error rate is less than 5%. Moreover, the maximum deviation of the battery temperature between the experimental date and numerical results is less than 2°C. Therefore, we can confirm that this model is reliable. The numerical model can help us better understand the temperature distribution of the system and more easily adjust the operating conditions to obtain the best cooling effect. We then extended this model to a 20-cells battery pack for the study of water immersion cooling system.
The battery will generate more heat at a higher discharge rate. Figure 6 shows the average temperature and the maximum temperature difference of the battery pack discharge at 1.5, 2, and 3 C. The inlet temperature of cooling water is 30°C and the flow rate is 200 ml/min. When the discharge rate of the battery increases from 1.5 to 3 C, the maximum temperature of the battery increases from 35°C to 42.3°C. As the battery temperature increases, the cooling water takes away more heat, resulting in the increase of the outlet temperature of the water. The increase in temperature difference of the inlet and outlet will increase the temperature difference of the battery pack, as shown in Figure 6C. Even if the maximum temperature of the batteries at 3 C discharge rate is less than 50°C, the temperature difference of the battery pack is higher than 5°C at 2 C discharge. In the immersion cooling system, due to sufficient heat exchange between the water and the battery, the temperature difference between the inlet temperature and the outlet temperature is large, thus increasing the temperature difference of the battery pack.
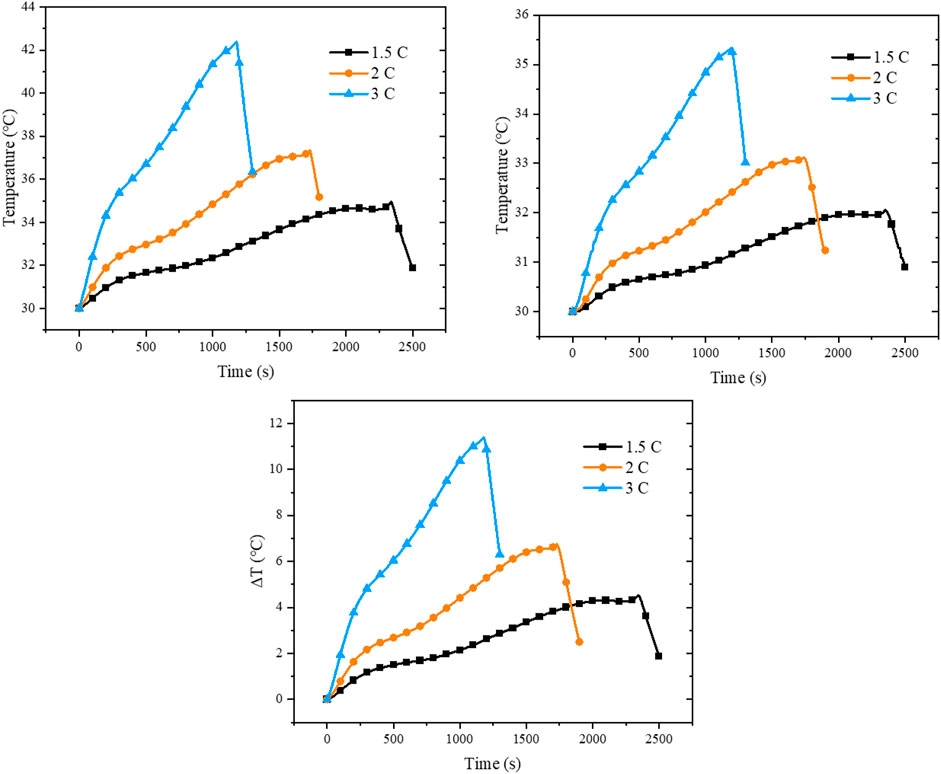
FIGURE 6. Temperature of the battery pack at different discharge rate.
3.2 The Influence of Cooling Flow Rate
Figure 7 shows the influence of the cooling flow rate on the maximum temperature and the maximum temperature difference (ΔTmax) of the battery pack discharged at 1.5, 2, and 3 C respectively. The temperature of the battery pack is easily controlled below 50°C when the cooling flow rate is 100 ml/min, as shown in Figures 7A–C. However, it requires larger cooling flow rate to reduce the ΔTmax to below 5°C. When the battery pack is discharged at 1.5 C, the ΔTmax can be controlled below 5°C at a cooling flow rate of 200 ml/min. When the battery is discharged at 2 C, as shown in Figure 7E, 500 ml/min of cooling water is required to lower ΔTmax below 5°C. With the increase of discharge rate, the cooling water takes more heat generated from batteries, resulting in the increase of ΔTmax of battery pack. As Figure 7F shows, when the diacharge rate of the battery pack increases to 3 C, even a 1000 ml/min water flow cannot reduce the ΔTmax of the battery pack to below 5°C.
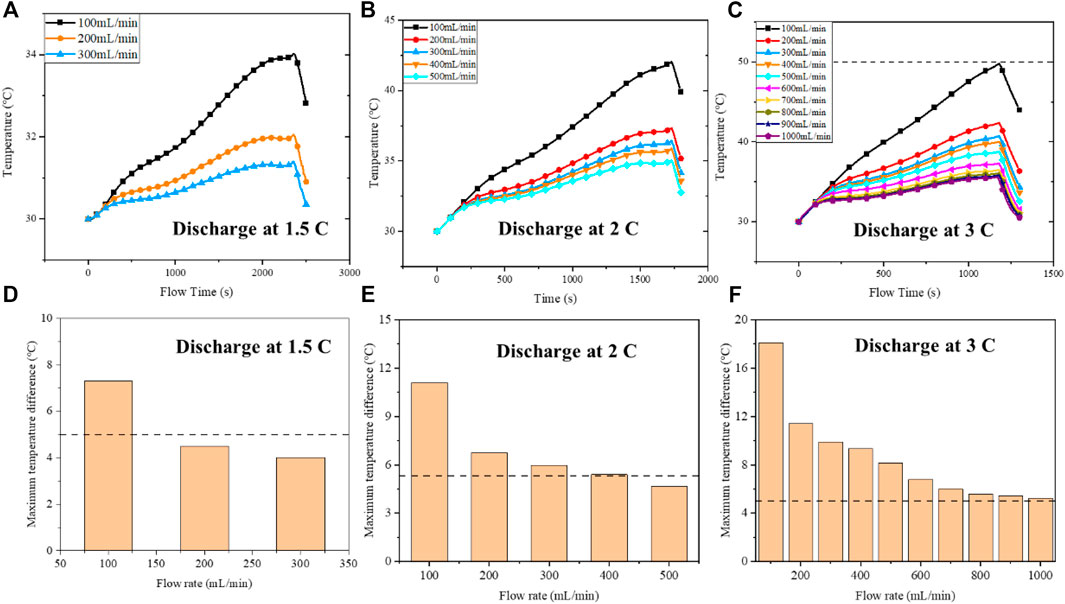
FIGURE 7. Temperature (A–C) and maximum temperature difference (D–F) of the battery pack cooling at different flow rates.
Figure 8 shows the contours of the battery pack cooling at different water flow rate. when the battery pack is cooled at a low water flow rate, the temperature of the battery near the outlet is significantly higher than that near the inlet, as shown in Figures 8A,C. Because the temperature of the outlet water is higher, the temperature difference between the water and the battery is smaller, resulting in lower cooling efficiency and higher battery temperature. As the cooling water flow increase to 500 ml/min (2 C discharge rate) or 1000 ml/min (3 C discharge rate), the water temperature rises slightly in the cooling process, so the temperature difference of the battery at the inlet and outlet decreases. However, when the water flow increases, the fluid changes from laminar flow to turbulent flow. This will lead to reflux and other phenomena in the corner of the cavity, resulting in a reduced cooling effect. As shown in Figures 8B,D, at the outlet, the temperature of the batteries on both sides are higher than that in the middle. The flow channel structure needs further improvement to reduce the temperature difference of the battery pack cooling at a high flow rate.
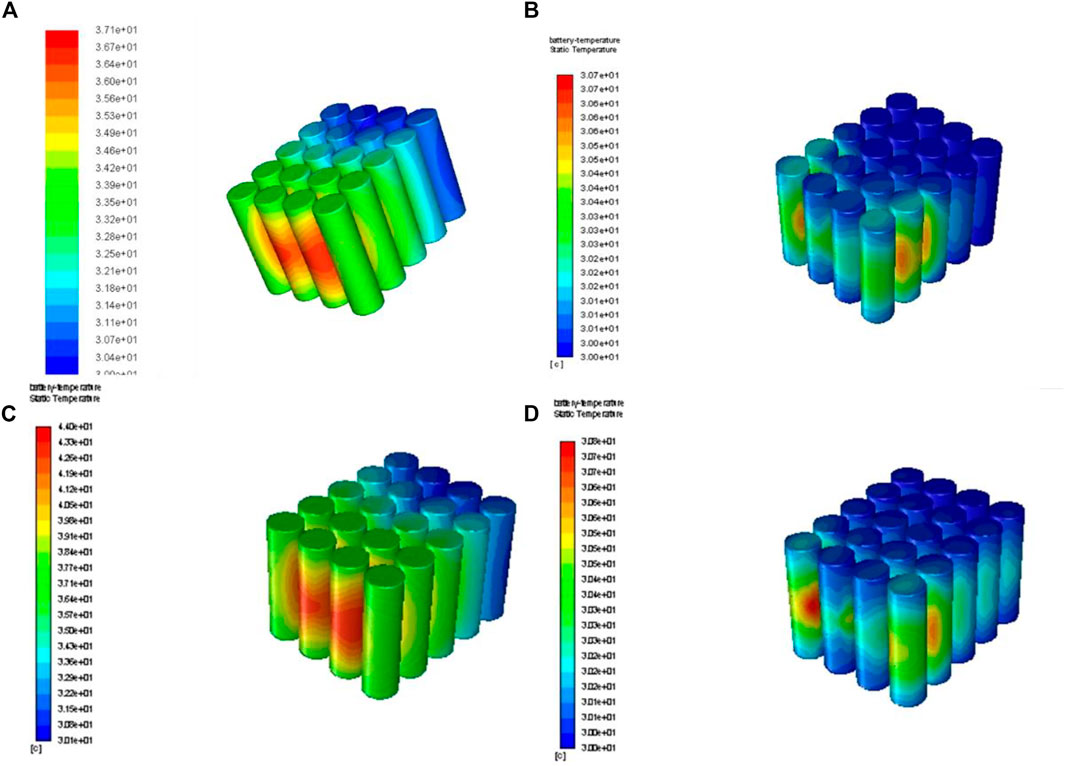
FIGURE 8. Temperature contours of the battery pack: (A) at 2 C discharge and 100 ml/min cooling rate; (B) at 2 C discharge and 500 ml/min cooling rate; (C) at 3 C discharge and 100 ml/min cooling rate; (D) at 3 C discharge and 1,000 ml/min cooling rate.
3.3 The Influence of Water Inlet Temperature
The inlet temperature of cooling water also has a certain influence on the cooling effect and cooling power consumption of battery pack. Figure 9 shows the comparison of cooling performance of the system at different inlet temperatures. As the inlet temperature increases from 30°C to 45°C, the maximum battery temperature increases from 35°C to 50°C. Because the initial temperature of the batteries is always the same as the inlet temperature, the battery pack has the same temperature rise during the discharge process ever at different inlet temperature. As Figure 9C shown, the ΔTmax of the battery pack is hardly affected by the inlet water temperature. This is because the outlet temperature of water increases with the increase of the inlet temperature, as shown in Figure 9B, the temperature difference between the inlet and outlet water is basically not affected by the inlet temperature, so that the ΔTmax of the battery pack is almost the same.
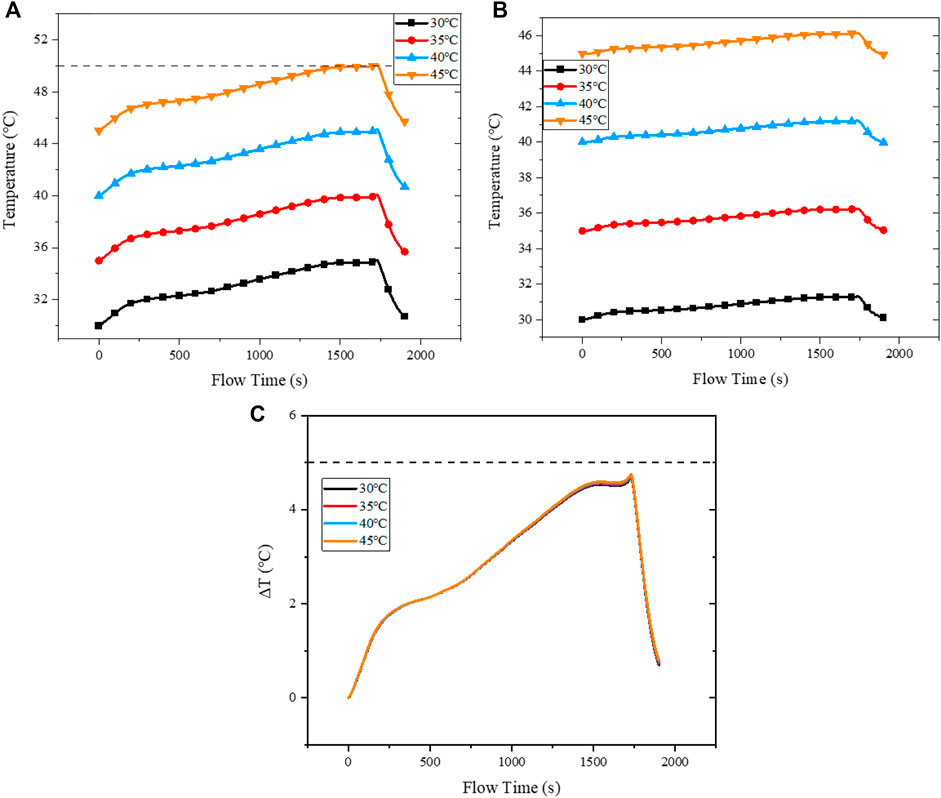
FIGURE 9. Comparison of different inlet temperatures: (A) temperature of the battery pack; (B) temperature of the outlet water flow; (C) maximum temperature difference of the battery pack.
3.4 The Influence of Inlet/Outlet Flow Structure
The structure of inlet/outlet has a great influence on the flow of water in the battery pack. Figure 10 shows the temperature of the battery pack with different inlet/outlet flow structure. The temperature and ΔT of the battery pack with the two inlet/outlet structures are almost the same when the cooling rater is 100 ml/min, as shown in Figures 10A,D. Because when the water flow rate is low, the flow type is laminar. The structure of the inlet/outlet has little effect on water flow. As the water flow increases, so does the temperature ΔT between the two structures. When the flow rate is increased to 1,000 ml/min, as shown in Figures 10C,F, the temperature of battery pack with structure 2 is 8% lower than that with structure 1 and the ΔT of the structure 2 battery pack is 7.1% lower than that of structure 1 battery pack. As the flow rate increases, the flow type of water changes from laminar to turbulent. The buffer structure of structure 2 can reduce the influence of water disturbance in the flow channel of battery pack, thus increasing cooling effect. It proves that this cooling system with structure 2 has a better cooling effect in the case of large flow cooling.
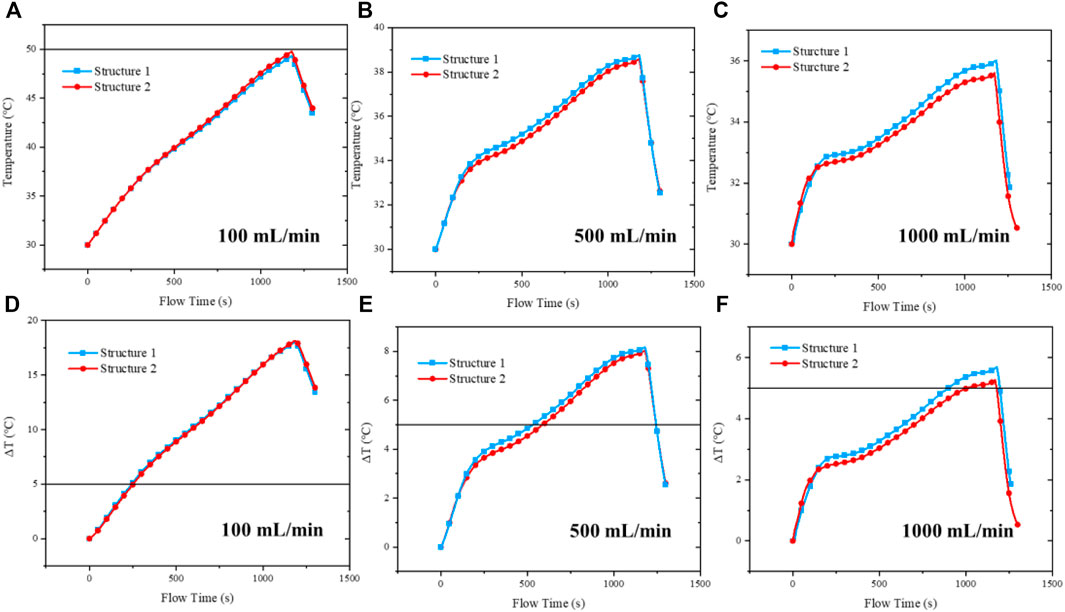
FIGURE 10. Comparison of temperature (A–C) and maximum temperature difference (D–F) between two inlet/outlet flow structures.
Conclusion
This study proposed a water immersion cooling system of the lithium-ion batteries. The system adopts a special sealing structure, which can effectively prevent water leakage. A numerical model is established to study the influence of key parameters on cooling performance of the system. As the battery is in direct contact with the cooling water, the heat transfer effect is greatly improved and the cooling performance of the system is enhanced. Even if the battery pack was discharged at 3 C rate, a small cooling flow rate of 200 ml/min can keep the battery temperature below 50°C.
However, due to the high heat transfer efficiency of immersion cooling, the temperature difference between inlet and outlet water increases, which eventually leads to the large temperature difference of battery pack. And the larger the discharge rate of the battery pack, the larger the temperature difference. When discharging at 2 C, the maximum temperature difference of the battery pack is 6.9°C under a cooling rate of 200 ml/min. But when the battery pack discharge rate increases to 3 C, the maximum temperature difference reaches nearly 12°C. Increasing the flow rate of cooling water can reduce the temperature difference of the battery pack. When the flow rate of cooling water is increased to 500 ml/min, the maximum temperature difference of the battery pack (discharged at 2 C) is reduced to below 5°C.
The turbulence phenomenon at large flow rates will weaken the cooling effect of the system. When the water flow rate is large, the fluid changes from laminar flow to turbulent flow. This will lead to reflux and other phenomena in the corner of the cavity, resulting in a reduced cooling effect. Adding a buffer structure at the inlet and outlet can reduced the negative effects of the turbulent flow and then reduce the temperature and temperature difference of the battery pack.
Improving the temperature uniformity of battery pack is the key point of water immersion cooling system design in the future. The temperature difference of the battery pack can be reduced by designing multiple inlet and outlet and cross-flow. A novel inlet/outlet structure can be designed to ensure a more stable flow of water in the battery pack. The phase change emulsion can be also used for immersion cooling, its larger specific heat capacity and the phase change process can well reduce the temperature difference of the battery pack.
Data Availability Statement
The original contributions presented in the study are included in the article/Supplementary Material, further inquiries can be directed to the corresponding author.
Author Contributions
ML: Development or design of methodology; Conducting a research and investigation process and writing the initial draft; JC: Help to design the methodology; NL: Data curation and visualization; ZZ: Management and coordination responsibility for the research activity planning and execution; XF: Management and coordination responsibility for the research activity planning and execution.
Conflict of Interest
The authors declare that the research was conducted in the absence of any commercial or financial relationships that could be construed as a potential conflict of interest.
Publisher’s Note
All claims expressed in this article are solely those of the authors and do not necessarily represent those of their affiliated organizations, or those of the publisher, the editors and the reviewers. Any product that may be evaluated in this article, or claim that may be made by its manufacturer, is not guaranteed or endorsed by the publisher.
References
Cao, J., Ling, Z., Fang, X., and Zhang, Z. (2020a). Delayed Liquid Cooling Strategy with Phase Change Material to Achieve High Temperature Uniformity of Li-Ion Battery under High-Rate Discharge. J. Power Sourc. 450, 227673. doi:10.1016/j.jpowsour.2019.227673
Cao, J., Luo, M., Fang, X., Ling, Z., and Zhang, Z. (2020b). Liquid Cooling with Phase Change Materials for Cylindrical Li-Ion Batteries: An Experimental and Numerical Study. Energy. 191, 116565. doi:10.1016/j.energy.2019.116565
Chen, D., Jiang, J., Kim, G.-H., Yang, C., and Pesaran, A. (2016). Comparison of Different Cooling Methods for Lithium Ion Battery Cells. Appl. Therm. Eng. 94, 846–854. doi:10.1016/j.applthermaleng.2015.10.015
Fan, Y., Zhan, D., Tan, X., Lyu, P., and Rao, J. (2021). Optimization of Cooling Strategies for an Electric Vehicle in High-Temperature Environment. Appl. Therm. Eng. 195, 117088. doi:10.1016/j.applthermaleng.2021.117088
Feng, X., Fang, M., He, X., Ouyang, M., Lu, L., Wang, H., et al. (2014). Thermal Runaway Features of Large Format Prismatic Lithium Ion Battery Using Extended Volume Accelerating Rate Calorimetry. J. Power Sourc. 255, 294–301. doi:10.1016/j.jpowsour.2014.01.005
Feng, X., Sun, J., Ouyang, M., Wang, F., He, X., Lu, L., et al. (2015). Characterization of Penetration Induced thermal Runaway Propagation Process Within a Large Format Lithium Ion Battery Module. J. Power Sourc. 275, 261–273. doi:10.1016/j.jpowsour.2014.11.017
Hekmat, S., and Molaeimanesh, G. R. (2020). Hybrid thermal Management of a Li-Ion Battery Module with Phase Change Material and Cooling Water Pipes: An Experimental Investigation. Appl. Therm. Eng. 166, 114759. doi:10.1016/j.applthermaleng.2019.114759
Huang, Y.-H., Cheng, W.-L., and Zhao, R. (2019). Thermal Management of Li-Ion Battery Pack with the Application of Flexible Form-Stable Composite Phase Change Materials. Energ. Convers. Management. 182, 9–20. doi:10.1016/j.enconman.2018.12.064
Jilte, R., Afzal, A., and Panchal, S. (2021). A Novel Battery Thermal Management System Using Nano-Enhanced Phase Change Materials. Energy. 219, 119564. doi:10.1016/j.energy.2020.119564
Li, K., Yan, J., Chen, H., and Wang, Q. (2018). Water Cooling Based Strategy for Lithium Ion Battery Pack Dynamic Cycling for thermal Management System. Appl. Therm. Eng. 132, 575–585. doi:10.1016/j.applthermaleng.2017.12.131
Ling, Z., Cao, J., Zhang, W., Zhang, Z., Fang, X., and Gao, X. (2018). Compact Liquid Cooling Strategy with Phase Change Materials for Li-Ion Batteries Optimized Using Response Surface Methodology. Appl. Energ. 228, 777–788. doi:10.1016/j.apenergy.2018.06.143
Ling, Z., Wang, F., Fang, X., Gao, X., and Zhang, Z. (2015). A Hybrid thermal Management System for Lithium Ion Batteries Combining Phase Change Materials with Forced-Air Cooling. Appl. Energ. 148, 403–409. doi:10.1016/j.apenergy.2015.03.080
Liu, R., Chen, J., Xun, J., Jiao, K., and Du, Q. (2014). Numerical Investigation of Thermal Behaviors in Lithium-Ion Battery Stack Discharge. Appl. Energ. 132, 288–297. doi:10.1016/j.apenergy.2014.07.024
Liu, Y., and Zhang, J. (2020). Self-adapting J-Type Air-Based Battery thermal Management System via Model Predictive Control. Appl. Energ. 263, 114640. doi:10.1016/j.apenergy.2020.114640
Lu, W., Xie, K., Pan, Y., Chen, Z.-x., and Zheng, C.-m. (2013). Effects of Carbon-Chain Length of Trifluoroacetate Co-Solvents for Lithium-Ion Battery Electrolytes Using at Low Temperature. J. Fluorine Chem. 156, 136–143. doi:10.1016/j.jfluchem.2013.08.015
Meintz, A., Zhang, J., Vijayagopal, R., Kreutzer, C., Ahmed, S., Bloom, I., et al. (2017). Enabling Fast Charging - Vehicle Considerations. J. Power Sourc. 367, 216–227. doi:10.1016/j.jpowsour.2017.07.093
Nelson, P., Dees, D., Amine, K., and Henriksen, G. (2002). Modeling thermal Management of Lithium-Ion PNGV Batteries. J. Power Sourc. 110, 349–356. doi:10.1016/s0378-7753(02)00197-0
Park, H. (2013). A Design of Air Flow Configuration for Cooling Lithium Ion Battery in Hybrid Electric Vehicles. J. Power Sourc. 239, 30–36. doi:10.1016/j.jpowsour.2013.03.102
Ping, P., Peng, R., Kong, D., Chen, G., and Wen, J. (2018). Investigation on thermal Management Performance of PCM-Fin Structure for Li-Ion Battery Module in High-Temperature Environment. Energ. Convers. Management. 176, 131–146. doi:10.1016/j.enconman.2018.09.025
Ramotar, L., Rohrauer, G. L., Filion, R., and MacDonald, K. (2017). Experimental Verification of a Thermal Equivalent Circuit Dynamic Model on an Extended Range Electric Vehicle Battery Pack. J. Power Sourc. 343, 383–394. doi:10.1016/j.jpowsour.2017.01.040
Suresh Patil, M., Seo, J.-H., and Lee, M.-Y. (2021). A Novel Dielectric Fluid Immersion Cooling Technology for Li-Ion Battery thermal Management. Energ. Convers. Management. 229, 113715. doi:10.1016/j.enconman.2020.113715
Tan, X., Lyu, P., Fan, Y., Rao, J., and Ouyang, K. (2021). Numerical Investigation of the Direct Liquid Cooling of a Fast-Charging Lithium-Ion Battery Pack in Hydrofluoroether. Appl. Therm. Eng. 196, 117279. doi:10.1016/j.applthermaleng.2021.117279
Wu, W., Liu, J., Liu, M., Rao, Z., Deng, H., Wang, Q., et al. (2020). An Innovative Battery thermal Management With Thermally Induced Flexible Phase Change Material. Energ. Convers. Management. 221, 113145. doi:10.1016/j.enconman.2020.113145
Keywords: lithium-ion battery, battery thermal management, water immersion cooling, direct liquid cooling, high discharge rate
Citation: Luo M, Cao J, Liu N, Zhang Z and Fang X (2022) Experimental and Simulative Investigations on a Water Immersion Cooling System for Cylindrical Battery Cells. Front. Energy Res. 10:803882. doi: 10.3389/fenrg.2022.803882
Received: 28 October 2021; Accepted: 05 January 2022;
Published: 01 February 2022.
Edited by:
Lip Huat Saw, Tunku Abdul Rahman University, MalaysiaReviewed by:
Qidong Wang, Institute of Microelectronics (CAS), ChinaHiew Mun Poon, Tunku Abdul Rahman University, Malaysia
Copyright © 2022 Luo, Cao, Liu, Zhang and Fang. This is an open-access article distributed under the terms of the Creative Commons Attribution License (CC BY). The use, distribution or reproduction in other forums is permitted, provided the original author(s) and the copyright owner(s) are credited and that the original publication in this journal is cited, in accordance with accepted academic practice. No use, distribution or reproduction is permitted which does not comply with these terms.
*Correspondence: Zhengguo Zhang, Y2V6aGFuZ0BzY3V0LmVkdS5jbg==