 Zhimin Yin
 Shichao Ji
- State Grid Huzhou Power Supply Company, Hu’zhou, China
This article proposes a point cloud classification model based on group normalization to increase the classification accuracy when the computing power of the terminal device is limited. This model groups and normalizes the features of point cloud during inference and increases the classification accuracy when the computing power is limited. The group normalization first groups the features of point cloud by their channel, then computes their statistic metrics and normalizes them. Also, one-dimensional convolution layers are used to replace the fully connected layers to decrease the model parameters and keep the model's performance when the computing power is limited. In the experiment, PointNet++ is used to pretrain on ModelNet40 and then fine-tune on the point cloud data of transmission lines. The result shows that the proposed method can effectively increase the classification accuracy and help the 3D modeling process of the transmission line.
1 Introduction
Transmission lines are the main part of power transmission and play a key role in the process of power transmission. However, due to the rapid development of power grids in recent years and the increasing length of transmission lines, manual inspections have become more time-consuming and labor-intensive, and the use of unmanned aerial vehicle inspections has become a trend (Qin et al., 2018; Yao et al., 2021). Equipped with a laser radar, an unmanned aerial vehicle can scan along the transmission line to gather point clouds of the transmission line in three dimensions (Teng et al., 2017; Li et al., 2021). Based on the classified point cloud data, various algorithms, such as clearance anomaly detection (Chen et al., 2018), can be applied on the transmission lines. Therefore, how to classify point cloud is an important topic in point cloud processing and analysis (Zhang et al., 2016; Li et al., 2020). On the other hand, though the computing ability is limited on the unmanned aerial vehicle, fast and real-time detection is effective when the internet is bad in the backcountry (Huang et al., 2020).
Wang et al. (2014) proposed a multiscale and hierarchical point cluster method to classify point clouds, which first resamples the point clouds into different scales, and the latent Dirichlet allocation is used to reconstruct the features before an AdaBoost classifier classifies them. There are some researchers who use conditional random fields (Niemeyer et al., 2012) to classify point clouds which have a good generalization performance. In addition, the natural exponential function threshold can also be used to split the point cloud into hierarchical clusters and then jointly use latent Dirichlet allocation and sparse coding to extract and encode the shape features of the multilevel point clusters (Zhang et al., 2016). Some other methods based on the connected component analysis and voxel can also be used to detect pylons and wires from point cloud data (Awrangjeb et al., 2017; Munir et al., 2019).
However, these methods require data formats like image grids or 3D voxels, which need data transformation from the original point clouds and thus lose some space information.
In recent years, deep learning has shown good results in many different tasks, such as image classification (He et al., 2016; Szegedy et al., 2017), natural language processing (Vaswani et al., 2017; Devlin et al., 2018), and automatic speech recognition (Chan et al., 2015; Watanabe et al., 2017). There are also some methods based on deep learning, such as PointNet and PointNet++, that can be applied to point clouds on classification (Qi et al., 2017a; Qi et al., 2017b). These methods need no data preprocessing and can be applied to the original point clouds, which keep the original space information. Based on these works, there are some other works focusing on data diversity or space information (Zhang and Rabbat, 2018; Li et al., 2020). However, these methods do not consider the condition where the model will be loaded in a platform where the computing power is limited (Zhao et al., 2019), such as an unmanned aerial vehicle, which may cause precision loss. Similar work on spatial localization of insulators exists, which can detect insulators in real-time with an unmanned aerial vehicle (Ma et al., 2021). However, there are few similar works in transmission line point cloud classification.
This article proposes an improved network that can resist the precision loss when computing power is limited. The improved network uses group normalization to replace batch normalization, which will cause accuracy loss when the batch size is small. To decrease the model size and increase the inference speed, one-dimensional (1D) convolution layers are used instead of the fully connected layer. Transfer learning is also used to overcome the lack of transmission line point clouds. The model is first trained on ModelNet40 data set, and then fine-tuned on the transmission line point clouds data set. The results on ModelNet40 are compared to other networks. And ablation study on how the batch size affects the accuracy of the model is done to show the effect of the proposed method.
The main contributions of this article are as follows:
1) This article proposes an improved model based on PointNet++, which performs better when the computing power is limited and batch size is small, such as an unmanned aerial vehicle that inspections along transmission lines.
2) The proposed model has a smaller model size and faster inference time while not losing much accuracy, which is suitable for real-time detection on an unmanned aerial vehicle.
This article is organized as follows. Section 2 introduces the related works. Section 3 explains the proposed method. Section 4 is the experimental study and analysis. Finally, Section 5 concludes the article.
2 Related Works
This article proposes a point cloud classification and recognition model based on group normalization (Wu and He, 2018). In the forward propagation of the model, point cloud features are grouped and normalized to ensure the performance of the model when the computing power is limited. In addition, 1D convolution is used to replace the fully connected layer used in the model for feature extraction and classification to accelerate model training and reduce the model size. The experiment uses the PointNet++ as the basic network for improvement. As there is less point cloud data on the transmission line, transfer learning is used for training. First, the model is trained on the public data set ModelNet40 (Wu et al., 2015), which focuses on point cloud classification and then uses the transmission line point cloud data collected by laser radar to fine-tune the network and realize the point cloud classification of the transmission line. The models used and the improvements made will be discussed later.
2.1 Batch Normalization
It is an important assumption in machine learning that the training data and test data are independent and identically distributed. However, the distribution of data will shift in the process of neural network training process, causing the subsequent layers of the network to learn new distribution changes, and the training speed becomes slower and more difficult to converge than independent and identical distribution. Batch normalization (Ioffe and Szegedy, 2015; Santurkar et al., 2018) can be used to solve this problem.
For the input vector
1) First the mean value of the input vector
2) Then the variance
3) After obtaining the mean and variance, normalization is performed:
where
4) Finally, the result of batch normalization
where
5) For the PointNet++ model using batch normalization, for the input point cloud
2.2 One-Dimensional Convolution
Convolutional layers are always used to extract features. Among the various types of convolutional layers, 2D convolutional layer is often used in image-related tasks, such as image classification and detection. 1D convolutional layer is often used in natural language process–related tasks. Due to the high computing efficiency of convolutional operators, in many recent works, it is a trend that fully connected layers are replaced by several convolutional layers.
2.3 Transfer Learning
In the case of insufficient training data, there are several methods to improve accuracy during the training stage, such as data argumentation, meta learning, and transfer learning. Data argumentation can expand the data set by applying different transforms on the original data while meta learning focuses on learning the method to learn.
Transfer learning depends on the similarity between the source data and target data. When the target data are insufficient, the model on a similar data set with enough data is trained first, then the target data set is fine-tuned. This method always performs better than when only training the model on the target data set owing to the knowledge learned in the big data set. It is a common method in image tasks when data are limited and can also be applied to other domains.
3 Proposed Model
3.1 Normalization Improvement
Suppose the input data dimension is (N, C, H, W), then batch normalization is performed on the channel of N. However, due to the capacity of the graphics cards, N is generally not very large to keep fast inference speed, which may result in poor batch normalization. On the other hand, group normalization is performed on the channel of C. Generally, C may reach a value of 128 or 256, or even greater within the network, so it will not adversely affect the result of normalization. Group normalization is performed on the channel dimension, and therefore group normalization can solve the problem of poor performance when batch normalization is used with small batches. This is the reason why this article uses group normalization in PointNet++ to replace the original batch normalization to improve its accuracy.
The calculation process of group normalization is as follows:
1) Different from batch normalization, group normalization first groups different channels and normalizes each group:
The meaning of
2) After the grouping, the process of group normalization is similar to batch normalization, assuming that the input vector in the same group is:
3) First the mean value of the input vector in the entire group
4) Then the variance
5) After obtaining the mean and variance, normalization can be performed:
6) Finally, the result of batch normalization can be obtained after the scaling of two trainable parameters
7) For the PointNet++ model using batch normalization, for the input point cloud
3.2 Proposed Model Structure
The proposed model uses PointNet++ as the basic model to improve. Group normalization is used to replace batch normalization, and the fully connected layer is replaced with several 1D convolutional layers. The network structure is shown in Figure 1, which contains two cascaded sampling modules with a feature extraction module, then the feature is fed to three cascaded 1D convolutional layers to get the final classification.
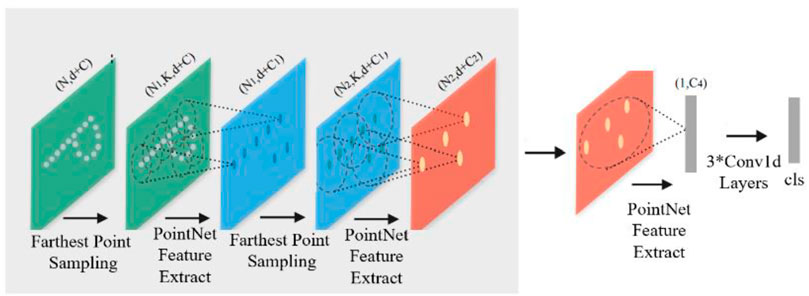
FIGURE 1. Diagram of the improved model.
Suppose the
4 Computational Analysis
4.1 Data Set Description and Model Pretraining
The deep learning model is a data-driven model. Because of the small amount of power equipment data, it is necessary to pretrain on a large public data set first, and then fine-tune on the collected power equipment data set. The public data set ModelNet40 is used to pretrain the model. ModelNet40 was released in 2015, containing 3D models of 40 categories (including computers, bottles, airplanes, etc.). Figure 2 shows some examples of ModelNet40. This data set is collected by the Princeton Vision and Robotics Laboratory. It is often used to evaluate point cloud deep learning models for semantic segmentation, instance segmentation, and classification.
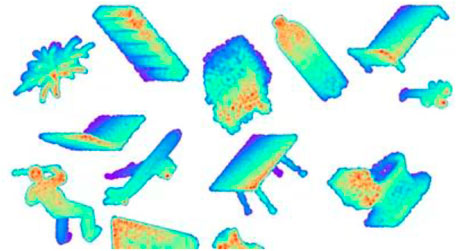
FIGURE 2. Point cloud examples of ModelNet40.
ModelNet40 contains a total of 12,311 point cloud models, each of which includes three models which have 512, 1024, or 2048 points. Among them, there are 9843 point cloud models in the training set, and the remaining 2468 point cloud models are divided into test sets. The improved PointNet++ model is pretrained using point clouds with a single model point cloud number of 1024.
The pretraining is based on the Ubuntu 18.04 platform, the graphics card model is 16 GB Telsa T4, and the PyTorch (Paszke et al., 2019) version is 1.6.
The training parameters are configured as follows. The training epochs are set to 200, the batch size is 24, and the initial learning rate is 0.001. After every 20 rounds, the learning rate decays to 0.7 times. The optimizer is the Adam optimizer (Kingma and Ba, 2014), and the momentum parameter is set to 0.9, and the L2 decay is set to 0.0001.
After 200 epochs of training, the accuracy of the model on ModelNet40 reaches 92.9% at the instance level, and the average accuracy on the class is 90.7%. Subsequent experiments are fine-tuned on this pretrained model. The comparison of the results between our model and previous networks is shown in Table 1.
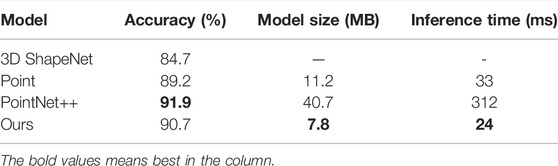
TABLE 1. Results comparison on ModelNet40.
4.2 Transmission Line Point Cloud Data Set
The RS-Ruby laser radar of Sagitar can be used to collect the point cloud data of the transmission line. Using CloudCompare point cloud processing software, cloud points of the transmission line are collected by the laser radar and can be segmented and marked as different types. Figure 3 shows the point cloud distribution of the transmission line data set.
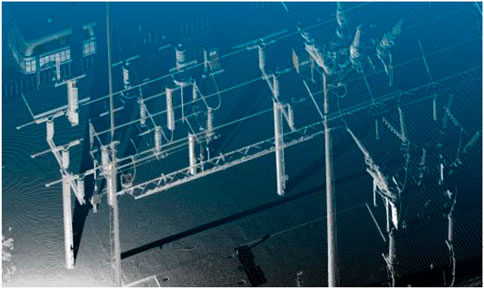
FIGURE 3. Point cloud of transmission lines.
In this article, four commonly used categories of transmission lines: transmission lines, transmission towers, ground, and vegetation are segmented and labelled, and a labelled data set with 343 instances was obtained. Figure 4 shows some examples of the transmission line data set. The number of labelled instances of each type of equipment is shown in Table 2.
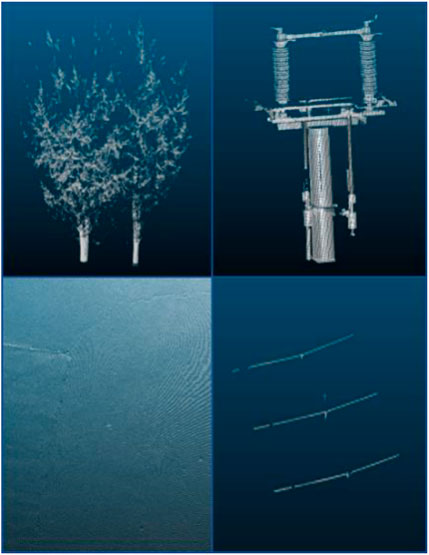
FIGURE 4. Examples of the transmission line point cloud data set.
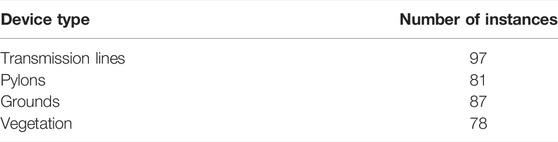
TABLE 2. Distribution of transmission line point cloud data set.
The transmission line point cloud data set is divided by random selection, 80% of which is used for training on the basis of the pretrained PointNet++, and the rest is used for testing.
4.3 Fine-Tune Results
First, the proposed model with batch normalization is trained. The training parameter configuration is as follows: the training epochs are set to 100, the batch size is 24, the initial learning rate is 0.001, the initial 10 rounds learning rate linearly rises from 0 to 0.001, and after this, the learning rate decays to 0.99 times in each round. The optimizer uses the SGD optimizer, the momentum is set to 0.9, and the L2 decay is set to 0.0001. After 100 epochs of training, the accuracy of the model on the transmission line point cloud data set reached 94.9%.
In the case of limited computing power, the proposed model with group normalization was also trained to compare between two normalization methods. The training parameters are the same as before except the batch size is set to 2. After 100 rounds of training, the accuracy of the model on the transmission line point cloud data set reached 92.4%.
It can be seen from the results shown in Table 3 that the recognition accuracy is also affected due to the limited computing power. Analyzing the model structure, it can be found that when the batch size is reduced, the number of participants in the batch normalization at the same time is decreased, which leads to the loss of training accuracy. Through group normalization, only in the normalization process, the advantage of being affected by the number of channels, not related to the batch size, improves the normalization effect of the model, thereby improving the performance of the model.
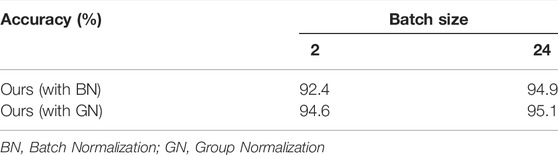
TABLE 3. Classification accuracy when computing power is enough or not enough.
To show the effectiveness of the proposed model, we also tried PointNet and PointNet++ in our transmission lines data set when the batch size was 24, and the results are shown in Table 4. The results show that the proposed model can achieve a similar accuracy with PointNet++ while having a faster inference speed and smaller model size.
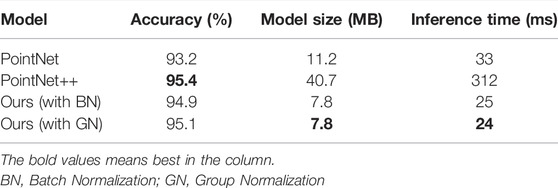
TABLE 4. Results comparison on transmission line data set.
4.4 Ablation Study
Using the same training parameters as the previous training, the training batch size was only changed and the experiments were performed when the batch sizes were 2, 4, and 8; the experimental results are shown in Table 5. It can be seen from the table that when the batch size becomes smaller, the model accuracy of the batch normalization method decreases. As the batch size increases, the model accuracy also increases; while the accuracy with group normalization method is stable, leading to more suitable scenarios where the computing power of the device is limited. And even when the batch size is 2, the accuracy achieved can be 94.6, which is not much smaller than 95.4 that PointNet++ achieves when the batch size is 24.
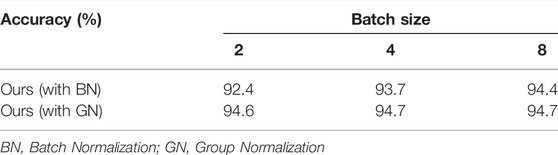
TABLE 5. Classification accuracy with different normalization methods and batch size.
Figure 5 shows the visualized results of the part of our transmission lines data sets. It can be seen that the transmission lines and pylons are classified well. And if more data are collected, the vegetation and grounds can also be classified better.
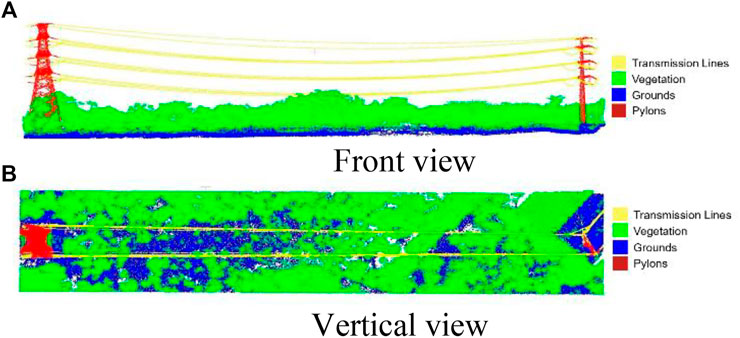
FIGURE 5. Visualized classification results. (A) Front view. (B) Vertical view.
5 Conclusion
In this article, point cloud data of the transmission line are collected by laser radar and are labeled to four point cloud categories. Due to less cloud data of the transmission line, the transfer learning method is used during training. First, the ModelNet40 data set is used to pretrain the improved PointNet++, and then the data of the transmission line is used to fine-tune the pretrained network to realize the classification of the point cloud of the transmission line. The experimental results show that when the batch size is small, the improved PointNet++ model proposed in this article can effectively classify the point cloud of the transmission line.
In the case of limited computing power and the batch size being small, the model classification accuracy will be impaired. This article proposes to use group normalization instead of batch normalization to improve the classification accuracy. Experiments show that group normalization improves the accuracy of the model when the batch is small, and it is not limited by the batch size during model training when compared with batch normalization. The point cloud classification and recognition model based on group normalization has an accuracy of 94.9% for the point cloud classification of the transmission lines, which can effectively classify the point cloud of the transmission line.
Data Availability Statement
The data sets presented in this study can be found in online repositories. The names of the repository/repositories and accession number(s) can be found in the article/supplementary material.
Author Contributions
ZY and SW prepared the transmission lines data set. XZ and JD wrote the original draft. ZY and SJ contributed to the study method and result analysis. All authors have read and agreed to the published version of the manuscript.
Funding
This research is supported by the Science and Technology Project of the State Grid Zhejiang Electric Power Company (5211UZ190057).
Conflict of Interest
Authors YZ, JS, ZX, DJ, YW, and WS were employed by the State Grid Huzhou Power Supply Company.
Publisher’s Note
All claims expressed in this article are solely those of the authors and do not necessarily represent those of their affiliated organizations, or those of the publisher, the editors, and the reviewers. Any product that may be evaluated in this article, or claim that may be made by its manufacturer, is not guaranteed or endorsed by the publisher.
References
Awrangjeb, M., Jonas, D., and Zhou, J. (20172017). “An Automatic Technique for Power Line Pylon Detection from point Cloud Data,” in International Conference on Digital Image Computing: Techniques and Applications (DICTA), Sydney, NSW, Australia, 29 Nov.-1 Dec. 2017 (IEEE), 1–8. doi:10.1109/dicta.2017.8227407
Chan, W., Jaitly, N., Le, Q. V., and Vinyals, O. (2015). Listen, Attend and Spell. arXiv preprint arXiv:1508.01211.
Chen, C., Yang, B., Song, S., Peng, X., and Huang, R. (2018). Automatic Clearance Anomaly Detection for Transmission Line Corridors Utilizing UAV-Borne LIDAR Data. Remote Sensing 10 (4), 613. doi:10.3390/rs10040613
Devlin, J., Chang, M. W., Lee, K., and Toutanova, K. (2018). Bert: Pre-training of Deep Bidirectional Transformers for Language Understanding. arXiv preprint arXiv:1810.04805.
He, K., Zhang, X., Ren, S., and Sun, J. (2016). “Deep Residual Learning for Image Recognition,” in In Proceedings of the IEEE conference on computer vision and pattern recognition, Las Vegas, NV, USA, 27-30 June 2016 (IEEE), 770–778.doi:10.1109/CVPR.2016.90
Huang, F., Yang, H., Tan, X., Peng, S., Tao, J., and Peng, S. (2020). Fast Reconstruction of 3D Point Cloud Model Using Visual SLAM on Embedded UAV Development Platform. Remote Sensing 12 (20), 3308. doi:10.3390/rs12203308
Ioffe, S., and Szegedy, C. (2015). “Batch Normalization: Accelerating Deep Network Training by Reducing Internal Covariate Shift,” in In International conference on machine learning, July 2015 (PMLR), 448–456.
Kingma, D. P., and Ba, J. (2014). A Method for Stochastic Optimization. arXiv preprint arXiv:1412.6980.
Li, R., Li, X., Heng, P. A., and Fu, C. W. (2020). “Pointaugment: an Auto-Augmentation Framework for point Cloud Classification,” in In Proceedings of the IEEE/CVF Conference on Computer Vision and Pattern Recognition, 6378–6387.
Li, W., Wang, F.-D., and Xia, G.-S. (2020a). A Geometry-Attentional Network for ALS point Cloud Classification. ISPRS J. Photogrammetry Remote Sensing 164, 26–40. doi:10.1016/j.isprsjprs.2020.03.016
Li, X., Li, Z., Wang, H., and Li, W. (2021). Unmanned Aerial Vehicle for Transmission Line Inspection: Status, Standardization, and Perspectives. Front. Energ. Res. 9, 336. doi:10.3389/fenrg.2021.713634
Ma, Y., Li, Q., Chu, L., Zhou, Y., and Xu, C. (2021). Real-time Detection and Spatial Localization of Insulators for UAV Inspection Based on Binocular Stereo Vision. Remote Sensing 13 (2), 230. doi:10.3390/rs13020230
Munir, N., Awrangjeb, M., Stantic, B., Lu, G., and Islam, S. (2019). Voxel-based Extraction of Individual Pylons and Wires from Lidar point Cloud Data. ISPRS Ann. 4, 91–98. doi:10.5194/isprs-annals-IV-4-W8-91-2019
Niemeyer, J., Rottensteiner, F., and Soergel, U. (2012). Conditional Random Fields for Lidar Point Cloud Classification in Complex Urban Areas. ISPRS Ann. Photogramm. Remote Sens. Spat. Inf. Sci. I-3 (3), 263–268. doi:10.5194/isprsannals-i-3-263-2012
Paszke, A., Gross, S., Massa, F., Lerer, A., and Bradbury, J. (2019). Pytorch: An Imperative Style, High-Performance Deep Learning Library. Adv. Neural Inf. Process. Syst. 32, 8026–8037. arXiv:1912.01703
Qi, C. R., Su, H., Mo, K., and Guibas, L. J. (2017a). “Pointnet: Deep Learning on point Sets for 3d Classification and Segmentation,” in In Proceedings of the IEEE conference on computer vision and pattern recognition, 652–660.
Qi, C. R., Yi, L., Su, H., and Guibas, L. J. (2017b). Pointnet++: Deep Hierarchical Feature Learning on point Sets in a Metric Space. arXiv preprint arXiv:1706.02413.
Qin, X., Wu, G., Lei, J., Fan, F., Ye, X., and Mei, Q. (2018). A Novel Method of Autonomous Inspection for Transmission Line Based on cable Inspection Robot Lidar Data. Sensors 18 (2), 596. doi:10.3390/s18020596
Santurkar, S., Tsipras, D., Ilyas, A., and Mądry, A. (2018). “How Does Batch Normalization Help Optimization,” in In Proceedings of the 32nd international conference on neural information processing systems, December 2018.
Szegedy, C., Ioffe, S., Vanhoucke, V., and Alemi, A. A. (2017). “Inception-v4, Inception-Resnet and the Impact of Residual Connections on Learning,” in In Thirty-first AAAI conference on artificial intelligence, San Francisco, CA, February 4-9, 2017 (San Francisco: AAAI Press). doi:10.5555/3298023.3298188
Teng, G. E., Zhou, M., Li, C. R., Wu, H. H., Li, W., Meng, F. R., et al. (2017). Mini-uav Lidar for Power Line Inspection. Int. Arch. Photogramm. Remote Sens. Spat. Inf. Sci. XLII-2/W7, 297–300. doi:10.5194/isprs-archives-xlii-2-w7-297-2017
Vaswani, A., Shazeer, N., Parmar, N., Uszkoreit, J., and Jones, L. (2017). “Attention Is All You Need,” in 31st Conference on Neural Information Processing Systems (NIPS 2017), 5998–6008.
Wang, Z., Zhang, L., Fang, T., Mathiopoulos, P. T., and Tong, X. (2014). A Multiscale and Hierarchical Feature Extraction Method for Terrestrial Laser Scanning point Cloud Classification. IEEE Trans. Geosci. Remote Sensing 53 (5), 2409–2425. doi:10.1109/TGRS.2014.2359951
Watanabe, S., Hori, T., Kim, S., Hershey, J. R., and Hayashi, T. (2017). Hybrid CTC/attention Architecture for End-To-End Speech Recognition. IEEE J. Sel. Top. Signal. Process. 11 (8), 1240–1253. doi:10.1109/jstsp.2017.2763455
Wu, Y., and He, K. (2018). “Group Normalization.” in Proceedings of the European conference on computer vision (ECCV), 3–19.
Wu, Z., Song, S., Khosla, A., Yu, F., Zhang, L., Tang, X., et al. (2015). “A Deep Representation for Volumetric Shapes,” in In Proceedings of the IEEE conference on computer vision and pattern recognition, Boston, MA, USA, 7-12 June 2015 (IEEE), 1912–1920.
Yao, Y., Jun-Hua, C., Yi, G., Zhun, F., An-Min, Z., Biao, X., et al. (2021). Autonomous Control Method of Rotor UAVs for Power Inspection with Renewable Energy Based on Swarm Intelligence. Front. Energ. Res. 9, 229. doi:10.3389/fenrg.2021.697054
Zhang, Y., and Rabbat, M. (2018). “A Graph-Cnn for 3d point Cloud Classification,” in IEEE International Conference on Acoustics, Speech and Signal Processing (ICASSP), Calgary, AB, Canada, 15-20 April 2018 (IEEE), 6279–6283.doi:10.1109/ICASSP.2018.8462291
Zhang, Z., Zhang, L., Tong, X., Mathiopoulos, P. T., Guo, B., Huang, X., et al. (2016). A Multilevel point-cluster-based Discriminative Feature for ALS point Cloud Classification. IEEE Trans. Geosci. Remote Sensing 54 (6), 3309–3321. doi:10.1109/tgrs.2016.2514508
Keywords: group normalization, PointNet++, ModelNet40, batch normalization, point cloud of transmission line
Citation: Yin Z, Ji S, Zhang X, Dai J, Yu W and Wu S (2022) Classification Model of Point Cloud Along Transmission Line Based on Group Normalization. Front. Energy Res. 10:839273. doi: 10.3389/fenrg.2022.839273
Received: 19 December 2021; Accepted: 14 February 2022;
Published: 09 May 2022.
Edited by:
Zaibin Jiao, Xi’an Jiaotong University, ChinaReviewed by:
Xinyu Liu, Fuzhou University, ChinaKeyu Wu, Institute for Infocomm Research (A∗STAR), Singapore
Copyright © 2022 Yin, Ji, Zhang, Dai, Yu and Wu. This is an open-access article distributed under the terms of the Creative Commons Attribution License (CC BY). The use, distribution or reproduction in other forums is permitted, provided the original author(s) and the copyright owner(s) are credited and that the original publication in this journal is cited, in accordance with accepted academic practice. No use, distribution or reproduction is permitted which does not comply with these terms.
*Correspondence: Zhimin Yin, aGZoeGJoamQxMjNAMTYzLmNvbQ==