- 1King Abdulaziz City for Science and Technology, Riyadh, Saudi Arabia
- 2School of the Earth, Ocean, and Environment, University of South Carolina, Columbia, SC, United States
- 3Boone Pickens School of Geology, Oklahoma State University, Stillwater, OK, United States
This study builds and expands on previous CO2 storage resource assessment studies of the southeastern offshore Atlantic margin by providing a detailed evaluation on how rock porosities and permeabilities are distributed across the Upper Cretaceous strata restricted to the South Georgia Embayment (SGE). Using legacy industry two-dimensional seismic reflection and well data, this assessment is the first application of multiple seismic inversion techniques in this area. This workflow provides a reliable and repeatable model-based inversion which gives an improved image to discriminate lithology and predict porosity. The workflow is applicable to future CO2 storage resource assessment studies elsewhere. The inversion results indicate that distinct porosity and permeability regimes are present and distributed in the Upper Cretaceous strata within the SGE. The impedance and porosity relationships show well-founded and reliable correlation. These relationships reveal low impedance coincident to the high porosity intervals which are proposed as potential reservoir intervals for CO2 storage. In addition, the result shows that the Upper Cretaceous strata have two main potential reservoirs in the lower part. These are overlain by a thick impermeable interval, mostly shale, which has high impedance, low porosity, and low permeability and extends within the SGE. This result is in agreement with a previous study that also proposed two significant storage reservoirs for CO2 in the Upper Cretaceous strata. Since porosity distribution is estimated using multiple methods, it follows the trends of seismic signature and structures of the Upper Cretaceous strata. The extracted values of porosity, ranging from 15 to 36%, and permeability, ranging from 1 to 100 mD, are close to the measured values from the well core data at the Upper Cretaceous strata interval.
Introduction and Objectives
The United States Environmental Protection Agency estimates that about 40% of the anthropogenic CO2 emissions in the United States are generated in the southeastern United States. This contribution is about 1,444 million metric tons of CO2 (Litynski et al., 2008). Given that viable solutions are not yet available to reduce CO2 emissions, the United States Department of Energy has been funding several efforts to study the feasibility of CO2 storage as a long-term mitigation strategy. The Southeast Offshore Storage Resource Assessment (SOSRA) research project is funded by the United States Department of Energy and is tasked with assessing the offshore for CO2 storage efficacy. Although the storage capacity of offshore reservoirs is expected to be substantial, and despite having a number of important advantages over onshore sites, no comprehensive assessment of the offshore storage capacity in the southeastern United States has been performed (Orr, 2009). Smyth et al. (2008) considered that two potential CO2 reservoirs are present in the geologic strata below the Atlantic seafloor in the Upper and Lower Cretaceous layers. The research and assessment for the South Eastern portion of the SOSRA project is divided based on the geologic age of the reservoir formation under study. Therefore, this article focuses on the development of offshore prospective storage resource assessment of the Upper Cretaceous section at the Southeast Georgia Embayment (SGE; Figure 1) where the storage capacity in the Upper Cretaceous strata is estimated to be around 9 GT (Almutairi et al., 2017).
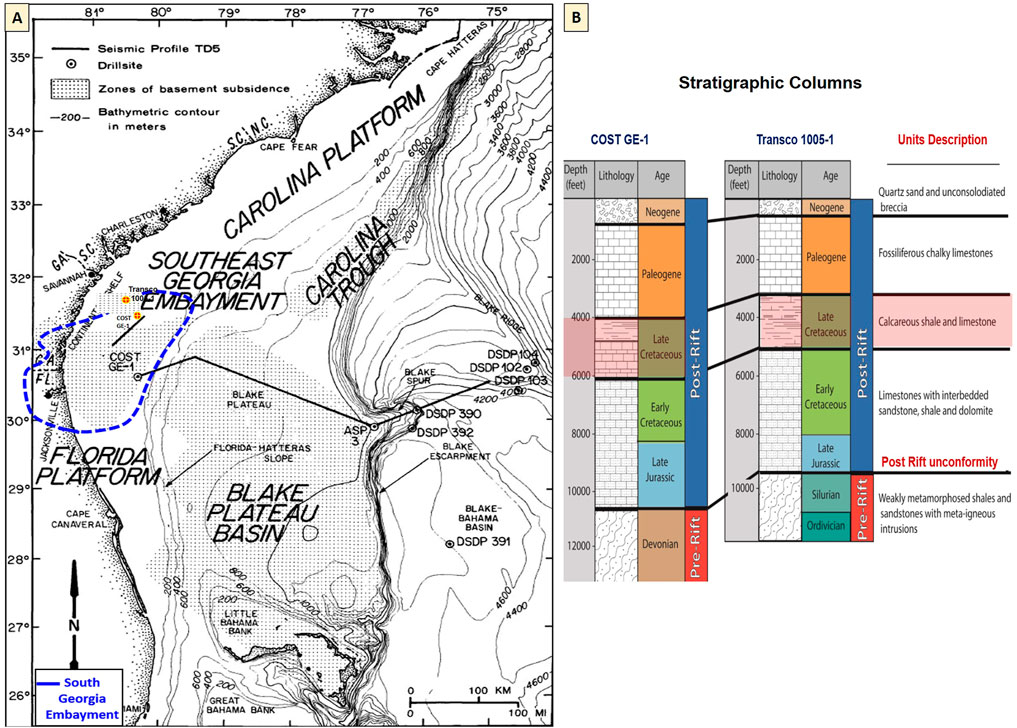
FIGURE 1. (A) Location map showing the main regional geologic provinces within the offshore areas considered for potential storage of CO2, modified from Smyth et al. (2008) and Dillon et al. (1976). (B) Stratigraphic columns and lithology description at COST GE-1 and Transco 1005-1 wells located at Southeast Georgia embayment, modified from Pollack (2014). (C) measured core porosity at COST GE-1 well.
Supercritical conditions are required for CO2 storage which means that CO2 is at its thermodynamic critical point [temperatures exceeding 88.3°F (31.1°C) and pressures exceeding 72.9 atmospheres] (NETL, 2015). At depths of 2,625 ft (800 m) or greater, CO2 can be sequestered underground as a supercritical fluid which has properties of both gases and liquids (NETL, 2015). Liquids at reservoir conditions, such as good porosity and permeability, occupy a much smaller volume than their gaseous state at atmospheric conditions thus providing a more effective exploitation of the underground storage space and improving storage security (IEA, 2007; 2008). At sufficient depths, 2,625–8,200 ft. (800–2,500 m), CO2 is more like a liquid than a gas, and its density is closer to the density of some crude oils. In this case, since CO2 is less dense than saline water and the buoyant forces will drive CO2 upward within the geologic formations, CO2 accumulates within a porous reservoir when a cap seal is reached (NETL, 2015). In our study area, the CO2 geological storage reservoirs within the Upper and Lower Cretaceous strata are deep saline formations. The Upper Cretaceous strata can be qualified for CO2 storage based on the geological criteria those include 1) sufficient reservoir porosity (more than 20% is preferable, and not less than 10%), 2) sufficient reservoir permeability, that is, ∼200 millidarcy (mD), 3) reservoir properties (reservoir, seal, areal extent, depth greater than 2,625 ft, and net reservoir thickness of 164 ft) (Chadwick et al., 2008), 4) temperature, pressure, salinity, uniform stratigraphy, and seal integrity, 5) a trapping mechanism (overlying cap rock or seal) that is essential to prevent the vertical migration of CO2 into overlying freshwater aquifers, 6) cap-rock efficacy including lateral continuity, no leaky faults, and capillary entry pressure, and 7) cap-rock thickness (328 ft is preferable, not less than 65 ft) (Chadwick et al., 2008; Eiken et al., 2011).
This research has several objectives with the goal of providing an exhaustive subsurface evaluation for CO2 geologic storage of the Upper Cretaceous section within the SGE. The main objectives are to 1) discriminate strata by lithology, 2) extract porosity from seismic data, 3) understand the porosity and permeability regimes for the Upper Cretaceous strata within the SGE by implementing acoustic impedance (AI) inversion techniques, and 4) identify strata and units containing potential reservoirs and seals with the areal extent in Upper Cretaceous age. Several hypotheses were proposed to achieve the research objectives. These are 1) Upper Cretaceous formations at the SGE have the potential for at least 9 GT of CO2 storage capacity, 2) the Upper Cretaceous potential reservoir is overlain by a low-permeability seal layer with sufficient depth for CO2 sequestration, 3) layers with significant porosity and permeability are present and widely distributed in the Upper Cretaceous section of the SGE, and 4) multiples and noise sources were taken into consideration when data were processed since the inversion interprets all reflections in the seismic activity as geologic changes.
However, Smyth et al. (2008) recognized that two potential CO2 reservoirs exist along the length of the Atlantic continental shelf and are overlain by low-permeability layers. In our study area, SGE is possibly a good candidate for CO2 storage for many reasons. It has thick sediments, overlain by a thick impermeable interval (Amato and Bebout, 1978). In addition, some conditions are met by SGE including stratigraphic traps and sufficient depths and thicknesses (Scholle, 1979). Moreover, temperature and pressure gradients meet the supercritical condition at a shallow depth, 2000 ft. (∼610 m). In addition, the exploratory wells concentrated at SGE provide useful geological information for CO2 assessment.
Five research questions are proposed: 1) to what extent does the Upper Cretaceous strata extend offshore beneath the continental shelf? 2) Does this reservoir have distinct porosity and permeability regimes? 3) Does the Upper Cretaceous strata have the potential for significant CO2 storage capacity? 4) Is the Upper Cretaceous potential storage overlain by a low-permeability seal layer? and 5) What are the spatial extents of the prospective reservoirs and seals?
Background
Geologic Setting
The offshore area of the southeastern United States has a complex geology (Poag, 1978). The latest collisional event of Laurentia and Gondwana occurred at the end of the Paleozoic (Alleghenian Mountains). The continental rifting then began in the Early Mesozoic as part of the breakup of the supercontinent Pangea. Locally, this involved tectonic subsidence in restricted extensional basins followed by thermal subsidence along the Eastern North American margin (Dillon and Popenoe, 1988). Generally, stratigraphic sequences on this passive margin are characterized by extensive lateral continuity and relatively minor structural disruption (Poag, 1985a). There is a regional unconformity under the post-rift sediments known as the “post rift unconformity” that cuts the entire region after rifting between Africa and North America ceased and marks the transition to widespread sediment deposition during the “drift” stage (Poag, 1985a). The oldest post-rift sediments are in Jurassic age and the product of rapid clastic sedimentation from erosion followed through a period of evaporite deposition and subsequent initiation of widespread shallow water carbonate deposition with some terrigenous input (Dillon and Popenoe, 1988). Geophysical and stratigraphic studies suggest that the Jurassic section thickness is at least 24,600 ft in the basins and thickens seaward (Dillon et al., 1979). The Cretaceous section in the north is characterized by more clastic sedimentation, whereas more carbonate deposition is found in the south, forming a large carbonate platform over the Blake Plateau and offshore Florida (Scholle, 1979). In Upper Cretaceous, the Suwanee Straits provided clastic sedimentation to the Blake Plateau creating a distinct facies province change to the neighboring offshore Florida and Bahamas carbonate platforms. Strong paleo-currents controlled the sedimentation in large portions of the offshore region from the Upper Cretaceous to the Cenozoic. The Gulf Stream provides strong erosive power responsible for the lack of significant Paleogene sediments on the Blake Plateau and prevented deposition off the Florida–Hatteras slope, where it continues to the north along the shelf edge (Pinet and Popenoe, 1985). The major sedimentary deposits from the north to south (Figure 1A) include the Carolina Trough, the SGE, and the Blake Plateau Basin, which range in sediment column thicknesses from 9,850 to 23,000 ft (Maher and Applin, 1971).
This study focuses on the SGE which is a broad depression plunging eastward from the Atlantic Coastal Plain (Figure 1A). It is a major structural feature of the Florida–Hatteras Shelf and is considered a minor sedimentary geologic unit compared to the other sedimentary basins in the region (Book, 1982). The SGE represents a transitional zone between a predominantly clastic depositional province north of Cape Hatteras and a carbonate province which includes Florida and the Bahamas. Based on cores recovered from the COST GE-1 well (Figure 1B; Amato, 1978), Paleozoic rocks sit in the embayment at a depth of ∼10,560 ft and are overlain by probable Jurassic nonmarine clasts (rocks fragments), dolomites, coal, and anhydrite (Edgar, 1981). This sedimentary sequence continued throughout the Mesozoic until carbonate sedimentation took over in the Cretaceous. Sedimentation in the SGE is still likely ongoing today (Dillon et al., 1975; Book, 1982). The lithology in the COST GE-1 well has two main intervals: 1) the depth interval from 3,300 to 4,600 ft, which includes Upper Cretaceous, Paleocene, and lower Eocene and consists of limestone and calcareous shales, and 2) the depth interval from 4,600 to 7,200 ft consists of limestone and dolomites interbedded with sandstones. Existing carbonate-cemented, feldspathic, and glauconitic sandstones at a depth of 5,800 ft indicate a major regression between the shallow-water restricted-shelf carbonates and the overlying fine-grained open-marine limestones. In more detail, the depth interval from about 5,700 to 7,200 ft contains a varied shallow marine sequence of generally medium grained calcarenites, dolomite, and anhydrite with significant amounts of quartz sandstone, pyrite and glauconite. The common rock types include oolites, fossiliferous calcarenites, dolomite, micrite and anhydrite (Scholle, 1979).
Geophysical Data
The geophysical data used for this analysis include two-dimensional (2D) multichannel seismic reflection data collected on the Atlantic Margin in the late 1970s as part of a geophysical and geological exploration of oil and gas prospects on the United States Outer Continental Shelf. The seismic data, ID E08-76, was acquired by the United States Bureau of Ocean Energy Management. In addition, there are seven exploratory wells with a variety of geophysical logs in our study area (Figure 2). Three wells have the digital logs necessary to implement AI inversion and conduct integration with seismic data (Table 1); the others have reports. All the depth references in this article are based on Kelly Bushing (KB).
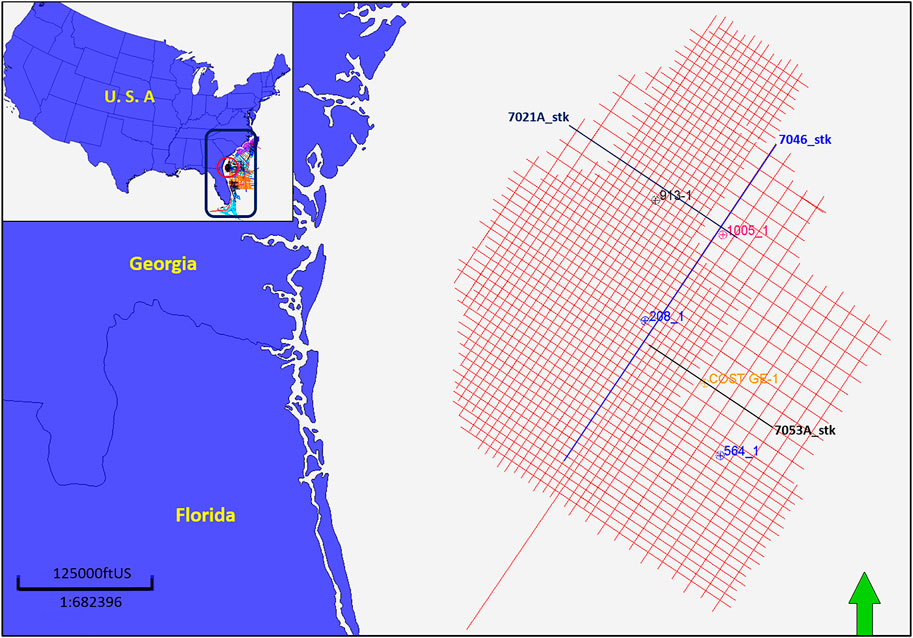
FIGURE 2. Location map of seismic survey and exploratory wells within the Southeast Georgia Embayment (SGE). Seismic lines used in the acoustic inversion analysis are in bold.
Methodology and Data Analysis
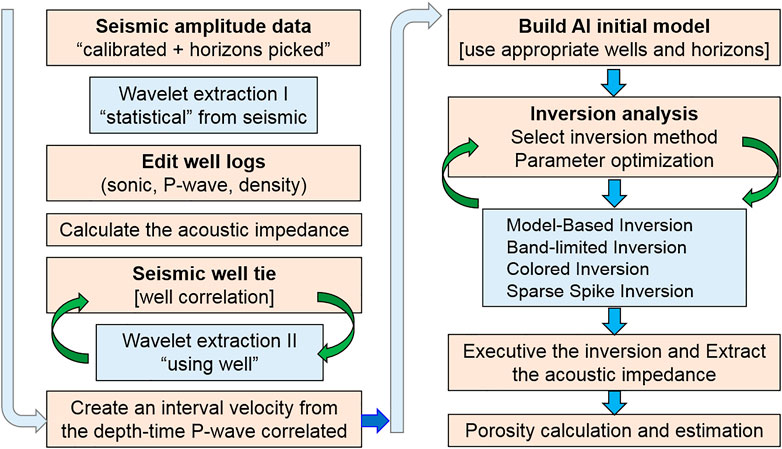
AI, a product of rock density and compressional velocity, is used as an indicator of lithology and porosity. AI, and lithology and porosity have been previously shown important for CO2 storage assessment (Veeken, 2007; Alshuhail et al., 2009) to provide a more geology-like image than the conventional seismic section. More specifically, the reflectivity coefficient on the conventional seismic section captures the layer interfaces while the AI, a layer-based property, focuses on the material properties of the layers (Schlumberger, 2017). However, extracting AI properties from seismic data requires seismic inversion. This requires converting seismic reflection amplitudes into impedance profiles (Alshuhail et al., 2009; CGG, 2016). The process involves removing the band-pass filter (wavelet) imposed by seismic acquisition and processing. In addition, it includes estimation of a background impedance model (low-frequency model), which incorporates well log data (P-wave and density) and interpreted horizons. Also, the process involves wavelet extraction and inversion analysis by synthetic seismogram and, finally, seismic inversion (Vukadin and Brnada, 2015; CGG, 2016) (Figure 3). In this study, a series of post-stack inversions were applied to the data in order to provide a most accurate AI model. They include colored, sparse-spike, band-limited, and model-based inversions. Figure 8 shows a comparison of all different inversion results.
Model-Based Inversion
Model-based inversion (MBI) starts with the convolutional theory which states that the wavelet can be convolved with the Earth’s reflectivity series to generate the seismic trace after addition of noise. MBI uses well control and seismic data (interpreted horizons) to build an initial low-frequency estimated model of the AI distribution (Maurya and Sarkar, 2016). Using an estimate of the source wavelet, the model response in the form of synthetic seismograms is then compared to the actual seismic traces, usually by means of cross correlation. This process is iterated several times until the model response error falls within the acceptable range that is determined by the difference between the synthetic traces calculated from the inversion and the original seismic composite trace (Lee, 2013; CGG, 2016). The MBI is implemented through the following workflow: 1) select a proper seismic line and extract the input wavelet (a critical step for a successful post stack inversion result), 2) select and correlate the well using the interpreted horizons, 3) build the initial model and apply inversion analysis, and 4) apply the inversion result to the multi-2D seismic lines.
Extract Wavelets
Two main steps were used to extract the proper wavelet:
1. Extract a Statistical Wavelet: a statistical wavelet (zero phase) is extracted using a nearby seismic line (Figure 4A). This involves correlating the initial synthetic seismogram with the seismic trace until getting a low correlation error percent. The algorithm extracts the wavelet amplitude spectrum by analyzing the autocorrelation of a group of traces within a selected time window that ranges from 400 to 1,500 ms. The required parameters for extracting the statistical wavelet were specified as sample rate (4 ms), wavelet length (200 ms), phase type: constant (zero phase), and taper length (25 ms). After creating the depth–time relationship, the sonic and density logs were used to create the reflectivity series which was convolved with the wavelet to generate the seismic synthetic trace from the well logs (Lee, 2013; CGG, 2016; Maurya and Sarkar, 2016).

FIGURE 4. Extract statistical wavelets: (A) using seismic line # 7021A and (B) using the 1005-1 well.
2. Extract a Wavelet from Wells: both available wells and near seismic data are used to extract another wavelet to correct the phase (Figure 4B). It extracts the wavelets by finding an operator which is convolved with reflectivity from the well. This extracts the actual wavelet phase from the data, but it is very sensitive to the correlation quality between well logs and seismic data (Lee, 2013; CGG, 2016).
Generate Synthetic Seismogram
The seismic forward modeling involves convolving the seismic reflectivity series R(t) calculated from the P-wave velocity and density well logs with the wavelet W(t) extracted from the seismic data at the well location (Figure 4B) to generate a synthetic seismic trace S(t) that is subsequently correlated with the real seismic trace (Figure 5). This procedure assumes that the well logs are accurate and the velocity varies only with depth. It is assumed that the geological structure is horizontal (Liner, 2004).
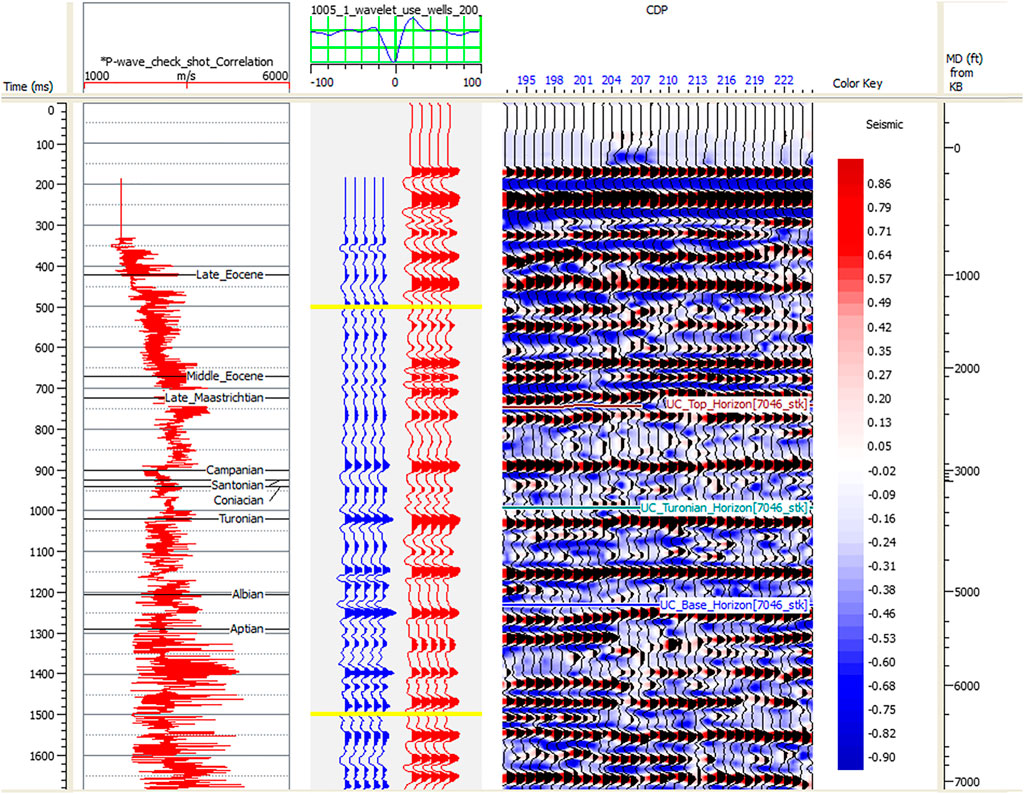
FIGURE 5. Seismic well correlation, achieved by matching events on the synthetic with the same events on seismic trace at the Transco 1005-1 well.
Seismic-Well Correlation
It is important to relate horizon tops identified in the wells with specific reflectors on the seismic data in order to provide AI values for the potential reservoir and seal intervals in order to estimate porosities. Therefore, seismic-well tie analysis has been conducted to compare well logs (measured in depth units), with seismic data (measured in time units), by creating a time–depth relationship using the sonic log and the check shots to improve and adapt the depth–time conversion. The correlation applied included 1) using key well tops to match peak–peak or trough–trough, 2) using bulk shift to tie synthetic to seismic or variable time shift to move and stretch two or more horizons, and 3) using the alignment points to make small adjustments between the synthetic and real seismic data (Cubizolle, et al., 2015; Figure 5).
Build Initial Model and Inversion Analysis
n more detail, the initial model of impedance is generated by using the P-wave impedance logs calculated from the sonic and density logs from the well log with a low-pass filter. This filter passes all frequencies up to 10 Hz, filters all frequencies above 15 Hz, and interpolates the filter between those limits (Lee, 2013; CGG, 2016). Then, a 2D impedance model is generated by interpolating the impedance at the well location using interpreted horizons to guide the interpolation (Figure 6A). The extrapolation at the top and bottom of the well log curve depends on compaction trends in the well. The program uses a least square fit to determine a trend to use for the top and bottom of the well. However, MBI analysis was performed initially at the location of the Transco 1005-1 and COST GE-1 wells to quality control (QC) the inversion results and optimize the inversion parameters properly. It runs on the target window that ranges from 400 to 1,600 ms and evaluates the efficacy of the inversion by comparing the impedance at the well with the impedance inverted from the seismic data for each initial model (Alshuhail, 2009; Lee, 2013; CGG, 2016; Maurya and Sarkar, 2016). Figure 6B shows a reasonable match between the inverted AI (in red) and the computed impedance from the well (in blue). The black curve indicates the low-frequency impedance extracted from the AI log. The synthetic traces are calculated from this inversion (in red) followed by the original seismic composite trace (in black; Figure 6B). The last track represents the error traces or the difference between the two previous results (a low correlation error percent).
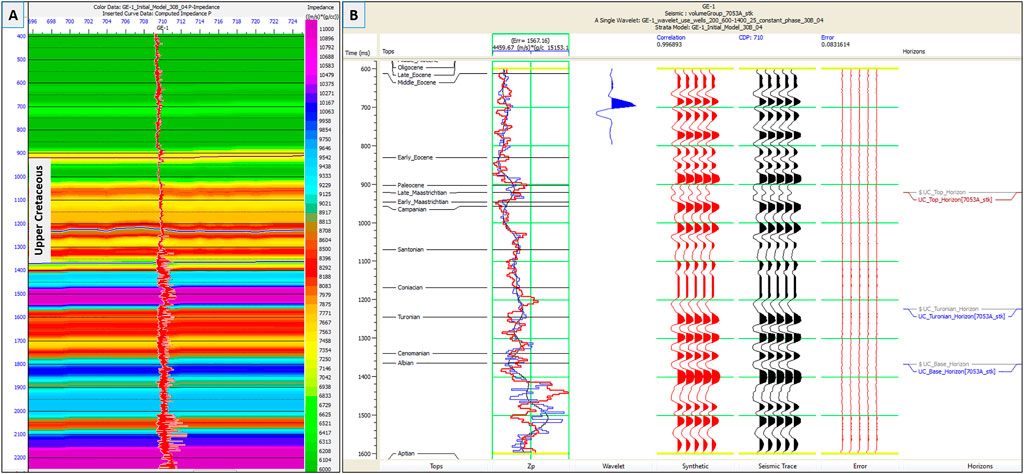
FIGURE 6. (A) Initial model for the acoustic impedance, and (B) post stack seismic inversion analysis results at the COST GE-1 well.
Porosity Analysis
Porosity and permeability distribution versus depth are critical factors to assess the Upper Cretaceous strata for CO2 storage. Here, porosity is calculated at the wells, extrapolated with QC to the available core data, and extracted from the AI as discussed below.
Using Density and Neutron Logs
Density logs provide a continuous record of the formation’s bulk density, which is a function of formation porosity, fluid content in the pore spaces, and matrix density (Asquith et al., 2004). It is commonly used to calculate porosity. However, the neutron log provides fluid-filled porosity and measures hydrogen concentration in a formation. Although sonic porosity logs are still used, the two predominant porosity measurements are density porosity and neutron porosity. Density tools emit medium-energy rays into a borehole wall. The gamma rays collide with electrons in the formation, lose energy, and scatter after successive collisions. The number of collisions is related to the number of electrons per unit volume, also called the electron density. The electron density for most minerals and fluids encountered in oil and gas wells is directly proportional to their bulk density,
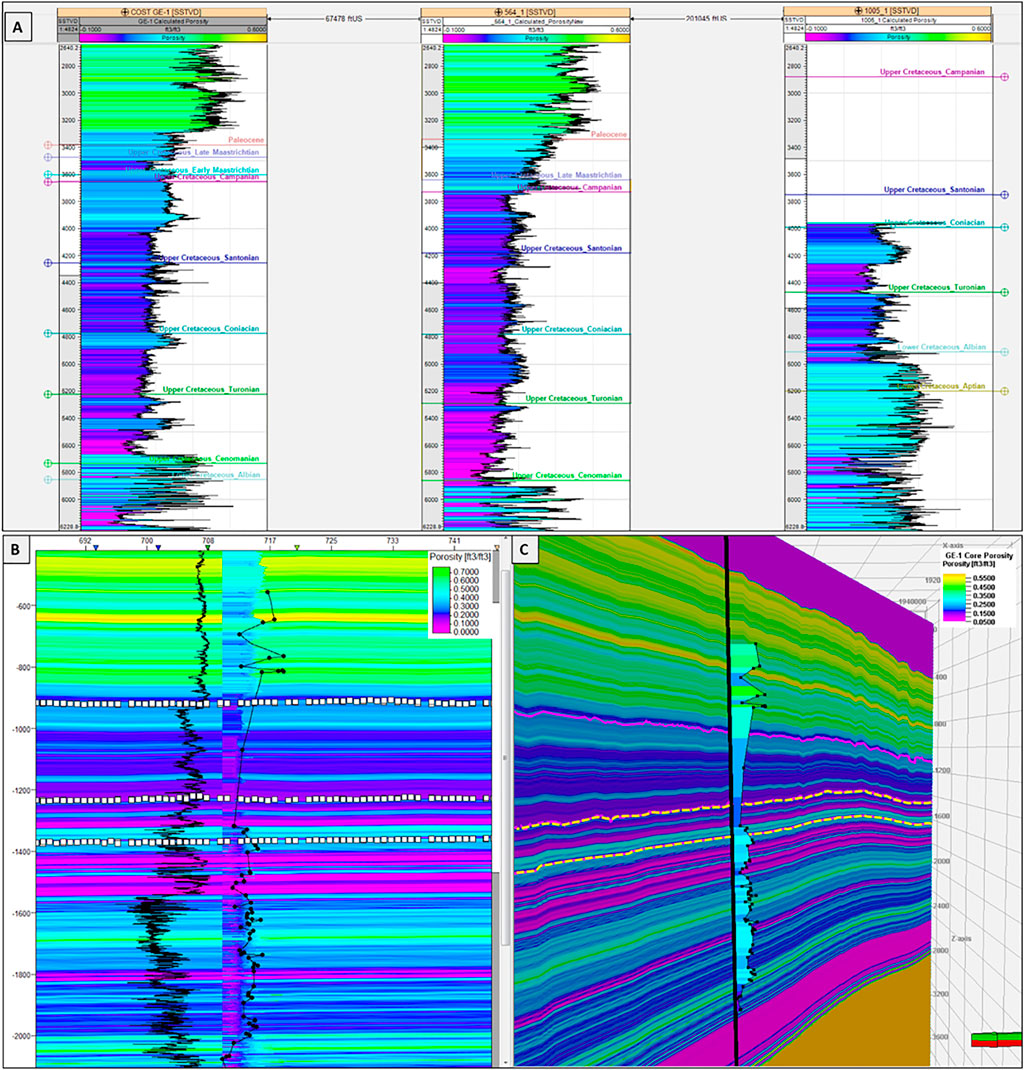
FIGURE 7. (A) Calculated porosity logs at COST GE-1, Exxon 564-1, and Transco 1005-1 wells. (B) Extrapolated porosity using inversion property builder at the well GE-1.
1. Using Density Porosity (Serra, 1984):
Here, formation bulk density
2. Using Neutron and Density (Gaymard and Poupon, 1968):
Here
Porosity Extrapolation
Another way to estimate porosity distribution is the derivative from simultaneous inversion. In this process, inversion property builder tools were used to provide a porosity model (Figures 7B,C) by involving the porosity log, the top and base of the horizons, and the AI as a guide model for geometry (Schlumberger, 2016; 2017). Since well logs provide critical information about geologic formations such as lithology discrimination and stratigraphy correlation, the gamma-ray log measures the natural radioactivity in different rocks and the overlaying porosity section (Figure 9A, thick line) to determine the shale strata interval. Shale has high radioactive elements which elevate the gamma-ray values (Asquith, 2004). However, the porosity measured from the core at the GE-1 well is matched to the inverted two-dimensional porosity section (Figures 7B,C) which is important for quality control.
Acoustic Impedance Inversion
AI inversion techniques were used to estimate the porosity from seismic data. The porosity indicated that the Upper Cretaceous strata at the SGE has two intervals at the Transco 1005-1 well. The first interval represents an impermeable seal which is the strata between the top of the Upper Cretaceous and the Turonian surface that gives high impedance (low porosity). The second strata represent the interval between the Turonian surface and the base of the Upper Cretaceous (Figure 8). It is suggested to be the significant reservoir for CO2 storage (Almutairi et al., 2017), since it has two main intervals with low impedance values which is a reflection of high porosity. However, these results are similar to the impedance inversion values in a different well (COST GE-1) which has two strata intervals within the potential reservoir (Figures 9, 10). In addition, the lowest impedance values are located where the highest porosity is and vice versa. It is correlated with the core’s porosity at different wells for quality control. Therefore, the AI inversion is a successful tool to discriminate lithology and estimate porosity when the proper workflow and analysis are implemented.
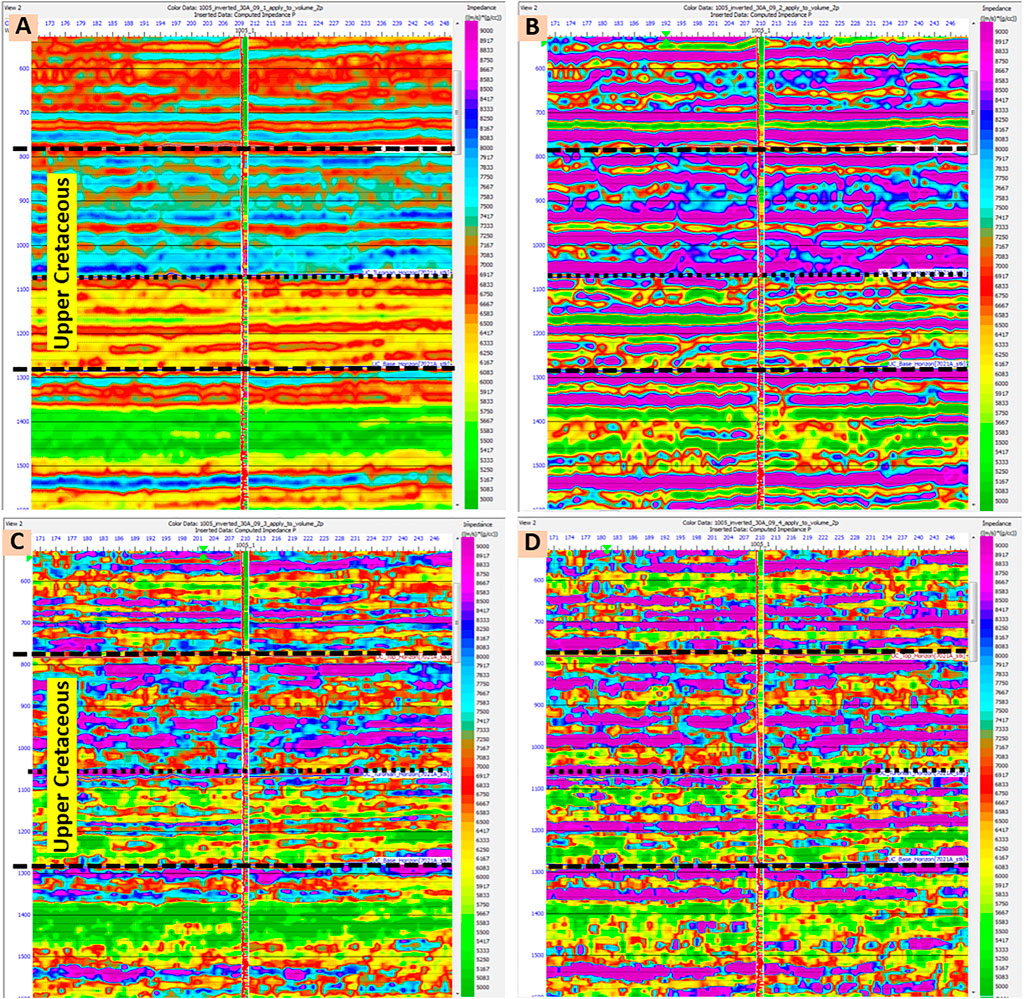
FIGURE 8. Comparison results of different post stack inversions that cover the Upper Cretaceous strata using seismic line # 7021A and the Transco 1005-1 well. (A) Bandlimited inversion, (B) colored inversion, (C) linear programing sparse spike, and (D) maximum likelihood sparse spike.
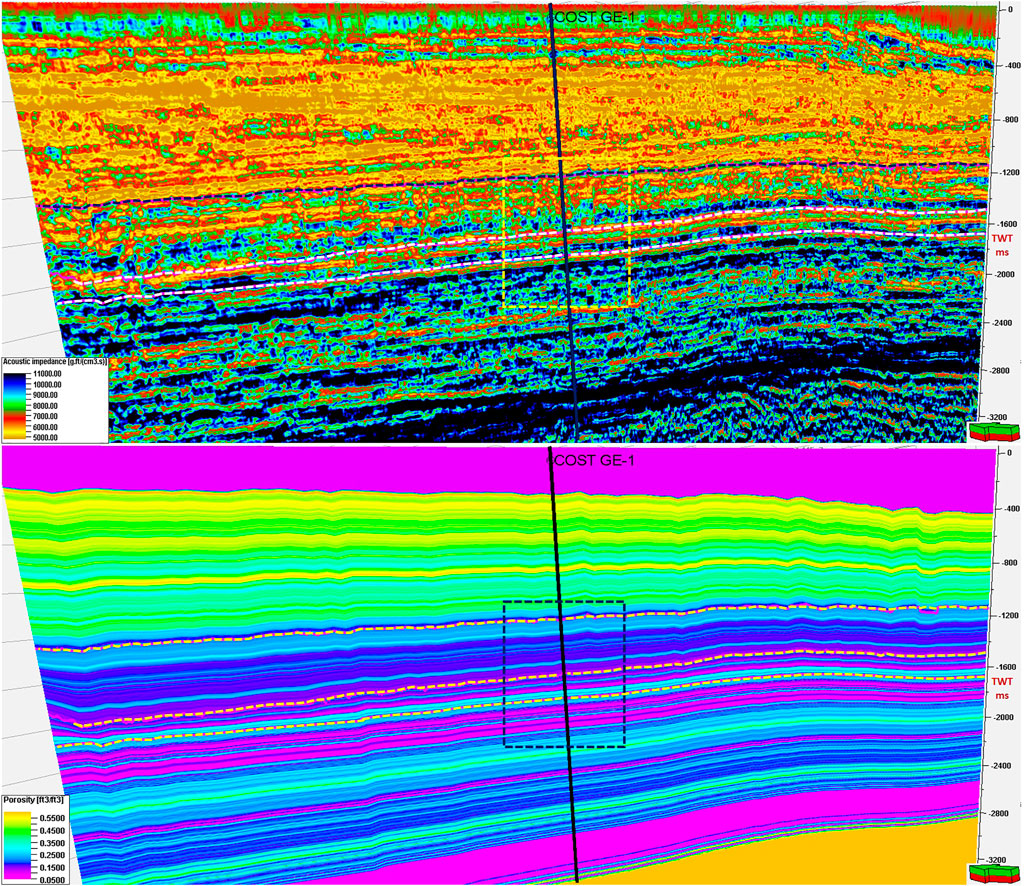
FIGURE 9. 3D view of the acoustic impedance (top) and the extrapolated porosity (bottom), using seismic lines # 7053A across the COST GE-1 well.
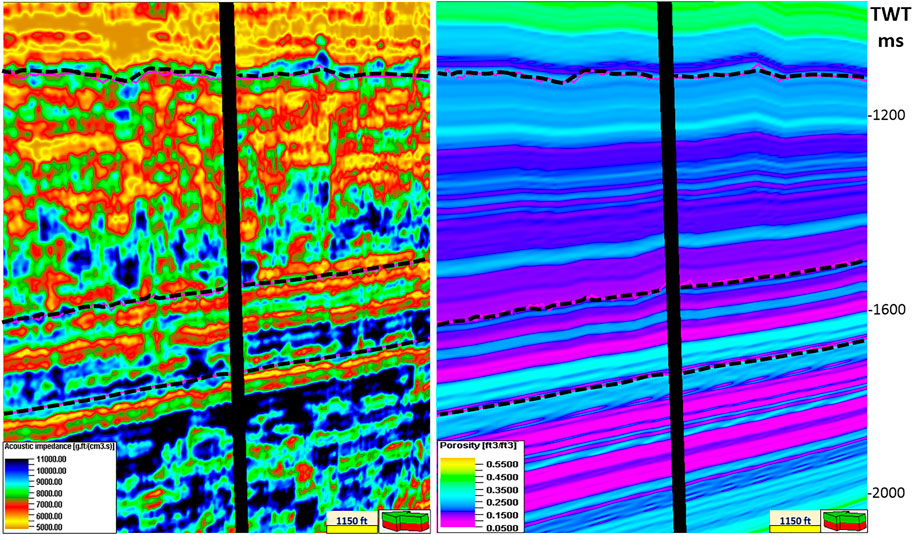
FIGURE 10. Zooming in for the acoustic impedance and the extrapolated porosity (see Figure 11).
Porosity and Acoustic Impedance Relationship
Cross plotting is an effective method to link the AI with porosities which were calculated from either density and neutron logs or measured from the well core (Kumar, 2016). Figures 11A,B show a linear regression between AI and porosity at the COST GE-1 and Transco 1005-1 wells. This reasonable correlation between porosity and AI from logs and core data in the Upper Cretaceous strata indicate a robust transform function for application to seismic inversion results. It helps to understand the porosity regimes which is a critical key for CO2 storage assessment. Also, the inverted impedance is a good indicator for porosity changes and gives confidence when indicating porosities from impedance. In addition, it is a viability study to know whether porosity can be extracted from impedance or not. Figure 11A shows high porosities and low impedance in the lower strata of the Upper Cretaceous interval which is an indication of a potential porous reservoir overlaid by an impermeable seal interval which has high impedance values. Based on this relationship and the stratigraphic analysis, it appears that the most suitable reservoir strata for CO2 storage are within restricted shelf carbonates with high primary and secondary porosity and good permeability occurring between 5,700 and 7,200 ft (Scholle, 1979). It has low to moderate AI values which reflect high to moderate porosity values. In addition, it has the best permeability encountered below 1,000 ft in the COST GE-1 well (Scholle, 1979; Almutairi et al., 2017). This depth interval (5,700 and 7,200 ft), dominated by sandstone, shows porosities that vary widely and unsystematically with depth from 25 to 30% (probably due to variation in diagenesis), and the permeability is as high as 4,000 mD. Although characterized by good porosity and low impedance, the fine-grained limestone above 5,700 ft is likely too impermeable to make the strata interval a candidate for reservoir rocks, unless they are widely fractured or contain undetected permeable horizons. Data suggest that the rocks between 1,000 and 5,700 ft have a permeability of 3 mD or less (Scholle, 1979) which gives low AI values (Figure 11A). The porosity and AI relationships for wells COST GE-1 and Transco 1005-1 are compatible with the core data where high porosities strata have low impedance values. At the Transco 1005-1 well, the AI and porosity relationships were tested at different intervals to get the best correlation which is 0.68 at the interval between 4,046 and 6,000 ft (Figures 11C–E).
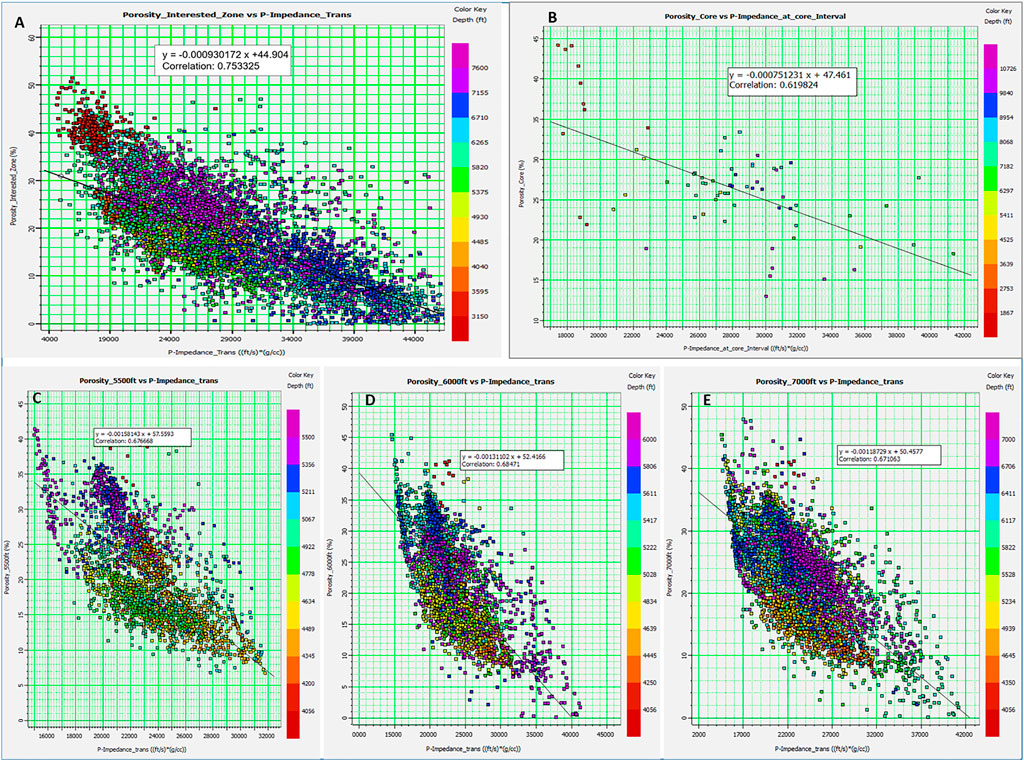
FIGURE 11. (A) Acoustic impedance relationship with calculated porosity at an interested zone (3,150–7,600 ft) of the COST GE-1 well where the correlation coefficient is 0.75. (B) The acoustic impedance and measured porosity relationship for the entire well, where the correlation coefficient is 0.62. (C,D,E) Acoustic impedance versus calculated porosities from density and neutron logs at three different depth intervals at the Transco 1005-1 well, where the best correlation coefficient achieved is 0.6847 at the interval between 4,046 and 6,000 ft.
Extract Porosity From Acoustic Impedance
Using the porosity and AI relationship, the porosity distribution is extracted using linear regression with better correlation (Dolberg and Helgesen, 2000). Therefore, seismic data predict porosity with a maximum correlation (R) of 0.75. Figures 12A,B show the estimated porosity using the relationship between AI and porosity at the GE-1 and Transco 1005-1 wells, respectively.
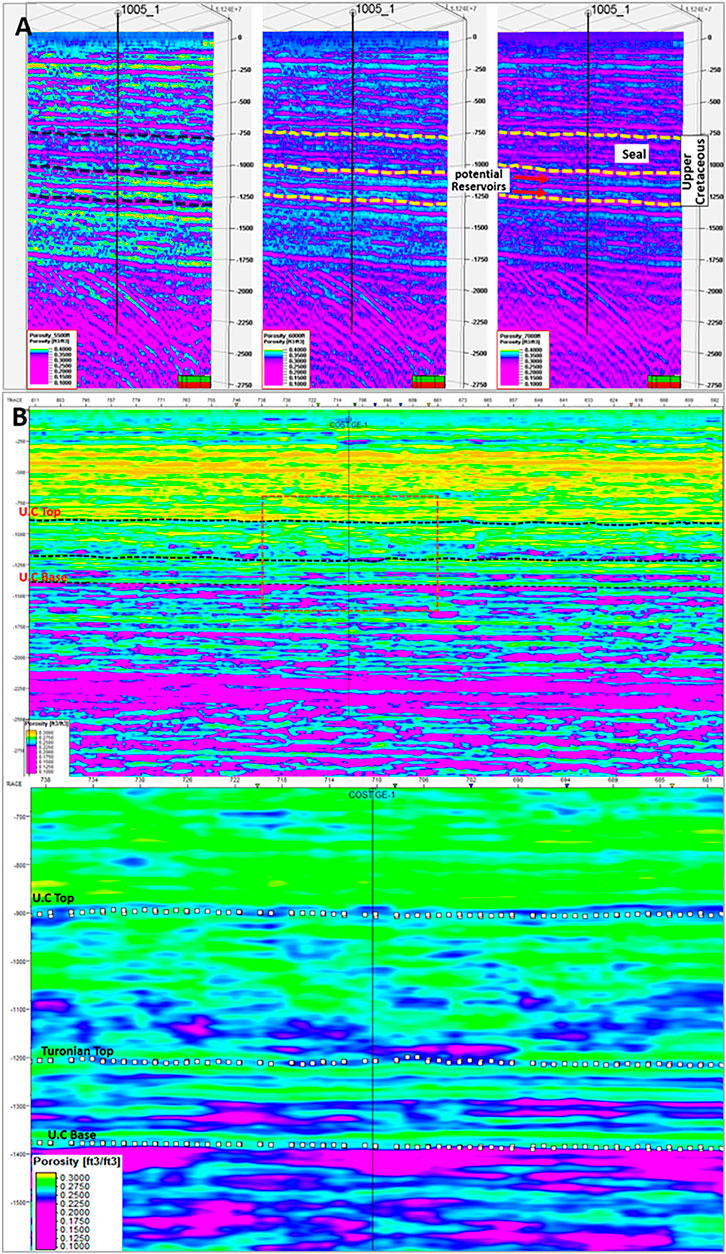
FIGURE 12. (A) Extracted porosity from the acoustic impedance at three different intervals at the Transco 1005-1 well which discriminates two strata within the potential reservoir intervals at the Upper Cretaceous. (B) Extracted porosity from the acoustic impedance at the GE-1 well using the linear regression relationship of [Porosity=(−0.0018164*AI) + 73.137], where the correlation coefficient is 0.75.
Porosity and Permeability Relationship
Understanding porosity and permeability spatial distributions is critical for characterizing a potential CO2 reservoir and its seal. Values calculated from well logs show an irregular pattern perhaps due to cementation and facies changes. COST GE-1 well data, for instance, show a clear decrease of porosity with depth down to ∼5,700 ft. Plotting the porosity versus depth for the upper portion of the COST GE-1 well (Figure 13A) shows that the fine-grained carbonates appear to behave similarly to chalks with respect to porosity modification with depth. Some of these carbonates are not strictly true chalks because of their argillaceous matrix. The porosity and permeability depth relationship for the upper 5,700 ft of the COST GE-1 well indicates that the Upper Cretaceous section has a porosity range of 12–23% from 3,500 to about 5,500 ft, and the approximate matrix permeability is in the range of 0.15–0.6 mD.
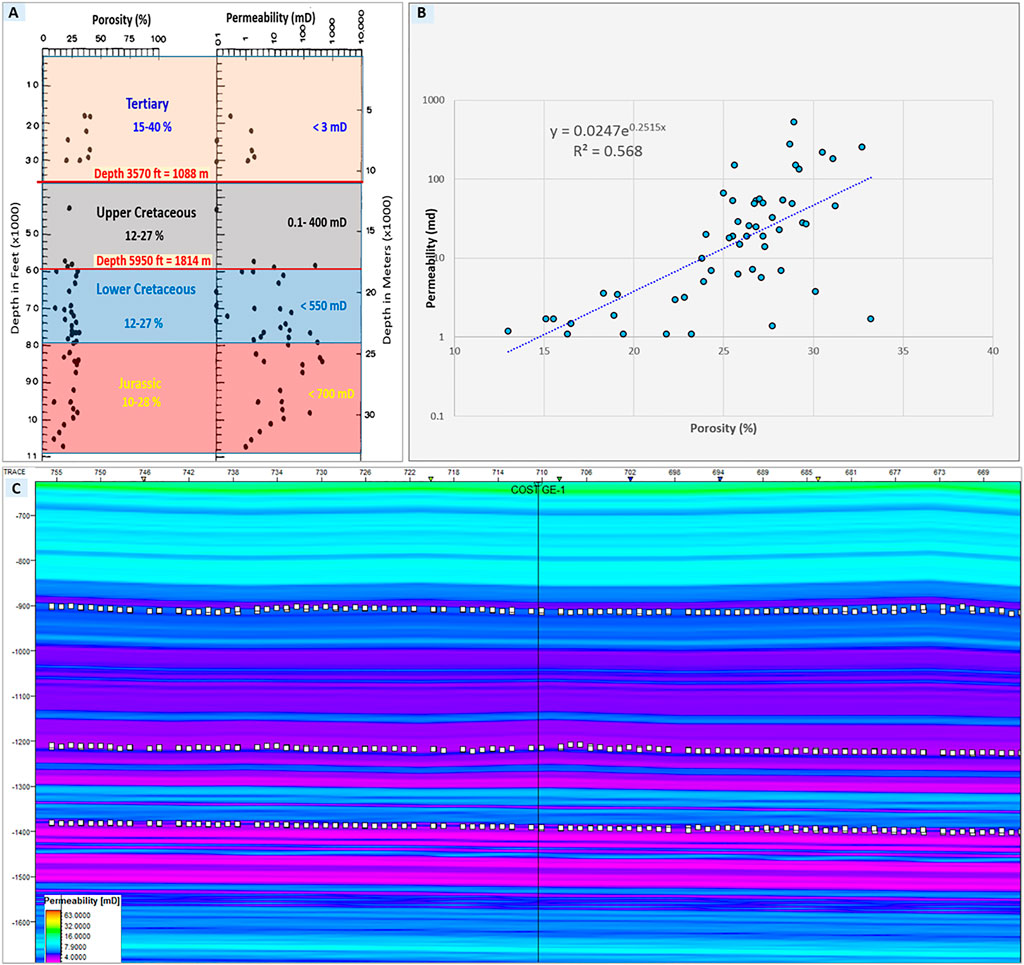
FIGURE 13. Porosity and permeability relationship at the COST GE-1 well: (A) values measured on conventional and sidewall cores as a function of depth (Amato and Bebout, 1978; Almutairi et al., 2017); (B) cross plotting core porosities versus core permeabilities for the entire well, data from Scholle (1979). (C) Permeability distribution using the core’s porosities and permeability relationship.
Porosities and permeabilities from conventional and sidewall cores at the COST GE-1 well show that very high porosities (25–40%) are encountered in the Cenozoic age chalks in the 1,000 to 3,000 ft depth interval, and the corresponding permeabilities for these fine-grained limestones are predictably low (Amato and Bebout, 1978). However, the lower part of the Upper Cretaceous interval (5,500 ft) has porosity of 20–35% and high permeability (450 mD) which makes it a candidate for a reservoir rock since it is capped by thick low permeability strata.
Figure 13B shows the core’s porosity and permeability relationship as a function of depth; data from Amato and Bebout (1978). This relationship supports the previous study conducted by Almutairi et al. (2017) which proposed that the Upper Cretaceous strata has two significant potential storage reservoirs for CO2 including limestones with significant interbedded sandstone and shales and dolomite (Scholle, 1979). These strata are sealed by thick sediments of mainly shale interbedded with limestone (Figure 14). The cross plotting relationship of porosity against permeability and AI provides more evidence that the best two potential reservoirs are located in the lower part of the Upper Cretaceous section with high values of primary and secondary porosity, low AI, and best permeability. The first potential reservoir is between 5,320 and 5,600 ft, which is sealed by about 725-ft-thick shale. The second potential reservoir is between 5,760 and 5,950 ft, which is sealed by 160-ft-thick shale. However, permeability distribution is estimated using the regression relationship between the core’s porosity and permeability (Nelson, 1996; Gilles, 2000). The equation of the least square exponential fit was used to predict the permeability distribution as a function of porosity that was extracted previously from the AI. Figure 13C shows the estimated permeability using the estimated porosity from the AI of the seismic line # 7053A and the COST GE-1 well data as an example.
where the correlation coefficient R2 = 0.568, and x is the estimated porosity.
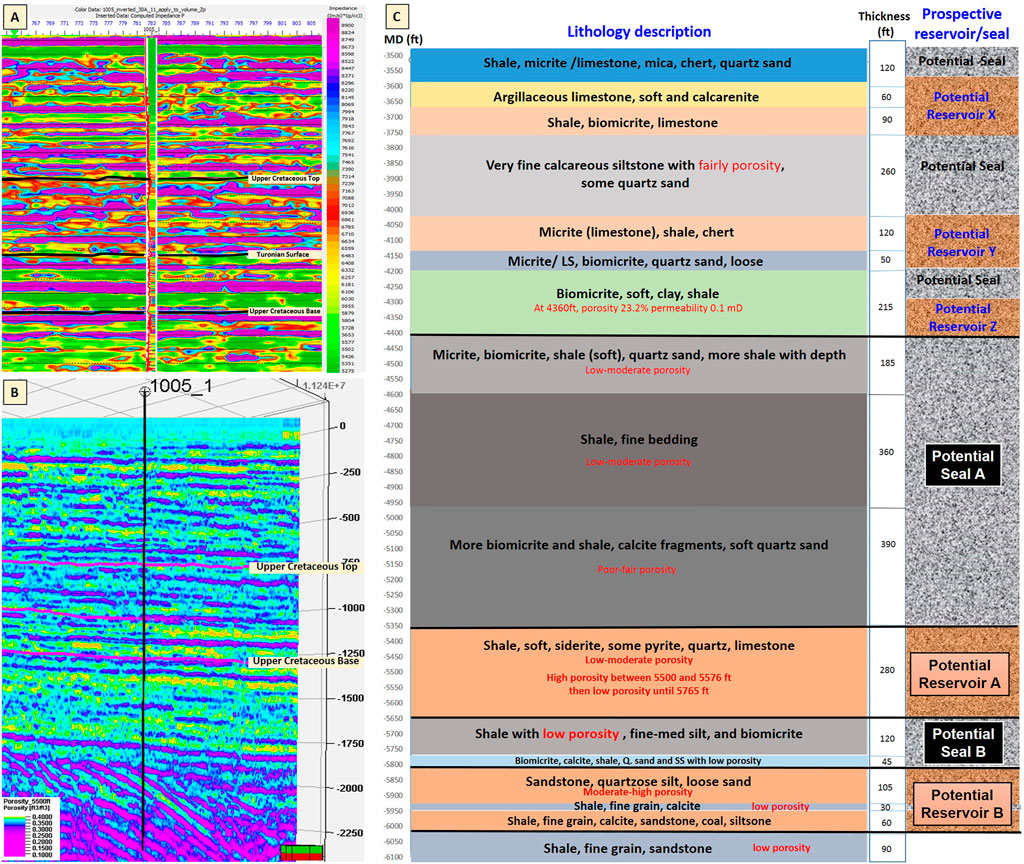
FIGURE 14. (A) Acoustic impedance, (B) extracted porosity, and (C) lithology description with a geological model for the two main potentials reservoirs and seals at the Upper Cretaceous strata at South Georgia embayment, modified after Almutairi et al. (2017); data from Scholle (1979).
Structure Maps and Properties
Significant markers in the Upper Cretaceous section were identified for potential reservoirs and seals within the SGE. The main potential units were selected based on the paleontological data, depths versus geologic series or stage. These units are 1) Maastrichtian, representing the top of the Upper Cretaceous (Figure 15A), 2) Turonian (Figure 15B), and 3) top Albian, representing the base of the Upper Cretaceous (Figure 15C) (Amato and Bebout, 1978; Almutairi et al., 2017). Since SGE has conformable deposition, lateral facies changes may be of greater interest in this study area than in other basins along the Atlantic offshore margin (Scholle, 1979). Therefore, AI inversion conducted for providing more detail on the critical properties such as porosity and permeability leads to clearer lithology discrimination for the potential reservoir and seal. However, CO2 sequestration requires reservoir and associated seal with a minimum depth and thickness (NETL, 2015; IEA, 2007; 2008). The depth to the top of the Upper Cretaceous strata varies approximately from 3,000 to 4,500 ft at the SGE. The prospective reservoir, strata interval between the Turonian strata and the base of the Upper Cretaceous, has a depth range from 4,000 to 7,000 ft and a thickness from approximately 250 to 1,200 ft (Figure 15E). Nevertheless, the sediment column between the top of the Upper Cretaceous and the Turonian strata, mostly shales with low permeability, would serve as a thick (800- to 2,600-ft) seal (Almutairi et al., 2017; Figure 15D).Therefore, such depths and thicknesses are suitable for CO2sequestration. Since geologic CO2 sequestration requires suitable porosities and permeabilities for the reservoir and the seal, the relationship between the AI and porosity cross-plotted with permeability (Figure 14) indicates two main reservoirs capped by impermeable strata:
• The first potential reservoir, located at depths between 5,400 and 5,580 ft, is composed of siderite, some pyrite quartz, limestone, with high porosity (17–23%) and high permeability (3.5–447 mD). It is overlain by thick seal layers, located at depths between 4,400 and 5,400 ft, composed of shale, has fine bedding, and has a porosity of 23.5% and low permeability (0.1 mD).
• The second potential reservoir is composed of sandstone, quartzose silt, dolomite loose sand,coal, and siltsone and located at depths of 5,720–5,950 ft. The estimated porosity is (19–30.1%) and the permeability is between 3.5 and 447 mD, (Scholle, 1979; Almutairi et al., 2017). However, it is capped by seal strata, composed of calcareous shale,fine-med silt, and biomicrite, and located at a depth range of 5,580–5,720 ft. Its porosity is 12% and has less permeable clayey sequence.
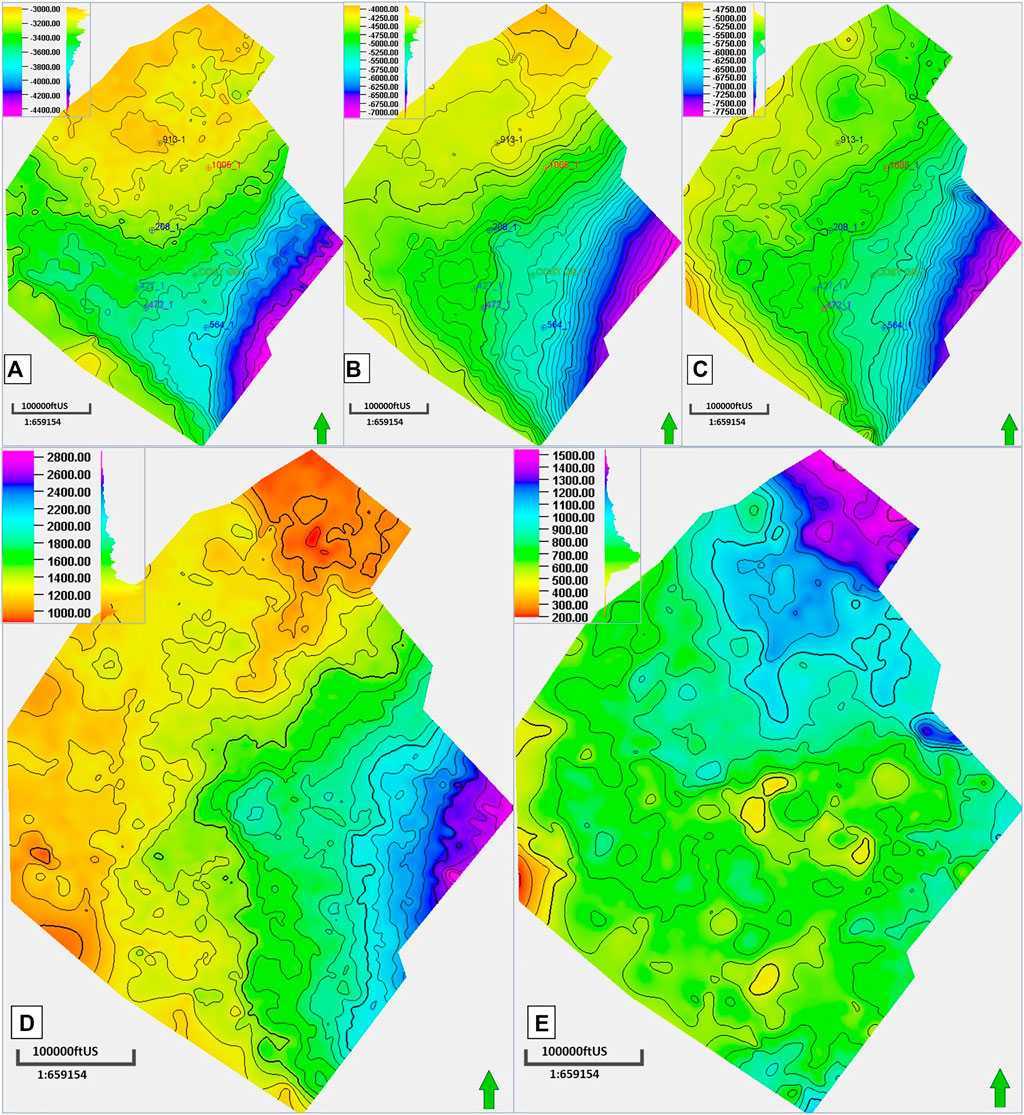
FIGURE 15. Structure maps, in feet, for (A) top of Upper Cretaceous (Late Maastrichtian), (B) Turonian, and (C) base of Upper Cretaceous (Albian). Thickness maps (isochore) in feet for (D) prospective seal and (E) potential reservoir within the offshore of Southeast Georgia Basin (Almutairi et al., 2017).
Discussions
This study allowed us to distinguish lithology strata, extract porosity from seismic data, and understand porosity and permeability regimes for the potential reservoirs and seals within the Upper Cretaceous strata at the SGE by employing different AI inversion techniques and providing a reliable workflow of seismic inversion. This workflow can be applied to future CO2 storage resource assessments within the United States Outer Continental Shelf.
Physical properties such as impedance contrast, calculated porosity from either density or neutron logs, measured porosity and permeability from the well’s core, and well log interpretations were integrated to determine the potential reservoir and seal strata. The acoustic inversion results identified strata and units containing potential reservoirs and seals with the areal extent in the Upper Cretaceous strata. In addition, the inversion results indicate that distinct porosity and permeability regimes are present and distributed in the Upper Cretaceous strata within the SGE. This result supports the previous study by Almutairi, et al., 2017 and provides more details about the areal extent of potential reservoirs and seals, as well as porosity and permeability distributions. The regression analysis between the AI and porosity show a good relationship within the Upper Cretaceous strata. Since the porosity distribution is estimated using different methods, the porosity follows the trends of seismic signature and structures of Upper Cretaceous strata. The AI and porosity relationship is defined by
where the correlation coefficient is R2 = 0.75. However, the relationship between porosity and permeability is defined by
where the correlation coefficient is R2 = 0.568.
The extracted values of porosity and permeability are close to the measured values from the well cores at the Upper Cretaceous strata interval. Correlation coefficients in the linear regressions between the AI, porosity, and permeability are within the range of similar studies that relate to CO2 sequestration and porosity prediction such as: Alshuhail (2011); Patricia (2014); Hills and Pashin (2010); Li et al., 2016; Samaher et al., 2018; Konwar et al. (2019); Shedid (2019); Lis-Sledziona. (2019). The high impedance zones observed in the seismic section of Upper Cretaceous have low porosity. Since Almutairi et al. (2017) proposed two significant storage reservoirs for CO2 in the Upper Cretaceous strata, the seismic inversion and the regression between the AI and porosity fairly closely agreed with the results. The potential reservoir zones give low impedance, and high porosity. Comparing the low impedance zone with the well lithology description, the reservoir is comprised of limestone with significant interbedded sandstone, shale, and dolomite (Scholle, 1979). It is sealed by thick sediments, mainly shale interbedded with limestone, which have high impedance and low porosity values (Almutairi et al., 2017).
From the acoustic inversion analyses and physical property relationships, the Upper Cretaceous strata have mainly two potential reservoirs and extend within the South Georgia Embayment (SGE). The shallow potential reservoir, located at depths between 5,400 and 5,580 ft, and composed of siderite, some pyrite quartz, limestone, with high porosity (17–23%) and high permeability (3.5–447 mD) are encountered. However, it is overlain by thick seal layers, is located at depths between 4,400 and 5,400 ft, is composed of shale, is composed of fine bedding, and has a porosity of 23.5% and low permeability of about 0.1 mD. Nevertheless, the deep potential reservoir, which is composed of sandstone, quartzose silt, dolomite loose sand, coal, and siltsone, is located at a depth of 5,720–5,950 ft. The porosity is 19–30.1% and the permeability is between 3.5 and 447 mD (Scholle, 1979; Almutairi et al., 2017). However, it is capped by a seal interval, composed of calcareous shale, fine-med silt, and biomicrite and is located at a depth range of 5,580–5,720 ft. Its porosity is 12% and has less permeable clayey sequence at the GE-1 well.
Conclusion
This study builds and expands on a previous CO2 storage resource assessment study of the southeastern Atlantic offshore margin (Almutairi et al., 2017) by providing a more detailed evaluation of certain physical parameters of the Upper Cretaceous strata restricted to SGE. This study 1) provides a quantitative estimate of porosity and permeability regimes distributed across the SGE; 2) demonstrates the value of using multiple seismic inversion techniques to define reservoir and seal properties; 3) provides a reliable and repeatable workflow for model-based inversion which provides a better method to discriminate lithology and predict porosity; and 4) optimizes parameters for assessing geologic CO2 storage resources. In addition, the impedance inversion workflow may be applied to future CO2 storage resource assessments. The results of the AI inversion indicate that the Upper Cretaceous strata at SGE contain porous intervals which have low AI (relatively high porosity) overlain by a thick impermeable interval, mostly shale, with high impedance (low porosity) and low permeability. This study corroborates the results from the previous study (Almutairi et al., 2017). Suggestions for future work include conducting a 3D seismic survey to obtain a more complete assessment of formation evaluation and geologic characterization for CO2 storage resources for Upper Cretaceous strata at SGE.
At SGE, some conditions need more investigations, including the reservoir and seal integrity for long-term CO2 storage and any existing faults, especially some fault features associated with salt diapirs, which were reported at Carolina Trough (Dillon, et al., 1976; Figure 1A). This study recommends creating reliable velocity model to get accurate depths of stratigraphic units. However, there is uncertainty in measuring storage capacity which includes possible variations that could occur in the potential reservoir and seal distributions established in the geologic model.
Data Availability Statement
The data sets presented in this study can be found in online repositories. The names of the repository/repositories and accession number(s) can be found in the article/Supplementary Material.
Author Contributions
KA made the majority of the contribution to this article as part of his dissertation research at the University of South Carolina. CK, JK and DB provided the funding and guidance for this research project in connection with the Department of Energy project SOSRA. DT provided insights into the theoretical calculations of volumetric estimates for CO2 storage.
Funding
This work was supported by the United States Department of Energy, National Energy Technology Laboratory, through Cooperative Agreement DE-FE0026086, CFDA 81.089, with the Southern States Energy Board. Cost share and research support were provided by the Project Partners and an Advisory Committee. Seismic reflection and well data were provided by the Bureau of Ocean Energy Management and United States Geological Survey (USGS) database.
Conflict of Interest
The authors declare that the research was conducted in the absence of any commercial or financial relationships that could be construed as a potential conflict of interest.
Publisher’s Note
All claims expressed in this article are solely those of the authors and do not necessarily represent those of their affiliated organizations, or those of the publisher, the editors, and the reviewers. Any product that may be evaluated in this article, or claim that may be made by its manufacturer, is not guaranteed or endorsed by the publisher.
Acknowledgments
Special thanks to Schlumberger for providing free licenses of Petrel software, and special thanks to CGG GeoSoftware for providing free licenses of HampsonRussell software. This work could not have taken place without their software contribution. I would like to thank King Abdulaziz City for Science and Technology (KACST) at Saudi Arabia, for full scholarship. Also, many thanks to the School of the Earth, Ocean & Environment at the University of South Carolina.
References
Almutairi, K., Knapp, C., Knapp, J., and Terry, D. (2017). Assessment of Upper Cretaceous Strata for Offshore CO2 Storage, Southeastern United States. Mod. Environ. Sci. Eng. 03 (08), 532–552.
Alshuhail, A. (2011). CO2 Sequestration Site Characterization and Time-Lapse Monitoring, Using Reflection Seismic Methods. PhD. Thesis (Calgary, Canada: Univ. of Calgary).
Alshuhail, A., Lawton, D., and Isaac, H. (2009). Acoustic Impedance Inversion of Vintage Seismic Data over a Proposed CO2 Sequestration Site in the Lake Wabamun Area, Alberta. CREWES Res. Rep. 21.
R. V. Amato, and J. W. Bebout (Editors) (1978). Geological and Operational Summary COST No. GE-1 Well, Southeast Georgia Embayment Area, South Atlantic OCS (Virginia: United States Geological Survey).
Asquith, G. B., Krygowski, D., and Gibson, C. R. (2004). Basic Well Log Analysis (Vol. 16). Tulsa: American Association of Petroleum Geologists.
Book, U. S. (1982). Minerals Management Service. Atlantic OCS Region. New York Office. Proposed 1983 Outer Continental Shelf Oil and Gas Lease Sale Offshore the South-Atlantic States: OCS Sale No. 78: Draft Environmental Impact Statement. New York: The Office.
CGG (2016). Hampson Russell Software Materials, “Post-stack Inversion in STRATA”. Paris, France: CGG.
Chadwick, A., Arts, R., Bernstone, C., May, F., , hibeau, S., and Zweigel, P. (2008). Best Practice for the Storage of CO2 in saline Aquifers - Observations and Guidelines from the SACS and CO2 STORE Projects. Nottingham, UK: British Geological Survey Occasional Publication, 14.
Cubizolle, F., Valding, T., Lacaze, L., and Pauget, F. (2015). Global Method for Seismic-Well Tie Based on Real Time Synthetic Model. SEG New Orleans Annu. Meet. doi:10.1190/segam2015-5862834.1
Dillon, W., Girard, O., Weed, E., Sheridan, R., Dolton, G., Sable, E., et al. (1975). Sediments, Structural Framework, Petroleum Potential, Environmental Considerations and Operational Considerations of the United States South Atlantic Outer continental Shelf. U.S. Geol. Surv. Open-File Rep. 75-411, 262. l plate.
Dillon, W. P., Paull, C. K., Buffler, R. T., and Fail, J. P. (1979). “Structure and Development of the Southeast Georgia Embayment and Northern Blake Plateau: Preliminary Analysis,” in Geological and Geophysical Investigations of continental Margins: American Association of Petroleum Geologists Memoir 29. Editors J. S. Watkins, L. Montadert, and P. W. Dickerson, 27–41.
Dillon, W. P., and Popenoe, P. (1988). “The Blake Plateau Basin and Carolina Trough,” in The Atlantic continental Margin, U.S., V. I-2 of the Geology of North America. Editors R. E. Sheridan, and J. A. Grow (Boulder, Colo: Geological Society of America), 291–328.
Dillon, W. P., Sheridan, R. E., and Fail, J. P. (1976). Structure of the Western Blake- Bahama Basin as Shown by 24 Channel CDP Pro-filing. Geology 4 (7), 459–462. doi:10.1130/0091-7613(1976)4<459:sotwbb>2.0.co;2
Dolberg, D. M., Helgesen, J., Hanssen, T. H., Magnus, I., Saigal, G., and Pedersen, B. K. (2000). Porosity Prediction from Seismic Inversion, Lavrans Field, Halten Terrace, Norway. The Leading Edge 19 (4), 392–399. doi:10.1190/1.1438618
Edgar, N. T. (1981). “Oil and GAS Resources of the U.S. Continental Margin-South Atlantic Area,” in Report prepared for the Conference of the Future of Gas and Oil from the sea (Newark, Delaware: Univ. of Delaware).
Eiken, O., Ringrose, P., Hermanrud, C., Nazarian, B., Torp, T. A., and Høier, L. (2011). Lessons Learned from 14 Years of CCS Operations: Sleipner, in Salah and Snøhvit. Trondheim, N-7005Norway: Statoil ASA, Technology and New Energy.
Gaymard, R., and Poupon, A. (1968). Response of Neutron and Formation Density Logs in Hydrocarbon Bearing Formations. The Log Analyst 9, 3–12.
Gilles, G. (2000). Acoustic and Thermal Characterization of Oil Migration, Gas Hydrates Formation and Silica Diagenesis. PhD. Thesis (New York: Columbia University).
Hills, D., and Pashin, J. (2010). Preliminary of Offshore Transport and Storage of CO2: Southeastern Regional Carbon Sequestration Partnership Final Report, Prepared for Southern States Energy Board. Tuscaloosa, Alabama: Geological Survey of Alabama, 11.
IEA (International Energy Agency) (2008). CO2 Capture and Storage: A Key Carbon Abatement Option”. Paris: OECD/IEA.
IEA (International Energy Agency) (2007). Legal Aspects of Storing CO2: Update and Recommendations”. Paris: IEA.
Konwar, D., Gogoi, S. B., Barman, J., and Kallel, M. (2019). “Quantitative and Qualitative Characterization of Oil Field Produced Water of Upper Assam Basin (India),” in Advances in Petroleum Engineering and Petroleum Geochemistry. CAJG 2018. Advances in Science, Technology & Innovation (IEREK Interdisciplinary Series for Sustainable Development). Editors S. Banerjee, R. Barati, and S. Patil (Cham: Springer), 113–116. doi:10.1007/978-3-030-01578-7_27
Kumar, R., Das, B., Chatterjee, R., and Sain, K. (2016). A Methodology of Porosity Estimation from Inversion of post-stack Seismic Data. J. Nat. Gas Sci. Eng. 28, 356e364. doi:10.1016/j.jngse.2015.12.028
Lee, K., Yoo, D.-G., McMechan, G. A., Hwang, N., and Lee, G. H. (2013). A Two-Dimensional post-stack Seismic Inversion for Acoustic Impedance of Gas and Hydrate Bearing Deep-Water Sediments within the continental Slope of the Ulleung Basin, East Sea, Korea. Terr. Atmos. Ocean. Sci. 24, 295–310. doi:10.3319/TAO.2013.01.10.01(T)
Li, A., Ding, W., He, J., Dai, P., Yin, S., and Xie, F. (2016). Investigation of Pore Structure and Fractal Characteristics of Organic-Rich Shale Reservoirs: A Case Study of Lower Cambrian Qiongzhusi Formation in Malong Block of Eastern Yunnan Province, South China. Mar. Pet. Geology. 70, 46–57. doi:10.1016/j.marpetgeo.2015.11.004
Liner, C. L. (2004). Elements of 3D Seismology. 2nd edition. Nashville, Tennessee, USA: PennWell Corporation, 608.
Lis-Śledziona, A. (2019). Petrophysical Rock Typing and Permeability Prediction in Tight sandstone Reservoir. Acta Geophys. 67, 1895–1911. doi:10.1007/s11600-019-00348-5
Litynski, J. T., Plasynski, S., McIlvried, H. G., Mahoney, C., and Srivastava, R. D. (2008). The United States Department of Energy's Regional Carbon Sequestration Partnerships Program Validation Phase. Environ. Int. 34, 127–138. doi:10.1016/j.envint.2007.07.005
Maher, J. C., and Applin, E. R. (1971). Geologic Framework and Petroleum Potential of the Atlantic Coastal plain and continental Shelf. U.S. Geol. Surv. Prof. Pap. No. 659, 98. doi:10.3133/pp659
Maurya, S., and Sarkar, P. (2016). Comparison of Post Stack Seismic Inversion Methods: A-Case Study from Blackfoot Field, Canada. Int. J. Scientific Eng. Res. 7 (8).
Nelson, P. H. (1996). Permeability-porosity Relationships in Sedimentary Rocks. The Log Analyst 35 (3), 38–62.
NETL (2015). Carbon Storage Atlas. 5th Edition. Pittsburgh, Pennsylvania, USA: National Energy Technology Laboratory (NETL.
Orr, F. M. (2009). Onshore Geologic Storage of CO 2. Science 325, 1656–1658. doi:10.1126/science.1175677
Patricia, G. (2014). Model-based Inversion of Broadband Seismic Data. MSc. Thesis (Calgary, Canada: Department of Geoscience, University of Calgary).
Pinet, P. R., and Popenoe, P. (1985). Shallow Seismic Stratigraphy and post-Albian Geologic History of the Northern and central Blake Plateau. Geol. Soc. America Bull. 96 (5), 627–638. doi:10.1130/0016-7606(1985)96<627:sssapg>2.0.co;2
Poag, W. (1985a). “Depositional History and Stratigraphic Reference Section for central Baltimore Canyon Trough,” in Geologic Evolution of the United States Atlantic Margin. Editor C. W. Poag (New York: Van Nostrand Reinhold Co.), 217–264.
Poag, W. (1978). Stratigraphy of the Atlantic Continental Shelf and Slop of the United States, Paleontology and Stratigraphy Branch. Woods Hole, Massachusetts: U.S. Geological Survey, 02543.
Pollack, A. (2014). Tectonic Studies of the Atlantic Margin in the Southeastern United States. Master's thesis. Available at: https://scholarcommons.sc.edu/etd/2871.
Samaher, A., Sameer, H., and Ali, J. (2018). Permeability Estimation for Carbonate Reservoir (Case Study/South Iraqi Field). Iraqi J. Chem. Pet. Eng. 19 (3), 41–45.1997-4884
Schlumberger (2016). Petrel Geophysics Training Course Manual: Module 14: Depth Conversion. Houston, U.S.A: Schlumberger.
Schlumberger (2017). Practical AVO and Seismic Inversion with Petrel, Training Course Manual. Houston, TX. U.S.A: Schlumberger.
P. A. Scholle (Editor) (1979). Geological Studies of the COST GE-1 Well, United States South Atlantic Outer Continental Shelf Area (Arlington, VA: Geological Survey Circular), 800.
Serra, O. (1984). Fundamentals of Well-Log Interpretation (Vol. 1): The Acquisition of Logging Data: Dev. Pet. Sci., 15A. Amsterdam: Elsevier.
Shedid, S. A. (2019). Prediction of Vertical Permeability and Reservoir Anisotropy Using Coring Data. J. Petrol. Explor Prod. Technol. 9, 2139–2143. doi:10.1007/s13202-019-0614-0
Smyth, R., Hovorka, S., Meckel, T., Breton, C., Paine, J., Hill, G., et al. (2008). Potential Sinks for Geologic Storage of Carbon Dioxide Generated by Power Plants in North and South Carolina. Final Carolinas Rep., 57.
Veeken, H. (2007). “Seismic Stratigraphy, basin Analysis and Reservoir Characteristics,” in Handbook of Geophysical Exploration,Seismic Exploration. Editors K. Helberg, and S. Treitel, Vol. 37, 509.
Keywords: offshore Atlantic, Southeast Georgia Embayment (SGE), Upper Cretaceous strata, model-based inversion, CO2 geologic storage
Citation: Almutairi K, Knapp C, Knapp J, Brantley D and Terry D (2022) Acoustic Impedance Inversions for Offshore CO2 Storage: South Georgia Embayment, United States. Front. Energy Res. 10:842015. doi: 10.3389/fenrg.2022.842015
Received: 23 December 2021; Accepted: 18 February 2022;
Published: 10 May 2022.
Edited by:
Hugh Daigle, University of Texas at Austin, United StatesReviewed by:
Hu Guo, China University of Petroleum, ChinaXiukun Wang, China University of Petroleum, China
Copyright © 2022 Almutairi, Knapp, Knapp, Brantley and Terry. This is an open-access article distributed under the terms of the Creative Commons Attribution License (CC BY). The use, distribution or reproduction in other forums is permitted, provided the original author(s) and the copyright owner(s) are credited and that the original publication in this journal is cited, in accordance with accepted academic practice. No use, distribution or reproduction is permitted which does not comply with these terms.
*Correspondence: Camelia Knapp, Y2FtZWxpYS5rbmFwcEBva3N0YXRlLmVkdQ==
 Khaled Almutairi
 Camelia Knapp
 James Knapp
 Duke Brantley2
