Abstract
Microbial fuel cells (MFCs) have undergone great technological development in the last 20 years, but very little has been done to commercialize them. The simultaneous power production and wastewater treatment are features those greatly increase the interest in the use of MFCs. This kind of distributed power generation is renewable and friendly and can be easily integrated into a smart grid. However, there are some key issues with their commercialization: high construction costs, difficulty in developing high power structures, MFC lifespan, and maintaining a high level of efficiency. The objective of this article is to explore the possibilities of using MFCs in urban wastewater not only regarding the technical criteria of their application, but also mainly from an economic point of view, to determine the conditions through which the viability of the investment is ensured and the possibilities of their integration in a smart grid are identified. Initially, this article explores the implementation/configuration of a power plant with MFCs within an urban wastewater treatment plant on a theoretical basis. In addition, based on the corresponding physical quantities for urban wastewater treatment, the construction and operational costs are determined and the viability of the investment is examined based on classic economic criteria such as net present value, benefit–cost ratio, internal rate of return, and discounted payback period. Furthermore, sensitivity analysis is carried out, concerning both technical parameters, such as the percentage of organic matter removal, power density, sewage residence time, MFC efficiency, etc., and economical parameters, such as the reduction of construction costs due to change of materials, change of interest rate, and lifetime. The advantages and disadvantages of their use in smart grids is also analyzed. The results show that the use of MFCs for power generation cannot be utopian as long as they are integrated into the structure of a central wastewater treatment plant on the condition that the scale-up technical issues of MFCs are successfully addressed.
1 Introduction
Microbial fuel cells (MFCs) are chemical reactor systems that generate electricity from the biodegradation of organic materials with the help of suitable microbial substrate. The first substrates used in the laboratory were mainly glucose, acetate, or other simple substrates to determine the behavior of electrode materials, membranes, and such others, as well as the reactor architecture or microbial activity. The study using real wastewater as a substrate began in 2004. The main advantage was the energy savings from the wastewater aeration and sludge treatment (Wang and Ren, 2013). In addition, less production of sludge is achieved by MFCs than the processes of aerobic activated sludge (AS) treatment systems and of anaerobic digesters. These are less sensitive to temperature changes, sludge treatment plants and the associated electrical installations are limited and no energy is consumed for aeration (He et al., 2017). In a series of articles, there has been an extensive description of MFCs (Santoro et al., 2017a), their operation principle (Kumar et al., 2015; Lee et al., 2017; Mohamed et al., 2021), their electric performance (Capodalgio et al., 2015; Vilajeliu-Pons et al., 2016), the electron and ion transport mechanisms (Hubenova and Mitov, 2015; Kumar et al., 2016; Oliot et al., 2016; Sure et al., 2016; Abbas et al., 2017; Saratale et al., 2017), the biofilms (Cristiani et al., 2013; Saratale et al., 2017), the anodes (Santoro et al., 2015a; Yu et al., 2016; Hindatu et al., 2017; Sonawane et al., 2017; Cai et al., 2020; Huang et al., 2021), the cathodes (Ewusi-Mensah et al., 2021; Huang et al., 2021; Mutuma et al., 2021; Santoro et al., 2014; Santoro et al., 2015c; Sawant et al., 2017; Yu et al., 2016), the additional electrodes (Ieropoulos et al., 2018; Soavi and Santoro, 2020), the separators/membranes (Daud et al., 2015; Oliot et al., 2016; Ghassemi and Slaughter, 2017), the mediating solutions (Yong et al., 2014; Cristiani et al., 2020; Mutuma et al., 2021), the catalysts (Santoro et al., 2015b; Santoro et al., 2016a; Santoro et al., 2017b; Santoro et al., 2017c; Santoro et al., 2017d; Santoro et al., 2017e; Santoro et al., 2018a; Santoro et al., 2018b; Santoro et al., 2020; Rojas-Carbonell et al., 2017; Kodali et al., 2017; Erable et al., 2018; Salar Garcia et al., 2019; Ficca et al., 2020; Babanova et al., 2021), the influence of operational variables (Molognoni et al., 2016), and their mathematical modeling (Kato Marcus et al., 2007; Picioreanu et al., 2007; Zeng et al., 2010; Ortiz-Martínez et al., 2015; Capodaglio et al., 2017; Jadhav et al., 2021a). Moreover, various MFCs are constructed, i.e., ceramic brick (You et al., 2019), photo (Greenman et al., 2019), benthic (Reimer et al., 2006; Kagan et al., 2014; Karra et al., 2014; Abbas et al., 2017; Tommasi and Lombardelli, 2017), sediment (Donovan et al., 2008; Ewing et al., 2017; Mohamed et al., 2017), desalination (Borjas et al., 2017; Ewusi-Mensah et al., 2021; Moruno et al., 2018; Ramírez-Moreno et al., 2019; Ramírez-Moreno et al., 2021; Santoro et al., 2017e), supercapacitive (Santoro et al., 2016b; Walter et al., 2020b; Poli et al., 2020; Soavi and Santoro, 2020), and floating (Martinucci et al., 2015; Cristiani et al., 2019). Special MFCs are also designed, such as those from constructed wetland (Aguirre-Siera et al., 2016; Ramírez-Vargas et al., 2019; Ebrahimi et al., 2021; Kataki et al., 2021), combined microalgal photobioreactor/MFC system (Bolognesi et al., 2021b), and hybrid nature-based systems, i.e., constructed wetlands and microalgae–integrated phytoremediation plants integrated with MFCs (Capodaglio et al., 2021), which, however, are under research. In any case, MFCs can offer power generation (Santoro et al., 2013a; Trapero et al., 2017), cogeneration of hydrogen and power (Santoro et al., 2016b), feedstock treatment (Habermann and Pommer, 1991), wastewater treatment (Martinucci et al., 2015; Trapero et al., 2017; Gajda et al., 2018a), metal recovery (Wang and Ren, 2014; Gajda et al., 2017), nutrient recovery (Kelly and He, 2014), sensing for monitoring wastewater and energy harvesting (Cristiani et al., 2019), and salt reduction (Moruno et al., 2018). For practical use, MFCs can use various household wastewater [e.g., kitchen sink, bathroom, dishwasher, etc. (You et al., 2021)], domestic wastewater (Tommasi and Lombardelli, 2017; Linares et al., 2019; Rossi et al., 2019; Tan et al., 2021), municipal wastewater (Sonawane et al., 2014; Ali et al., 2015; Martinucci et al., 2015; Park et al., 2017; Estrada-Arriaga et al., 2018; Liag et al., 2018; Hiegemann et al., 2019; Blatter et al., 2021; Tan et al., 2021), and industrial wastewater [e.g., high organic load wastewater from a juice processing plant (Trapero et al., 2017), swine (Ding et al., 2017), lemon peel (Miran et al., 2016), wine lees (Sciarria et al., 2015), brewery (Lu et al., 2017), distillery (Sonawane et al., 2014)], microalgae (Greenman et al., 2019), urine (Gajda et al., 2018b; Ieropoulos et al., 2013; Ieropoulos et al., 2016; Salar Garcia et al., 2019; Santoro et al., 2013b; Walter et al., 2018; You et al., 2019), and unrefined organic matter, such as flies, crustacean organisms, and fruits (Ieropoulos et al., 2005)]. MFCs have in practice been deployed as power sources for monitoring systems (Ewing et al., 2017; Cristiani et al., 2019), portable power sources (Ren et al., 2012), a mobile phone (Ieropoulos et al., 2013), wireless sensors (Shantaran et al., 2005), sensor networks (Mohamed et al., 2017), oceanographic instruments (Kagan et al., 2014), a microcomputer (Walter et al., 2020c), a meteorological buoy (Tender et al., 2008), autonomous thermo-sensors in robotics (Greenman et al., 2021), lighting (Walter et al., 2018), a self-powered floating biosensor for online water quality monitoring (Pasternak et al., 2017), a robot (Ecobot II) (Ieropoulos et al., 2005), a swimming robot (Row-bot) combining an energy source (MFC) and a mechanical actuation to meet refueling needs (Philamore et al., 2015), and “pee-power urinal” (Ieropoulos et al., 2016; Walter et al., 2018). More general descriptions of applications can be found in the following sources: Wang and Ren (2013), Evelyn et al. (2014), Abrevaya et al. (2015a), Abrevaya et al. (2015b), Pandey et al. (2016)Gajda et al. (2018), Kumar et al. (2018), and Jatoi et al. (2021).
Essentially, wastewater is the most popular substrate for an MFC operation due to its high percentage in organic load and zero cost, especially the agro-food wastewater is very suitable due to its high biodegradability (Trapero et al., 2017; Molognoni et al., 2018; Bolognesi et al., 2021a). The various electro-active and complementary non–electro-active microorganisms transform the chemical energy stored in the chemical compounds of biomass or wastewater into electrical energy. This direct conversion of chemical to electrical energy avoids the application of the Carnot thermodynamic cycle at an ideal thermal machine with its limited thermal efficiency. Theoretically, MFCs can achieve higher efficiency (>70%), similar to conventional fuel cells. Moreover, due to the use of wastewater, it is a renewable energy source (Seelam et al., 2015), whose “fuel” supply can be controlled relatively more easily than wind turbines where the wind is completely uncontrolled and photovoltaics where the sunlight is uncontrollable, although predictable. This is an advantage in the case of its application as a distributed power unit or being a part of a smart grid. Of course, its performance is not fully controlled due to the involvement of bacteria in electricity production. Energy production is time-varying and proportional to the growth of bacteria, in contrast to biomass thermal units, as long as they are supplied by organic materials of approximately constant calorific value. However, cross-laboratory studies on MFCs have been carried out using domestic wastewater in identical single-chamber MFCs around the world, where maximum power densities and chemical oxygen demand efficiencies have been quite similar, while the startup time and acclimation stage have been different because of the diversity of the microbial communities (Santoro et al., 2021). It should be noted that there is a plethora of articles dealing with the installation and operation of renewable energy sources in smart grids, with an emphasis on photovoltaics and wind turbines, taking into account their stochasticity (Ullah et al., 2021), demand-side management programs (Osório et al., 2019; Ullah et al., 2020), reliability indices (Pathan et al., 2020), and the use of electric vehicles (Wei et al., 2021). However, the use of MFCs has not been proposed according to the relevant literature.
Although MFCs have not yet been developed with economically viable prices per kW of installed power and with a high nominal power (equivalent to renewable power plants of the order of MW), research on MFCs has however been progressing rapidly and continuously. This is due to the fact that the output power density per unit area of anode now ranges from 10 to 50 mW/m2 for wastewater and from 250 to 500 mW/m2 for glucose (Tharali et al., 2016), while the power density per unit volume of urban wastewater ranges from 40 mW/m3 to 54 W/m3 with a typical value of about 10 W/m3 depending on the substrate and the inoculum source (Zhao et al., 2017). However, the chemical energy content of usual urban wastewater with 600 mg/L chemical oxygen demand (COD) is about 1.67–2.33 kWh/m3 (Rossi et al., 2019; Capodaglio and Olsson, 2020; Tan et al., 2021), which can give a theoretical power density from 8.7 to 129.4 W/m3 for hydraulic retention time from 18 to 192 h (Estrada-Arriaga et al., 2018; Hiegemann et al., 2019; Linares et al., 2019; Rossi et al., 2019; Tan et al., 2021), which is extremely higher than the respective experimental values. Over the past 3 years, efforts to develop cheaper and larger MFCs have intensified, trying to keep COD removal, power density, and columbic efficiency at high levels and hydraulic retention time low (Liang et al., 2018; Abdallah et al., 2019; Flimban et al., 2019; Hiegemann et al., 2019; AlSayed et al., 2020; Leicester et al., 2020; Jadhav et al., 2021b; Tan et al., 2021).
In addition to electricity generation, MFCs are mainly used for wastewater treatment and more rarely for the production of hydrogen (Sharma and Li, 2010; Escapa et al., 2016; Kitching et al., 2017; Kumar et al., 2017), methane (Tharali et al., 2016), or some special forms of biomass (Adelaja et al., 2015; Logroño et al., 2015; Moqsud et al., 2015; Sciarria et al., 2015; Miran et al., 2016; Ding et al., 2017), for the removal of metals (Wang and Ren, 2014; Nancharaiah et al., 2015; Jadhav et al., 2017) and nitrates from water (Kelly and He, 2014), etc. The use of glucose (and similar others) as a “fuel” is not of direct practical interest because it is usually a component of biomass and not a pure substance, making its initial production too expensive for use in a power plant (Tharali et al., 2016; Leicester et al., 2020). The sediment at the sea bottom can also be used in benthic cells (Abbas et al., 2017). This only concerns specific research applications which use sensors of usually small load and are situated at great distances from conventional power sources. On the contrary, the use of wastewater and its degradation/consumption has two main advantages: wastewater is unwanted and thus practically has zero purchase cost; on the other hand, its degradation is desirable, since in modern societies, wastewater cannot be discharged into the aquifer or surface water bodies (i.e., sea, rivers, lakes, etc.), unless it goes through quite expensive treatment satisfying quality parameters.
As far as the study of economic characteristics is concerned, the relevant research is limited. In 2005, the installation cost of a classic MFC for sludge treatment as a power unit was estimated between 1,300 $/kW for a power density of 400 W/m
3and 5,200 $/kW for a power density of 100 W/m
3(
Logan, 2008). While the installation cost of an anaerobic sludge digester as a power unit was 1,800 $/kW versus the indicative price of 1,000 $/kW for a conventional thermal unit. Of course, its use is required for the treatment of sewage sludge. To keep the MFC installation cost in line with the cost of the anaerobic digestion unit, the cost must amount to about 720 $/m
3, while to reach the biological filter levels must fall to 530 $/m
3. In 2010, the cost reduction could succeed with technology development (
Pant et al., 2011). Specifically, the indicative price for the electrode chamber is as follows:
• 4,000 €/m3 in 2006, with a capital cost ten times that of its corresponding part of anaerobic digestion,
• 2,025 €/m3 in 2008, including the cost of graphite felt anode electrodes, platinum descent electrodes with catalyst, membrane, current collector, and reactor,
• 2,816 €/m3 in 2010 for a complete industrial scale MFC system for wastewater treatment 100,000 m3/day consisting of 1,667 individual cells,
• 1,137 €/m3 in 2010, including the cost of anode electrodes from activated carbon, platinum-free cathode, membrane, current collector, and reactor.
It is noted that the catalyst cost per Watt increases significantly as the catalyst loading increases in a linear trend (Santoro et al., 2018b).
In Fornero et al. (2010), the economic comparison between an AS wastewater treatment plant (AS-WT) and an MFC one had been carried out theoretically fοr 100,000 L/day with a biochemical oxygen demand (BOD) at 2,000 mg/L, where the former was slightly superior to the latter (32,760 $/year and 35,731 $/year, respectively, in 2008). It has been clarified that the respective MFC systems have been proposed to be implemented by utilizing 1,667 MFC modules with anode volumes of 20 L for a hydraulic retention time of 8 h. In Wang et al. (2013), the energy production of different sewage sludge was examined using MFC technology, taking into consideration the energy losses in pumps, reactors, membrane cleaning, etc. The recovered energy could reach 0.689 kWh/kg in case of a dynamic membrane separation bioreactor with MFC, 0.223 kWh/kg in case of a low organic loading membrane reactor with MFC, 0.435 kWh/kg in case of a conventional membrane bioreactor with MFC, however, no economic comparison was performed. In Li et al. (2014), the normalized energy recovery had been estimated at 0.004 kWh/kg COD with a profit of 0.0005 $/kg COD using MFC instead of normalized energy consumption at 0.6 kWh/kg COD for AS-WT with a cost of 0.12 $/kg COD in 2014. However, the MFC capital cost was 30 times the AS-WT capital cost, with a typical lifespan of 10 years, rendering the MFC approach nonviable financially (equivalent total cost 3.0 $/kg in 2014). In Stoll et al. (2016), classical MFC systems, with different anode materials, for domestic wastewater treatment, had been evaluated thoroughly, applying electrochemical impedance spectroscopy, cyclic voltammetry, and rRNA sequencing, with no mention of the technical lifespan. More specifically, one 20-ml chamber has been used, with three different titanium core anodes: graphite brush, hard carbon felt, and carbon foam. The normalized cost, based on power output had been estimated at 8.42, 4.55, and 48 $/mW, respectively, in 2016. It is noted that in all cases, the cathode electrode was from stainless steel mesh, coated with a specialized activated carbon powder mixed with de-ionized water and polytetrafluorothylene. In 2017, a continuous flow rate tubular MFC, with a cost of 60 $/m3 treated wastewater, was presented, with an analytical description of capital and operation costs for a 10-year operation life (Lu et al., 2017). Furthermore, the microbial electrolysis fuel cells (MECs), for hydrogen production using urban wastewater, have been proposed, presenting some financial data and claiming that MECs could be applied in the future (Khan et al., 2017).
In Ding et al. (2017), a swine wastewater treatment plant was proposed, based on single-chamber air–cathode MFCs with a solution volume of 340 ml in laboratory scale, with an additional low-cost flocculation process, achieving an energy recovery of 0.664 kWh/m3 wastewater mixture (consisting of 40% raw swine wastewater and 60% denitrified effluent wastewater), a net economic profit of 0.024 $/m3 (in 2017), a COD removal efficiency of 96.6%, an ammonia removal efficiency of 60%, power density of 37.5 W/m3, a Coulombic efficiency of 21.6%, and without noting the capital cost. In Trapero et al. (2017), an extensive research for the theoretical scale-up, industrial commercialization of MFC technology, was presented based on the net present value (NPV) and internal rate of return (IRR), implementing a sensitivity analysis for the installation cost, COD removal, and Coulombic efficiency, using high organic load wastewater from a juice processing plant. The respective results were quite satisfactory and financially viable against an AS-WT. Specifically, the proposed wastewater treatment plant consisted of 10 MFCs in a series electrical connection and parallel hydraulic connection. Each MFC had a 2.25-m3 anolyte chamber, a 1.125-m3 catholyte chamber with a 20-mm methacrylate wall, carbon cloth electrodes, a catalyst cathode with platinum or without platinum, a proton exchange membrane (PEM), and its own electromechanical machinery (DC to AC converter, pump, air blower, etc.). The hydraulic retention time was determined at 10 h, and the effluent flow rate at 54 m3/day. The capital cost for the MFC installation reached 43,010 € (for a non-platinum catalyst) and 44,850 € (for a platinum catalyst), while that for an AS-WT reached 36,000€ in 2017. The detailed cost of the equipment has been presented in Table 1 of Trapero et al. (2017). So, the equivalent capital cost with respect to the effluent flow rate was 796.5 €/(m3/day) for a non-platinum catalyst, 830.6 €/(m3/day) for a platinum catalyst, and 666.7 €/(m3/day) for the AS-WT. Furthermore, at every 5 years of MFC operation, the electrodes and the PEM should be replaced with a total extended maintenance cost of 5,900 € for a non-platinum catalyst and 7,500 € for a platinum catalyst, raising the equivalent extended maintenance cost (with respect to effluent flow rate) to 109.3 and 138.9 €/(m3/day), respectively. In all the examined cases of electric energy production in combination with high organic load wastewater treatment, the NPV was positive, for an investment life period of 15 years, taking into consideration the maintenance cost per 5 years, even when the pessimistic scenarios of COD removal and of Coulombic efficiency were tested. In Logan (2015), the cost of an MFC for a wastewater treatment plant reached to 1,870 €/m2 membrane area in the case of the typical MFC configuration based on a graphite brush anode, air cathode with carbon cloth platinum electrode, PEM Nafion membrane, and polytetrafluoroethylene diffusion layer. This cost was crucial, as a reactor chamber of 1 m3 could incorporate 10 m2 of membrane, using 10 modules in a parallel design (a single anode–cathode module of 1 m2 is 10-cm thick). If new inexpensive materials for catalysts, membranes, and electrodes were used, the cost could drop at 36.55 €/m2 membrane area, making the investment financially viable. In addition, in Tommasi and Lombardelli (2017), the energy payback period was examined and found equal to 546 years for a typical MFC and equal to 2.7 years for a benthic MFC, which means that only the latter is of practical use. In 2018, the normalized recovery energy based on COD was estimated at 0.216 ± 0.048 kWh/kg-COD, for a flat panel air cathode MFC, using domestic wastewater, with anode spacing of 5 mm and hydraulic retention time (HRT) of 30 min (which is quite satisfactory), while the total electrical energy recovery was equal to 0.63 kWh/kg-COD (Park et al., 2018). That increase was due to methane emission at a subsequent treatment stage. The proposed MFC solution was inferior only to the anaerobic system (0.99 kWh/kg-COD). In some cases, no electrical production is achieved, but the electrical consumption is limited, i.e., ammonium nitrogen recovery from wastewater as fertilizer needs 1.6 kWh/kgN using a bioelectrochemical system (Losantos et al., 2021) or 6.1 to 8.2 kWh/kgN using a three-chamber bioelectroconcentration cell instead of 25 kWh/kgN in AS process and fertilizer production (Koskue et al., 2021). In bioelectrochemical systems, CO2 is converted to CH4 through electromethanogenesis having a specific energy consumption of 16–18 kWh/m3 CH4 (Rodríguez-Alegre et al., 2019). Similarly, no electrical consumption has been referred to in nutrient recovery systems from human urine (Freguiea et al., 2019).
In conclusion, various criteria have been applied for the economic evaluation of the MFCs, and the respective results have been ambiguous. In 2006, the MFC was not financially viable as a single power generator (Logan, 2008). The same conclusion was reached, taking into consideration the typical values of the power level, the efficiency (from power input to electrical output), the technical lifespan, the capital cost per installed nominal active power, and the capacity factor for classical power plants (e.g., coal steam plant, gas turbine, combined gas turbine, etc.), common renewable energy sources (e.g., solar photovoltaic panels, wind turbines, geothermal steam plant, hydroelectric plant, etc.), and the usual fuel cells (e.g., phosphoric acid fuel cell, molten carbonate fuel cell, etc.) (see Table 3 in Sharaf and Orhan, 2014). However, the application of the MFC in a wastewater treatment plant will lead to economic viability of the investment if the wastewater treatment cost is significantly curtailed (Logan, 2008) and if the scale-up technical issues of the MFCs are solved, because full-scale wastewater treatment plants do not exist until today and only few scaling-up trials have been examined in actual plant conditions (Martinucci et al., 2015; Cristiani et al., 2019). Similarly, the electric power production, through bioelectrochemical processes, is quite promising on the condition that pilot studies and targeted future research are carried out, giving favorable results (Leicester et al., 2020).
In this article, the essential conditions for the economic viability of the MFC are investigated and the MFC application in a smart grid is examined, since the connection between MFCs and smart grids has not been presented according to the relevant bibliography. Specifically, the MFC wastewater treatment plant is being utilized as a power plant on a theoretical basis similar to that mentioned in Trapero et al. (2017), with the sole difference being the use of domestic wastewater (instead of high organic load wastewater from a juice processing plant), which is ample in cities, towns, and villages. Initially, the reasons for an MFC installation, the issues of MFC scaling-up, and the respective advantages and disadvantages are presented here. Then, the MFC sizing (for an urban wastewater treatment plant) is carried out (instead of an AS system), the capital and operation costs are estimated, and the financial viability is studied based on the classical economic criteria, such as NPV, benefit–cost ratio (BCR), IRR, and discounted payback period (TDPB). However, either of the technical (e.g., the ratio of organic load removal over influent, MFC Coulombic efficiency, etc.) or financial (e.g., capital cost, extended maintenance cost, deflated interest rate, investment life period, etc.) parameters have not been univocally specified, therefore an extended sensitivity analysis is performed. Additionally, the advantages and disadvantages of the MFC installation in smart grids are analyzed thoroughly. Τhe respective results show that the MFC application, as a power generator, is no utopia, on the condition that the MFCs are integrated into a wastewater treatment plant and the scale-up technical issues of MFCs are solved.
2 Materials for Wastewater Treatment System Configuration With MFC
2.1 Biological Treatment General Structure
In essence, the MFC is examined within the context of its incorporation in a waste treatment unit in order to acquire a low-cost fuel in large quantities. The kind and level of such wastewater treatment (liquid sewage or waste of specific industrial units) depend on the characteristics of the recipient or the scope of its reuse. The minimum required treatment involves mainly the removal of suspended solids and organic materials to a smaller or larger degree (Von Sperling, 2007; Spellman, 2014). The main stages of such an installation are described in Figure 1. With a suitable combination of its main components, it is possible to achieve the required degree of treatment each time.
FIGURE 1

Flow chart of a biological treatment installation: the dashed “black” line represents the sludge flow; the continuous “gray” line represents the treated waste flow; and the dashed “gray” line in grey represents the alternative flow of treated waste.
In particular, the following stages are included:
1. Preliminary stage: the removal of inorganic materials (i.e., coarse solids and grit) is mainly accomplished with physical procedures (i.e., screens and grit chamber).
2. Primary treatment stage: it includes settlers where a partial removal of the organic materials (mainly settleable, suspended, and floating solids) is achieved with physical/physicochemical procedures.
3. Secondary treatment stage: this consists mainly of biological procedures. With the use of some sort of biological reactor and a final settler, the almost complete removal of suspended materials is attained and the removal of a larger part of the soluble organic substances. Moreover, in certain cases, the removal of phosphorous/nitrogen can also take place.
4. Tertiary treatment stage: it is the synthesis of individual units, which varies with respect to the waste being treated. Such units are a refinery or a membrane installation. The removal of nutrient components (nitrogen and phosphorous) takes place at this stage, if not already concluded at earlier stages, with the aid of additional biological procedures.
5. Disinfection stage: this stage aims at the elimination of all pathogens and is applied when there is risk of contamination to the final disposal (irrigation and swimming facilities).
6. Sludge treatment stage: this is the stage in which sludge, retrieved from the previous four stages, is properly treated so as to acquire a form appropriate for the easy and safe disposal of the by-products. It usually consists of thickeners, digesters, and dewatering systems.
2.2 Microbial Fuel Cell Installation in a Biological Treatment System
Taking into consideration the functional chain of a wastewater treatment system, an MFC can easily be used to replace/modify elements of the secondary waste and sludge treatment, whereas it should be more difficult to replace components for the removal of nutrients and heavy metals. To this end, the following alternatives have been suggested (
Logan, 2008;
AlSayed et al., 2020;
Leicester et al., 2020):
• Replacing the AS system or the biological filter: in this case, the MFC will be used similarly to the a biological filter having a conventional role, as shown in Figure 2. The MFC, due to the formation of a biofilm, is more effective in the removal of the organic load diluted within the waste and less in organic solids. Hence, it is necessary to include a procedure for solids retention, in order to obtain the required solids treatment with regard to domestic sewage. The treated waste recirculation is not required at the MFC inflow, since it operates in the anaerobic state, contrary to the biological filter which is open to atmospheric air. The operational design of the solid contact tank and that of the settler is dependent on the MFC solid effluence, operating similarly to the solid effluence of the microbial biomass of the biological filter.
• Using a membrane bioreactor: in this case, the MFC is combined with a membrane bioreactor, as shown in Figure 3. The reactor consists of a series of membranes through which wastes are channeled, solids are filtered, and the biomass is retained on the filter, functioning simultaneously as a treatment and settling element. This method is quite expensive due to the energy consumed for the aeration and filtering. The MFCs can be used to reduce energy consumption, because they are electric power producers (not consumers), the organic solids production and the oxygen demand are reduced.
• Developing the MFC as a membrane bioreactor: this is based on the construction of cathodes that are capable of functioning both as cathodes and filter tubes. The advantages of this solution are the smaller size of the reaction chamber and the reduced power consumption in comparison to the standard membrane reactors, while the risk of an emphraxis is also high. Furthermore, the standard bioreactors function under the presence of atmospheric air throughout their tube, so as to reduce the accumulation of solids due to bacterial growth, while the MFCs function anaerobically. The use of a ventilated MFC bioreactor is under examination as most electrogenic bacteria can function both aerobically and anaerobically. Certainly, the solution of the intermediate aeration requires further examination (Logan, 2008; AlSayed et al., 2020).
• A sediment MFC can be used, in which the sludge is diffused appropriately in sediment form, inside the anode chamber, which it fills (Abbas et al., 2017). Alternatively, the combination of the MFC with the appropriate hybrid systems can be constructed. For instance, two MFCs can be used, the first one with an upflow dynamic membrane separation reactor and the second one with a low organic loading membrane bioreactor, so as to improve the effluent quality. Another solution is a hybrid system combined with a conventional membrane bioreactor (Wang et al., 2013).
• Developing the MFC for the removal of nutrients (nitrogen and phosphorous compounds): In this case, hybrid bioreactor systems with parallel nitrification ‐ denitrification in cathode (Park et al., 2017), or two sets of MFCs (aerobic and anaerobic cathode), or tubular MFC etc. (Kelly and He, 2014) can be employed. The nitrates removal percentage for domestic sewage varies from 70 to 97% with a retention time of 1–144 h and removal rates from 0.001 up to 0.62 kg-N/m3/day in the laboratory scale (Park et al., 2017).
• Developing the MFC for the removal of heavy metals: Specialized MFCs are used at the secondary treatment stage in similar forms with the respective ones in Figures 2, 3, as long as the respective metals are suspended within the waste. In case of solid particles formation and their removal in sludge form, the corresponding MFC needs to be placed in the sludge treatment stage. In each case, depending on the type of wastewater metal, more MFCs may have to be installed in series, as each may remove specific metals (but not all) due to the use of additional chemicals or specialized bacteria with different retention times (Nancharaiah et al., 2015).
FIGURE 2
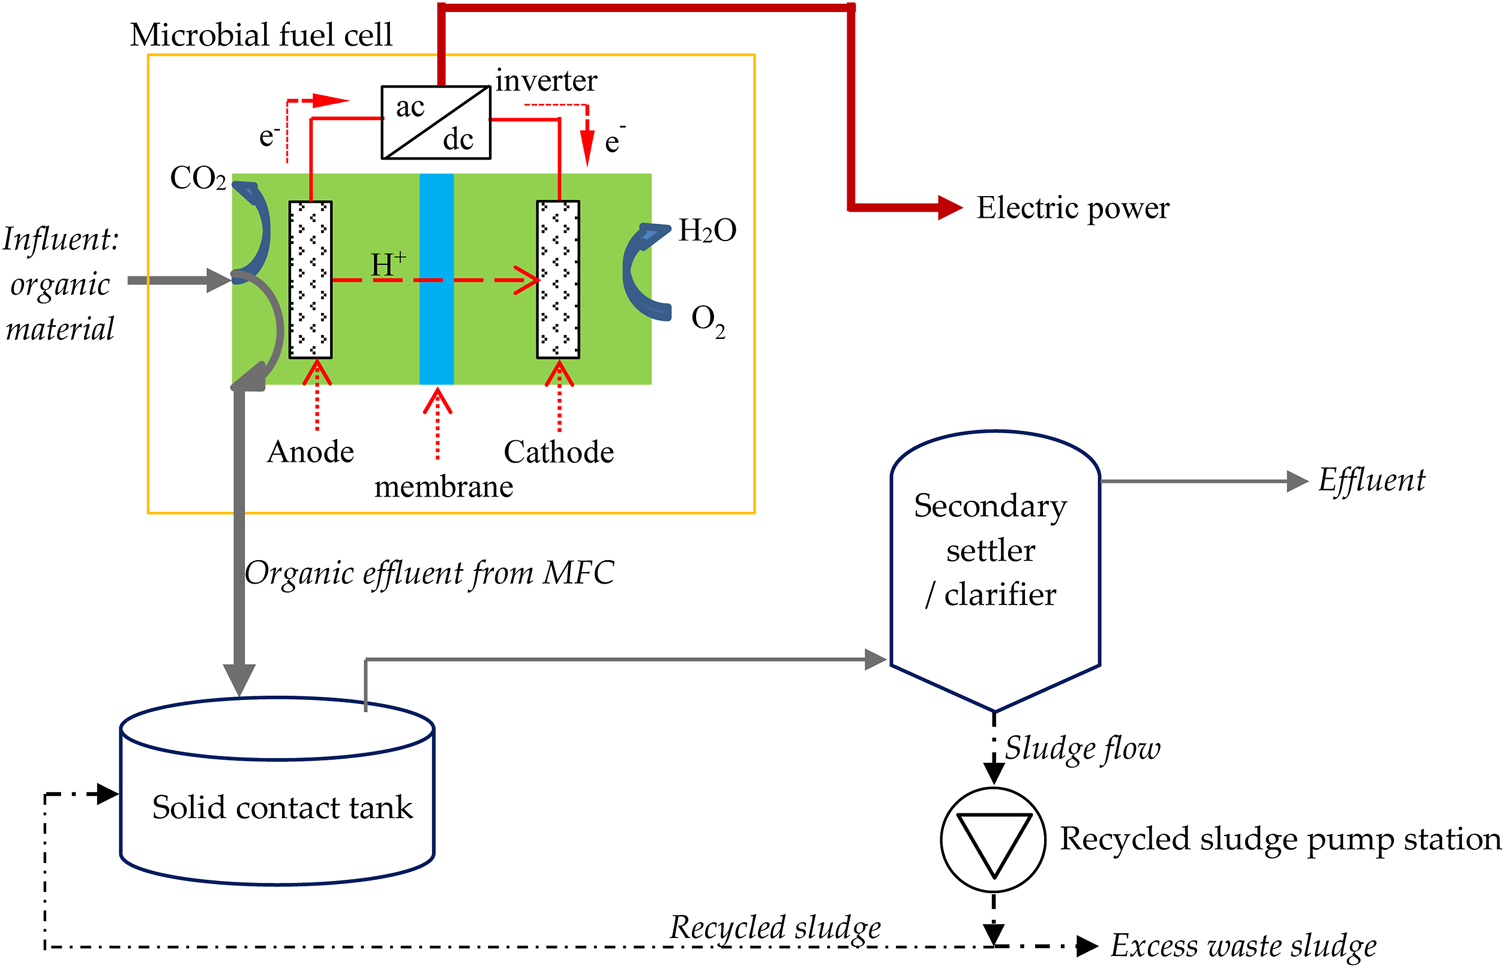
Flow chart of the conventional installation of a microbial fuel cell at the secondary treatment stage, placing downstream a solid contact tank, a secondary settler, tube, and recycled sludge pump station (Logan, 2008).
FIGURE 3
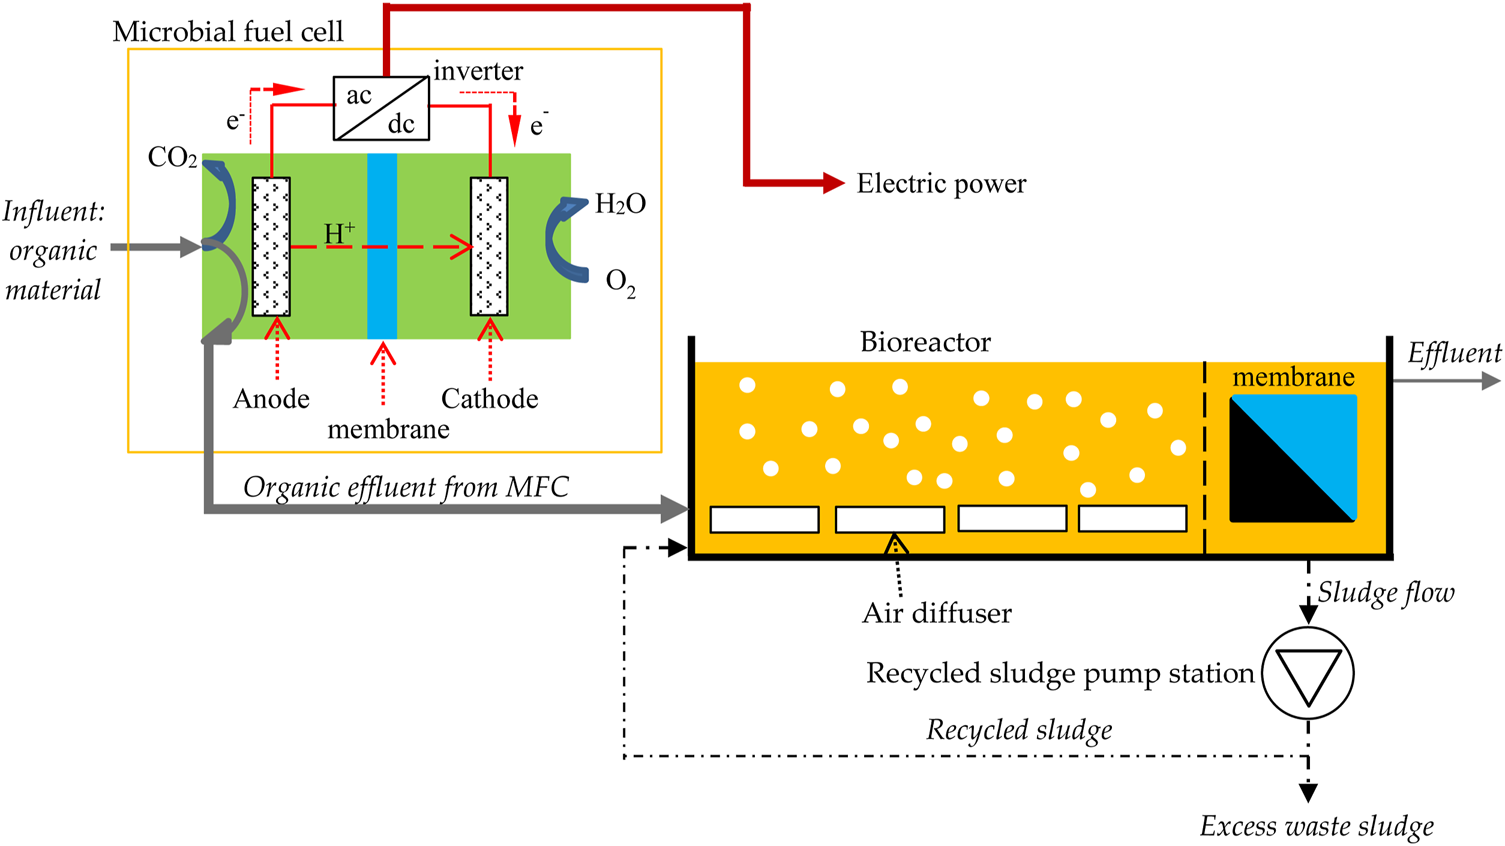
Flow chart of a microbial fuel cell installation at the secondary treatment stage with the use of a membrane bioreactor receiving the required power from the cell (Logan, 2008; AlSayed et al., 2020).
2.3 Reasons for a Microbial Fuel Cell Installation in a Biological Treatment System
The main advantages of using MFCs over conventional bioreactors are as follows (
Logan, 2008;
AlSayed et al., 2020;
Leicester et al., 2020):
• Power generation: the produced electric current intensity depends mainly on the amount of wastewater, the organic load of the wastewater, and the Coulombic efficiency (CE). Alternatively, MECs are used to produce hydrogen.
• Reduction of waste aeration: in an MFC of one chamber with an air cathode, the transfer of the necessary oxygen is achieved passively. In any case, the air supply is considerably reduced compared to a secondary AS treatment system that requires about 50% of the electric power consumed by the waste treatment plant.
• Reduction of solids production: the MFC functions anaerobically, therefore the bacterial biomass production will be more limited than in the aerobic operation of an AS system or a biological filter. This has the effect of reducing the cost of expensive sewage sludge treatment installations.
• Potential for odor control: due to the anaerobic operation of the MFCs, it is possible to avoid the extensive—open to the air—areas of the biological filters, and the large quantities of air flow in the aeration basins of the AS systems, hence considerably reducing the release of disturbing odor to the surroundings.
2.4 Issues of Scaling-Up Microbial Fuel Cell Installation in a Biological Treatment System
So far, the experience around MFCs is mainly limited to laboratory sizes, while the cost per installed kW is quite high and its lifespan is undetermined under actual operating conditions. With regard to the configuration of secondary waste treatment plants, it would be ideal if the wastewater treatment efficiency and the power density remained unchanged when the MFC chamber size would vary in scale from a few cubic millimeters or a few liters up to cubic meters or even thousands of cubic meters. However, this does not happen because a number of issues should be solved (Liu and Cheng, 2014).
2.4.1 Increasing the Size of the “Electric Power” Plant
There are two main ways to develop MFC for industrial-sized waste treatment plants of hundreds or thousands of cubic meters:
i. Increasing the size of each chamber of the MFC: when increasing the volume of the respective MFC chambers from a few tens of milliliters to a few liters or more, a reduction in volumetric power density by 100 to 10,000 times has been observed. The main reasons that lead to the increased power loss are the following:
➢ Increase of the internal resistance of the MFC, which happens as the MFC chamber size is enlarged. In order to reduce the resistance, two solutions have been proposed:
⁃ Reduction of spacing between the electrodes: it reduces the solution resistance and pH variations, with the disadvantage of increasing the risk of short circuits or increasing the oxygen diffusion to the anode, which can eventually lead to a reduction in output power. Disadvantages are limited by the use of a low cost, thin, high power density separator/membrane between the electrodes, which prevents the growth of cell microorganisms on them so as to not degrade their behavior, but this can cause an increase in the internal resistance again.
⁃ Increase of solution conductivity and ability to absorb pH variations, which increase the power density by increasing the MFC chamber size. The cathode behavior is improved by lowering the pH using pure oxygen instead of air in the catholyte and increasing the flow rate. Electrolyte recirculation between anode and cathode chambers or the addition of acidifiers to the catholyte achieve pH balance. The use of acidifiers cannot be easily applicable to industrial-sized facilities.
It is generally recommended to increase the solution flow rate or the mixing intensity so as to decrease the accumulation of H+/OH− ions around the anodes/cathodes to tackle the reduced ability to absorb pH variations. A device with a small distance between the electrodes, with increased surface area, and the selection of high reactivity materials can limit the electrode potential and face with the low conductivity domestic sewage (Liu and Cheng, 2014). It is also possible to place more than one pair in series (initially the anodes and separately the cathodes) or not (e.g., anodes around a tubular cathode), or alternatively place elementary anode–cathode pairs in the same tank (Logan, 2008). However, the scaled-up height in self-stratifying membraneless MFCs (treating urine) is limited to some centimeters (Walter et al., 2020a).
➢ Non-homogenization of the chamber solution: it is mainly due to the different substrate concentrations and the hydraulic pressures in different parts of the chamber. The first problem has a negative effect on the mass transfer rate, electrochemical reaction rate, and power generation and is solved by increasing the mixing intensity by changing the hydraulic retention time (HRT) and by increasing the internal recycling flow rate and/or the air flow rate, provided that the biofilm does not detach from the anode electrode and a sufficient organic load is not removed. The second problem is due to the fact that the pressure increase causes a power density decrease in a nonlinear way. This may not affect the growth of the anode microbial community but presents a negative impact on the metabolism and electrochemical activity of exocellular electron transfer bacteria, which is solved only by finding pressure-resistant bacteria. The reduced cathode efficiency, due to high hydraulic pressures, results from the filling-up of the catalyst with water, followed by an increase in charge transfer resistance and diffusion resistance and is limited by the development of suitable geometric electrode forms (Liu and Cheng, 2014). Additionally, different MFC performances have been observed even in similar cathode chambers due to the reactor’s hydrodynamics, which is mainly related to the amount of dead volume and to the absence of granular graphite electrodes (Cecconet et al., 2018).
ii. Use of individual similar MFCs in stacks: Alternatively, a stack of individual medium-size MFCs can be constructed and connected either in series (to increase the voltage) or in parallel (to increase the intensity of the electric current). Existing experience shows that voltage reversal and short circuits (due to the presence of ions) lead to a significant reduction in the efficiency of in-series stack devices by reducing the theoretical expected values by up to 60%. Voltage reversal can be avoided by using high-efficiency air cathodes, maintaining similar catalytic activity in anode biofilms, and increasing homogeneity in substrate distribution between different fuel cells. The ionic short circuit occurrences are observed when the same anolyte or catholyte is being shared between different in-series fuel cells. Therefore, if the anolyte is separated into individual cells, ionic short circuits are practically prevented, but the manufacture and maintenance cost of the MFC stack increases. An alternative construction is a stack of MFCs connected in series as well as in parallel. In this way, the voltage of each cell and the respective electric current intensity are amplified, while the substrate is decomposed satisfactorily. Nevertheless, further research is needed on the interaction between the individual MFC and their interconnectivity to maximize power density and maintain the stable operation of the entire MFC stack (Liu and Cheng, 2014). Especially in terms of interconnectivity, experimental research is intense, sometimes leading to opposing results. For example, it is mentioned in Estrada-Arriaga et al. (2018) that when the hydraulic MFCs connection is in series and the electrical connection is in series or parallel, for domestic sewage treatment, the electrical in-series connection is advantageous. However, Asensio et al. (2017) reaches to an opposing conclusion. In particular, three experiments have been performed, the first with two identical MFCs with the same components but different behaviors, the second with five units hydraulically in series and then either in series or in parallel, and the third with 10 units hydraulically in series and then again either in series or in parallel. They suggest the in-parallel electrical connection of MFCs to improve electrochemical behavior and COD removal. The in-series connection only achieves an output voltage increase and not proportionally in the case of using a hydraulic connection. Repeatability is also a problem even for similar MFCs. The electrical in-series MFCs connection does not always ensure better power generation performance due to the higher resistance and reduced organic fuel toward the last cells. COD consumption and power generation are directly related to the membrane surface area of an MFC.
2.4.2 Reduction of Capital Cost
The MFC development on an industrial scale requires high capital costs due to the expensive materials. To reduce costs, it is necessary to use—for anodes, cathodes, and membranes—scalable materials with high efficiency and low cost. As for the anode electrodes, they need to have a brush-type current collector, made of either graphite—embedded carbon fiber around a corrosion-resistant metal core (such as stainless steel or titanium)—or activated carbon granules with tungsten or stainless steel. As for the cathode electrodes, the cost of which in a typical MFC reaches between 47 and 75%, the air cathode is recommended based on the development of inexpensive, metal mesh current collectors, such as stainless steel or nickel foam, which have low cost and high conductivity (Liu and Cheng, 2014). Alternatively, the abiotic cathodes can be substituted by biocathodes giving a simple, cost-effective way for developing MFCs (Cristiani et al., 2020; Santoro et al., 2021). Diffusion layers and binders such as polytetrafluoroethylene and polydimethylsiloxane are preferred over the expensive Nafion, and catalysts from non-precious metals or activated carbon instead of platinum. An additional difficulty in curtailing costs is the requirement of a complex three-state interface (solid-liquid-gas) for oxygen reduction, which makes the selection of the cathode material more difficult and the design of the cathode structure more demanding. In addition, the separator is another expensive component, necessary in large MFCs to place the electrodes at close range so as to reduce internal resistance and prevent oxygen diffusion to the anode. It requires the development of a low-cost membrane, capable of proton transfer and long-term stable behavior. A low-cost membrane could consist of a material such as fabric, made of noncontinuous fibers (short) and long fibers (continuous long), interconnected through chemical, mechanical, thermal, or solvent treatment. Still, the mechanical strength and long-term stable behavior of such a membrane needs improvement (Liu and Cheng, 2014).
2.4.3 Power Output Management
An MFC is difficult to connect directly to an actual electric load, even when operating at the point of maximum power generation, due to low voltage and current levels. This is why it is necessary for the MFC to operate with a power management system (PMS) in order to appropriately modify the electric current characteristics for powering electrical appliances. This system can harvest and use power by utilizing a DC to DC voltage boost converter or a DC to AC inverter, with the aid of modern high-frequency switching metal-oxide field-effect transistors, achieving a required stable DC voltage (e.g., 1.5 V or 3.3 V) or AC voltage, and high power exploitation levels of up to 75%. Furthermore, it is equipped with a suitable automatic control system that executes the maximum power point tracking algorithm minimizing the energy losses of the MFCs (Molognoni et al., 2014). In addition, it is common to use capacitors at the outlet of the MFC, where the desired amount of energy is expected to be stored and delivered at the appropriate time period by discharging the capacitor into the electrical circuit. In this way, low power sensors (of a few Watts) can be supplied. For large MFCs, it is also critical to limit the high power losses due to the large ohmic resistance of the big electrodes. This is because the distance between the areas where the electrons are generated/consumed and the leading-out/leading-in terminals (where currents flow in/out of the electrodes) increases as the size of the electrodes increases. The leading-out terminals arrangement plays an important role in the design of large chambers (Liu and Cheng, 2014). In any case, the appropriate automatic control system is required, since each MFC modifies its behavior in terms of power production over time (Premier et al., 2011).
2.4.4. Achieving Long-Term Stable Operation
It is desirable that the MFC operation remains unaltered in long-term time scale in order to maintain energy balance and to check the economic viability of the MFC investment with reliable data (
Liu and Cheng, 2014). But in reality, its efficiency decreases over time because of the following:
➢ Variations in the electrochemical activity of the anode biofilm: the wastewater substrate is influenced by many factors, i.e., the wastewater composition, substrate concentration, solution electric conductivity, solution temperature, etc., through various mechanisms which are not, as yet, fully predictable. In order to keep the electrochemical activity of the anode biofilm stable over time, one needs to focus on the following:
⁃ understanding the electron transfer between exocellular electron transfer bacteria and the electrodes,
⁃ increasing the biofilm conductivity in order to reduce its internal resistance,
⁃ understanding the correlation among the properties of the biofilm, the biomass diffusion, and the electron transfer,
⁃ understanding the complex interactions between exocellular electron transfer bacteria and other bacteria (of which some operate collaboratively and others competitively).
➢ Cathode behavior deterioration: over time, cathode behavior has been observed to deteriorate due to the following factors:
⁃ Deactivation of oxygen reduction catalysts: especially for catalysts based on metals, such as iron, cobalt, and platinum, the respective oxygen reduction reaction is hypersensitive to the MFC environmental conditions, which can change negatively due to chemical reactions, biological activity, and variations in catholyte composition. Also, the level of catalysts concentration in the catholyte significantly affects the efficiency, while the increase in pH and catalyst poisoning caused by polymeric substances of exocellular electron transfer of adherent microorganisms or of other ions within the waste adversely affect the oxygen reduction rate.
⁃ Contamination of the biofilm cathode: the development of a biofilm on the air cathode electrode side, in contact with the solution, may lead to a decrease in cathode efficiency in the long run, especially in single-chamber MFCs. A thick aerobic biofilm at the cathode can act as a diffusion barrier to H+ ions carried to the catalyst or can block the transport of OH− ions out of the electrode causing a significant accumulation of OH− ions in the cathode microenvironment leading to a lower cathode efficiency. Furthermore, aerobic bacteria can consume some of the available oxygen on the catalyst side, thus reducing the oxygen reduction rate. Catalyst poisoning may also occur due to exocellular electron transfer polymeric compounds of attached microorganisms. The result of utilizing a biofilm is an increase in internal resistance and a reduction in power generation. The problem can be solved by the reconfiguration of the catalyst using metal nanoparticles, the reduction of oxygen transfer to the electrodes in contact with the anolyte, the proper cooperation of bactericidal substances at the level of the cathode catalyst, the change of physicochemical properties of cathodes (Liu and Cheng, 2014). Santini et al. (2015, 2017) note that in all electrochemical systems operating in natural water, the formation of calcium carbonate on the cathodes impedes the electrochemical process and not the functioning of the biofilm, whose main function is the conversion of abiotic cathodes to bio-cathodes. Edvardsen et al. (2020) have investigated scale deposition on graphite electrode surfaces thoroughly. The use of biocathodes also allows Pt material to work, despite the poisoning caused by the presence of organics and other elements inhibiting the Pt catalysis in the wastewater environment (Cristiani et al., 2013). Additionally, the behavior of bio-cathodes is very promising and cost-effective, even though the scaling-up issues need further research (Ramanaiah et al., 2021).
⁃ Salt concentration and power collector corrosion: during the long-term MFC operation, concentration of salts on the surface of the cathode electrodes have been observed, which reduces the catalyst activity and the cathode efficiency. However, the relevant mechanisms of such concentration and its effect are not yet known. Using anticorrosive materials, such as stainless steel or carbon, can solve the problem, but attention must be paid to the ohmic resistance and the effective surface area when selecting the appropriate cathode power collectors.
➢ Fouling with undesirable materials: the mechanism is quite complex, as biological, chemical, and physical interactions between contaminators and separators occur simultaneously at the fouling process, reducing ion transfer capacity, conductivity, and ion diffusion coefficients, resulting in an increase of internal resistance and a pH change between the two electrodes. Consequently, the separator material needs to be designed in such a way as to avoid biofilm growth, salt retention, and reaction with other ions.
➢ Separator deformation: it is caused by gas and water being trapped between the separator and the electrode leading, in the long run, to a reduction in the MFC efficiency. The solution hides in the electrode construction using high hardness porous materials, such as stainless-steel mesh, which by compression provide suitable protection to the separator from deformation over time. Obviously, this aggravates the cost and construction complexity.
➢ MFC clogging due to biomass and solid pollutants: in case of flow of large amounts of biomass and solid pollutants through the urban/rural/industrial waste, clogging of the electrodes may occur (mainly the anode). Therefore, the organic load flow to the cell, through the waste, should be properly controlled (Liu and Cheng, 2014; Bolognesi et al., 2021a).
➢ Ambient temperature variations: in real constructions, the MFC is externally placed, consequently subjected to significant temperature changes during the year (e.g., from 0°C to 40°C, in the area of Athens, Greece), in contrast to the laboratory, where the range is more limited (e.g., from 18°C to 30°C). This affects the microorganisms’ activity in power production and waste decomposition significantly. So, it is very difficult to maintain a stable MFC efficiency at all temperatures. Of course, the operation of the classic secondary waste treatment plants is more sensitive to temperature variations.
Based on the above, it can be seen that constantly maintaining the MFC performance, in the long run, is quite difficult and complex, although there are now some pilot real waste treatment projects that have been operating at constant levels for some years (Liu and Cheng, 2014). In any case, and for their successful operation as waste treatment units, the HRT and power density (in relation to the flow and substrate composition) must also be taken into account, in addition to the appropriate configuration of the electrodes (Logan, 2008).
Generally, the performance of each wastewater treatment system is determined by discharge standards (effluent quality and volumetric treatment rate) according to the directives/legislation of the respective national or international regulatory authorities. However, the MFC performance, as well as of each biological treatment system, is affected by a number of operational factors which include (
Leicester et al., 2020):
• Waste and sludge composition, with the most characteristic elements being BOD, COD, total suspended solids, total nitrogen, total phosphate, and pathogenic microorganisms. This composition must be known at both the influent and effluent of the biological treatment system.
• The kind/composition and conductivity of the substrate, as the first one is affected by wastewater composition, while the conductivity is influenced not only by wastewater but also by the MFC electrical behavior.
• Organic loading rate, which is determined by the influent COD supply and the size of the reactor or the HRT.
• Reactor depth and volume.
• Volumetric treatment rate COD, which is defined by the reduction of COD in the respective HRT.
• Energy balance, calculated by comparing energy demands and energy recovery per mass unit of COD, where, in the case of a biological treatment with aerobic stage of secondary treatment, significant amounts of energy are required, while, with the use of MFC, clean power production can be achieved.
• Ambient temperature, which should ideally be between 10 and 25°C, otherwise bacterial growth and life span are strongly affected.
So, when comparing different systems, one should refer to the same benchmarks, which is not easily achieved.
2.5 Integration of Biological Treatment Plant With Microbial Fuel Cells in Smart Grid
Provided that MFC scaling-up issues are solved and full scale-up projects are realized, the use of biological treatment units, with MFCs (either in the secondary stage of biological waste treatment or in the tertiary stage during the removal of heavy metals, nitrates, phosphates, etc., or even in the sludge treatment), presents significant advantages when integrated into a smart grid, the most important of which are the following:
1. Conversion of a power consumption device into a partially controlled power producer: in a settlement or a city, the biological treatment plant is a significant consumer of electricity; for as shown in Logan (2008), an AS secondary treatment plant requires 1,020 ÷ 2,550 kW/(m3/s) of influent or with a membrane bioreactor requires 8,520 kW/(m3/s). By contrast, the respective MFC devices could produce a few hundred kW/(m3/s) theoretically. Since the primary waste treatment tank precedes, the waste flow can be significantly controlled, thus making possible the reduction of produced electric power variations over the 24-h period or by even adjusting it in the desired way (if this is allowed by the maximum possible influent, the biological treatment plant can process). Specifically, Figure 4 shows the correlation between influent/active power of the biological treatment plant with MFC. The produced active power curve P1(t) slides by a time delay with respect to the influent curve q(t), due to wastewater remaining at the primary treatment tanks and also because of the time required by the electrogenic bacteria to decompose the organic material. Alternatively, if through the primary treatment tanks the wastewater inflow into the secondary treatment is constant and corresponding to qmean, then the produced active power P2(t) is expected to approach the value of the mean produced active power Pmean, ignoring any environmental effects (temperature, etc.). In addition, with the help of PMS, primary treatment tanks, and perhaps small energy storage devices, the produced active power curve P3(t) can be adjusted to either the demand load (in combination with a suitable demand side management program) or to the electricity sale price, if the tariff is variable. At this point, it presents an advantage over wind turbines, photovoltaic units, and small hydroelectric plants due to the lower stochasticity of its “fuel”, but lags behind thermal units which use biomass or biogas. That is why it is suitable for installation in a smart grid. Alternatively, instead of direct power production from MFCs, one could turn to biofuel synthesis, through MECs [e.g., bioelectrochemical systems for electromethanogenesis could be used as power to biogas technology with gas storage capability (Ceballos-Escalera et al., 2020) or bioelectrochemical systems combined with heterotrophic microalgae batch reactors can convert CO2 into oil compatible biodiesel (Bolognesi et al., 2022)]. Consequently, these biofuels can be utilized in thermal power plants in a smart grid or elsewhere (Molino et al., 2015; Braco and Delfino, 2017).
2. Availability of metering devices: the operation of a system with MFCs requires an integrated system of automatic control of both wastewater and electrical quantities (of the cells themselves as well as of the AC converters), rendering them easily integratable on a smart grid, which requires complex metering devices to control and protect them.
3. Kind of distributed power generation: it has all the basic characteristics of a distributed energy resources with small stochastic behavior regarding the power produced, with the possibility of easy implementation of a demand-side management program, through the available PMS and the converters it already has. It can essentially be integrated with the other renewable energy sources (RES) into a smart grid, as shown in Figure 5, extending the respective power network schemes, as those shown in Figure 4 of Ullah et al. (2021) and Figure 1 of Narkhede et al. (2013) and Ullah et al. (2020).
4. Reduction of losses in power transmission and distribution networks: converting a biological treatment plant from a large power consumer to a small power production unit reduces the corresponding power losses on the transmission and distribution lines, thereby reducing the environmental impact of the power system and enhancing sustainability.
5. No spatial expansion of the facilities: the biological wastewater treatment plant with MFC in the secondary stage does not require a larger area than the conventional installations do (such as AS clarifiers and oxidation basins). Furthermore, the process is done in closed structures, without the use of oxygen, thereby reducing odor issues (Logan, 2008). However, reducing the gross volume of the installation remains an outstanding challenge. For instance, in Blatter et al. (2021), an MFC system treating 1 m3 of wastewater, in industrial scale, occupies a gross volume of 16.3 m3.
6. Limitation of visual nuisance vis-a-vis other RES: since the biological treatment plant must be constructed for environmental treatment purposes, it does not impose further visual burden on the environment, since it would anyway exist, unlike other RES (mainly wind turbines and photovoltaic panels) which occupy additional land.
7. Improving power systems behavior in terms of power quality and reliability: due to lower stochasticity in the supply of “fuel” (i.e., waste and the corresponding organic load) and its much more limited fluctuations, the MFC integration improves power reliability and quality of distributed generation in a smart grid, in relation to the corresponding behavior of the dominant RES (wind turbines and photovoltaics).
8. Intensified research on the MFC development: it is the most promising technology, constantly evolving and improving over the last decade, while already yielding economically viable results for high organic load wastewater on a theoretical basis (Trapero et al., 2017), which leads to larger power densities freeing the environment from the effects of aquifer pollution from the most polluting wastes.
FIGURE 4
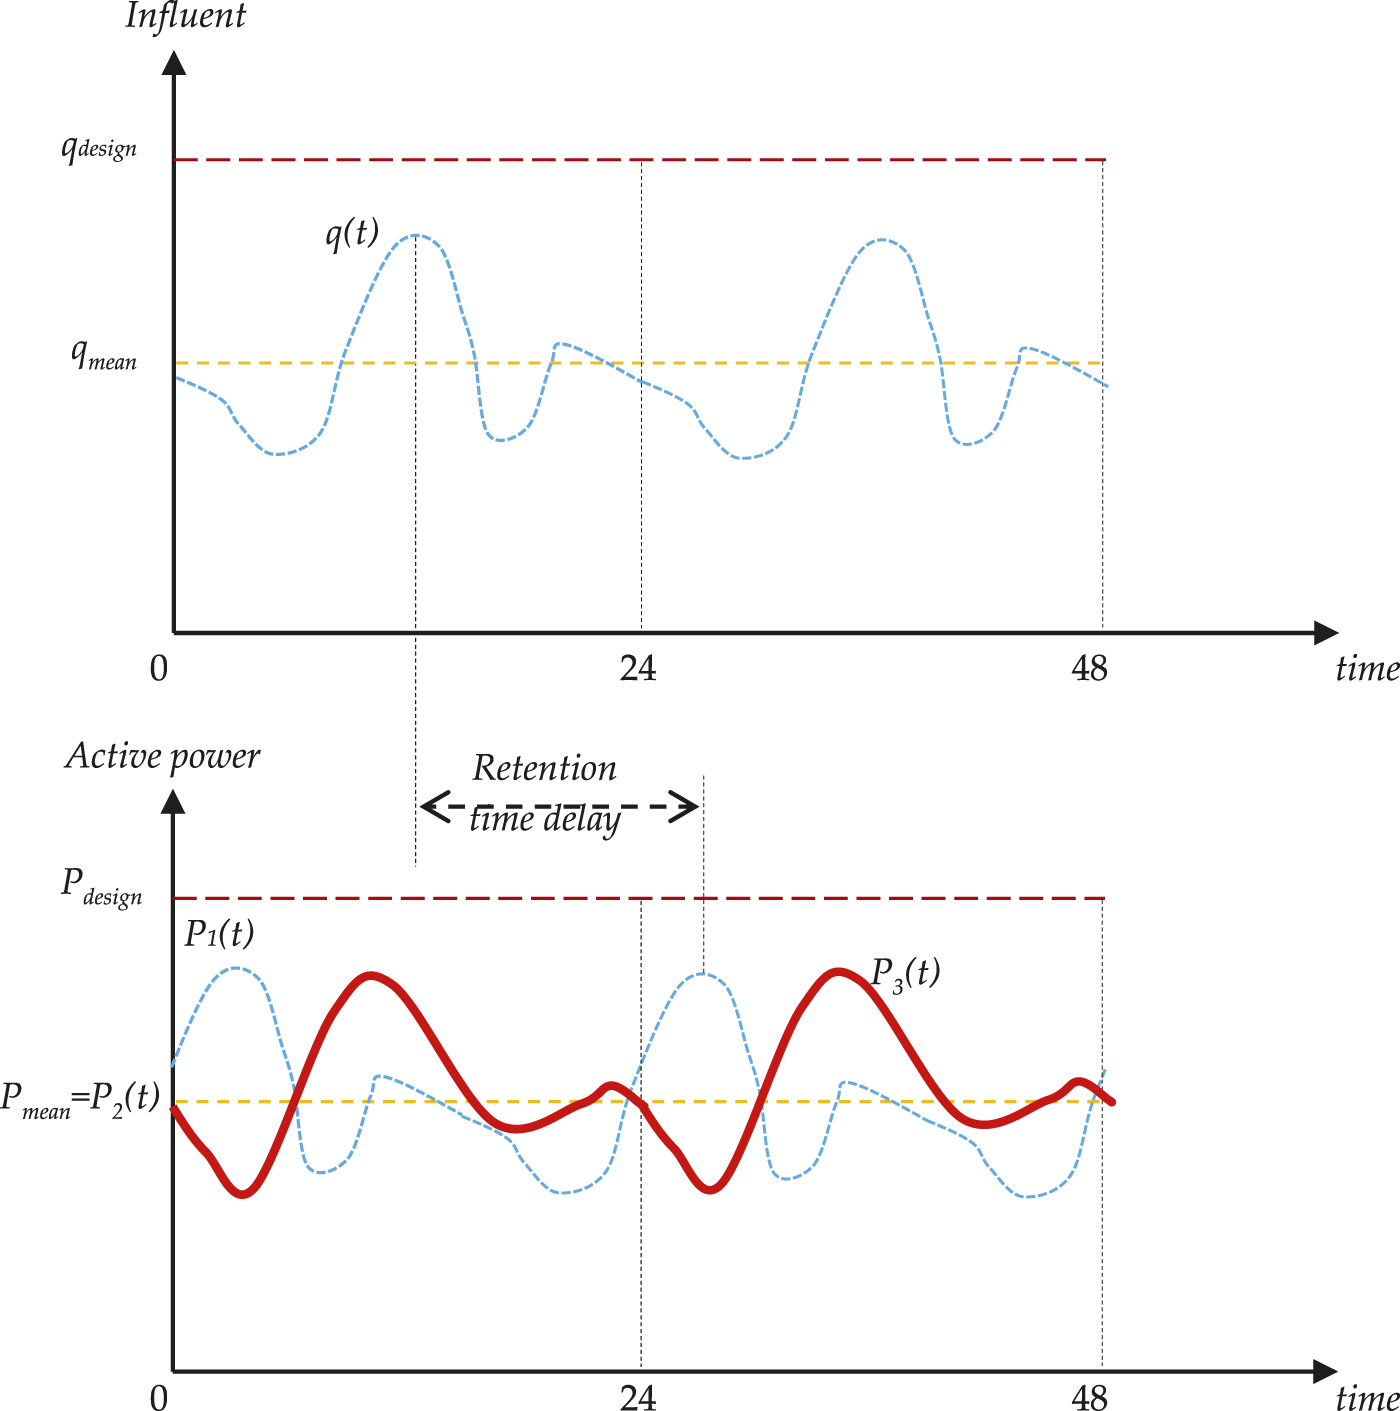
Correlated influent and active power curves, over time, of a wastewater treatment plant with MFC.
FIGURE 5
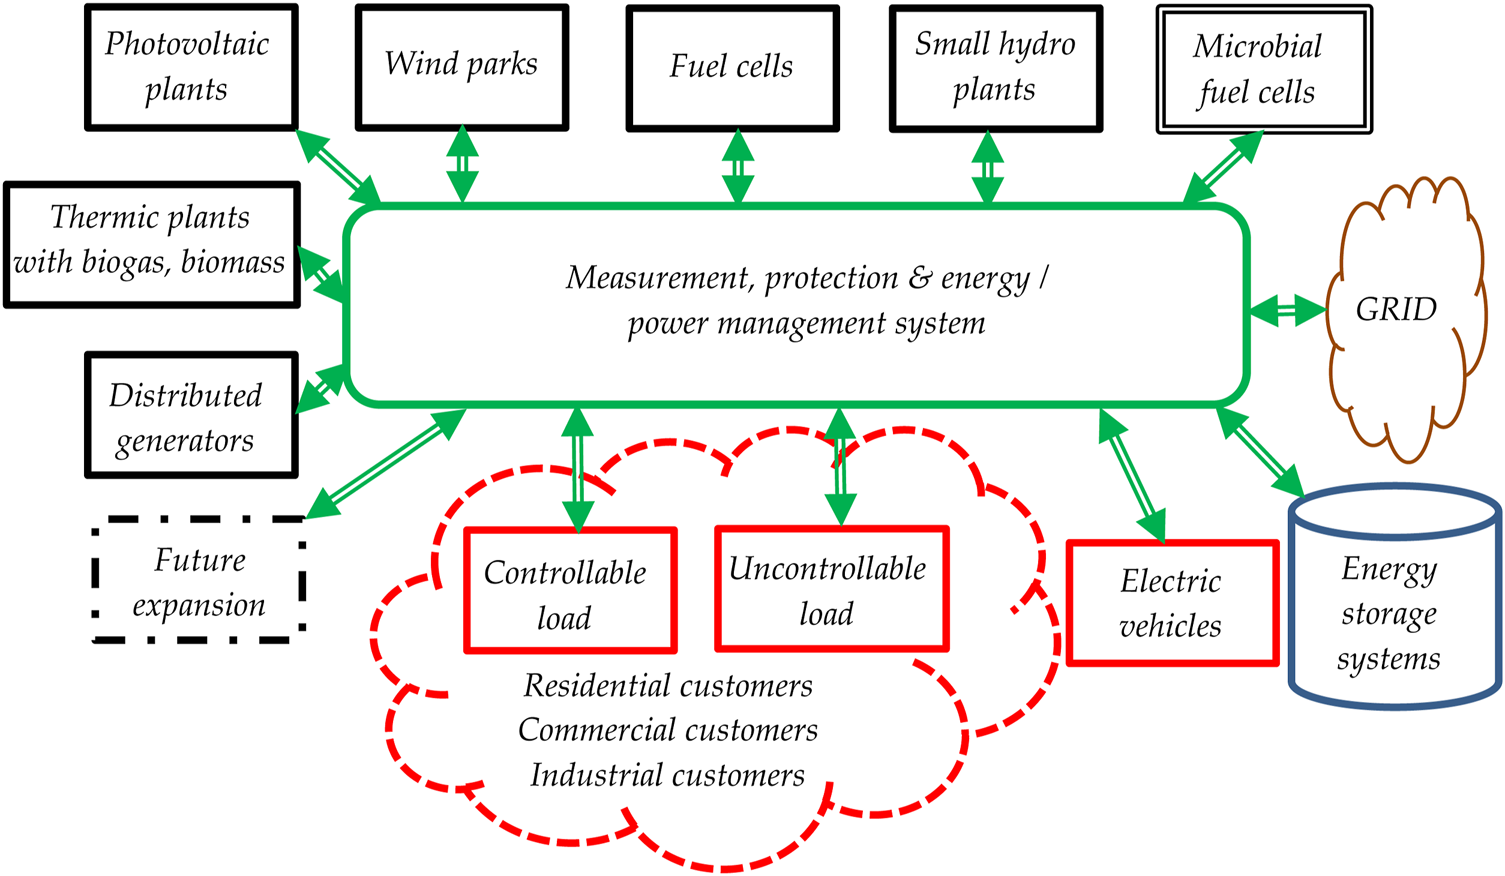
Virtual power block diagram for smart grid.
Nevertheless, and in spite of their advantages, MFCs have not yet found commercial application, since there are a number of disadvantages at present, the most important of which are the following:
1. High installation and maintenance costs per kW: the installation cost per kW as an individual electric power plant has not been investigated because emphasis has been given in wastewater treatment financial characteristics. From indicative reports and further processing, it is of the order of 100 k€/kW for wastes plentiful in organic load (e.g., wastewater from fruit juice factory with 15 gr/l with a COD reduction by 60% and Coulombic efficiency by 10%) (Trapero et al., 2017), while for domestic/urban wastewater becoming even greater (proving to be multiple, compared to the already existing units—e.g., coal plants, 1.1 ÷ 1.7 k€/kW; wind parks, 0.85 ÷ 2.55 k€/kW; and photovoltaic plant, 1.2÷3.5 k€/kW). However, as a cogeneration power plant (i.e., taking into account its role as a wastewater treatment plant), it results in the proposed technical solution being economically viable over a 15-year period for different types of MFCs (with platinum catalyst—high power density and without platinum—low power density) for various COD removal and Coulombic efficiency scenarios (Trapero et al., 2017), provided that the scale-up technical issues of the MFCs are successfully addressed. The latter is supported theoretically by Logan (2008), Fornero et al. (2010), Wang et al. (2013), Sharaf and Orhan (2014), Logan (2015), Khan et al. (2017), and Park et al. (2018), whilst the opposite is supported by others (Tommasi and Lombardelli, 2017). In any case, its technological improvement is very promising, in terms of reducing the cost of membranes and electrodes according to Sharaf and Orhan (2014), provided that it is considered as a combination of wastewater treatment plant and power plant and not as a power plant alone.
2. Technological maturation lag: the relevant technology around MFCs has not yet achieved the required levels of maturation, but is still constantly evolving. Therefore, the basic technical solutions for various issues have not yet emerged, e.g., what is the appropriate retention time inside the MFC chamber in order to achieve the appropriate COD removal; depending on the electrogenic microbes used, what are the most suitable materials for making membranes and electrodes; and what are the most suitable dimensions of the tanks? In addition, the long-term operation of the respective devices has not been tested thus far. At present, there are speculations for a lifespan of 15 years, while they have been experimentally measured/tested for up to 1 year (Liu et al., 2017; Blatter et al., 2021).
3. Issues regarding the up-scaling of MFCs: according to Section 2.4, the necessary technological development has not yet been achieved to up-scale the MFCs to industrial size, although in the last 5 years, MFCs systems of up to 1 m3 have been developed with satisfactory efficiency (Blatter et al., 2021).
4. Use of microbes for power generation: the MFC operation is based on electrogenic and non-electrogenic microbes/bacteria, which act in synergy on the MFC electrodes (Santoro et al., 2021). However bacterial behavior is affected by a variety of parameters, such as the nature and size of the organic load (in COD and BOD), possible microbe poisoning, ambient temperature, and wastewater pH (Logan, 2008; Liu and Cheng, 2014). Hence, their behavior is uncertain. However, their stochastic behavior is more limited than that of wind turbines and photovoltaic panels.
5. Reconfiguration of the power distribution network: the conversion of a wastewater treatment plant from a power consumer to a power producer, through the use of MFC, results in the alternation of power flow behavior of the respective distribution power network (from mono-directional to bidirectional), resulting in changes in the electric power protection devices and in the dimensioning of the conductors and other components with respect to short circuit studies. Of course, this problem exists with all distributed energy recourses and with the development of smart grids.
6. Limitations to produced power and energy: depending on the amount of influent, the nature of the organic load, the nutrients and metals contained, and their treatment method, as well as the desired levels of purity of the effluent (in terms of BOD, COD, pathogens, etc.) to the final recipient (sea, rivers, and lakes), which largely determine the produced electric power and the annual energy delivered to the grid.
7. Limited location options for utilization by wastewater treatment plants: the location sites of wastewater treatment plants (regardless of whether they are with MFC or AS) are limited, since the sewerage network is mainly gravitational and of radial operation, that gathers, in a final pipeline, the total of the wastewater and transfers it to the respective plants, which is at a lower or equal altitude as that of the settlement/city being served. It also requires specialized staff at present and with current technology, which creates additional difficulties in terms of its operation.
8. Uncertainty concerning economic viability: due to the high installation cost (as pointed out in the first disadvantage), along with the high maintenance costs, the issue of financial viability is always raised, which is examined in each case separately (Trapero et al., 2017).
Despite their disadvantages, the advantages of MFCs are enough to warrant further examination.
3 Method of Economic Comparison Between MFC and Activated Sludge Urban Wastewater Treatment Systems
3.1 Introduction
Essentially, the way of studying wastewater systems with MFC, presented in Trapero et al. (2017), is extended here for the case of urban wastewater using the layout of Figure 1 in Trapero et al. (2017), modifying more econometric parameters. The preliminary theoretical design of the wastewater treatment system takes place and the relevant methodology is based on three stages: 1) determination of the wastewater supply characteristics, 2) preliminary study of technical/economic characteristics of the MFC wastewater treatment system against the AS system, and 3) economic evaluation—comparison, as analyzed below.
3.2 Stage of Typical Wastewater Supply Determination
By convention, based on Koutsogiannis (1999), the design period Tdesign is 40 years (which exceeds the technical life Ttech of the wastewater treatment plant, and is considered indicatively to reach 15 years due to technological aging). The population Ppop and the area Αtown of the under study region can either be considered constant over time or they can change up to the maximum value, during the technical lifespan Ttech. Initially, the average daily domestic water consumption per inhabitant qhab, the equivalent daily consumption of small/large industries qind, and the equivalent daily community/municipal consumption qmun are determined through relative statistical analysis, so the total average daily water consumption per inhabitant q/tot is equal to:
If the ratio of water consumption entering the sewerage network is ρ, then the total average sewage supply per inhabitant qtot is equal to:
Therefore, the total average daily supply of sewage by inhabitants is equal to:
In addition, the subterranean aquifer is at a relatively large depth, and the sewerage network is completely modern. So, based on Equation 2.12 of Koutsogiannis (1999) concerning infiltration in the sewerage network due to the area, for new networks (with watertight wells and elastic sealing rings of the joints), it results from a statistical/empirical study that the additional inflow per hectare qi is equal to:
So, the additional inflow to the network Qi, due to infiltration, etc., is equal to:
Therefore, the total average daily supply of untreated wastewater Qwaste, or nominal supply, is equal to:
Since the primary wastewater treatment system is common and mandatory, it is not taken into account in the techno-economic study. Simply, if the urban wastewater initially had a content in chemical oxygen demand CODin1 and biochemical oxygen demand BOD5-in1 (after dark storage for 5 days in 20°C) after the primary treatment, the resulting quantities of primary treatment outflow and secondary wastewater treatment inflow CODin2 and BOD5-in2 (through the respective removal ratios rCOD-1 and rΒOD-1) are:
Three main variables can already be noted that affect the financial viability of the investment which are: 1) the total average daily supply of untreated wastewater Qwaste, 2) the chemical oxygen demand CODin2, and 3) the biochemical oxygen demand BOD5-in2 at the secondary treatment inflow.
3.3 Preliminary Study Stage of Techno-Economic Characteristics of Urban Wastewater Treatment Plant With MFC Against the Activated Sludge System
The steps of the preliminary study stage are the following:
• Basic MFC size calculations for secondary treatment: based on the standard MFC in Trapero et al. (2017) of a specific anode chamber volume Vanode and with a hydraulic retention time tHRT, the required number of MFCs nMFC is determined using the nominal wastewater supply Qwaste:
where
tMFCis the annual operating hours of the MFC. The nominal operating inflow per MFC
qwaste, with parallel hydraulic connection of
nMFCMFCs, is then calculated as follows:
where
rcis a nominal operation correction factor, with typical value
rc= 1, which is taken into account in case of deviation when dimensioning the sewerage system (namely, a kind of sensitivity parameter of the wastewater system treatment design with respect to the nominal wastewater supply).
• Power density calculation: taking into account that the expected ratio of organic load removal over influent (in the form of chemical oxygen demand) is nΔCOD, the expected Coulombic efficiency CE, the current per MFC IMFC, the nominal active power per MFC PMFC, the nominal active power of the MFC stack Ptot-MFC, and the respective power density PDMFC are calculated taking into account the Faraday constant F (equal to 96485.3383 C/mol), the influent supply per MFC qwaste by Eq. 10, the molecular weight of the reducing chemical agent ΜΒred (equal to 31.998 g/mol for oxygen), the number of electrons released from one molecule of the above chemical compound ne (equal to 4 for O2), the initial organic load of secondary wastewater treatment influent in the form of CODin2, the output voltage per MFC Vout (assuming that the output voltage remains constant over time despite small variations of wastewater inflow, the wastewater composition, and other functional parameters), the volume of the anode chamber per MFC Vanode, and the energy conversion factor nconv which includes both the efficiency of the DC to AC power converter and the efficiency due to losses owing to the non-uniformity of power generated between the different MFC chambers are calculated as follows:
• Calculation of fixed and variable operating costs of MFC and AS systems: the total capital costs of the AS system TCAS and that of the MFC system TCMFC are calculated by:
where
CASis the AS capital cost per wastewater supply,
tASis the annual operating hours of the AS system, and
CMFCis the capital cost per MFC.
Consequently, the following values are calculated taking into consideration the assumptions made in Trapero et al. (2017):
➢ The annual operating costs for the AS secondary treatment stage FTCAS without the operating costs of AS air blower/diffuser are calculated by:
➢ The annual operating costs of AS system VCAS (due to air blower/diffuser) are calculated by:
➢ The annual operating costs for the MFC secondary treatment stage FTCMFC without the operating costs of MFCs auxiliary devices are calculated by:
➢ The annual operating costs of MFCs auxiliary devices VCMFC (due to air blower/diffuser mainly) are calculated by:
➢ The total annual operating costs for the AS secondary treatment ToCAS are calculated by:
➢ The total annual operating costs for the MFC secondary treatment ToCMFC are calculated by:
➢ The annual operating costs for the sludge treatment, produced by the AS system STAS are calculated by:
➢ The annual operating costs for the sludge treatment, produced by the MFC STMFC are calculated by:where qAS is the operational wastewater inflow of the AS system, qMFC(=nMFC∙qwaste) is the operational inflow of the MFC system, FC is the constant energy consumption at the secondary treatment stage beyond the AS and MFC systems, tAS is the annual operating hours of the AS system, tMFC is the annual operating hours of the MFC system, Cblower is the energy consumption per cubic meter of sludge on behalf of the air diffuser/blower, pair-AS and pair-MFC are the energy factors of the necessary air quantity (artificially provided through air diffuser/blower) to the AS system (aerobic digestion) and MFC, respectively, ckWh is the electricity sale cost on behalf of the power grid, csludge_AS is the additional annual operating cost factor due to sludge treatment for the AS system, and csludge_MFC_AS is the reduction factor of sludge produced from the MFCs over that from the AS system.
To ensure equivalent results, in terms of operation of the two wastewater treatment subsystems, the following must apply:
The annual profit from electric power generation EMFC is determined by the product of power density PDMFC by the MFC volume of wastewater treatment (nMFC∙Vanode), which lasts a hydraulic retention time tHRT, multiplied by the number of loading repetitions (tMFC/tHRT) and the electricity market cost from the power grid skWh:
In the case that the operational supply (nMFC∙qwaste) does not match the corresponding design supply (nMFC∙Vanode/tMFC), then the latter one is replaced by the operational supply:
The difference in operating costs ΔOC, by replacing the AS system by MFCs, reaches an annual total of:
3.4 Financial Evaluation Stage
The financial viability of this investment can be estimated using the following criteria:
• The NPV at the commencement of the commercial operation, which is defined by the following:
where
C0is the investment cost,
NCin-tis the net cash inflow of the year
texpressed in prices of that specific time period (i.e., disregarding inflation),
kis the deflated discount rate, and
nis the investment life period. The project investment will be recommended if
NPVis greater than zero. Between two investment projects with the same life period, the one with the highest
NPVis preferred. It is reminded that the net cash inflow is given by the following:
where
Cainis the cash income,
Copis the operation cost,
Crecis the investment recoup,
Cintis the interest cost for the loans, and
ftaxis the constant tax factor.
• The IRR, which is defined as the discount rate that makes the NPV equal to zero, is given by:
The project investment will be recommended if
IRRis greater than the minimum required discount rate, with the assumption of positive net cash inflow. Between two investment projects with the same lifespan, the one with the highest
IRRis preferred.
• The TDPB, which is defined as the investment life period that makes the NPV equal to zero, is given by:
The project investment will be recommended if
TDPBis smaller than the investment life period
n. Between two investment projects with the same investment life period, the one with the lowest
TDPBis preferred.
• The BCR is defined by dividing the proposed total net cash inflow of the project by the proposed investment cost and is given by:
The project investment will be recommended if BCR is greater than one. Between two investment projects with the same life period, the one with the highest BCR is preferred.
It is pointed out that in all the above cases, the capital is placed only at the beginning of the operating period. Any extended maintenance will be considered as negative cash flow.
In the present study, the NPV difference between the use of an MFC and AS system determines the respective financial evaluation. So, the corresponding criteria are as follows:where Tperiod is the study time period of the two projects (which, in this case, coincides with the technical lifespan Ttech and the investment life period n), t is the current year, TMCMFC-t is the total cost of extended maintenance of the MFCs per period Τmaintance_MFC (which, in turn, is calculated from the product of the nominal wastewater supply Qwaste by the corresponding cost of MFC extended maintenance per inflow supply ΜCMFC):
It is noted that the operating costs or profits are settled at the end of each current year, and the MFC extended maintenance is done at the end of the extended maintenance period Τmaintance_MFC (when performed), the cost of which is added to the start-up costs of the following fiscal year. In this case, if the study period is 15 years and the extended maintenance period is 5 years, the maintenance will be carried out at the end of the 5th and 10th and not the 15th year, because it is considered that the technical lifespan has been concluded. Thus, the parameter TMCMFC-t takes non-zero values for time points t equal to 6 and 11.
4 Case Study—Results
4.1 Basic Scenario
Taking into consideration the data of the theoretical case study in
Trapero et al. (2017), the relevant results were confirmed. In the present study, typical urban wastewater (poor in organic load) of a remote settlement is investigated, since the Council Directive 91/271/EEC has been applied in Greece (
Greek Special Secretariat for Waters, 2012). In particular, the following data are obtained:
• The population Ppop and the surface area Αtown of a rural mountain settlement are considered stable over time for reasons of simplification, around 2,000 inhabitants and 30 ha.
• The average daily household water consumption qhab is 250 L/day/inhabitant (relatively large, due to cheap water pricing policy). The respective equivalent consumption of agricultural cottage industries qind is 10 L/day/inhabitant, while the respective community consumption qmun is 25 L/day/inhabitant.
• The percentage of water consumption that enters the sewerage network ρ is equal to 80%.
• The concentration of untreated wastewater, for an average pollution class, according to Table 6.1 of Koutsogiannis (1999) amounts to a biological oxygen demand of 5 days BOD5-in1 equal to 220 mg/L and a chemical oxygen demand CODin1 equal to 500 mg/L, with a COD/BOD5 ratio equal to 2.3 (i.e., easily biodegradable wastewater). In accordance with the Council Directive 91/271/EEC and respective Greek statutory legislation (Greek Special Secretariat for Waters, 2012), the settlement requires a primary wastewater treatment only marginally, as it has a population of 2,000 inhabitants. Due to the desire to render wastewater available for irrigation, it is necessary to proceed to secondary treatment, in order to achieve the respective limits of organic load, total solids, etc., as well as a disinfection of a limited degree (1000 EC/100 ml). According to Spellman (2014), and Koutsogiannis (1999), 25–40% of the organic load (typical value equal to 32.5%) and 50–65% of the total solids (typical value equal to 57.5%) are removed during the primary treatment stage, whereupon the influent of the secondary treatment stage has a biological oxygen demand of 5 days BOD5-in2 equal to 148.5 mg/L and a chemical oxygen demand CODin2 equal to 212.5 mg/L.
• As in Trapero et al. (2017), the basic unit of the secondary treatment system is an MFC with an anode chamber of 2.25 m3, a cathode chamber of 1.125 m3, with 20 mm walls of methyl acrylate, electrodes coated with carbon fiber, metal cathode catalyst, proton exchange membrane, and completely supported by auxiliary devices (DC to AC converters, pumps, and fans). It is noted that this MFC module does not exist as yet, but it could be constructed, if the MFCs scaling-up issues are solved (i.e., one MFC module could consist of many individual MFCs in suitable electrical and hydraulic connections between them) and if a significant level of funding and length of commercial development time were given. Each MFC is connected to the other hydraulically in parallel, electrically in series, with a cost CMFC equal to 79.65€/(m3/day)/(1 h HRT)∙tHRT for a non-platinum catalyst, 83.06€/(m3/day)/(1 h HRT)∙tHRT for a platinum catalyst, compared with respect to the cost of a conventional secondary AS system CAS which is equal to 666.667€/(m3/day), as shown in Table 1 of Trapero et al. (2017). Also, at every 5 years of operation, the replacement of the electrodes and the membrane is required at an MFC extended maintenance cost MCMFC of 10.933 €/(m3/day)/(1 h HRT)∙tHRT for a non-platinum catalyst and 13.89€/(m3/day)/(1 h HRT)∙tHRT for a platinum catalyst, equally at 2020 prices.
• From the analysis of the daily energy consumption of the auxiliary devices in the AS treatment system (according to Table 3S of Trapero et al., 2017), the energy consumed by the AS system amounts to 1.778 kWh/m3, of which 1.022 kWh/m3 is by the air diffuser/blower Cblower. The respective constant energy consumption by the secondary treatment stage in the rest of the equipment, beyond the AS unit or MFC FC, amounts to 0.7565 kWh/m3. The aforementioned daily energy consumption has a significantly higher value than those seen in Table 9.1 of Logan (2008) (from 0.2833 up to 0.7083 kWh/m3). The differentiation is largely justified by the different levels of organic load.
• The output voltage of the cell Vout is equal to 0.7 V in the case of a platinum catalyst and 0.35 V for a non-platinum catalyst. Of course, the uncertainties in this variable are significant and its value varies, in contrast to the efficiency ratio of the DC to AC converter, which is typically 90% and whose technology is mature (Trapero et al., 2017). However, due to the possible power inhomogeneity, between the different MFC chambers, the total conversion ratio nconv is conservatively limited to 75% (Liu and Cheng, 2014).
• The AS system and MFC both operate annually for the same number of hours tAS = tMFC = 8,000 h, therefore the operating supplies of the two systems coincide (qAS = qMFC). In addition, the energy factor of the necessary air quantity, artificially supplied to the wastewater by the air blower/diffuser are 100 and 11.25% for the AS system (aerobic digestion) pair-AS, and for the MFC pair-MFC, respectively, according to Trapero et al. (2017).
• The operating cost components, for the AS treatment system, consist of the fixed part of labor, maintenance, insurance, and training (which amounts to 47.00% of the total operating cost) and the varying ones, i.e., sludge treatment (19.00%) and power consumption (34.00%), as in Table 2S of Trapero et al. (2017). The fixed costs do not vary between the configuration scenarios of the wastewater treatment systems, so when comparing scenarios, they cancel each other out and do not affect the final financial evaluation. It is assumed that the additional annual operating cost factor due to sludge treatment for the AS system csludge_AS is typically 19/34, which depends, to a large extent, on the nature and composition of the influent. In addition, the reduction factor of sludge produced from the MFCs over that from the AS system csludge_MFC_AS is equal to 20%, according to Trapero et al. (2017).
• The uncertainties regarding the percentage of organic load removal in the MFCs are much higher. In particular, in relevant references (such as Table 2 by Seelam et al., 2015; Table 2 by Liang et al., 2018; Table 5 by Lu et al., 2017; Table 1 by Xu et al., 2016; Table 1 by Mathuriya, 2014; and Table 1 by Lee et al., 2014, as well as in Table 1 of this article), the wastewater characteristics and removal rates COD, BOD5, along with Coulombic efficiency and maximum power density, and the technical characteristic of the HRT have been mentioned. Especially, in urban wastewater, the initial hypothesis is confirmed, but the hydraulic retention time tHRT ranges from 10 min to 8 days, while the removal rates COD range from 2 to 95%, but mainly with values around 70%. Similarly, the Coulombic efficiency ranges from 4.7 to 90%, but mainly with values around 15%. Based on Eq. 9, the tHRT affects the number of MFCs, while CODin2 and the expected ratio of organic load removal over wastewater influent in the form of chemical oxygen demand nΔCOD affect the output power (Eqs 11–14) and, by extension, the financial viability of the investment. Although these variables will be examined, for the basic scenario, tHRT is equal to 10 h, nΔCOD is equal to 65%, and Coulombic efficiency is equal to 15%.
• The electricity sale cost on behalf of the power grid ckWh and the electricity market cost from the power grid skWh are equal to 0.09 €/kWh.
• For the basic scenario the deflated discount rate k and the investment life period n are equal to 3% and 15 years, respectively. These are crucial parameters for the financial viability of the investment.
TABLE 1
| Paper | Wastewater | CODin2 [mg/L] | nΔCOD [%] | BODin2 [mg/L] | nΔΒOD [%] | pH [-] | tHRT [h] | CE [%] | Maximum power density |
|---|---|---|---|---|---|---|---|---|---|
| Liang et al. (2018); Tan et al. (2021) | Municipal wastewater | 80 ÷ 250 | 70 ÷ 90 | — | — | — | — | 41 ÷ 75 | 60 W/m3 |
| Hiegemann et al. (2019); Tan et al. (2021) | Municipal wastewater | 205 | 52 ± 4 | — | — | — | 96 | 30 | 0.3 W/m3 |
| Ding et al. (2017) | Mixture raw swine wastewater and effluent of denitrified swine wastewater | 1,313 ÷ 2,735 | 82.5 ± 0.5 | — | — | — | 36 | 21.6 | 37.5 W/m3 |
| Miran et al. (2016) | Lemon peel waste water | 1,000 | 75.8 ± 7.1 | — | — | — | 100 | — | 371 ± 30 mW/m2 |
| Sciarria et al. (2015) | White wine lees | 6,400 ± 100 | 90 | 6,000 ± 100 | 95 | 6.9 | 260 | 15 | 8.2 W/m3 |
| Sciarria et al. (2015) | Red wine lees | 10,100 ± 300 | 27 | 3,300 ± 200 | 83 | 7.0 | 120 | 90 | 3.1 W/m3 |
| Lu et al. (2017) | Diluted brewery wastewater | 3,197 ± 979 | 94.6 ± 1.0 | — | — | 7.00 ± 0.30 | 313 | 13.9 | 0.44 W/m3 |
| Tommasi and Lombardelli (2017) | Domestic wastewater | 150 | 67 ± 15 | — | — | — | 0.167 | 12.9 ± 3.3 | 0.44 W/m3 |
| Park et al. (2017) | Municipal wastewater | 144 ± 18 | 78 ± 1 (1st operation month) | — | — | 2.5 | 12 ± 2 | 12.9 ± 2.9 W/m3 | |
| 85 ± 3 (5th operation month) | — | — | |||||||
| Estrada-Arriaga et al. (2018) | Municipal wastewater | 330 individual | 74 | — | — | — | 96 | — | - W/m3 |
| 310 series stack | 84 | 96 | 2.5 W/m3 | ||||||
| 300 parallel stack | 78 | 96 | 0.4 W/m3 | ||||||
| Blatter et al. (2021); Tan et al. (2021) | Municipal wastewater | 200 ÷ 450 | 34.4 ÷ 95.4 | — | — | 6.8 ÷ 7.2 | — | 4.7 ÷ 14.9 | 20 mW/m3 |
| Sonawane et al. (2014) | Municipal wastewater | 1,650 | 68 | — | — | 8 | 192 | 47 | 621 ± 17 mW/m2 |
| Sonawane et al. (2014) | Distillery wastewater | 2,303 | 70 | — | — | 7.8 | 192 | 27 | 364 ± 11 mW/m2 |
| Ali et al. (2015) | Municipal wastewater—summer period | 350 | 72.85 | 160 | 71.80 | 8.6–8.0 | 24 | — | 209 mW/m2 |
| Ali et al. (2015) | Municipal wastewater—winter period | 92 | 2.17 | 40 | 0 | 7.9–7.5 | 24 | — | 117 mW/m2 |
| Linares et al. (2019); Tan et al. (2021) | Domestic wastewater | 789 | 87 ± 4.5 | 75 ± 16 | 55 ± 5 | 7.4 ± 0.2 | 80 | 22 | 0.43 mW/m3 |
| Rossi et al. (2019); Tan et al. (2021) | Domestic wastewater | 428 | 80 | — | — | — | — | 27 | 605 mW/m3 |
| Rossi et al. (2019); Tan et al. (2021) | Domestic wastewater | 450 ÷ 650 | 95 | — | — | 7.5 ÷ 8.0 | 18 | — | 3.6 mW/m3 |
Wastewater treatment with MFC-COD removal and other biological parameters.
During the stage of typical wastewater supply determination, it results that the total average daily water consumption per inhabitant q/tot is equal to 285 L/day, the total average daily sewage supply per inhabitant qtot is equal to 228 L/day, the total average daily sewage supply by the inhabitants Qtot is equal to 456 m3/day, the additional inflow per hectare qi is equal to 0.180233 L/s, and the respective additional inflow to the sewerage network due to infiltrations Qi for the total area is equal to 5.407 L/s. Therefore, the total average daily supply of untreated wastewater Qwaste is equal to 923.2 m3/day.
During the preliminary study stage of the techno-economic characteristics of urban wastewater treatment with MFC versus AS, the necessary number of MFCs nMFC is equal to 188 and the nominal operating inflow per MFC qwaste is equal to 0.062233 L/s. Consequently, the current per MFC IMFC is determined at 15.552 Α (not affected by the type of catalyst, according to the approximations of this study). The nominal active power of each MFC PMFC, the nominal active power of the MFC stack Ptot-MFC, and the respective power density PDMFC for a non-platinum catalyst are equal to 4.082 W, 767.5 W, and 1.814 W/m3, respectively, while for a platinum catalyst, are equal to 8.165 W, 1,535 W, and 3.629 W/m3, in the aforementioned order. This means that the non-platinum catalyst MFC when compared to the platinum one lags behind in terms of power and power density due to the reduced output voltage of the former.
The capital cost of the AS system TCAS is 673,909 €, while the capital cost of the MFC TCMFC is 808,607 € (with a non-platinum catalyst) and 843,225 € (with a platinum catalyst). The annual operating cost for the AS secondary treatment stage without the operating cost of AS air blower/diffuser FTCAS or for the MFC secondary treatment stage without the operating cost of MFC auxiliary devices FTCMFC (regardless of the catalyst) are the same and are equal to 22,942 €. The annual operating cost, due to air blower/diffuser, for the AS system VCAS is equal to 30,993 €, while for the MFC VCMFC is equal to 3,487 €. Therefore, the total annual operating cost of the AS system ToCAS is 53,935 €, while for the MFC ToCMFC is 26,429 €. The above costs are supplemented by the annual operating cost for the treatment of sludge produced, which in the case of the AS system STAS is equal to 30,140 € and in the case of the MFC STMFC is equal to 24,112 €. The annual profit from electric power generation EMFC amounts to 550 € for a non-platinum catalyst and 1,100 € for a platinum catalyst. Therefore, the total difference in operating costs ΔOC, from the replacing the AS system by MFCs, amounts to −34,085 € per year in the case of a non-platinum catalyst and −34,635 € per year in the case of a platinum catalyst, which shows that both cases end up in benefit. However, the total cost of extensive maintenance of MFCs, that occurs per period, Τmaintance_MFC, for every 5 years amounts to 100,933 € in the case of a non-platinum catalyst and 128,227 € in the case of a platinum catalyst.
At the stage of the financial evaluation, for the case of an MFC with a non-platinum catalyst, against the AS system, it results that the NPV, at the commencement of the commercial operation, amounts to 110,034 €, and the BCR is at 1.817, the TDPB at 7.35 years, and the IRR at 13.168%. This means that the project is approved for all the criteria. Similar conclusions have arisen in the case of an MFC with a platinum catalyst, where the values of NPV, BCR, TDPB, and IRR are 38,129 €, 1.225, 13.31 years, and 5.967% respectively. However, all four criteria show the economic superiority of an MFC with a non-platinum catalyst, since it presents higher values of NPV, BCR, and IRR and also a shorter TDPB. This is confirmed in Figure 6A, where the NPV with respect to time is presented for a deflated interest rate of 3%. Here, the superiority of the MFC with a non-platinum catalyst is apparent. In addition, it is possible to graphically determine the TDPB by setting the NPV to zero, thus confirming visually the aforementioned results. Of course, it is clear that NPV is not a constantly increasing function due to the high maintenance cost of the MFC every 5 years. The same conclusions can be reached by studying Figure 6B, which presents the BCR with respect to time, where again it is possible to graphically determine the TDPB by setting the BCR to 1, visually confirming the aforementioned results. Finally, in Figure 6C, the NPV with respect to the deflated discount rate is presented for an investment life period of 15 years, where again the supremacy of the MFC with a non-platinum catalyst is confirmed. Meanwhile, it is possible to graphically determine the IRR, setting the value of the NPV equal to zero, thereby visually confirming the corresponding results.
FIGURE 6
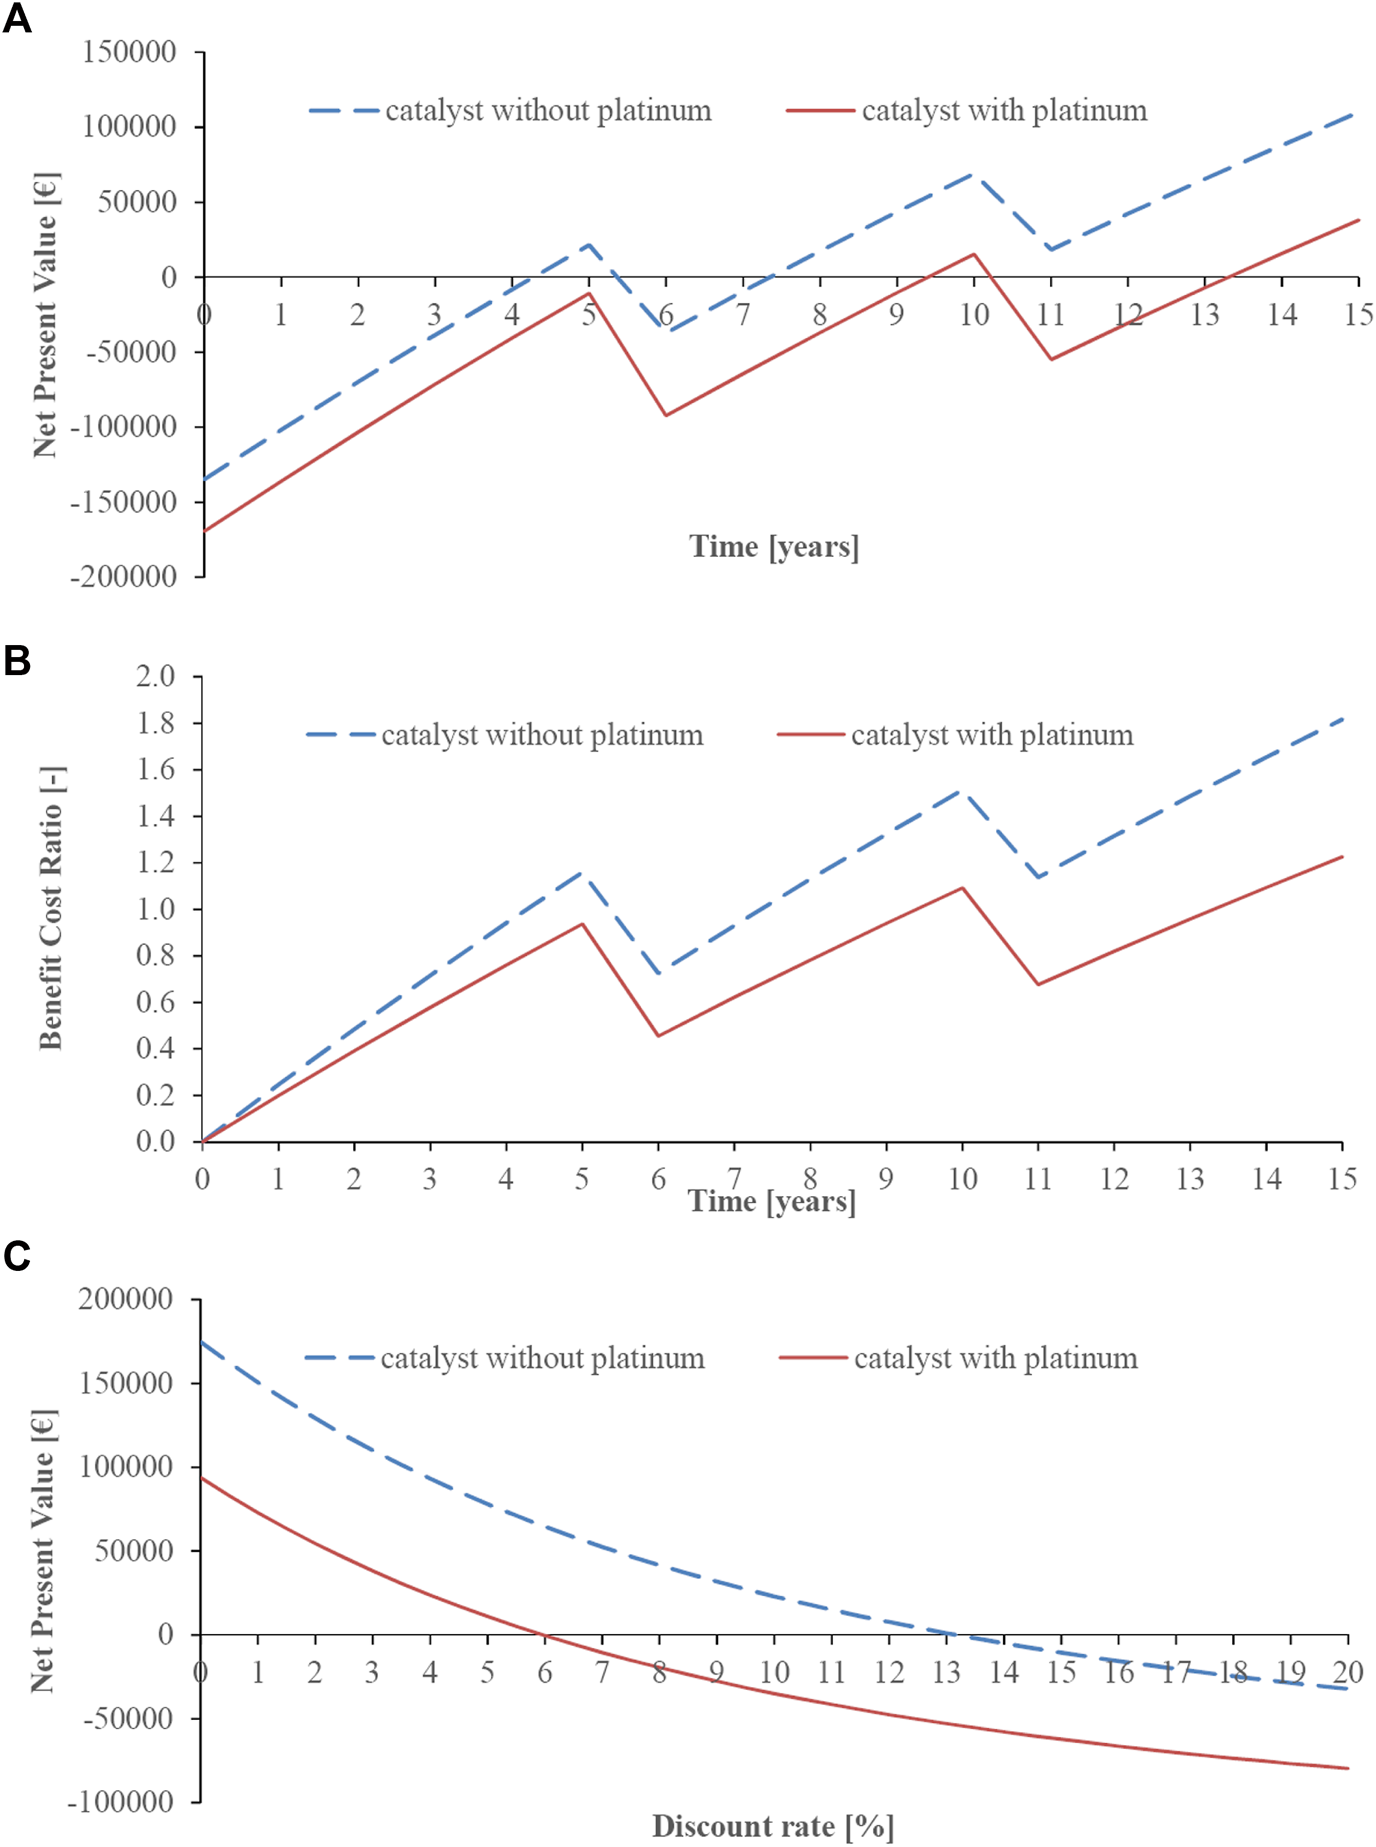
(Α) Νet present value NPV with respect to time, for the secondary wastewater treatment configuration with MFC against AS, with platinum/non-platinum catalysts for a deflated discount rate at 3%. (B) Benefit–cost ratio BCR with respect to time, for the secondary wastewater treatment configuration with MFC against AS, with platinum/non-platinum catalysts for a deflated discount rate at 3%. (C) Net present value NPV with respect to deflated discount rate, for the secondary wastewater treatment configuration with MFC against AS, with platinum/non-platinum catalysts for an investment life period at 15 years.
Summarizing the basic scenario, the use of MFC in secondary wastewater treatment, as against the AS, appears to be viable on the condition that the MFC modules of Trapero et al. (2017) can be realized, based on the standard values obtained, giving a significant lead to the configuration utilizing a non-platinum catalyst, which, however, only reaches 767 W of active power efficiency for a settlement of 2,000 inhabitants. That is, the cost of installed power amounts to 1.05 M€/kW due to the poor organic load of wastewater compared to wastewater from fruit juice processing, as in Trapero et al. (2017). This will be a really prohibitive factor, if the wastewater treatment plant is dealt with an electric power generator only. With the use of a platinum catalyst, the corresponding cost drops to 550 k€/kW, still about 200–500 times more expensive than the classic RES (e.g., wind turbines and photovoltaic panels). However, it becomes a viable solution due to the replacement of the energy-consuming secondary treatment with AS. In addition, the small size of the power plant (some kWs) against the load demand of a 2,000-inhabitant settlement does not provoke any problems in the distribution power system (i.e., power quality issues and grid islanding). The power plant can be immediately integrated into a smart grid, probably without any special control requirements, which means that in Figure 4, the solution of curve P1(t) can be applied.
Since several quantities have been approached, the sensitivity analysis of essential technical and economic parameters will be examined, so as to determine the viability of the specific technology.
4.2 Sensitivity Analysis of Wastewater Organic Load Removal Percentage and Coulombic Efficiency
In terms of technical characteristics, the two most uncertain parameters are the percentage of organic load removal over influent (in the form of chemical oxygen demand), during secondary treatment, nΔCOD, and the Coulombic efficiency CE, as already mentioned in Section 4.1. All value combinations are examined where nΔCOD ranges from 2 to 96% with step 1% and CE from 4 to 90% with step 1%. All of the above results for the basic scenario are determined, from which the power density, the capital cost per installed kW, the NPV at the commencement of the commercial operation, the BCR, the TDPB, and the IRR for platinum/non-platinum catalysts are selected to be presented graphically in Figure 7.
FIGURE 7
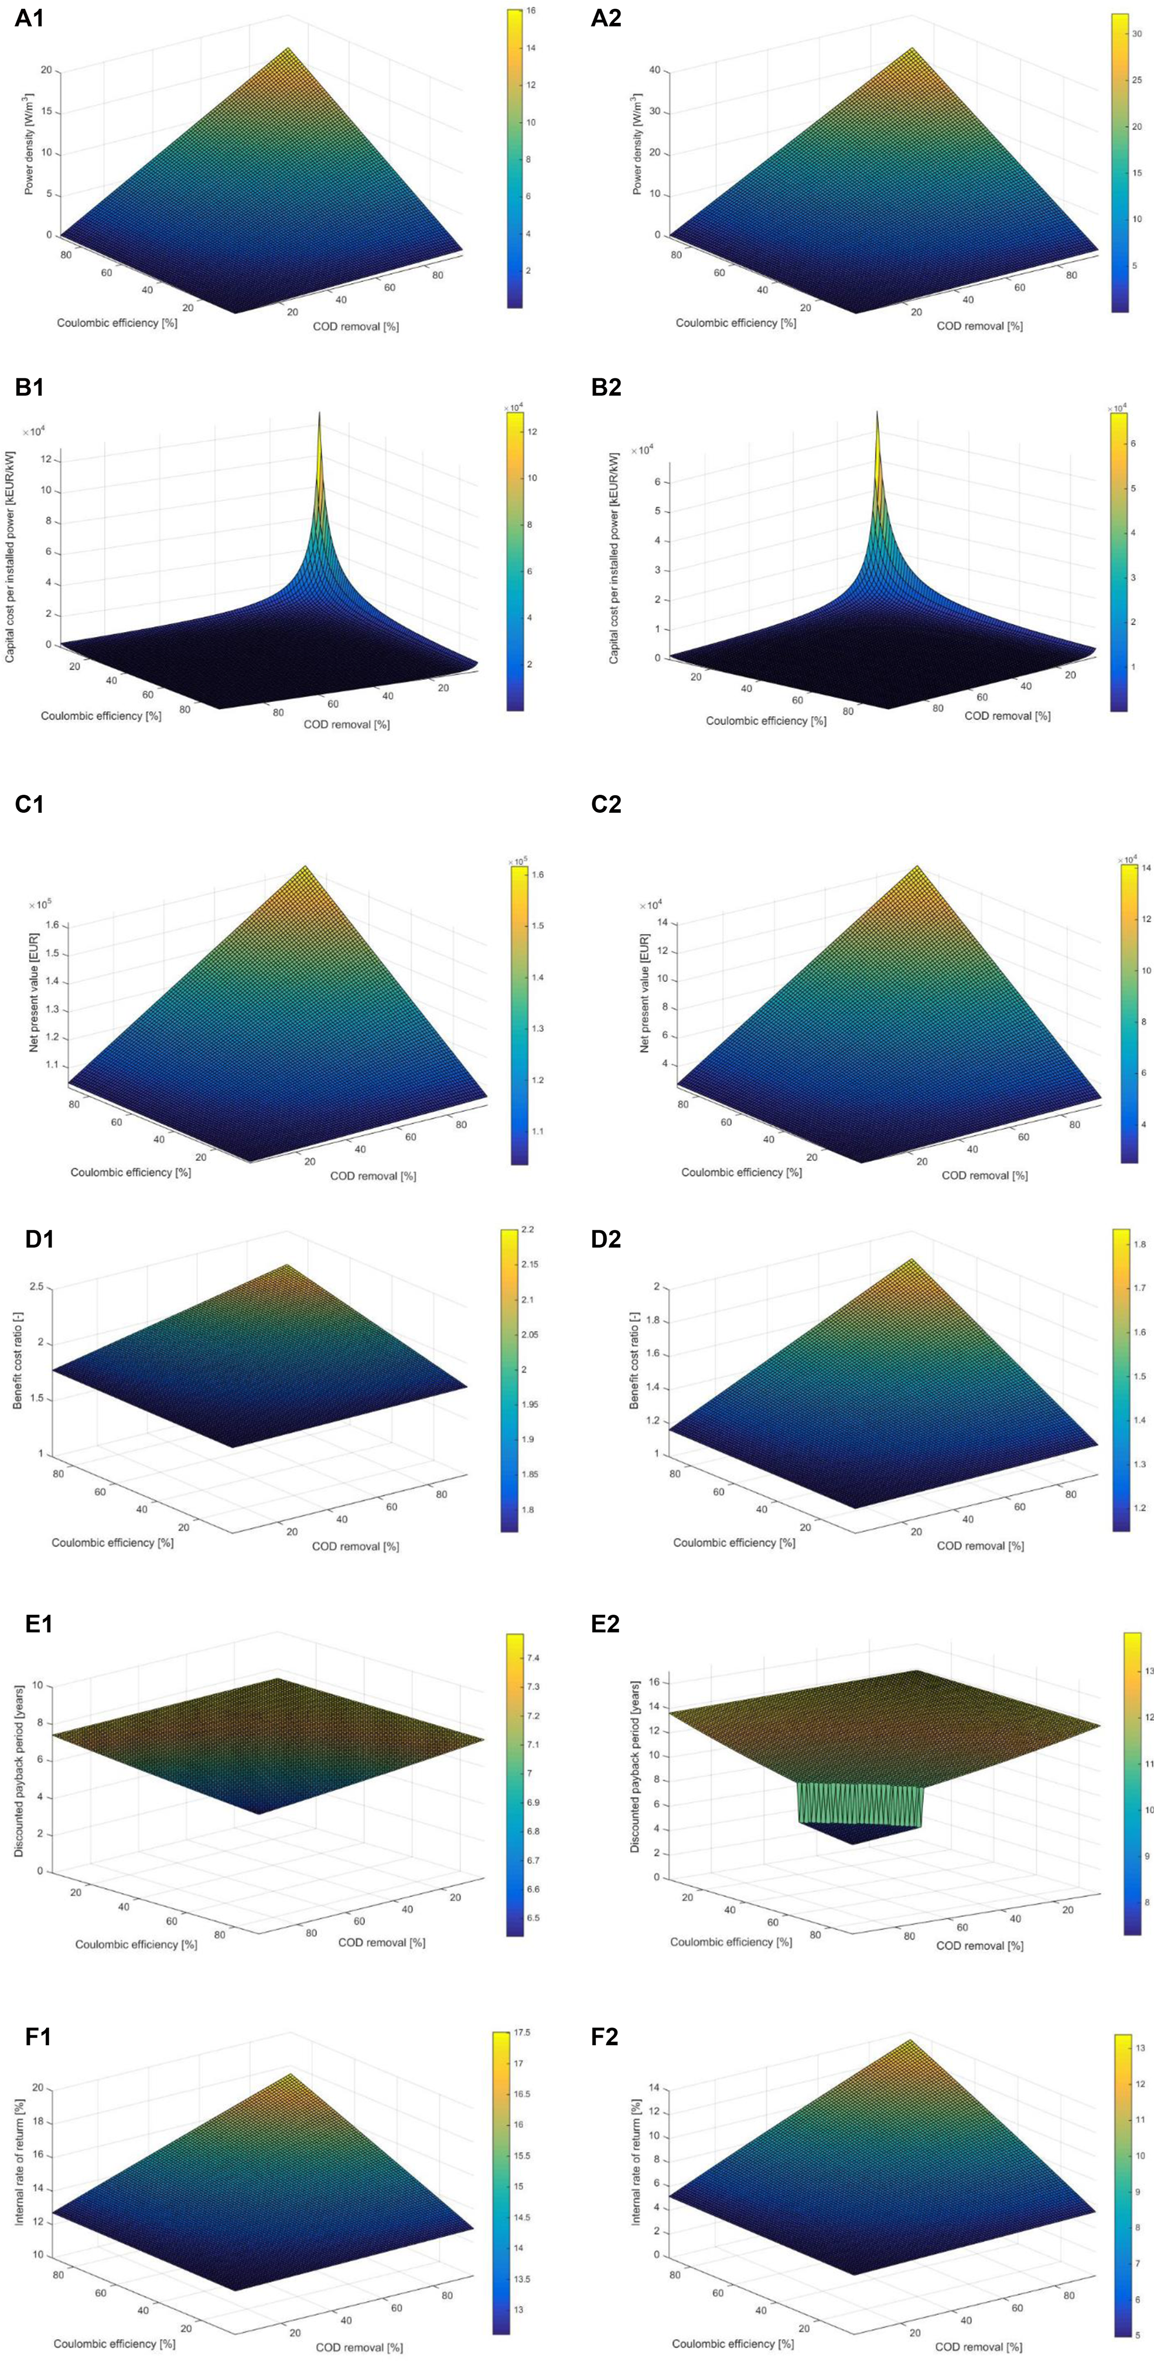
(A) Power density with respect to wastewater organic load removal percentage nΔCOD and to Coulombic efficiency CE for the secondary wastewater treatment configuration with MFC with (A1) non-platinum catalyst or (A2) platinum catalyst, against AS. (B) Capital cost per installed kW with respect to wastewater organic load removal percentage nΔCOD and to Coulombic efficiency CE for the secondary wastewater treatment configuration with MFC with (B1) non-platinum catalyst or (B2) platinum catalyst, against AS. (C) Net present value NPV with respect to wastewater organic load removal percentage nΔCOD and to Coulombic efficiency CE for the secondary wastewater treatment configuration with MFC with (C1) non-platinum catalyst or (C2) platinum catalyst, against AS, for an investment life period at 15 years and a deflated interest rate at 3%. (D) Benefit–cost ratio BCR with respect to wastewater organic load removal percentage nΔCOD and to Coulombic efficiency CE for the secondary wastewater treatment configuration with MFC with (D1) non-platinum catalyst or (D2) platinum catalyst, against AS, for an investment life period at 15 years and a deflated interest rate at 3%. (E) Discounted payback period TDPB with respect to wastewater organic load removal percentage nΔCOD and to Coulombic efficiency CE for the secondary wastewater treatment configuration with MFC with (E1) non-platinum catalyst or (E2) platinum catalyst, against AS, for a deflated interest rate at 3%. (F) Internal rate of return IRR with respect to wastewater organic load removal percentage nΔCOD and to Coulombic efficiency CE for the secondary wastewater treatment configuration with MFC with (F1) non-platinum catalyst or (F2) platinum catalyst, against AS, for an investment life period at 15 years.
In particular, based on Figure 7A, the behavior of the power density improves as the organic load removal percentage nΔCOD and the Coulombic efficiency CE increase, as it continuously increases, while it ranges from 0.0149 to 16.077 W/m3 for a non-platinum catalyst and from 0.0298 to 32.15 W/m3 for a platinum catalyst. It is clear that the latter is superior in all cases, achieving twice the power density due to double voltage at the MFC output, assuming, though, that the other parameters remain unchanged. This, however, is not certain, i.e., for the same wastewater and for the same HRT, the same combination of organic load removal percentage and Coulombic efficiency will be achieved. The power per MFC, the power of the total MFC stack, the total power generated by the MFC stack, and the annual profit from electric power generation, all change in the same way.
Based on Figure 7B, the behavior of the capital cost per installed kW improves as the organic load removal percentage nΔCOD and Coulombic efficiency CE increase, as it constantly decreases, while it ranges from 118.9 to 128,410 k€/kW for a non-platinum catalyst and from 62 to 66,955 k€/kW for platinum catalysts. It is clear that the latter is superior in all cases, achieving a cost of about 48% lower than the former, while 50% is not achieved due to the use of more expensive platinum.
Based on Figure 7C, the NPV behavior improves as the organic load removal percentage nΔCOD and Coulombic efficiency CE increase, as it constantly increases, while it ranges from 130.52 to 161.67 k€ for non-platinum catalysts and from 25.1 to 141.4 k€ for platinum catalysts. Here, the non-platinum catalyst is economically advantageous from 1.14 to 5.2 times, achieving the largest differences for the lower values of organic load removal percentage and Coulombic efficiency.
Based on Figure 7D, the BCR behavior improves as the organic load removal percentage nΔCOD and the Coulombic efficiency CE increase, as it constantly increases, ranging from 1.769 to 2.200 for a non-platinum catalyst and from 1.148 to 1.835 for a platinum catalyst. Here, the non-platinum catalyst is economically advantageous from 1.20 to 1.54 times, achieving the largest differences for the smaller values of organic load removal percentage and Coulombic efficiency. It essentially approaches to a considerable degree the NPV behavior by mitigating the differences, due to the division by the initial total installation cost, according to Eq. 36.
Based on Figure 7E, the TDPB behavior improves as the organic load removal percentage nΔCOD and the Coulombic efficiency CE increase, as it continuously decreases, while it ranges from 6.44 to 7.48 years for a non-platinum catalyst and from 7.30 to 13.84 years for a platinum catalyst. In the case of the platinum catalyst, there is a discontinuity that is located approximately in the conceivable diagonal, as determined by the points with coordinates (nΔCOD, CE) with values (2%, 66%) and (71%, 4%), while in the case of the non-platinum catalyst, this does not appear so. The discontinuity is due to the high maintenance costs every 5 years. Here again, the non-platinum catalyst is advantageous 1.13–1.85 times, achieving the largest differences for the smaller values of organic load removal percentage and Coulombic efficiency.
Based on Figure 7F, the IRR behavior improves as the organic load removal percentage nΔCOD and the Coulombic efficiency CE increase, as it continuously increases, ranging from 12.60 to 17.51% for a non-platinum catalyst and from 4.97% as 13.39% for a platinum catalyst. Here, the non-platinum catalyst is advantageous 1.31–2.54 times, achieving the largest differences for the smaller values of organic load removal percentage and Coulombic efficiency.
It is concluded that despite the large variation in organic load removal percentage and Coulombic efficiency, when secondary wastewater treatment systems with either MFC or AS are required to behave in the same way, in terms of organic load removal percentage and hydraulic residence time, the use of MFC will be economically advantageous in all cases theoretically, on the condition that the MFC modules of Trapero et al. (2017) can be realized. Especially in the case the non-platinum catalyst, it reaches a BCR of at least over 1.77 and an IRR of 12.60%, which means that the investment is high yielding and could be financed at a fairly high interest rate (higher than 3%), remaining financially profitable. In addition, the basic scenario examined in Section 4.1 belongs to pessimistic cases, which, however, turned out to be financially viable.
4.3 Sensitivity Analysis of Hydraulic Retention Time
For the basic scenario of Section 4.1, the hydraulic retention time tHRT is investigated, taking initially the values 1, 2, 4, 6, 8, 10, 12, 16, 24, 36, 48, 60, 72, 96, and 120 h, considering that the percentage of organic load removal nΔCOD and the Coulombic efficiency CE remain constant and equal to 65% and 15%, respectively. It has been considered that in order to achieve the corresponding quantities, the HRT is changed appropriately. The relevant examination shows that the number of required MFCs nMFC increases linearly with the HRT according to Eq. 9, while the current per MFC IMFC decreases inversely, without being affected by the type of catalyst according to the combination of Eqs 10, 11. The current IMFC is followed by the nominal active power per MFC PMFC and the power density PDMFC according to Eqs 12, 13, in contrast to the nominal active power per MFC stack Ptot-MFC produced by the secondary wastewater treatment unit, which remains constant and consequently so does the total electrical energy production by the MFC and the annual profit from electric power generation EMFC. Due to the proportional interdependence of the construction and maintenance cost of the MFC chamber for treatment of 1 m3/day of influent, from the HRT, according to the assumptions made in Section 4.1 and Trapero et al. (2017), the total construction and maintenance cost of the MFC varies in proportion to tHRT. As a result, the NPV decreases approximately linearly in relation to the hydraulic retention time, as shown in Figure 8A. It is noted that the MFC construction and maintenance cost is smaller than the AS cost, for a hydraulic retention time up to 8.35 h for a non-platinum catalyst and for up to 8.05 h for a platinum catalyst, requiring 157 and 151 MFCs, respectively. Figure 8A and detailed calculations show that the NPV is marginally positive for hydraulic retention time of up to 11.10 h for a non-platinum catalyst and for up to 10.36 h for a platinum catalyst, for a deflated interest rate of 3% and an investment life period of 15 years. The same conclusions emerge from the study of the TDPB and of the BCR. Respectively, the internal rate of return, for an investment life of 15 years, receives a marginally positive value for hydraulic retention time of up to 11.6 h for a non-platinum catalyst and of up to 10.7 h for a platinum catalyst, as shown in Figure 8B. Because of this, the hydraulic retention time proves critical for the financial viability of the investment, as it affects both the construction and maintenance cost of the MFCs, as well as the organic load removal percentage and Coulombic efficiency, which are usually determined experimentally for each wastewater under study.
FIGURE 8
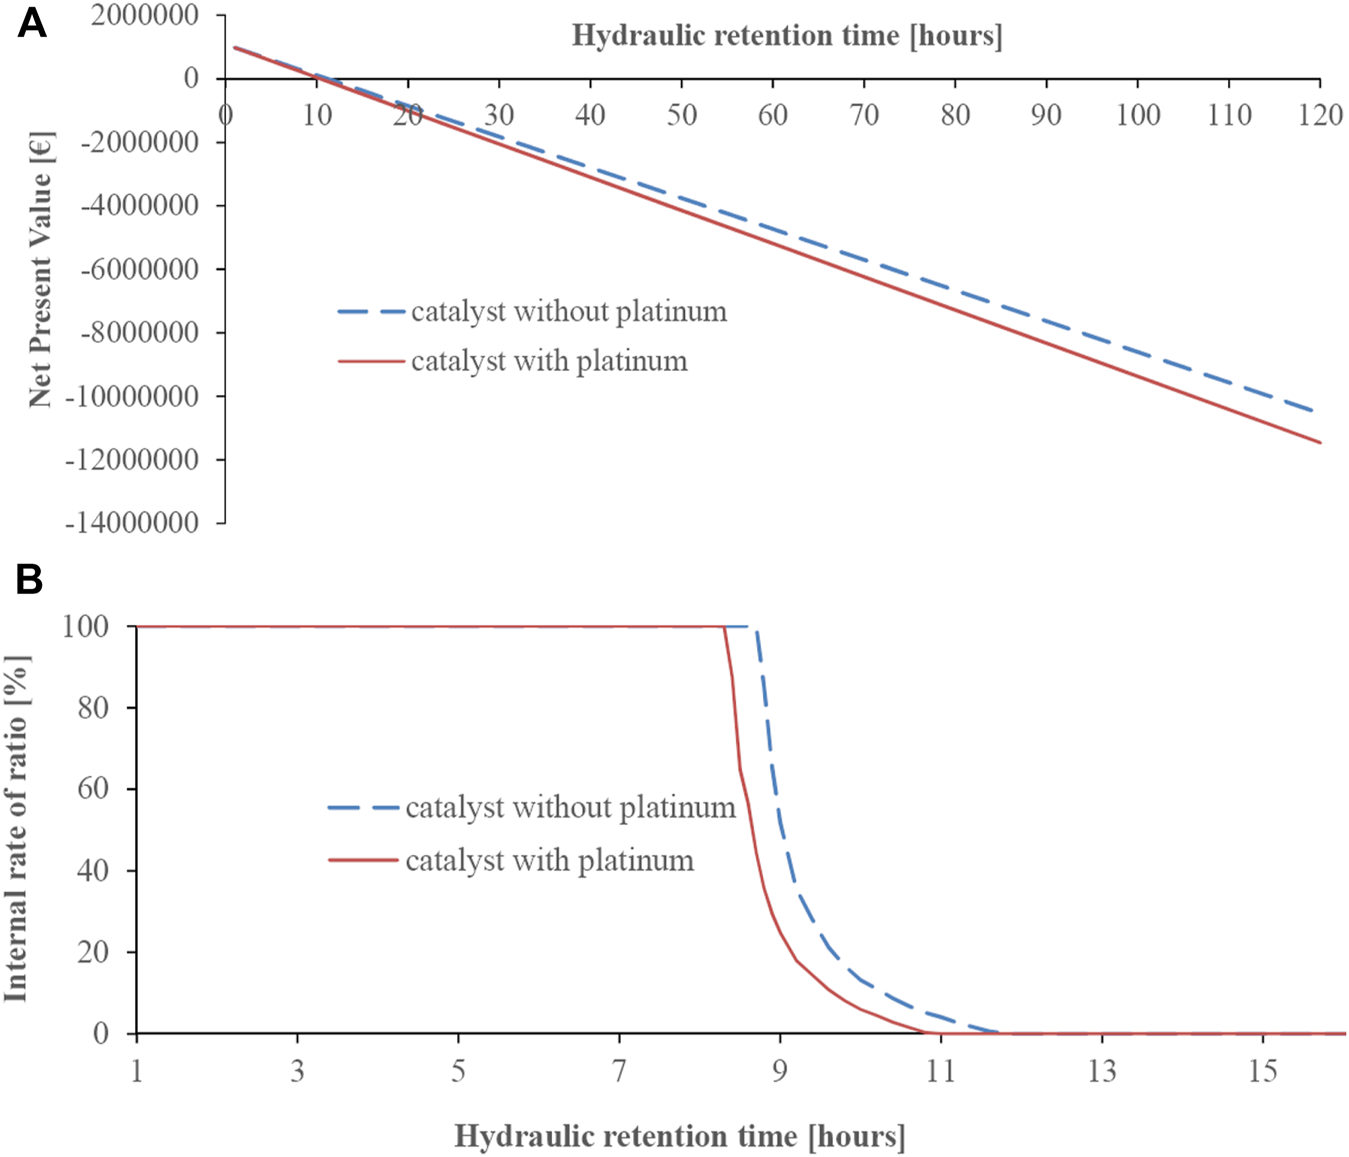
(A) Net present value NPV with respect to hydraulic retention time tHRT for the secondary wastewater treatment configuration with MFC against AS, with platinum/non-platinum catalysts for an investment life period at 15 years and a deflated interest rate at 3%. (B) Internal rate of return IRR with respect to hydraulic retention time tHRT for the secondary wastewater treatment configuration with MFC against AS, with platinum/non-platinum catalysts for an investment life period at 15 years.
4.4 Sensitivity Analysis of the Energy Conversion Factor of the MFC Converter
For the basic scenario of
Section 4.1, the energy conversion factor
nconvis investigated which includes both the efficiency of the MFC converter and the possible losses due to nonuniformity of power generated between the different MFC chambers, taking values from 30 to 100%, against the initial value of 75%. The required number of MFCs
nMFCand the current per MFC
IMFCremain unchanged. Instead, the nominal active power per MFC
PMFC, the nominal active power per MFC stack
Ptot-MFC, and the power density
PDMFCrange proportionally from 0.4 to 1.333 times of the relative initial value, based on
Eqs 12–
14. Similarly, the total electrical energy production by the MFC and the annual profit from electric power generation
EMFCalso change, in accordance with
Eq. 26. The latter has a slight effect on financial results. For example, in
Figure 9, the
NPVwith relation to the energy conversion factor is shown, with no noteworthy changes. The
NPV(for a 3% deflated interest rate and a 15-year investment life period) ranges from −3.59 to 1.90% for the MFC with a non-platinum catalyst and from −20.67 to 11.48% for the MFC with a platinum catalyst in comparison to the respective initial values of the basic scenario, when increasing the energy conversion factor. In any case, the
NPVremains positive. Similar results emerge from the study of the other parameters, where:
• The BCR (for a 3% deflated interest rate and a 15-year investment life period) ranges from −2.59 to 1.40% for the MFC with a non-platinum catalyst and from −10.07 to 5.55% for the MFC with a platinum catalyst (in comparison to the respective initial values of the basic scenario), when increasing the energy conversion factor.
• The IRR (for a 15-year investment life period) ranges from −1.61 to 0.89% for the MFC with a non-platinum catalyst and from −3.80 to 2.11% for the MFC with a platinum catalyst (in comparison to the respective initial values of the basic scenario), when increasing the energy conversion factor.
• The TDPB (for a deflated interest rate of 3%) ranges from −0.60 to 1.00% for the MFC with a non-platinum catalyst and from −1.20 to 2.39% for the MFC with a platinum catalyst (in comparison to the respective initial values of the basic scenario), when decreasing the energy conversion factor.
FIGURE 9
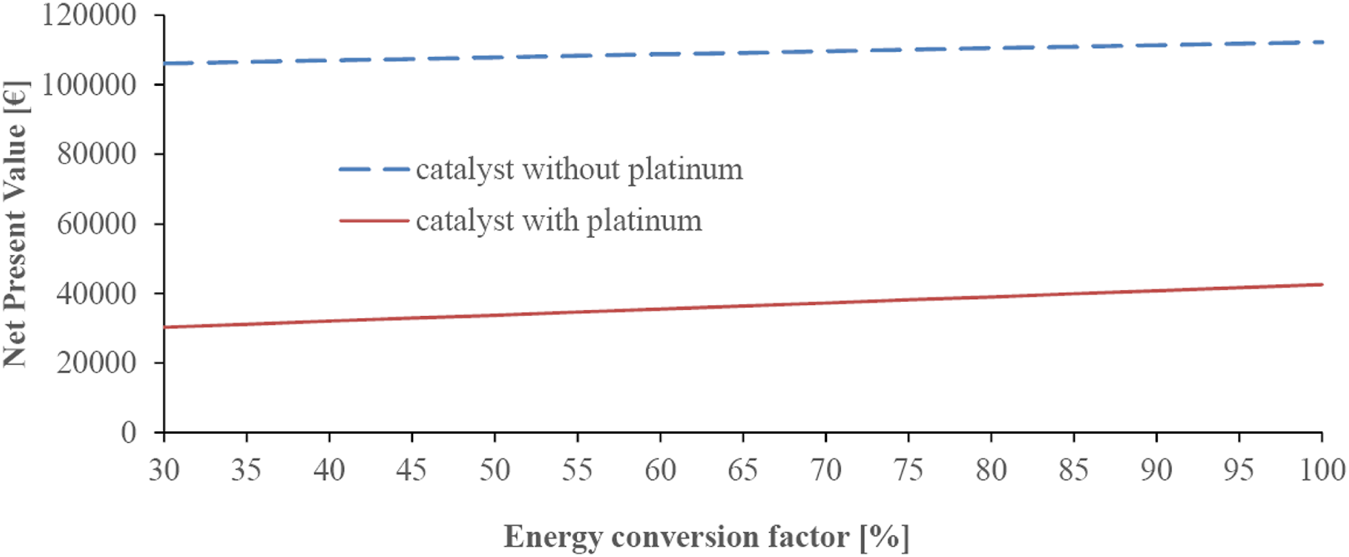
Net present value NPV with respect to MFC energy conversion factor nconv (which takes into consideration losses due to nonuniformity of chambers, and other such parameters) for the secondary wastewater treatment configuration with MFC against AS, with platinum/non-platinum catalysts for an investment life period at 15 years and a deflated interest rate at 3%.
The aforementioned results show that in any case, the use of the MFC could have an advantage over the use of the AS, on the condition that the MFC modules of Trapero et al. (2017) could be realized.
4.5 Sensitivity Analysis of the Microbial Fuel Cell Capital Cost
For the basic scenario of Section 4.1, the MFC capital cost CMFC is investigated taking values from 50 to 150% of its basic scenario value, with all other parameters remaining stable, according to the assumptions of Section 4.1. Changing this parameter affects only financial results. In particular, the NPV for a deflated interest rate at 3% and an investment life period at 15 years decreases approximately linearly, in relation to the MFC capital cost expressed as percentage of its basic scenario value, as it is shown in Figure 10A. It is determined that the NPV will be marginally positive, if the MFC capital cost comes up to 113.60% of its basic scenario value for a non-platinum catalyst and up to 104.52% for a platinum catalyst. The latter is confirmed by the relative graph of the TDPB (Figure 10B), while the same conclusions could be reached with the BCR. Respectively, in Figure 10C, for an investment life period of 15 years, the IRR will receive a marginally positive value, if the MFC capital cost comes up to 121.60% of its basic scenario value for a non-platinum catalyst and up to 111.11% for a platinum catalyst. In any case, an increase in the MFC capital cost of up to 13.5% for a non-platinum catalyst and up to 4.5% for a platinum catalyst could lead to an economically viable solution theoretically, on the condition that the MFC modules of Trapero et al. (2017) could be realized.
FIGURE 10
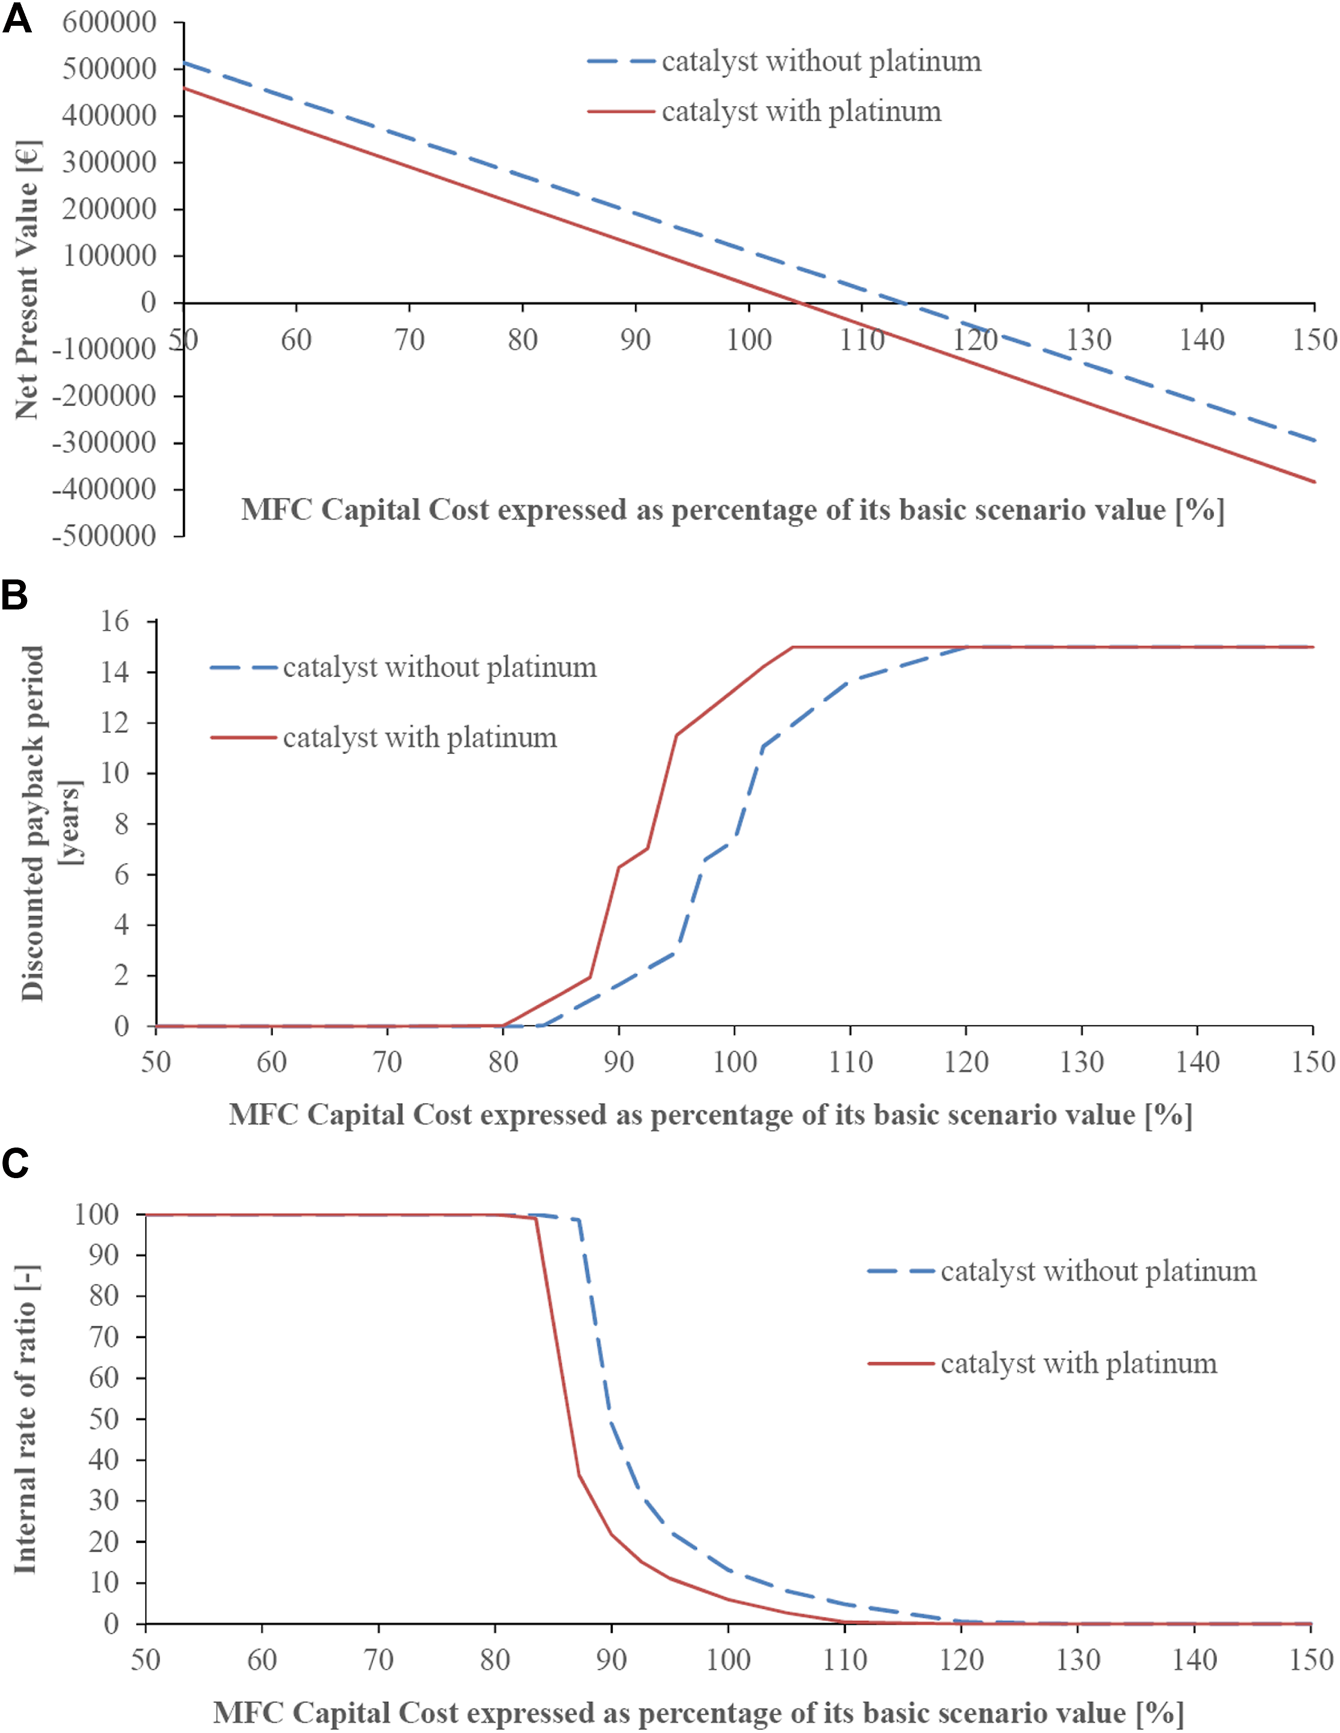
(A) Net present value NPV with respect to MFC capital cost CMFC (expressed as percentage of its basic scenario value) for the secondary wastewater treatment configuration with MFC against AS, with platinum/non-platinum catalysts for an investment life period at 15 years and a deflated interest rate at 3%. (B) Discounted payback period ΤDPB with respect to MFC capital cost CMFC (expressed as percentage of its basic scenario value) for the secondary wastewater treatment configuration with MFC against AS, with platinum/non-platinum catalysts for a deflated interest rate at 3%. (C) Internal rate of return IRR with respect to MFC capital cost CMFC (expressed as percentage of its basic scenario value) for the secondary wastewater treatment configuration with MFC against AS, with platinum/non-platinum catalysts for an investment life period at 15 years.
4.6 Sensitivity Analysis of the Microbial Fuel Cell Extended Maintenance Cost
For the basic scenario of Section 4.1, the MFC extended maintenance cost MCFMC is investigated taking values from 20 to 150% of its basic scenario value, with all other parameters remaining stable, according to the assumptions of Section 4.1. Changing this parameter affects only financial results. In particular, the NPV for a deflated interest rate at 3% and an investment life period at 15 years decreases approximately linearly, in relation to the MFC extended maintenance cost expressed as percentage of its basic scenario value, as is shown in Figure 11A. It is determined that the NPV will be marginally positive, if the MFC extended maintenance cost comes up to 167.85% of its basic scenario value for a non-platinum catalyst and up to 118.51% for a platinum catalyst. The latter is confirmed by the relative graph of the TDPB (Figure 11B), while the same conclusions could be reached with the BCR. Respectively, in Figure 11C, for an investment life period at 15 years, the IRR will receive a marginally positive value, if the MFC extended maintenance cost comes up to 186.54% of its basic scenario value for non-platinum catalyst and up to 136.55% for platinum catalyst. In any case, an increase in MFC extended maintenance cost of up to 67.5% for a non-platinum catalyst and up to 18.5% for a platinum catalyst could lead to an economically viable solution theoretically, on the condition that the MFC modules of Trapero et al. (2017) could be realized.
FIGURE 11

(A) Net present value NPV with respect to MFC extended maintenance cost MCMFC (expressed as percentage of its basic scenario value) for the secondary wastewater treatment configuration with MFC against AS, with platinum/non-platinum catalysts for an investment life period at 15 years and a deflated interest rate at 3%. (B) Discounted payback period ΤDPB with respect to MFC extended maintenance cost MCMFC (expressed as percentage of its basic scenario value) for the secondary wastewater treatment configuration with MFC against AS, with platinum/non-platinum catalysts for a deflated interest rate at 3%. (C) Internal rate of return IRR with respect to MFC extended maintenance cost MCMFC (expressed as percentage of its basic scenario value) for the secondary wastewater treatment configuration with MFC against AS, with platinum/non-platinum catalysts for an investment life period at 15 years.
4.7 Sensitivity Analysis of Energy Costs and of Energy Consumption From the Operation of the Wastewater Treatment Plant
For the basic scenario of Section 4.1, the effect of the electricity sale cost on behalf of the power grid ckWh on the economic viability of the use of MFC (against the use of AS) is studied, in combination with the energy consumed by the diffuser/blower in the secondary wastewater treatment. The energy consumption of the other systems of this stage is common (throughout every technical solution considered), hence its cost plays no part in the respective comparison. At this point, it is also considered that the electricity sale cost on behalf of the power grid ckWh is the same as the electricity market cost from the power grid skWh, since it is considered that the biological treatment plant will initially cover its own needs for energy consumption and then will actually move to selling energy. So, in this case, the energy consumption in the biological wastewater treatment plant amounts to 599,129 kWh per year using the AS system and to 254,916 kWh per year using the MFC for the rest of the facilities (Trapero et al., 2017). The respective annual energy generated by the MFC amounts to 6,140 kWh for a non-platinum catalyst and to 12,280 kWh for a platinum catalyst. This means that in the basic scenario, the MFC energy production will not be offered to the market, but will cover part of the electrical energy consumption of the specific plant. This justifies the assumption of ckWh and skWh being equal. The electrical energy production by the MFC could cover the secondary wastewater treatment plant electrical energy consumption, if the self-consumption is limited below 0.0182 kWh/m3 of wastewater for a non-platinum catalyst and below 0.0364 kWh/m3 for a platinum catalyst (which is difficult to achieve), or if the organic load is increased (which cannot be obtained for urban wastewater easily), or if the Coulombic efficiency is increased (which is a technological issue for MFCs).
In the present case, the electricity sale cost on behalf of the power grid ckWh varies between the values of 0.05 and 0.50 €/kWh and the energy consumption by the air blower/diffuser from 0.1 to 1.3 kWh/m3. From the total results, it appears that the higher the electricity sale cost ckWh and the higher the energy consumption by the air blower/diffuser, the more economically viable is the conversion of a secondary wastewater treatment unit from AS to MFC theoretically, on the condition that the MFC modules of Trapero et al. (2017) can be realized. The latter is confirmed by the graphs (Figure 12) of the NPV at the commencement of the commercial operation of the TDPB and of the IRR (with platinum/non-platinum catalysts) with respect to the electricity sale cost ckWh and to air blower/diffuser energy consumption per cubic meter of wastewater. The respective graph of the BCR is similar to that of the NPV and is therefore omitted. In particular, Figures 12A,B show that an economically viable solution presents, in the case of the non-platinum catalyst, for coordinate points (ckWh, Cblower) with higher values than those defined by the diagonal formed between points (0.09, 0.8) and (0.25, 0.2), while in the case of the platinum catalyst, by the diagonal formed between points (0.09, 1.0) and (0.30, 0.2), which corresponds to a more limited area of acceptable values. It is noted that the investment life period of 15 years sets the maximum limit of the TDPB under investigation in Figure 12B. From Figure 12C, the results show that the IRR for an investment life period at 15 years takes zero values (which are not acceptable), in the area with lower coordinate values (ckWh, Cblower) than those defined by the diagonal formed between the points (0.09, 0.6) and (0.35, 0.1) in the case of a non-platinum catalyst and between the points (0.09, 0.9) and (0.40, 0.1) in the case of a platinum catalyst. Respectively, the investment success is guaranteed for very high values of IRR, with higher coordinate values (ckWh, Cblower) than those defined by the diagonal formed between the points (0.30, 1.3) and (0.50, 0.8) in the non-platinum catalyst case and between the points (0.40, 1.3) and (0.50, 1.0) in the platinum catalyst case. In any case, the technical solution of the MFC with a non-platinum catalyst renders better economic results than the MFC with a platinum catalyst. However, the differences are mitigated when proceeding to a higher electricity sale cost or higher energy consumption by the air blower/diffuser.
FIGURE 12
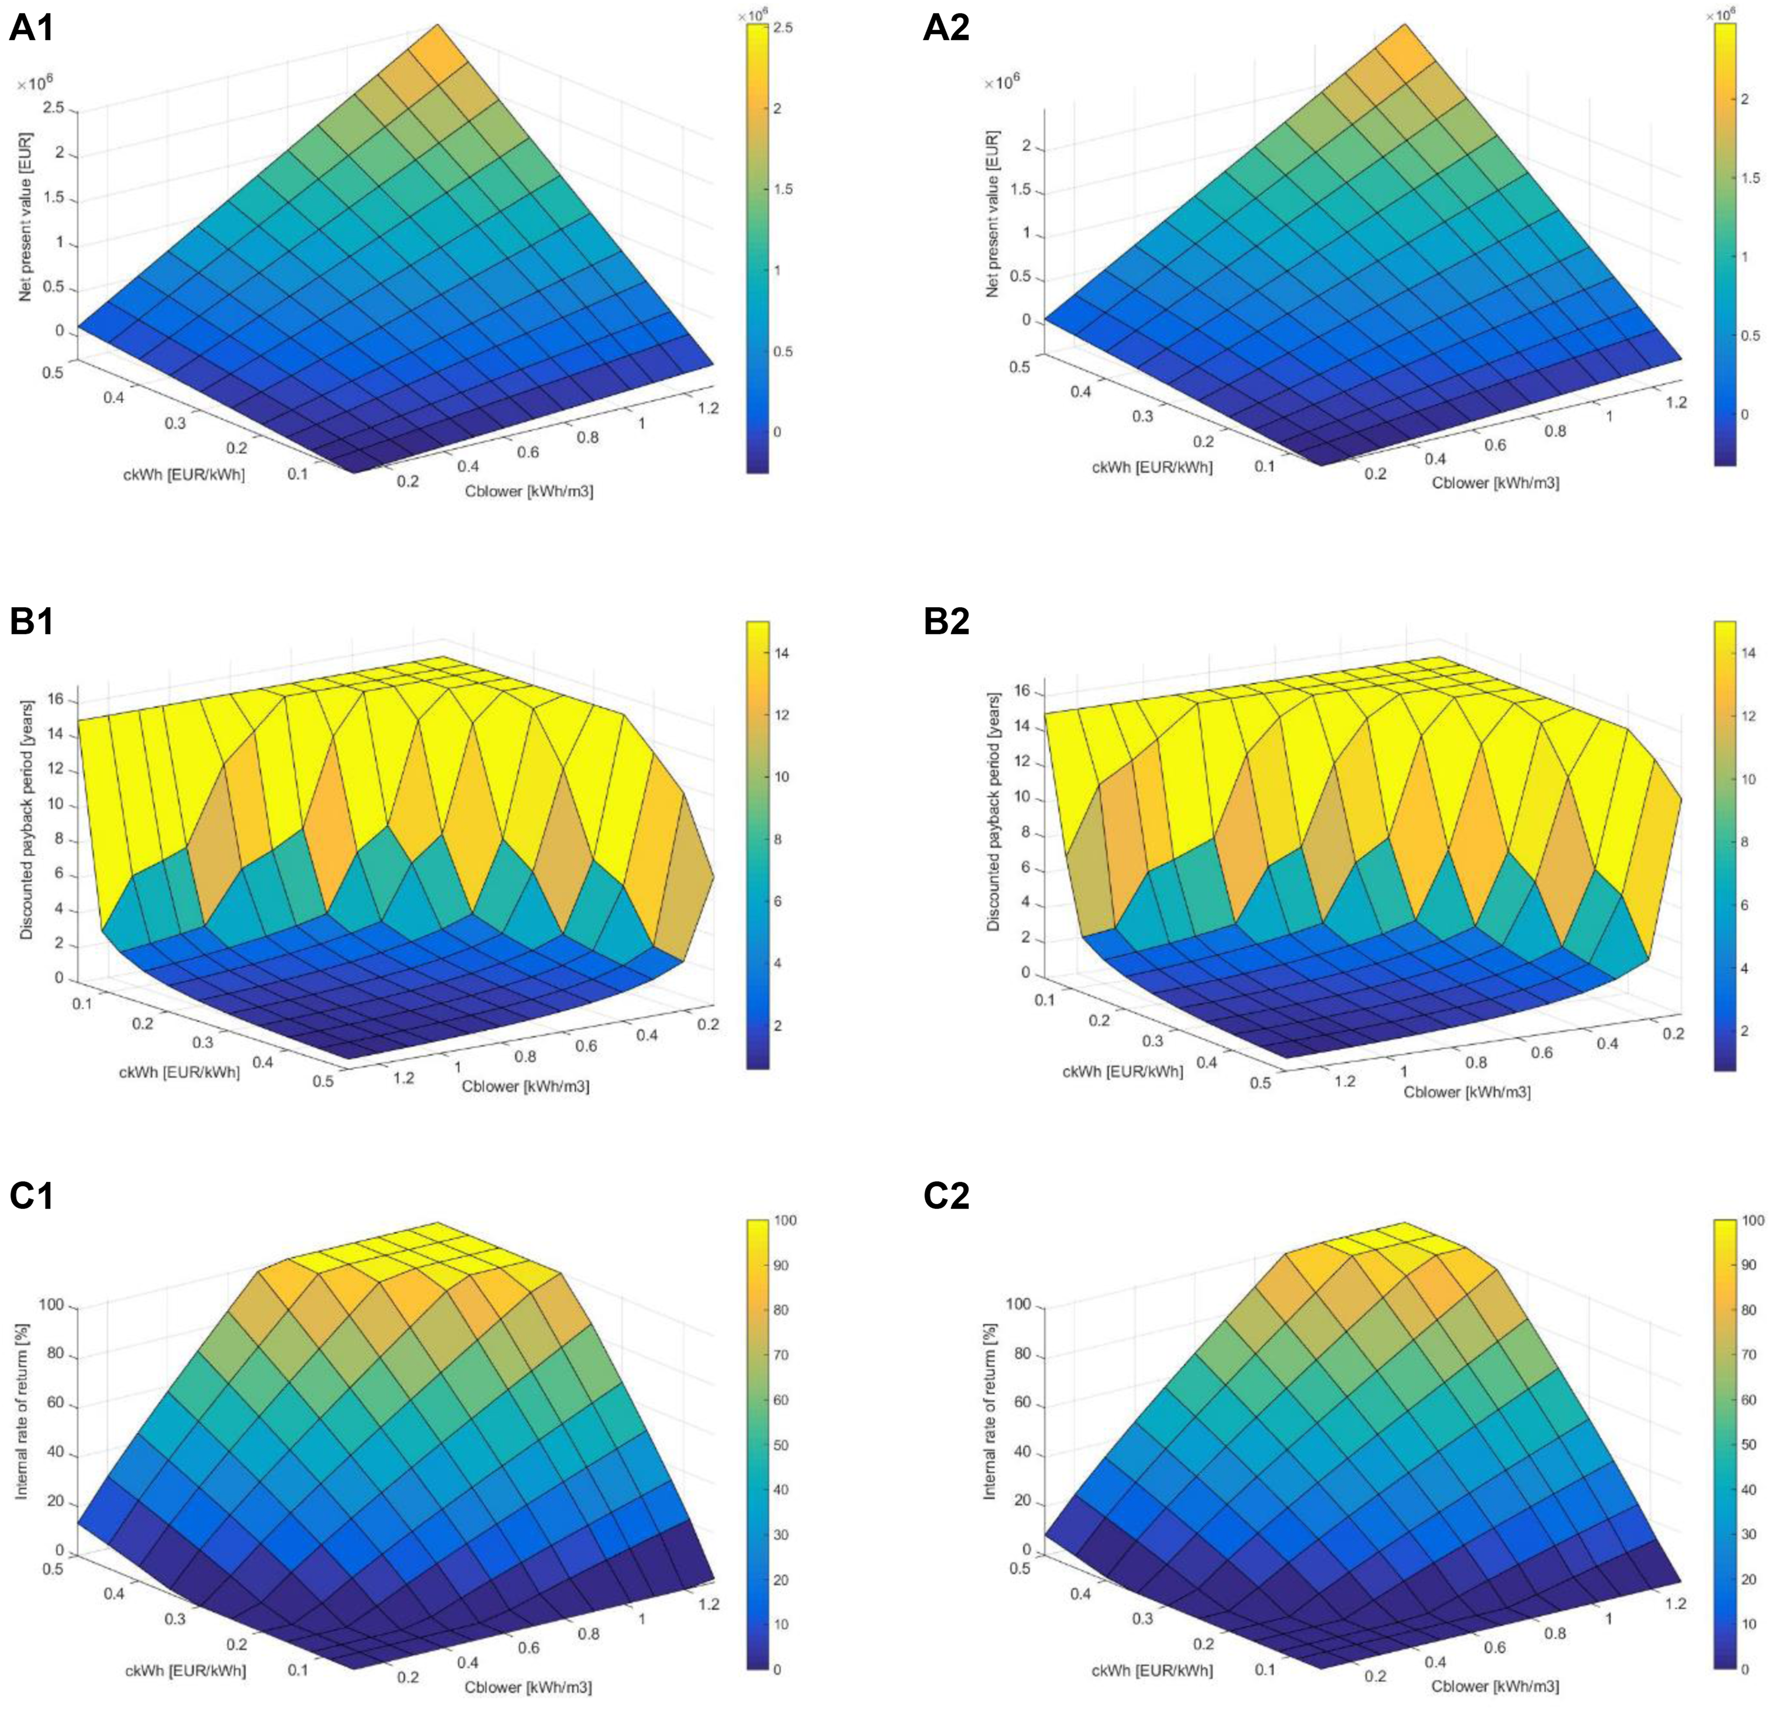
(A) Net present value NPV with respect to the electricity sale cost on behalf of the power grid ckWh and to energy consumption by the air blower/diffuser per cubic meter of wastewater for the secondary wastewater treatment configuration with MFC with (A1) non-platinum catalyst or (A2) platinum catalyst, against AS, for an investment life period at 15 years and a deflated interest rate at 3%. (B) Discounted payback period TDPB with respect to electricity sale cost on behalf of the power grid ckWh and to energy consumption by the air blower/diffuser per cubic meter of wastewater for the secondary wastewater treatment configuration with MFC with (B1) non-platinum catalyst or (B2) platinum catalyst, against AS, for a deflated interest rate at 3%. (C) Internal rate of return IRR with respect to the electricity sale cost on behalf of the power grid ckWh and to energy consumption by the air blower/diffuser per cubic meter of wastewater for the secondary wastewater treatment configuration with MFC with (C1) non-platinum catalyst or (C2) platinum catalyst, against AS, for an investment life period at 15 years.
4.8 Sensitivity Analysis of Deflated Interest Rate and of Investment Life Period for the Biological Treatment Plant
For the basic scenario of Section 4.1, the effect of the deflated interest rate (ranging from 0 to 25%) and the investment life period of the biological treatment plant (ranging from 1 to 15 years) on the financial viability of the investment is studied. It is assumed that all technical solutions have the same lifespan and zero residual value at the end of the operation period. In Figure 13A, the NPV at the commencement of the commercial operation is shown in relation to the deflated interest rate k and to the investment life period n. In the case of a non-platinum catalyst, positive NPV values are found below the specific rate values (in particular, at 4 years below 1.0% interest rate, at 5 years below 9.0%, at 7 years below 1.5%, at 8 years below 7.0%, at 9 years below 10.4%, at 10 years below 12.6%, at 11 years below 7.3%, at 12 below 9.9%, at 13 years below 11.6%, at 14 years below 12.8%, and at 15 years below 13.7%). In all other cases (with higher interest rates), this technical solution is not financially viable theoretically, on the condition that the MFC modules of Trapero et al. (2017) can be realized. In the case of a platinum catalyst, the positive NPV values are located in a much more limited zone (in particular, at 5 years below 0.75%, at 9 years below 1.6%, at 10 years below 4.7%, at 13 years below 2.2%, at 14 years below 4.4%, and at 15 years below 5.9%). The respective graph of the BCR is similar to the NPV graph and is therefore omitted. In Figure 13B, the TDPB is shown, which numerically confirms what has already been explained concerning the NPV. The relative acceptable areas appear in the form of “valleys”, where the TDPB is shorter than the investment life period n. The irregularities that appear on the graphs are due to the high MFC maintenance costs, every 5 years (=Tmaintenance_MFC). In Figure 14, the IRR is presented with respect to the investment life period n for the two types of catalyst. Again, the irregular behavior of the curves (intense fluctuations) is observed due to the high maintenance costs of membranes and electrodes, every 5 years. In addition, the better economic performance of a non-platinum catalyst is obvious again, because for specific investment life periods, the IRR for a non-platinum catalyst is significantly higher than the respective IRR for a platinum catalyst.
FIGURE 13
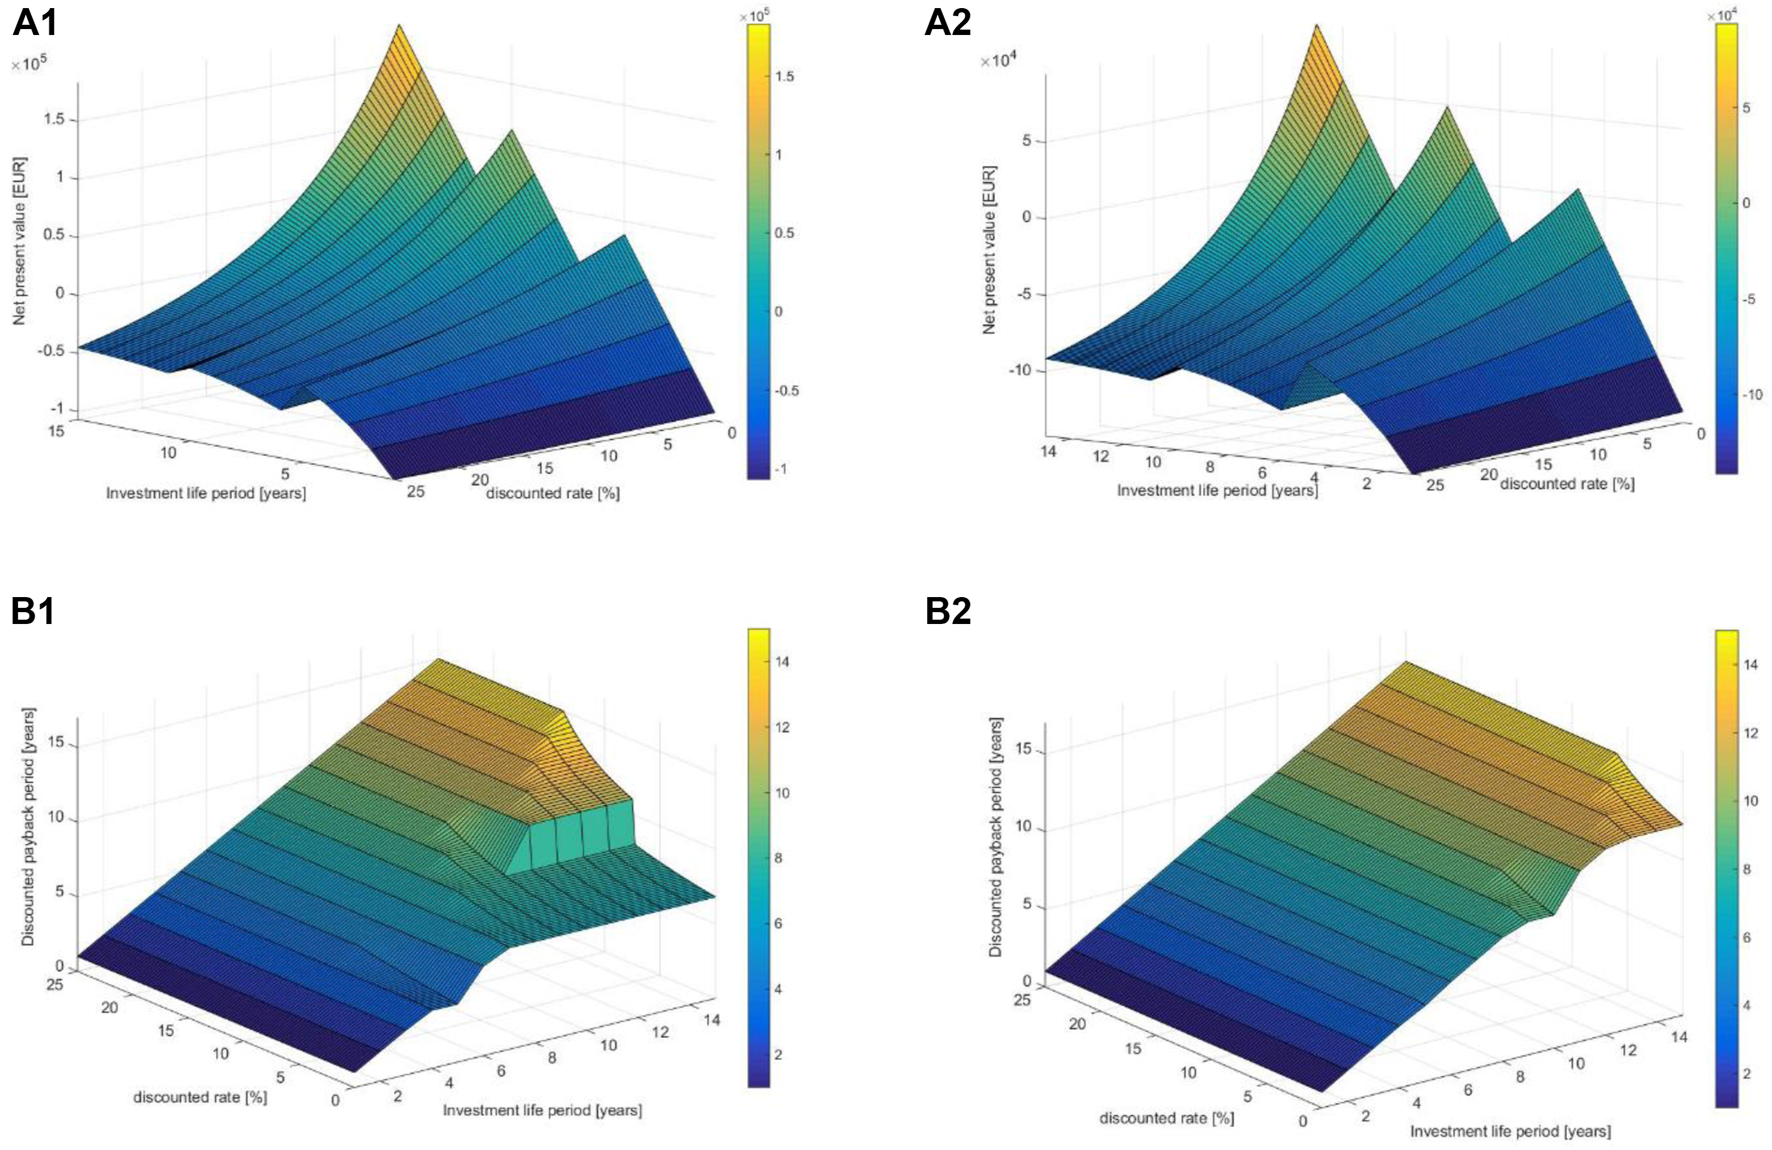
(A) Net present value NPV with respect to deflated interest rate k and to investment life period n for the secondary wastewater treatment configuration with MFC with (A1) non-platinum catalyst or (A2) platinum catalyst, against AS. (B) Discounted payback period TDPB with respect to deflated interest rate k and to investment life period n for the secondary wastewater treatment configuration with MFC with (B1) non-platinum catalyst or (B2) platinum catalyst, against AS.
FIGURE 14
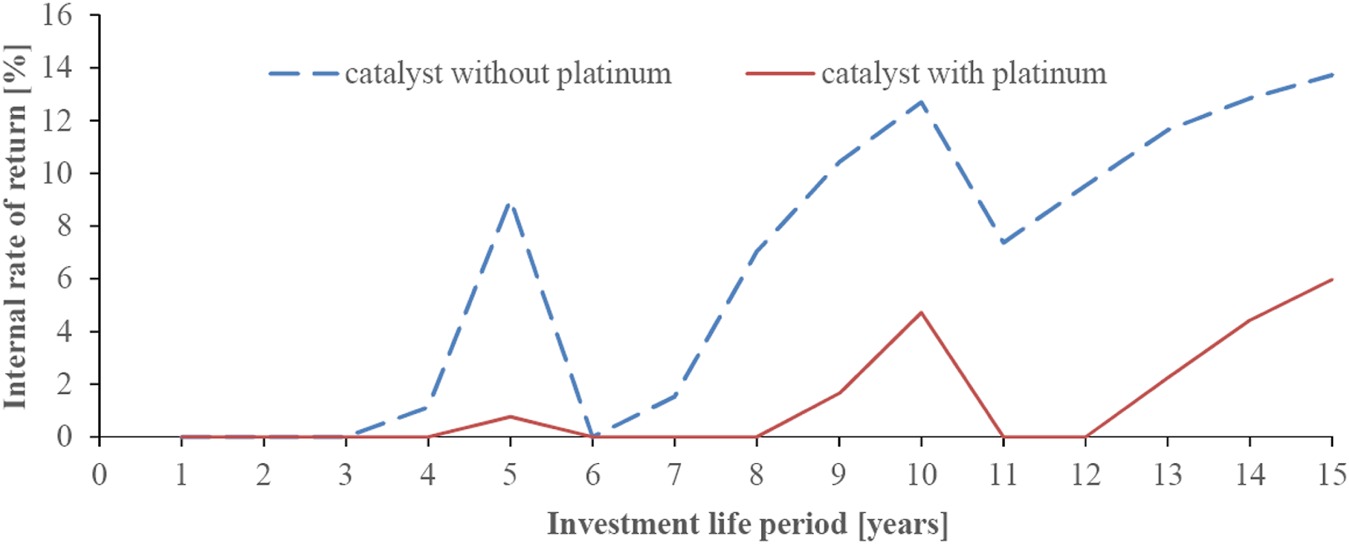
Internal rate of return IRR with respect to investment life period n for the secondary wastewater treatment configuration with MFC with platinum/non-platinum catalysts, against AS.
5 Conclusion
In this article, the potential use of MFCs, utilizing urban wastewater, was studied, not only in terms of their technical application criteria but also in terms of the economic criteria, so as to determine the conditions under which the financial viability of the investment could be ensured and also the possibilities of their integration in a smart grid. After the literature review, the general description of the biological treatment plant, the ways of MFCs installation within the aforementioned structure, the reasons for MFCs development and issues during using MFCs, the article analyzed the possibility of their integration in a smart grid, where their most important advantages are as listed below:
• Conversion of a power consumer to a producer, which controls, to a significant degree, the power produced by keeping the wastewater influent (its “fuel”) rate under control, mainly through wastewater tanks.
• Availability of advanced measurement systems, through the PMS, which are integrated in the MFC system and in the respective converters by construction.
• Distributed energy resources with small power installation size and low stochastic behavior in terms of its power production.
• Reduction of losses in power transmission and distribution networks—enhanced sustainability.
• No spatial expansion of the facilities compared to conventional biological treatment facilities and no further visual nuisance, on the condition that the gross volume per cubic meter of wastewater under process in the industrial scale is smaller than the respective one of the AS system (or any other similar one).
• Limited nuisance due to odors, since it is a mainly anaerobic treatment, which uses less oxygen than the AS.
• Improvement of the power system behavior, in terms of power quality and reliability.
• Very promising technology, due to intensive research in MFCs.
On the other hand, there are a number of disadvantages that still hinder their systematic commercial use, such as:
• High installation and maintenance costs per kW, having installation costs at 100 k€/kW for wastewater rich in organic load (Trapero et al., 2017) and from 550 to 1,050 k€/kW for urban wastewater, i.e., up to 1,000 times more expensive, compared to other conventional installations and RES (see Section 2.5 and Section 4.1).
• Not technologically mature, as yet.
• Significant issues at the up-scaling of the MFCs.
• Their operational behavior is not guaranteed because the activity of microbes is affected by many parameters (i.e., organic load, microbe poisoning, temperature, pH, etc.).
• Reconfiguration of the power distribution network from mono-directional to bidirectional, although this concerns the conversion of the distribution network within the smart grid.
• Limited capacity for power and energy production, as their capacity is one of kW, for wastewater treatment of a settlement of 2,000 inhabitants and the respective energy produced covers a part of their own consumption in the biological treatment plant (see Section 4.1 and Section 4.7). This situation is improved in the case of wastewater rich in organic load, where the biological treatment plant exceeds its own consumption, with a power output of kWs (Trapero et al., 2017).
• Limited location possibilities for the utilization of biological treatment plants, since this is determined by the sewerage network.
• Its financial viability is not guaranteed, due to high installation/maintenance costs and inaccurate knowledge of the technical lifespan.
From the numerical study, for the treatment of typical urban wastewater of a settlement of 2,000 inhabitants (see
Section 4.1), it has emerged that for the basic scenario of MFC integration in the secondary biological wastewater treatment, against the AS system, the technical and economic implementation of the project is feasible on the condition that the scale-up technical issues of MFCs are successfully addressed. This was followed by the sensitivity analysis, using the financial criteria of
NPV,
BCR,
IRR, and
TDPBwith regard to a number of parameters, such as:
• Percentage of organic load removal over influent (in the form of chemical oxygen demand), during secondary treatment, and Coulombic efficiency, which significantly affect the capital cost per installed kW, while the respective investment remains economically viable for all scenarios under consideration (see Section 4.2).
• Hydraulic retention time, which significantly affects the required number of MFCs, the nominal active power per MFC, MFC power density, and installation and maintenance costs per installed kW, while the respective investments remain economically viable for very low values, of the order of 10 h and slightly higher, however, the nominal active power of MFC stack remains constant (see Section 4.3).
• MFC energy conversion factor, which includes both the DC to AC converters and the losses due to the nonuniform MFC operation, proportionally affects the nominal active power per MFC, MFC power density, and the nominal active power of the MFC stack, while the respective investment remains financially viable for all the scenarios examined (see Section 4.4).
• MFC capital cost, which adversely affects the financial viability of the MFC use, with higher sensitivity in the case of a platinum catalyst, since a 4.5% increase renders the investment unprofitable (see Section 4.5).
• MFC extended maintenance cost, which adversely affects the economic viability of the MFC use, with higher sensitivity in the case of the platinum catalyst, which, nonetheless, has a greater margin of increase (up to 18.5%) than in the case of the MFC capital cost (see Section 4.6).
• Energy costs and electricity consumption from the air blower/diffuser per cubic meter of wastewater, during the operation of the wastewater treatment plant, which affect the economic viability of MFC use favorably (through the increase of the respective quantities), due to energy and money savings, versus the operation of the AS (see Section 4.7).
• Deflated interest rate and investment life period of a biological treatment plant, where an increase in the former and a decrease in the latter would adversely affect the financial viability of MFC use. In addition, there is a strong, unfavorable, nonlinearity in the effect of the investment life period due to high extended maintenance costs per 5 years (at years 6 and 11) (see Section 4.8).
In the cases examined, the technical solution of using MFCs with non-platinum catalysts is economically advantageous over the solution of platinum catalysts.
The respective results show that the use of MFCs, as distributed energy resources in the structure of smart grids, is no utopia, as long as they are integrated into the structure of a central wastewater treatment plant, in order to render the respective investment economically viable, as a form of a particular cogeneration. Necessary preconditions are the solution of the technical issues of MFCs (especially the scaling-up ones) and the provision of a significant level of funding and length of commercial development time, similar to other renewable energy sources (i.e., photovoltaic panels and wind turbines).
Statements
Data availability statement
The original contributions presented in the study are included in the article/Supplementary Material, and further inquiries can be directed to the corresponding author.
Author contributions
GT and PD proposed the concept. GT, PD, and VK developed the methodology. PD, GT, and FK developed the methodology. PD, GT, and PK validated the methodology and found resources. PD, GT, and VK analyzed the respective results. NM and CE carried out data curation. All authors wrote the original draft. GT had general supervision.
Acknowledgments
The authors are grateful to Mr. Spiros Gialampidis for his work on the original text version.
Conflict of interest
The authors declare that the research was conducted in the absence of any commercial or financial relationships that could be construed as a potential conflict of interest.
Publisher’s note
All claims expressed in this article are solely those of the authors and do not necessarily represent those of their affiliated organizations, or those of the publisher, the editors, and the reviewers. Any product that may be evaluated in this article, or claim that may be made by its manufacturer, is not guaranteed or endorsed by the publisher.
Abbreviations
AS, activated sludge (system); BCR, benefit cost ratio; BOD, biochemical oxygen demand; COD, chemical oxygen demand; HRT, hydraulic retention time; IRR, internal rate of return; NPV, net present value; MEC(s), microbial electrolysis cell(s); MFC(s), microbial fuel cell(s); PEM, proton exchange membrane; PMS, power management system; RES, renewable energy sources; TDPB, discounted payback period; WT, wastewater treatment system/plant.
References
1
AbbasS. Z.RafatullahM.IsmailN.SyakirM. I. (2017). A Review on Sediment Microbial Fuel Cells as a New Source of Sustainable Energy and Heavy Metal Remediation: Mechanisms and Future Prospective. Int. J. Energ. Res.41 (9), 1242–1264. 10.1002/er.3706
2
AbdallahM.FerozS.AlaniS.SayedE. T.ShanablehA. (2019). Continuous and Scalable Applications of Microbial Fuel Cells: a Critical Review. Rev. Environ. Sci. Biotechnol.18 (3), 543–578. 10.1007/s11157-019-09508-x
3
AbrevayaX. C.SaccoN. J.BonettoM. C.Hilding-OhlssonA.CortónE. (2015a). Analytical Applications of Microbial Fuel Cells. Part I: Biochemical Oxygen Demand. Biosens. Bioelectron.63, 580–590. 10.1016/j.bios.2014.04.034
4
AbrevayaX. C.SaccoN. J.BonettoM. C.Hilding-OhlssonA.CortónE. (2015b). Analytical Applications of Microbial Fuel Cells. Part II: Toxicity, Microbial Activity and Quantification, Single Analyte Detection and Other Uses. Biosens. Bioelectron.63, 591–601. 10.1016/j.bios.2014.04.053
5
AdelajaO.KeshavarzT.KyazzeG. (2015). The Effect of Salinity, Redox Mediators and Temperature on Anaerobic Biodegradation of Petroleum Hydrocarbons in Microbial Fuel Cells. J. Hazard. Mater.283, 211–217. 10.1016/j.jhazmat.2014.08.066
6
Aguirre-SierraA.Bacchetti-De GregorisT.BernáA.SalasJ. J.AragónC.Esteve-NúñezA. (2016). Microbial Electrochemical Systems Outperform Fixed-Bed Biofilters in Cleaning up Urban Wastewater. Environ. Sci. Water Res. Technol.2, 984–993. 10.1039/c6ew00172f
7
AliA. E.-H.GomaaO. M.FatheyR.KareemH. A. E.ZaidM. A. (2015). Optimization of Double Chamber Microbial Fuel Cell for Domestic Wastewater Treatment and Electricity Production. J. Fuel Chem. Tech.43 (9), 1092–1099. 10.1016/s1872-5813(15)30032-3
8
AlSayedA.SolimanM.EldyastiA. (2020). Microbial Fuel Cells for Municipal Wastewater Treatment: From Technology Fundamentals to Full-Scale Development. Renew. Sust. Energ. Rev.134, 110367. 10.1016/j.rser.2020.110367
9
AsensioY.MansillaE.Fernandez-MarchanteC. M.LobatoJ.CañizaresP.RodrigoM. A. (2017). Towards the Scale-Up of Bioelectrogenic Technology: Stacking Microbial Fuel Cells to Produce Larger Amounts of Electricity. J. Appl. Electrochem.47 (10), 1115–1125. 10.1007/s10800-017-1101-2
10
BabanovaS.SantoroC.JonesJ.PhanT.SerovA.AtanassovP.et al (2021). Practical Demonstration of Applicability and Efficiency of Platinum Group Metal-free Based Catalysts in Microbial Fuel Cells for Wastewater Treatment. J. Power Sourc.491, 229582. 10.1016/j.jpowsour.2021.229582
11
BlatterM.DelabaysL.FurrerC.HugueninG.CachelinC. P.FischerF. (2021). Stretched 1000-L Microbial Fuel Cell. J. Power Sourc.483, 229130. 10.1016/j.jpowsour.2020.229130
12
BolognesiS.BañerasL.Perona-VicoE.CapodaglioA. G.BalaguerM. D.PuigS. (2022). Carbon Dioxide to Bio-Oil in a Bioelectrochemical System-Assisted Microalgae Biorefinery Process. Sust. Energ. Fuels6, 150–161. 10.1039/D1SE01701B
13
BolognesiS.CecconetD.CallegariA.CapodaglioA. G. (2021a). Bioelectrochemical Treatment of Municipal Solid Waste Landfill Mature Leachate and Dairy Wastewater as Co-substrates. Environ. Sci. Pollut. Res.28, 24639–24649. 10.1007/s11356-020-10167-7
14
BolognesiS.CecconetD.CallegariA.CapodaglioA. G. (2021b). Combined Microalgal Photobioreactor/microbial Fuel Cell System: Performance Analysis under Different Process Conditions. Environ. Res.192, 110263. 10.1016/j.envres.2020.110263
15
BorjasZ.Esteve-NúñezA.OrtizJ. M. (2017). Strategies for Merging Microbial Fuel Cell Technologies in Water Desalination Processes: Start-Up Protocol and Desalination Efficiency Assessment. J. Power Sourc.356, 519–528. 10.1016/j.jpowsour.2017.02.052
16
BraccoS.DelfinoF. (2017). A Mathematical Model for the Dynamic Simulation of Low Size Cogeneration Gas Turbines within Smart Microgrids. Energy119, 710–723. 10.1016/j.energy.2016.11.033
17
CaiT.MengL.ChenG.XiY.JiangN.SongJ.et al (2020). Application of Advanced Anodes in Microbial Fuel Cells for Power Generation: A Review. Chemosphere248, 1259851–1259915. 10.1016/j.chemosphere.2020.125985
18
CapodaglioA.CecconetD.MolognoniD. (2017). An Integrated Mathematical Model of Microbial Fuel Cell Processes: Bioelectrochemical and Microbiologic Aspects. Processes54, 73. 10.3390/pr5040073
19
CapodaglioA. G.BolognesiS.CecconetD. (2021). Sustainable, Decentralized Sanitation and Reuse with Hybrid Nature-Based Systems. Water1311, 1583. 10.3390/w13111583
20
CapodaglioA. G.MolognoniD.PuigS.BalaguerM. D.ColprimJ. (2015). Role of Operating Conditions on Energetic Pathways in a Microbial Fuel Cell. Energ. Proced.74, 728–735. 10.1016/j.egypro.2015.07.808
21
CapodaglioA.OlssonG. (2020). Energy Issues in Sustainable Urban Wastewater Management: Use, Demand Reduction and Recovery in the Urban Water Cycle. Sustainability12, 1266. 10.3390/su12010266
22
Ceballos-EscaleraA.MolognoniD.Bosch-JimenezP.ShahparastiM.BouchakourS.LunaA.et al (2020). Bioelectrochemical Systems for Energy Storage: A Scaled-Up Power-To-Gas Approach. Appl. Energ.260, 114138. 10.1016/j.apenergy.2019.114138
23
CecconetD.BolognesiS.MolognoniD.CallegariA.CapodaglioA. G. (2018). Influence of Reactor's Hydrodynamics on the Performance of Microbial Fuel Cells. J. Water Process Eng.26, 281–288. 10.1016/j.jwpe.2018.10.019
24
CristianiP.CarvalhoM. L.GuerriniE.DaghioM.SantoroC.LiB. (2013). Cathodic and Anodic Biofilms in Single Chamber Microbial Fuel Cells. Bioelectrochemistry92, 6–13. 10.1016/j.bioelechem.2013.01.005
25
CristianiP.GajdaI.GreenmanJ.PizzaF.BonelliP.IeropoulosI. (2019). Long Term Feasibility Study of In-Field Floating Microbial Fuel Cells for Monitoring Anoxic Wastewater and Energy Harvesting. Front. Energ. Res.7, 119. 10.3389/fenrg.2019.00119
26
CristianiP.GoglioA.MarzoratiS.Fest-SantiniS.SchievanoA. (2020). Biochar-Terracotta Conductive Composites: New Design for Bioelectrochemical Systems. Front. Energ. Res.8, 581106. 10.3389/fenrg.2020.581106
27
DaudS. M.KimB. H.GhasemiM.DaudW. R. W. (2015). Separators Used in Microbial Electrochemical Technologies: Current Status and Future Prospects. Bioresour. Tech.195, 170–179. 10.1016/j.biortech.2015.06.105
28
DingW.ChengS.YuL.HuangH. (2017). Effective Swine Wastewater Treatment by Combining Microbial Fuel Cells with Flocculation. Chemosphere182, 567–573. 10.1016/j.chemosphere.2017.05.006
29
DonovanC.DewanA.HeoD.BeyenalH. (2008). Batteryless, Wireless Sensor Powered by a Sediment Microbial Fuel Cell. Environ. Sci. Technol.42 (22), 8591–8596. 10.1021/es801763g
30
EbrahimiA.SivakumarM.McLauchlanC. (2021). A Taxonomy of Design Factors in Constructed Wetland-Microbial Fuel Cell Performance: A Review. J. Environ. Manage.291, 112723. 10.1016/j.jenvman.2021.112723
31
EdvardsenGawelL. K.GawelGawelK. B.WennerS.GawelB.TorsæterM. (2020). Electrochemical Enhancement and Inhibition of Calcium Carbonate Deposition. J. Environ. Chem. Eng.8 (5), 104239. 10.1016/j.jece.2020.104239
32
ErableB.OliotM.LacroixR.BergelA.SerovA.KodaliM.et al (2018). Iron-Nicarbazin Derived Platinum Group Metal-free Electrocatalyst in Scalable-Size Air-Breathing Cathodes for Microbial Fuel Cells. Electrochimica Acta277, 127–135. 10.1016/j.electacta.2018.04.190
33
EscapaA.MateosR.MartínezE. J.BlanesJ. (2016). Microbial Electrolysis Cells: An Emerging Technology for Wastewater Treatment and Energy Recovery. From Laboratory to Pilot Plant and beyond. Renew. Sust. Energ. Rev.55, 942–956. 10.1016/j.rser.2015.11.029
34
Estrada-ArriagaE. B.Hernández-RomanoJ.García-SánchezL.Guillén GarcésR. A.Bahena-BahenaE. O.Guadarrama-PérezO.et al (2018). Domestic Wastewater Treatment and Power Generation in Continuous Flow Air-Cathode Stacked Microbial Fuel Cell: Effect of Series and Parallel Configuration. J. Environ. Manage.214, 232–241. 10.1016/j.jenvman.2018.03.007
35
EvelynLiY.MarshallA.GostomskiP. A. (2014). Gaseous Pollutant Treatment and Electricity Generation in Microbial Fuel Cells (MFCs) Utilising Redox Mediators. Rev. Environ. Sci. Biotechnol.13 (1), 35–51. 10.1007/s11157-013-9322-2
36
EwingT.HaP. T.BeyenalH. (2017). Evaluation of Long-Term Performance of Sediment Microbial Fuel Cells and the Role of Natural Resources. Appl. Energ.192, 490–497. 10.1016/j.apenergy.2016.08.177
37
Ewusi-MensahD.HuangJ.ChaparroL. K.RodenasP.Ramírez-MorenoM.OrtizJ. M.et al (2021). Algae-Assisted Microbial Desalination Cell: Analysis of Cathode Performance and Desalination Efficiency Assessment. Processes9, 2011. 10.3390/pr9112011
38
FiccaV. C. A.SantoroC.D'EpifanioA.LicocciaS.SerovA.AtanassovP.et al (2020). Effect of Active Site Poisoning on Iron−Nitrogen−Carbon Platinum‐Group‐Metal‐Free Oxygen Reduction Reaction Catalysts Operating in Neutral Media: A Rotating Disk Electrode Study. ChemElectroChem7 (14), 3044–3055. 10.1002/celc.202000754
39
FlimbanS. G. A.IsmailI. M. I.KimT.OhS.-E. (2019). Overview of Recent Advancements in the Microbial Fuel Cell from Fundamentals to Applications: Design, Major Elements, and Scalability. Energies1217, 3390. 10.3390/en12173390
40
ForneroJ. J.RosenbaumM.AngenentL. T. (2010). Electric Power Generation from Municipal, Food, and Animal Wastewaters Using Microbial Fuel Cells. Electroanalysis22 (7-8), 832–843. 10.1002/elan.200980011
41
FreguiaS.LogriecoM.MonettiJ.LedezmaP.VirdisB.TsujimuraS. (2019). Self-Powered Bioelectrochemical Nutrient Recovery for Fertilizer Generation from Human Urine. Sustainability1119, 5490. 10.3390/su11195490
42
GajdaI.GreenmanJ.IeropoulosI. A. (2018a). Recent Advancements in Real-World Microbial Fuel Cell Applications. Curr. Opin. Electrochemistry11, 78–83. 10.1016/j.coelec.2018.09.006
43
GajdaI.GreenmanJ.SantoroC.SerovA.AtanassovP.MelhuishC.et al (2018b). Multi‐functional Microbial Fuel Cells for Power, Treatment and Electro‐osmotic Purification of Urine. J. Chem. Technol. Biotechnol.94 (7), 2098–2106. 10.1002/jctb.5792
44
GajdaI.StinchcombeA.GreenmanJ.MelhuishC.IeropoulosI. (2017). Microbial Fuel Cell - A Novel Self-Powered Wastewater Electrolyser for Electrocoagulation of Heavy Metals. Int. J. Hydrogen Energ.42 (3), 1813–1819. 10.1016/j.ijhydene.2016.06.161
45
GhassemiZ.SlaughterG. (2017). Biological Fuel Cells and Membranes. Membranes71, 3. 10.3390/membranes7010003
46
Greek Special Secretariat for Waters (2012). Wastewater Treatment Guidelines for Small Residential Area. 1st ed.Elláda, Greece: Official Gazette.
47
GreenmanJ.GajdaI.IeropoulosI. (20192019). Microbial Fuel Cells (MFC) and Microalgae; Photo Microbial Fuel Cell (PMFC) as Complete Recycling Machines. Sust. Energ. Fuels3, 2546–2560. 10.1039/c9se00354a
48
GreenmanJ.MendisA.YouJ.GajdaI.HorsfieldI.IeropoulosI. (2021). Microbial Fuel Cell Based Thermosensor for Robotic Applications. Front. Robot. AI8, 558953. 10.3389/frobt.2021.558953
49
HabermannW.PommerE. H. (1991). Biological Fuel Cells with Sulphide Storage Capacity. Appl. Microbiol. Biotechnol.35, 128–133. 10.1007/bf00180650
50
HeL.DuP.ChenY.LuH.ChengX.ChangB.et al (2017). Advances in Microbial Fuel Cells for Wastewater Treatment. Renew. Sust. Energ. Rev.71, 388–403. 10.1016/j.rser.2016.12.069
51
HiegemannH.LittfinskiT.KrimmlerS.LübkenM.KleinD.SchmelzK.-G.et al (2019). Performance and Inorganic Fouling of a Submergible 255 L Prototype Microbial Fuel Cell Module during Continuous Long-Term Operation with Real Municipal Wastewater under Practical Conditions. Bioresour. Tech.294, 122227. 10.1016/j.biortech.2019.122227
52
HindatuY.AnnuarM. S. M.GumelA. M. (2017). Mini-review: Anode Modification for Improved Performance of Microbial Fuel Cell. Renew. Sust. Energ. Rev.73, 236–248. 10.1016/j.rser.2017.01.138
53
HuangX.DuanC.DuanW.SunF.CuiH.ZhangS.et al (2021). Role of Electrode Materials on Performance and Microbial Characteristics in the Constructed Wetland Coupled Microbial Fuel Cell (CW-MFC): A Review. J. Clean. Prod.301, 126951. 10.1016/j.jclepro.2021.126951
54
HubenovaY.MitovM. (2015). Extracellular Electron Transfer in Yeast-Based Biofuel Cells: A Review. Bioelectrochemistry106, 177–185. 10.1016/j.bioelechem.2015.04.001
55
IeropoulosI. A.LedezmaP.StinchcombeA.PapaharalabosG.MelhuishC.GreenmanJ. (2013). Waste to Real Energy: the First MFC Powered mobile Phone. Phys. Chem. Chem. Phys.15, 15312–15316. 10.1039/C3CP52889H
56
IeropoulosI. A.StinchcombeA.GajdaI.ForbesS.Merino-JimenezI.PasternakG.et al (2016). Pee Power Urinal - Microbial Fuel Cell Technology Field Trials in the Context of Sanitation. Environ. Sci. Water Res. Technol.2, 336–343. 10.1039/C5EW00270B
57
IeropoulosI. A.YouJ.GajdaI.GreenmanJ. (2018). A New Method for Modulation, Control and Power Boosting in Microbial Fuel Cells. Fuel Cells18 (5), 663–668. 10.1002/fuce.201800009
58
IeropoulosI.MelhuishC.GreenmanJ.HorsfieldI. (2005). EcoBot-II: An Artificial Agent with a Natural Metabolism. Int. J. Adv. Robotic Syst.2 (4), 31–300. 10.5772/5777
59
JadhavD. A.Carmona-MartínezA. A.ChendakeA. D.PanditS.PantD. (2021a). Modeling and Optimization Strategies towards Performance Enhancement of Microbial Fuel Cells. Bioresour. Tech.320, 124256. 10.1016/j.biortech.2020.124256:A,
60
JadhavD. A.Ghosh RayS.GhangrekarM. M. (2017). Third Generation in Bio-Electrochemical System Research - A Systematic Review on Mechanisms for Recovery of Valuable By-Products from Wastewater. Renew. Sust. Energ. Rev.76, 1022–1031. 10.1016/j.rser.2017.03.096
61
JadhavD. A.MungrayA. K.ArkatkarA.KumarS. S. (2021b). Recent Advancement in Scaling-Up Applications of Microbial Fuel Cells: From Reality to Practicability. Sustainable Energ. Tech. Assessments45, 101226. 10.1016/j.seta.2021.101226
62
JatoiA. S.AkhterF.MazariS. A.SabzoiN.AzizS.SoomroS. A.et al (2021). Advanced Microbial Fuel Cell for Waste Water Treatment-A Review. Environ. Sci. Pollut. Res.28 (5), 5005–5019. 10.1007/s11356-020-11691-2
63
KaganJ. A.HsuL.HigierA.Arias-ThodeY. M.ChadwickD. B.BeyenalH. (2014). “Design and Performance Considerations for Benthic Microbial Fuel Cells,” in Design and Performance Considerations for Benthic Microbial Fuel Cells. 2014 Oceans - St. John's, St. John's (NL, Canada, 14848493. 14-19 Sept. 2014. 10.1109/OCEANS.2014.7003271
64
KarraU.MutoE.UmazR.KöllnM.SantoroC.WangL.et al (2014). Performance Evaluation of Activated Carbon-Based Electrodes with Novel Power Management System for Long-Term Benthic Microbial Fuel Cells. Int. J. Hydrogen Energ.39 (36), 21847–21856. 10.1016/j.ijhydene.2014.06.095
65
KatakiS.ChatterjeeS.VairaleM. G.SharmaS.DwivediS. K.GuptaD. K. (2021). Constructed Wetland, an Eco-Technology for Wastewater Treatment: A Review on Various Aspects of Microbial Fuel Cell Integration, Low Temperature Strategies and Life Cycle Impact of the Technology. Renew. Sust. Energ. Rev.148, 111261. 10.1016/j.rser.2021.111261
66
Kato MarcusA.TorresC. I.RittmannB. E. (2007). Conduction-based Modeling of the Biofilm Anode of a Microbial Fuel Cell. Biotechnol. Bioeng.98 (6), 1171–1182. 10.1002/bit.21533
67
KellyP. T.HeZ. (2014). Nutrients Removal and Recovery in Bioelectrochemical Systems: A Review. Bioresour. Tech.153, 351–360. 10.1016/j.biortech.2013.12.046
68
KhanM. Z.NizamiA. S.RehanM.OudaO. K. M.SultanaS.IsmailI. M.et al (2017). Microbial Electrolysis Cells for Hydrogen Production and Urban Wastewater Treatment: A Case Study of Saudi Arabia. Appl. Energ.185, 410–420. 10.1016/j.apenergy.2016.11.005
69
KitchingM.ButlerR.MarsiliE. (2017). Microbial Bioelectrosynthesis of Hydrogen: Current Challenges and Scale-Up. Enzyme Microb. Tech.96, 1–13. 10.1016/j.enzmictec.2016.09.002
70
KodaliM.SantoroC.HerreraS.SerovA.AtanassovP. (2017). Bimetallic Platinum Group Metal-free Catalysts for High Power Generating Microbial Fuel Cells. J. Power Sourc.366, 18–26. 10.1016/j.jpowsour.2017.08.110
71
KoskueV.Rinta-KantoJ. M.FreguiaS.LedezmaP.KokkoM. (2021). Optimising Nitrogen Recovery from Reject Water in a 3-chamber Bioelectroconcentration Cell. Sep. Purif. Tech.264 (1), 118428. 10.1016/j.seppur.2021.118428
72
KoutsogiannisD. (1999). Municipal Wastewater Network Design, 3. 1rd ed. Athens, Greece: University Press NTUA.
73
KumarG.BakonyiP.ZhenG.SivagurunathanP.KoókL.KimS.-H.et al (2017). Microbial Electrochemical Systems for Sustainable Biohydrogen Production: Surveying the Experiences from a Start-Up Viewpoint. Renew. Sust. Energ. Rev.70, 589–597. 10.1016/j.rser.2016.11.107
74
KumarR.SinghL.WahidZ. A. (2015). “Role of Microorganisms in Microbial Fuel Cells for Bioelectricity Production,” in Microbial Factories, Biofuels, Waste Treatment. Editor KaliaV. P.. 1st ed. (India: Springer Press), 1, 135–154. 10.1007/978-81-322-2598-0_9
75
KumarR.SinghL.ZularisamA. W. (2016). Exoelectrogens: Recent Advances in Molecular Drivers Involved in Extracellular Electron Transfer and Strategies Used to Improve it for Microbial Fuel Cell Applications. Renew. Sust. Energ. Rev.56, 1322–1336. 10.1016/j.rser.2015.12.029
76
KumarR.SinghL.ZularisamA. W.HaiF. I. (2018). Microbial Fuel Cell Is Emerging as a Versatile Technology: a Review on its Possible Applications, Challenges and Strategies to Improve the Performances. Int. J. Energ. Res42 (2), 369–394. 10.1002/er.3780
77
LeeJ.KimK.-H.KwonE. E. (2017). Biochar as a Catalyst. Renew. Sust. Energ. Rev.77, 70–79. 10.1016/j.rser.2017.04.002
78
LeeW. S.ChuaA. S. M.YeohH. K.NgohG. C. (2014). A Review of the Production and Applications of Waste-Derived Volatile Fatty Acids. Chem. Eng. J.235, 83–99. 10.1016/j.cej.2013.09.002
79
LeicesterD.AmezagaJ.HeidrichE. (2020). Is Bioelectrochemical Energy Production from Wastewater a Reality? Identifying and Standardising the Progress Made in Scaling up Microbial Electrolysis Cells. Renew. Sust. Energ. Rev.133, 110279. 10.1016/j.rser.2020.110279
80
LiW.-W.YuH.-Q.HeZ. (2014). Towards Sustainable Wastewater Treatment by Using Microbial Fuel Cells-Centered Technologies. Energy Environ. Sci.7 (3), 911–924. 10.1039/c3ee43106a
81
LiangP.DuanR.JiangY.ZhangX.QiuY.HuangX. (2018). One-year Operation of 1000-L Modularized Microbial Fuel Cell for Municipal Wastewater Treatment. Water Res.141, 1–8. 10.1016/j.watres.2018.04.066
82
LiuR.TursunH.HouX.OdeyF.LiY.WangX.et al (2017). Microbial Community Dynamics in a Pilot-Scale MFC-AA/O System Treating Domestic Sewage. Bioresour. Tech.241, 439–447. 10.1016/j.biortech.2017.05.122
83
LiuW.-f.ChengS.-a. (2014). Microbial Fuel Cells for Energy Production from Wastewaters: the Way toward Practical Application. J. Zhejiang Univ. Sci. A.1511, 841–861. 10.1631/jzus.A1400277
84
LoganB. E. (2015). Microbial Fuel Cell and Reverse Electro-Dialysis Technologies for Renewable Power Generation from Biomass and Salinity Gradients. Pennsylvania: Presentation on Penn State University, Engineering Energy & Environmental Institute, 1–93. Available online: https://acee.princeton.edu/wp-content/uploads/2014/03/Logan-PennState-Short.pdf (Accessed August 10, 2021).
85
LoganB. E. (2007). Microbial Fuel Cells. 1st ed. Hoboken, New Jersey, USA: Wiley Press. 10.1002/9780470258590Microbial Fuel Cells
86
LogroñoW.RamírezG.RecaldeC.EcheverríaM.CunachiA. (2015). Bioelectricity Generation from Vegetables and Fruits Wastes by Using Single Chamber Microbial Fuel Cells with High Andean Soils. Energ. Proced.75, 2009–2014. 10.1016/j.egypro.2015.07.259
87
LosantosD.AliaguillaM.MolognoniD.GonzálezM.Bosch-JimenezP.SanchisGuisasolaBorràsS. A. E.et al (2021). Development and Optimization of a Bioelectrochemical System for Ammonium Recovery from Wastewater as Fertilizer. Clean. Eng. Tech.4, 100142. 10.1016/j.clet.2021.100142
88
LuM.ChenS.BabanovaS.PhadkeS.SalvacionM.MirhosseiniA.et al (2017). Long-term Performance of a 20-L Continuous Flow Microbial Fuel Cell for Treatment of Brewery Wastewater. J. Power Sourc.356, 274–287. 10.1016/j.jpowsour.2017.03.132
89
MartinucciE.PizzaF.PerrinoD.ColomboA.TrasattiS. P. M.Lazzarini BarnabeiA.et al (2015). Energy Balance and Microbial Fuel Cells Experimentation at Wastewater Treatment Plant Milano-Nosedo. Int. J. Hydrogen Energ.4042, 14683–14689. 10.1016/j.ijhydene.2015.08.100
90
MathuriyaA. S. (2014). Eco-Affectionate Face of Microbial Fuel Cells. Crit. Rev. Environ. Sci. Tech.44 (2), 97–153. 10.1080/10643389.2012.710445
91
MiranW.NawazM.JangJ.LeeD. S. (2016). Sustainable Electricity Generation by Biodegradation of Low-Cost Lemon Peel Biomass in a Dual Chamber Microbial Fuel Cell. Int. Biodeterioration Biodegradation106, 75–79. 10.1016/j.ibiod.2015.10.009
92
MohamedA.EwingT.LindemannS. R.FredricksonJ. K.BeyenalH. (2017). Autonomous Device for Evaluating the Field Performance of Microbial Fuel Cells in Remote Areas. J. Electrochem. Soc.164, 3H3030–H3036. 10.1149/2.0041703jes
93
MohamedA.ZmudaH. M.HaP. T.CoatsE. R.BeyenalH. (2021). Large-scale Switchable Potentiostatically Controlled/microbial Fuel Cell Bioelectrochemical Wastewater Treatment System. Bioelectrochemistry138, 107724. 10.1016/j.bioelechem.2020.107724
94
MolinoA.NannaF.IovaneP. (2015). Low Pressure Biomethane Production by Anaerobic Digestion (AD) for the Smart Grid Injection. Fuel154, 319–325. 10.1016/j.fuel.2015.03.054
95
MolognoniD.ChiarollaS.CecconetD.CallegariA.CapodaglioA. G. (2018). Industrial Wastewater Treatment with a Bioelectrochemical Process: Assessment of Depuration Efficiency and Energy Production. Water Sci. Tech.77 (1), 134–144. 10.2166/wst.2017.532
96
MolognoniD.PuigS.BalaguerM. D.CapodaglioA. G.CallegariA.ColprimJ. (2016). Multiparametric Control for Enhanced Biofilm Selection in Microbial Fuel Cells. J. Chem. Technol. Biotechnol.91 (6), 1720–1727. 10.1002/jctb.4760
97
MolognoniD.PuigS.BalaguerM. D.LiberaleA.CapodaglioA. G.CallegariA.et al (2014). Reducing Start-Up Time and Minimizing Energy Losses of Microbial Fuel Cells Using Maximum Power Point Tracking Strategy. J. Power Sourc.269, 403–411. 10.1016/j.jpowsour.2014.07.033
98
MoqsudM. A.YoshitakeJ.BushraQ. S.HyodoM.OmineK.StrikD. (2015). Compost in Plant Microbial Fuel Cell for Bioelectricity Generation. Waste Manag.36, 63–69. 10.1016/j.wasman.2014.11.004
99
MorunoF. L.RubioJ. E.AtanassovP.CerratoJ. M.ArgesC. G.SantoroC. (2018). Microbial Desalination Cell with Sulfonated Sodium Poly(ether Ether Ketone) as Cation Exchange Membranes for Enhancing Power Generation and Salt Reduction. Bioelectrochemistry121, 176–184. 10.1016/j.bioelechem.2018.02.004
100
MutumaB. K.SyllaN. F.BubuA.NdiayeN. M.SantoroC.BrilloniA.et al (2021). Valorization of Biodigestor Plant Waste in Electrodes for Supercapacitors and Microbial Fuel Cells. Electrochimica Acta391, 138960. 10.1016/j.electacta.2021.138960
101
NancharaiahY. V.Venkata MohanS.LensP. N. L. (2015). Metals Removal and Recovery in Bioelectrochemical Systems: A Review. Bioresour. Tech.195, 102–114. 10.1016/j.biortech.2015.06.058
102
NarkhedeM. S.ChatterjiS.GhoshS. (2013). “Optimal Dispatch of Renewable Energy Sources in Smart Grid Pertinent to Virtual Power Plant,” in Proceedings of the 2013 International Conference on Green Computing, Communication and Conservation of Energy -ICGCE, RMD Engineering College (Tamil Nadu, IndiaUSA: IEEE Press), 525–529. 10.1109/ICGCE.2013.6823493
103
OliotM.GalierS.Roux de BalmannH.BergelA. (2016). Ion Transport in Microbial Fuel Cells: Key Roles, Theory and Critical Review. Appl. Energ.183, 1682–1704. 10.1016/j.apenergy.2016.09.043
104
Ortiz-MartínezV. M.Salar-GarcíaM. J.de los RíosA. P.Hernández-FernándezF. J.EgeaJ. A.LozanoL. J. (2015). Developments in Microbial Fuel Cell Modeling. Chem. Eng. J.271, 50–60. 10.1016/j.cej.2015.02.076
105
OsórioG. J.Shafie-khahM.LotfiM.Ferreira-SilvaB. J. M.CatalãoJ. P. S. (2019). Demand-Side Management of Smart Distribution Grids Incorporating Renewable Energy Sources. Energies12 (1), 143. 10.3390/en12010143
106
PandeyP.ShindeV. N.DeopurkarR. L.KaleS. P.PatilS. A.PantD. (2016). Recent Advances in the Use of Different Substrates in Microbial Fuel Cells toward Wastewater Treatment and Simultaneous Energy Recovery. Appl. Energ.168, 706–723. 10.1016/j.apenergy.2016.01.056
107
PantD.SinghA.Van BogaertG.GallegoY. A.DielsL.VanbroekhovenK. (2011). An Introduction to the Life Cycle Assessment (LCA) of Bioelectrochemical Systems (BES) for Sustainable Energy and Product Generation: Relevance and Key Aspects. Renew. Sust. Energ. Rev.15 (2), 1305–1313. 10.1016/j.rser.2010.10.005
108
ParkY.NguyenV. K.ParkS.YuJ.LeeT. (2018). Effects of Anode Spacing and Flow Rate on Energy Recovery of Flat-Panel Air-Cathode Microbial Fuel Cells Using Domestic Wastewater. Bioresour. Tech.258, 57–63. 10.1016/j.biortech.2018.02.097
109
ParkY.ParkS.NguyenV. K.YuJ.TorresC. I.RittmannB. E.et al (2017). Complete Nitrogen Removal by Simultaneous Nitrification and Denitrification in Flat-Panel Air-Cathode Microbial Fuel Cells Treating Domestic Wastewater. Chem. Eng. J.316, 673–679. 10.1016/j.cej.2017.02.005
110
PasternakG.GreenmanJ.IeropoulosI. (2017). Self-powered, Autonomous Biological Oxygen Demand Biosensor for Online Water Quality Monitoring. Sensors Actuators B: Chem.244, 815–822. 10.1016/j.snb.2017.01.019
111
PathanM. I.AlOwaifeerM.AlMuhainiM.DjokicS. Z. (2020). Reliability Evaluation of Smart Distribution Grids with Renewable Energy Sources and Demand Side Management. Arab J. Sci. Eng.45 (8), 6347–6360. 10.1007/s13369-020-04477-8
112
Pepe SciarriaT.MerlinoG.ScagliaB.D'EpifanioA.MecheriB.BorinS.et al (2015). Electricity Generation Using white and Red Wine Lees in Air Cathode Microbial Fuel Cells. J. Power Sourc.274, 393–399. 10.1016/j.jpowsour.2014.10.050
113
PhilamoreH.RossiterJ.StinchcombeA.IeropoulosI. (2015). “Row-bot: An Energetically Autonomous Artificial Water Boatman,” in IEEE/RSJ International Conference on Intelligent Robots and Systems (IROS) (Hamburg, Germany, 15667011. 10.1109/IROS.2015.7353924
114
PicioreanuC.HeadI. M.KaturiK. P.van LoosdrechtM. C. M.ScottK. (2007). A Computational Model for Biofilm-Based Microbial Fuel Cells. Water Res.41 (13), 2921–2940. 10.1016/j.watres.2007.04.009
115
PoliF.SeriJ.SantoroC.SoaviF. (2020). Boosting Microbial Fuel Cell Performance by Combining with an External Supercapacitor: An Electrochemical Study. ChemElectroChem7, 893–903. 10.1002/celc.201901876
116
PremierG. C.KimJ. R.MichieI.DinsdaleR. M.GuwyA. J. (2011). Automatic Control of Load Increases Power and Efficiency in a Microbial Fuel Cell. J. Power Sourc.1964, 2013–2019. 10.1016/j.jpowsour.2010.09.071
117
RamanaiahS. V.CordasC. M.MatiasS. C.ReddyM. V.LeitãoJ. H.FonsecaL. P. (2021). Bioelectricity Generation Using Long-Term Operated Biocathode: RFLP Based Microbial Diversity Analysis. Biotechnol. Rep.32, e00693. 10.1016/j.btre.2021.e00693
118
Ramírez-MorenoM.Esteve-NúñezA.OrtizJ. M. (2021). Desalination of Brackish Water Using a Microbial Desalination Cell: Analysis of the Electrochemical Behaviour. Electrochimica Acta388, 138570. 10.1016/j.electacta.2021.138570
119
Ramírez-MorenoM.RodenasP.AliaguillaM.Bosch-JimenezP.BorràsE.ZamoraP.et al (2019). Comparative Performance of Microbial Desalination Cells Using Air Diffusion and Liquid Cathode Reactions: Study of the Salt Removal and Desalination Efficiency. Front. Energ. Res.7, 135. 10.3389/fenrg.2019.00135
120
Ramírez-VargasC. A.AriasC. A.CarvalhoP.ZhangL.Esteve-NúñezA.BrixH. (2019). Electroactive Biofilm-Based Constructed Wetland (EABB-CW): A Mesocosm-Scale Test of an Innovative Setup for Wastewater Treatment. Sci. Total Environ.659, 796–806. 10.1016/j.scitotenv.2018.12.432
121
ReimersC. E.GirguisStecherP. H. A.StecherH. A.TenderL. M.RyckelynckN.WhalingP. (2006). Microbial Fuel Cell Energy from an Ocean Cold Seep. Geobiology4, 123–136. 10.1111/j.1472-4669.2006.00071.x
122
RenH.LeeH.-S.ChaeJ. (2012). Miniaturizing Microbial Fuel Cells for Potential Portable Power Sources: Promises and Challenges. Microfluid Nanofluid13 (3), 353–381. 10.1007/s10404-012-0986-7
123
Rodríguez-AlegreR.Ceballos-EscaleraA.MolognoniD.Bosch-JimenezP.GalíD.LiconE.et al (2019). Integration of Membrane Contactors and Bioelectrochemical Systems for CO2 Conversion to CH4. Energies12 (3), 361. 10.3390/en12030361
124
Rojas-CarbonellS.SantoroC.SerovA.AtanassovP. (2017). Transition Metal-Nitrogen-Carbon Catalysts for Oxygen Reduction Reaction in Neutral Electrolyte. Electrochemistry Commun.75, 38–42. 10.1016/j.elecom.2016.12.011
125
RossiR.JonesD.MyungJ.ZikmundE.YangW.GallegoY. A.et al (2019). Evaluating a Multi-Panel Air Cathode through Electrochemical and Biotic Tests. Water Res.148, 51–59. 10.1016/j.watres.2018.10.022
126
Salar GarciaM. J.SantoroC.KodaliM.SerovA.ArtyushkovaK.AtanassovP.et al (2019). Iron-streptomycin Derived Catalyst for Efficient Oxygen Reduction Reaction in Ceramic Microbial Fuel Cells Operating with Urine. J. Power Sourc.425, 50–59. 10.1016/j.jpowsour.2019.03.052
127
SantiniM.GuilizzoniM.LorenziM.AtanassovP.MarsiliE.Fest-SantiniS.et al (2015). Three-dimensional X-ray Microcomputed Tomography of Carbonates and Biofilm on Operated Cathode in Single Chamber Microbial Fuel Cell. Biointerphases10 (3), 031009. 10.1116/1.4930239
128
SantiniM.MarzoratiS.Fest-SantiniS.TrasattiS.CristianiP. (2017). Carbonate Scale Deactivating the Biocathode in a Microbial Fuel Cell. J. Power Sourc.356, 400–407. 10.1016/j.jpowsour.2017.02.088
129
SantoroC.ArbizzaniC.ErableB.IeropoulosI. (2017a). Microbial Fuel Cells: From Fundamentals to Applications. A Review. J. Power Sourc.356, 225–244. 10.1016/j.jpowsour.2017.03.109
130
SantoroC.ArtyushkovaK.GajdaI.BabanovaS.SerovA.AtanassovP.et al (2015c). Cathode Materials for Ceramic Based Microbial Fuel Cells (MFCs). Int. J. Hydrogen Energ.40 (42), 14706–14715. 10.1016/j.ijhydene.2015.07.054
131
SantoroC.BabanovaS.ArtyushkovaK.AtanassovP.GreenmanJ.CristianiP.et al (2014). The Effects of Wastewater Types on Power Generation and Phosphorus Removal of Microbial Fuel Cells (MFCs) with Activated Carbon (AC) Cathodes. Int. J. Hydrogen Energ.39 (36), 21796–21802. 10.1016/j.ijhydene.2014.09.167
132
SantoroC.BabanovaS.ArtyushkovaK.CornejoJ. A.IstaL.BretschgerO.et al (2015a). Influence of Anode Surface Chemistry on Microbial Fuel Cell Operation. Bioelectrochemistry106, 141–149. 10.1016/j.bioelechem.2015.05.002:A,
133
SantoroC.BabanovaS.CristianiP.ArtyushkovaK.AtanassovP.BergelA.et al (2021). How Comparable Are Microbial Electrochemical Systems Around the Globe? an Electrochemical and Microbiological Cross‐Laboratory Study. ChemSusChem14 (11), 2313–2330. 10.1002/cssc.202100294
134
SantoroC.GokhaleR.MecheriB.D'EpifanioA.LicocciaS.SerovA.et al (2017d). Design of Iron(II) Phthalocyanine-Derived Oxygen Reduction Electrocatalysts for High-Power-Density Microbial Fuel Cells. ChemSusChem16, 3243–3251. 10.1002/cssc.201700851
135
SantoroC.IeropoulosI.GreenmanJ.CristianiP.VadasT.MackayA.et al (2013b). Power Generation and Contaminant Removal in Single Chamber Microbial Fuel Cells (SCMFCs) Treating Human Urine. Int. J. Hydrogen Energ.38, 11543–11551. 10.1016/j.ijhydene.2013.02.070
136
SantoroC.KodaliM.HerreraS.SerovA.IeropoulosI.AtanassovP. (2018b). Power Generation in Microbial Fuel Cells Using Platinum Group Metal-free Cathode Catalyst: Effect of the Catalyst Loading on Performance and Costs. J. Power Sourc.378, 169–175. 10.1016/j.jpowsour.2017.12.017
137
SantoroC.KodaliM.KabirS.SoaviF.SerovA.AtanassovP. (2017b). Three-dimensional Graphene Nanosheets as Cathode Catalysts in Standard and Supercapacitive Microbial Fuel Cell. J. Power Sourc.356, 371–380. 10.1016/j.jpowsour.2017.03.135
138
SantoroC.LiB.CristianiSquadritoP. G.SquadritoG. (2013a). Power Generation of Microbial Fuel Cells (MFCs) with Low Cathodic Platinum Loading. Int. J. Hydrogen Energ.38 (1), 692–700. 10.1016/j.ijhydene.2012.05.104
139
SantoroC.Rojas-CarbonellS.AwaisR.GokhaleR.KodaliM.SerovA.et al (2018a). Influence of Platinum Group Metal-free Catalyst Synthesis on Microbial Fuel Cell Performance. J. Power Sourc.375, 11–20. 10.1016/j.jpowsour.2017.11.039
140
SantoroC.SerovA.ArtyushkovaK.AtanassovP. (2020). Platinum Group Metal-free Oxygen Reduction Electrocatalysts Used in Neutral Electrolytes for Bioelectrochemical Reactor Applications. Curr. Opin. Electrochemistry23, 106–113. 10.1016/j.coelec.2020.06.003
141
SantoroC.SerovA.GokhaleR.Rojas-CarbonellS.StarihaL.GordonJ.et al (2017c). A Family of Fe-N-C Oxygen Reduction Electrocatalysts for Microbial Fuel Cell (MFC) Application: Relationships between Surface Chemistry and Performances. Appl. Catal. B: Environ.205, 24–33. 10.1016/j.apcatb.2016.12.013
142
SantoroC.SerovA.Narvaez VillarrubiaC. W.StarihaS.BabanovaS.SchulerA. J.et al (2015b). Double-Chamber Microbial Fuel Cell with a Non-platinum-group Metal Fe-N-C Cathode Catalyst. ChemSusChem8, 828–834. 10.1002/cssc.201402570
143
SantoroC.SerovA.StarihaL.KodaliM.GordonJ.BabanovaS.et al (2016a). Iron Based Catalysts from Novel Low-Cost Organic Precursors for Enhanced Oxygen Reduction Reaction in Neutral media Microbial Fuel Cells. Energ. Environ. Sci.9, 2346–2353. 10.1039/c6ee01145d
144
SantoroC.SoaviF.ArbizzaniC.SerovA.KabirS.CarpenterK.et al (2016b). Co-generation of Hydrogen and Power/current Pulses from Supercapacitive MFCs Using Novel HER Iron-Based Catalysts. Electrochimica Acta220, 672–682. 10.1016/j.electacta.2016.10.154
145
SantoroC.TalarposhtiM. R.KodaliM.GokhaleR.SerovA.Merino-JimenezI.et al (2017e). Microbial Desalination Cells with Efficient Platinum-group-metal-free Cathode Catalysts. ChemElectroChem4 (12), 3322–3330. 10.1002/celc.201700626
146
SarataleG. D.SarataleR. G.ShahidM. K.ZhenG.KumarG.ShinH.-S.et al (2017). A Comprehensive Overview on Electro-Active Biofilms, Role of Exo-Electrogens and Their Microbial Niches in Microbial Fuel Cells (MFCs). Chemosphere178, 534–547. 10.1016/j.chemosphere.2017.03.066
147
SawantS.HanT.ChoM. (2017). Metal-Free Carbon-Based Materials: Promising Electrocatalysts for Oxygen Reduction Reaction in Microbial Fuel Cells. Ijms18, 125. 10.3390/ijms18010025
148
SeelamJ. S.PantD.PatilS. A.KapadnisB. P. (2015). “Biological Electricity Production from Wastes and Wastewaters,” in Microbial Factories, Biofuels, Waste Treatment. Editor KaliaV. P.. 1st ed. (India: Springer Press), 1, 155–183. 10.1007/978-81-322-2598-0_10
149
ShantaramA.BeyenalH.VeluchamyR. R. A.LewandowskiZ. (2005). Wireless Sensors Powered by Microbial Fuel Cells. Environ. Sci. Technol.39 (13), 5037–5042. 10.1021/es0480668
150
SharafO. Z.OrhanM. F. (2014). An Overview of Fuel Cell Technology: Fundamentals and Applications. Renew. Sust. Energ. Rev.32, 810–853. 10.1016/j.rser.2014.01.012
151
SharmaY.LiB. (2010). Optimizing Energy Harvest in Wastewater Treatment by Combining Anaerobic Hydrogen Producing Biofermentor (HPB) and Microbial Fuel Cell (MFC). Int. J. Hydrogen Energ.35 (8), 3789–3797. 10.1016/j.ijhydene.2010.01.042
152
SoaviF.SantoroC. (2020). Supercapacitive Operational Mode in Microbial Fuel Cell. Curr. Opin. Electrochemistry22, 1–8. 10.1016/j.coelec.2020.03.009
153
SonawaneJ. M.MarsiliE.Chandra GhoshP. (2014). Treatment of Domestic and Distillery Wastewater in High Surface Microbial Fuel Cells. Int. J. Hydrogen Energ.39 (36), 21819–21827. 10.1016/j.ijhydene.2014.07.085
154
SonawaneJ. M.YadavA.GhoshP. C.AdelojuS. B. (2017). Recent Advances in the Development and Utilization of Modern Anode Materials for High Performance Microbial Fuel Cells. Biosens. Bioelectron.90, 558–576. 10.1016/j.bios.2016.10.014
155
SpellmanF. K. (2014). Handbook of Water and Wastewater Treatment Plant Operations. 3rd ed.Boka Raton, Florida, USA: CRC Press.
156
StollZ. A.MaZ.TrivediC. B.SpearJ. R.XuP. (2016). Sacrificing Power for More Cost-Effective Treatment: A Techno-Economic Approach for Engineering Microbial Fuel Cells. Chemosphere161, 10–18. 10.1016/j.chemosphere.2016.06.072
157
SureS.AcklandM. L.TorrieroA. A. J.AdholeyaA.KocharM. (2016). Microbial Nanowires: an Electrifying Tale. Microbiology162 (12), 2017–2028. 10.1099/mic.0.000382
158
TanW. H.ChongS.FangH.-W.PanK.-L.MohamadM.LimJ. W.et al (2021). Microbial Fuel Cell Technology-A Critical Review on Scale-Up Issues. Processes96, 985. 10.3390/pr9060985
159
TenderL. M.GrayS. A.GrovemanE.LowyD. A.KauffmanP.MelhadoJ.et al (2008). The First Demonstration of a Microbial Fuel Cell as a Viable Power Supply: Powering a Meteorological Buoy. J. Power Sourc.179 (2), 571–575. 10.1016/j.jpowsour.2007.12.123
160
TharaliA. D.SainN.OsborneW. J. (2016). Microbial Fuel Cells in Bioelectricity Production. Front. Life Sci.9 (4), 252–266. 10.1080/21553769.2016.1230787
161
TommasiT.LombardelliG. (2017). Energy Sustainability of Microbial Fuel Cell (MFC): A Case Study. J. Power Sourc.356, 438–447. 10.1016/j.jpowsour.2017.03.122
162
TraperoJ. R.HorcajadaL.LinaresJ. J.LobatoJ. (2017). Is Microbial Fuel Cell Technology Ready? an Economic Answer towards Industrial Commercialization. Appl. Energ.185, 698–707. 10.1016/j.apenergy.2016.10.109
163
UllahK.AliS.KhanT. A.KhanI.JanS.ShahI. A.et al (2020). An Optimal Energy Optimization Strategy for Smart Grid Integrated with Renewable Energy Sources and Demand Response Programs. Energies1321, 5718. 10.3390/en13215718
164
UllahK.HafeezG.KhanI.JanS.JavaidN. (2021). A Multi-Objective Energy Optimization in Smart Grid with High Penetration of Renewable Energy Sources. Appl. Energ.299, 117104. 10.1016/j.apenergy.2021.117104
165
Valladares LinaresR.Domínguez-MaldonadoJ.Rodríguez-LealE.PatrónG.Castillo-HernándezA.MirandaA.et al (2019). Scale up of Microbial Fuel Cell Stack System for Residential Wastewater Treatment in Continuous Mode Operation. Water112, 217. 10.3390/w11020217
166
Vilajeliu-PonsA.BañerasL.PuigS.MolognoniD.Vilà-RoviraA.Hernández-del AmoE.et al (2016). External Resistances Applied to MFC Affect Core Microbiome and Swine Manure Treatment Efficiencies. PLoS ONE11 (10), e0164044. 10.1371/journal.pone.0164044
167
Von SperlingM. (2007). Biological Wastewater Treatment Series – Volume I: Wastewater Characteristics Treatment and Disposal. 1st ed. London, UK: IWA publishing.
168
WalterX. A.GreenmanJ.IeropoulosI. A. (2020c). Microbial Fuel Cells Directly Powering a Microcomputer. J. Power Sourc.446, 227328. 10.1016/j.jpowsour.2019.227328
169
WalterX. A.Merino-JiménezI.GreenmanJ.IeropoulosI. (2018). PEE POWER Urinal II - Urinal Scale-Up with Microbial Fuel Cell Scale-Down for Improved Lighting. J. Power Sourc.392, 150–158. 10.1016/j.jpowsour.2018.02.047
170
WalterX. A.SantoroC.GreenmanJ.IeropoulosI. A. (2020a). Scalability and Stacking of Self-Stratifying Microbial Fuel Cells Treating Urine. Bioelectrochemistry133, 107491. 10.1016/j.bioelechem.2020.107491
171
WalterX. A.SantoroC.GreenmanJ.IeropoulosI. (2020b). Scaling up Self-Stratifying Supercapacitive Microbial Fuel Cell. Int. J. Hydrogen Energ.45 (46), 25240–25248. 10.1016/j.ijhydene.2020.06.070
172
WangH.RenZ. J. (2013). A Comprehensive Review of Microbial Electrochemical Systems as a Platform Technology. Biotechnol. Adv.31 (8), 1796–1807. 10.1016/j.biotechadv.2013.10.001
173
WangH.RenZ. J. (2014). Bioelectrochemical Metal Recovery from Wastewater: A Review. Water Res.66, 219–232. 10.1016/j.watres.2014.08.013
174
WangZ.MaJ.XuY.YuH.WuZ. (2013). Power Production from Different Types of Sewage Sludge Using Microbial Fuel Cells: A Comparative Study with Energetic and Microbiological Perspectives. J. Power Sourc.235, 280–288. 10.1016/j.jpowsour.2013.02.033
175
WeiL.YiC.YunJ. (2021). Energy Drive and Management of Smart Grids with High Penetration of Renewable Sources of Wind Unit and Solar Panel. Int. J. Electr. Power Energ. Syst.129, 106846. 10.1016/j.ijepes.2021.106846
176
XuL.ZhaoY.DohertyL.HuY.HaoX. (2016). The Integrated Processes for Wastewater Treatment Based on the Principle of Microbial Fuel Cells: A Review. Crit. Rev. Environ. Sci. Tech.46 (1), 60–91. 10.1080/10643389.2015.1061884
177
YongX.-Y.ShiD.-Y.ChenY.-L.JiaoF.LinX.ZhouJ.et al (2014). Enhancement of Bioelectricity Generation by Manipulation of the Electron Shuttles Synthesis Pathway in Microbial Fuel Cells. Bioresour. Tech.152, 220–224. 10.1016/j.biortech.2013.10.086
178
YouJ.GreenmanJ.IeropoulosI. A. (2021). Microbial Fuel Cells in the House: A Study on Real Household Wastewater Samples for Treatment and Power. Sust. Energ. Tech. Assessments48, 101618. 10.1016/j.seta.2021.101618
179
YouJ.RimbuG. A.WallisL.GreenmanJ.IeropoulosI. (2019). Living Architecture: Toward Energy Generating Buildings Powered by Microbial Fuel Cells. Front. Energ. Res.7, 94. 10.3389/fenrg.2019.00094
180
YuF.WangC.MaJ. (2016). Applications of Graphene-Modified Electrodes in Microbial Fuel Cells. Materials910, 807. 10.3390/ma9100807
181
ZengY.ChooY. F.KimB.-H.WuP. (2010). Modelling and Simulation of Two-Chamber Microbial Fuel Cell. J. Power Sourc.195 (1), 79–89. 10.1016/j.jpowsour.2009.06.101
182
ZhaoQ.YuH.ZhangW.KabuteyF. T.JiangJ.ZhangY.et al (2017). Microbial Fuel Cell with High Content Solid Wastes as Substrates: a Review. Front. Environ. Sci. Eng.11, 213. 10.1007/s11783-017-0918-6
Summary
Keywords
microbial fuel cells, power plant, residential/urban wastewater treatment, smart grid, techno-economic feasibility study
Citation
Tsekouras GJ, Deligianni PM, Kanellos FD, Kontargyri VT, Kontaxis PA, Manousakis NM and Elias CN (2022) Microbial Fuel Cell for Wastewater Treatment as Power Plant in Smart Grids: Utopia or Reality?. Front. Energy Res. 10:843768. doi: 10.3389/fenrg.2022.843768
Received
26 December 2021
Accepted
14 March 2022
Published
14 April 2022
Volume
10 - 2022
Edited by
Pierangela Cristiani, Ricerca Sul Sistema Energetico, Italy
Reviewed by
Kuppam Chandrasekhar, Kyungpook National University, South Korea
Andrea G. Capodaglio, University of Pavia, Italy
Updates
Copyright
© 2022 Tsekouras, Deligianni, Kanellos, Kontargyri, Kontaxis, Manousakis and Elias.
This is an open-access article distributed under the terms of the Creative Commons Attribution License (CC BY). The use, distribution or reproduction in other forums is permitted, provided the original author(s) and the copyright owner(s) are credited and that the original publication in this journal is cited, in accordance with accepted academic practice. No use, distribution or reproduction is permitted which does not comply with these terms.
*Correspondence: George J. Tsekouras, gtsekouras@uniwa.gr
This article was submitted to Smart Grids, a section of the journal Frontiers in Energy Research
Disclaimer
All claims expressed in this article are solely those of the authors and do not necessarily represent those of their affiliated organizations, or those of the publisher, the editors and the reviewers. Any product that may be evaluated in this article or claim that may be made by its manufacturer is not guaranteed or endorsed by the publisher.