 Stavros Michailos
 Jon Gibbins
- Energy 2050, Department of Mechanical Engineering, Faculty of Engineering, The University of Sheffield, Sheffield, United Kingdom
The principal purpose of this study is to examine the changes in process conditions that might be needed to achieve up to 99% capture levels in amine post-combustion capture (PCC) plants for combined cycle gas turbine (CCGT) flue gases. This information is of interest since, while 95% capture is adequate for current market and regulatory conditions, net zero fossil emissions (99% capture for a CCGT plant) will be required to deliver global climate mitigation targets and is increasingly a target for national climate policies. The conventionally-configured plant in the study is based on FEED studies carried out by Bechtel Corporation and uses MEA at 35% w/w. Performance modelling is undertaken using the Aspen Plus CCSI MEA Steady State Model. The results show that efficient operation at higher capture levels appears to be feasible with minimal adjustments to the plant configuration, provided that the absorber has a sufficient packing height and the stripper is capable of operation at pressures above 2 bar. The study primarily focuses on operation at low lean loadings (0.09–0.15 molCO2/molMEA) and correspondingly low L/G ratios (<1 by mass), the combination of which, in principle, can give a higher rich loading for a given capture level and packing height and consequently reduce energy consumption. However, for a given capture level, there is a minimum absorber packing height below which a near-optimal rich loading cannot be achieved for any lean loading and L/G ratio. For example, at a lean loading of 0.12 molCO2/molMEA, an absorber packing height of approximately 24 m is required for 99% capture with a minimal increase in specific energy requirements (3.77 GJ/tCO2 at 99% capture vs. 3.50 GJ/tCO2 at 95% capture). A stripper pressure of 2.4 bar is also found to be necessary to achieve this lean loading level without excessive energy requirements. The effect of varying lean loading at three constant rich loading levels is reported in detail, as are the effect of rich loading at constant lean loading and the effect of pressure on stripper performance and energy requirements. The study also examines the effects of cooling and intercooling at elevated capture levels. A simple analysis of break-even operating costs suggests that capture levels higher than the 95% envisaged in current United Kingdom guidance, to further reduce CO2 emissions costs for CCGT + PCC, might be attractive if carbon dioxide removal from air is the alternative.
1 Introduction
The Sixth Assessment Report of the Intergovernmental Panel on Climate Change (IPCC, 2021) identifies a need for global net-zero CO2 emissions by around 2050, almost certainly followed by a period of global net-negative CO2 emissions, if global warming is to be limited to 1.5°. This implies high capture levels from all CO2 emission sources fitted with CCS, up to a level where the marginal cost of capture and storage is equal to the cost of removal of an equivalent amount of CO2 from the atmosphere, with equally permanent storage. For combustion applications using air and emitting the flue gases into the atmosphere, post-combustion capture (PCC) could therefore potentially be required to operate at a capture level where an amount equivalent to all of the fossil CO2 added to the air is removed and the flue gases leave with only the same amount of CO2 contained in the original air, so 99% capture or above. But a capture level of 85–90% has been widely applied in previous PCC applications and studies (e.g., see Brandl et al., 2021, for a history of capture levels).
With a net zero, natural gas as well as coal power plants will require CCS, despite natural gas’s lower specific CO2 emissions. PCC on conventional combined cycle gas turbine (CCGT) power plants offers comparable costs and performance to other natural gas-fired power generation options (Wood for BEIS, 2018). However, PCC test plants and design approaches have, primarily been developed for the capture from coal flue gases, with a much higher CO2 concentration (∼12–15%v/v for coal power plants vs. ∼4%v/v for CCGT).
Current design for 95% capture average levels, including during start-up and shut-down, is recommended in recent United Kingdom BAT Guidance (EA, 2021), based on a review of best available technologies (BAT) for PCC (Gibbins and Lucquiaud, 2021). Examples of commercial solvent suppliers looking at elevated capture levels include:
a) The Econamine FG process has been reported to operate at capture levels of up to 95% of several flue gases for based on 30% w/w/MEA (Khambaty et al., 2003), but full details were not provided.
b) Hirata et al. (2020) investigated the performance of KM CDR Process™ (developed by Mitsubishi) for near-zero emission cases on a coal flue gas, i.e. up to 99.5% capture, using process simulation. It was concluded that 99.5% is feasible, with an increase in the CO2 capture cost of 3% compared to 90% capture; again, process modification details are incomplete.
Examples of high capture level studies without commercial secrecy constraints also exist; selected examples are briefly discussed below.
a) Feron et al. (2019) carried out a simulation study on the techno-economics of high capture rates for PCC coupled with both coal- and gas-fired plants using 30% w/w MEA. They demonstrated that, from a technical point of view, there is no limiting factor to achieving CO2-neutrality in a PCC plant, but a relatively high increase in specific reboiler duty (SRD) was observed for CCGT flue gases, from around 3.65 GJ/tCO2 at 95% capture to 4.4 GJ/tCO2 at 99% capture. They do not appear, however, to have systematically investigated the effect of lean loading or packing height on SRD at higher capture levels, and they used values that were considered optimal for 90% capture (apparently 0.2 molCO2/molMEA and 20 m of packing, although not explicitly stated).
b) Brandl et al. (2021) calculated the economic impact of high capture levels over a wide range of lean loadings (0.05–0.4 molCO2/molMEA) and appeared to conclude that a lean loading of 0.15 molCO2/molMEA is optimal for high capture levels, up to 99%, of CCGT flue gases. In the only detailed example shown, for 99% capture, the capital cost of the absorber (and by inference, the packing height) was increased significantly from the 95% value for a constant lean loading of 0.15 molCO2/molMEA, but any variations in other process parameters, e.g., L/G ratio, are not reported, nor is the sensitivity in packing height and energy requirements to lean loading and L/G ratio at 99% capture reported in detail.
c) Du et al. (2021) investigated the techno-economic feasibility of net-zero and net-negative scenarios for PCC on coal and CCGT power plants using MEA 30% w/w with capture levels up to 99.8% for the latter. A constant lean loading of 0.2 molCO2/molMEA was used for all cases, with the statement that “according to literature (Rezazadeh et al., 2015), the total energy consumption of the MEA-based CO2 capture process is about the same at lean loadings between 0.20 and 0.30 mol CO2/mol MEA.” Rezazadeh et al., however, examined only 90% of the captured cases and used Aspen Plus V.8.4 thermodynamics and kinetics. With this assumption that there was no reason to vary lean loading, Du et al. adjusted only the L/G ratio and packing height to achieve the required capture level. Relatively high SRD requirements (>4 GJ/tCO2) were reported for all capture levels from 90–99+% from CCGT flue gas, with some benefit observed for intercooling.
d) A test campaign (Shah et al., 2021) conducted by the Technology Centre Mongstad (TCM) included an examination of elevated CO2 capture levels over the range 95–99% using MEA at concentrations up to 38% w/w. Lean loadings were given only for a single condition from the elevated capture level tests (and no rich loadings), with 0.21 molCO2/molMEA reported as giving 97% capture with 24 m of absorber packing and an SRD of 3.7 GJ/tCO2.
The current study focuses on investigating the effects of all of the principal process variables, i.e. lean loading, liquid to gas ratio (L/G), packing height, and intercooling, on PCC performance on CCGT flue gases for capture levels up to 99%. In particular, the effect of varying the lean loading is examined in significant detail and the trends interpreted. The aim is not to calculate the theoretical costs of achieving higher capture rates but to present a fairly detailed assessment of modelling trends to inform and encourage the exploration, in future test programmes and plant design studies, of lower lean loadings than have typically been used to date.
2 Modelling Methods
2.1 Kårstø and Sherman FEED Studies
In 2009, Bechtel carried out a front-end engineering design (FEED) study for the Kårstø CO2 capture and compression plant project in Norway (Bechtel for Gassnova, 2009). The design considered a PCC plant, using MEA as the solvent at a 35% w/w concentration, attached to an existing 420 MW CCGT power plant. The PCC plant was designed to capture at least 85% of the CO2 contained in the flue gas emitted by the CCGT plant, giving an annual capture rate of just over 1 MtCO2/yr.
In 2021, Bechtel delivered a similar FEED study (Elliott et al., 2021a), funded by the US DOE, for a PCC plant that captures approximately 85% of the CO2 in a slipstream of 68% of the flue gas (an amount corresponding roughly to the flow at minimum stable generation) from a larger CCGT plant located in Sherman, Texas, United States, commissioned in 2014 and with a rated capacity of 758 MWe.
Similar to Kårstø, the Sherman design is based on using a low-cost generic solvent, i.e., MEA at 35% w/w. The flue gas from the HRSG is cooled from 92 to 51°C using a fogging system in the connecting duct; no direct contact cooler (DCC) is employed. Two identical absorbers of 11.8 m in diameter each with a packing height of 15 m (6 m upper bed; 9 m lower bed) operating in parallel are used to capture the CO2. Solvent is regenerated in a stripper of 6.67 m in diameter with a packing height of 20 m. In addition, a (20%) slip-stream of rich solvent is heated using heat from the CO2 compressor intercoolers, then flashed and the semi-lean solvent is sent back to the absorber between the upper and lower packing beds. The design of the equipment and the quantification of material and energy flows in the Bechtel FEED study have been established by means of simulation using ProMax®. Some of the main plant design parameters are presented in Table 1 and the predicted performance is shown in Table 2; more details can be found in the comprehensive FEED study for the Kårstø plant (Bechtel for Gassnova, 2009) and in (Elliott et al., 2021a); a full FEED study for the Sherman plant is also expected to be published in due course.
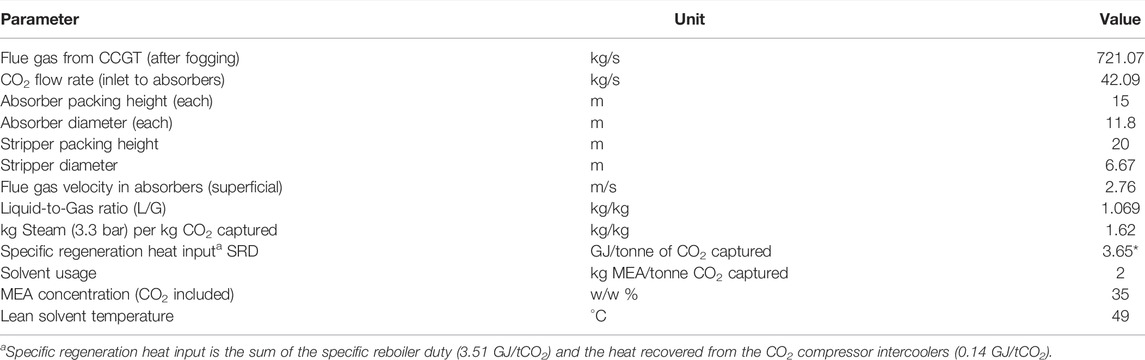
TABLE 1. Basic process values of the Sherman PCC FEED study (Elliott et al., 2021a).
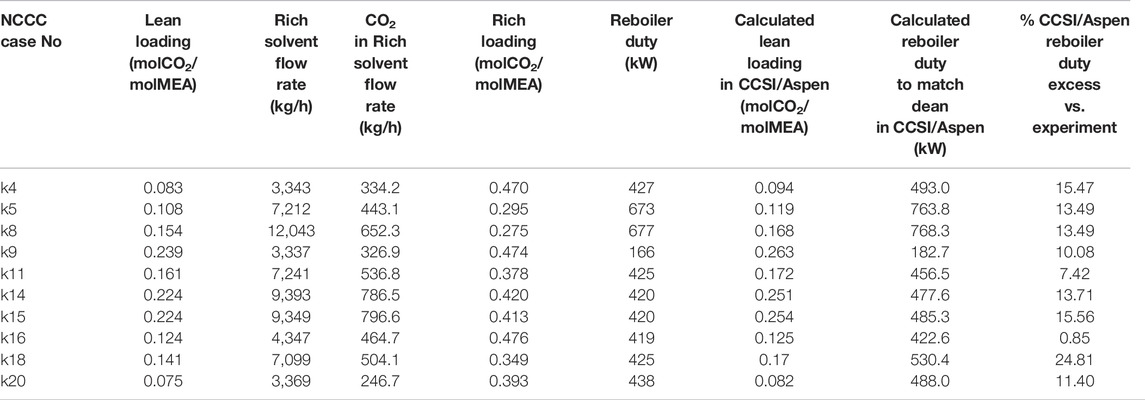
TABLE 2. Comparison of reboiler duties between NCCC experimental data and CCSI/Aspen V10 predictions for low lean loadings.
2.2 The CCSI/Aspen Software
We undertook process modelling in Aspen Plus V10 utilising the add-on MEA Steady State Model developed by the DOE Carbon Capture Simulation Initiative (CCSI) (Morgan et al., 2018; CCSI, 2021). The various developed user models contained in the library include physical property models for viscosity, density, surface tension, and diffusivity; the hydraulics model; the interfacial area model; and the reaction kinetics model. As part of the CCSI MEA Steady State Model development, these sub-models have been integrated into a complete process model, and tuned and validated against data from the PCC unit at the National Carbon Capture Center (NCCC) in Wilsonville, Alabama (Morgan et al., 2018). The hydrodynamic models developed in the CCSI/Aspen work include models for pressure drop and hold-up. The Billet and Schultes correlation was regressed with data from Tsai (2010) for MellapakPlus™ 250Y packing.
A key feature of our study is the consideration of lower lean loadings (<0.2) and L/G ratios (<1) than have usually been employed in previous PCC studies. This combination would not be appropriate for coal flue gases due to their higher CO2 concentration, because it would lead to excessive temperature bulges in the absorber, but it appears to be useful for CCGT flue gases, especially at higher capture levels. Fortunately, the experimental programme at NCCC used to support the development of the CCSI MEA models has been deliberately designed to cover a wide range of operating conditions, and a number of low-load data points are available for comparison with model predictions. As shown in Table 2, CCSI/Aspen predictions for stripper energy requirements with low lean loadings are generally higher than experimental values inferred from NCCC tests, suggesting that CCSI thermodynamic correlations, if anything, underestimate the ease of achieving low lean loadings.
A comparison between CCSI/Aspen model predictions and the results derived by Bechtel using ProMax® simulation software for the Sherman FEED study (using the same rich flash and semi-lean return arrangements) is shown in Table 3. The CCSI/Aspen kinetic model is observed to predict a lower rich loading than the ProMax® equilibrium model for a lean loading of 0.254 molCO2/molMEA and hence a higher SRD. Increased rich loadings are, however, predicted by the CCS/Aspen model at lean loadings of 0.2 molCO2/molMEA and below, with the absolute minimum SRD, which is only 2% higher than the ProMax® values, predicted for a lean loading of 0.12 molCO2/molMEA at 15 m packing height and 85% capture level.
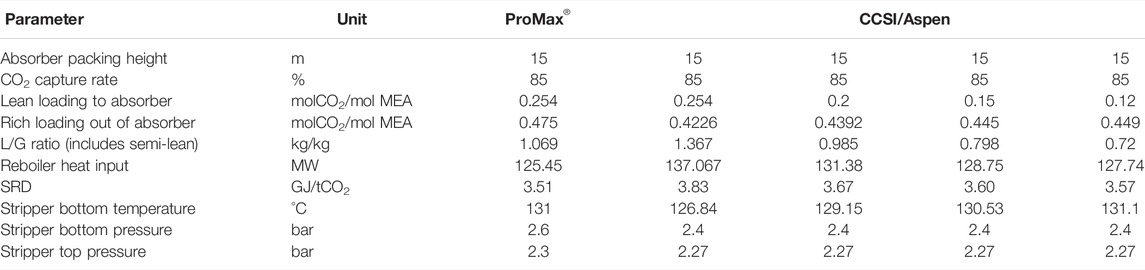
TABLE 3. Comparison of predicted SRD* values for Sherman configuration.
2.3 High Capture Study PCC Plant Configuration
The current study adopts the Sherman flue gas properties (flow and composition) and the twin absorber design with an internal diameter of 11.8 m, but absorber packing heights of 18 m (2 × 9 m) and 24 m (3 × 8 m) are used, as well as 15 m (9 m lower, 6 m upper), to allow for more efficient high CO2 capture. The stripper is identical to the Sherman design. Both the absorber and the stripper use Sulzer MellapakPlus™ 250Y structured packing (Sulzer, 2021). In order to identify optimal operation windows for capture levels above 90% up to 99%, the lean loading and the liquid to gas ratio have been varied within the ranges of 0.1–0.25 molCO2/molMEA and 0.6–1.1 kg/kg, respectively. Similar to Sherman, for all runs the MEA concentration is 35% w/w.
The process flow diagram, as implemented in Aspen, is depicted in Figure 1. The rich split is heated, as in the Sherman case, using heat recovered as LP steam at 126°C from the CO2 compressor intercoolers, but is then sent to the stripper with the other rich solvent instead of going to flash. This approach avoids the need for (perhaps infeasible, due to different packing bed dimensions) reinjection of the semi-lean solvent from the flash at a suitable point in the absorber while still allowing for the use of available waste heat and a lower rich flow to the cross-flow heat exchanger, and hence a hot rich stream at a higher temperature.
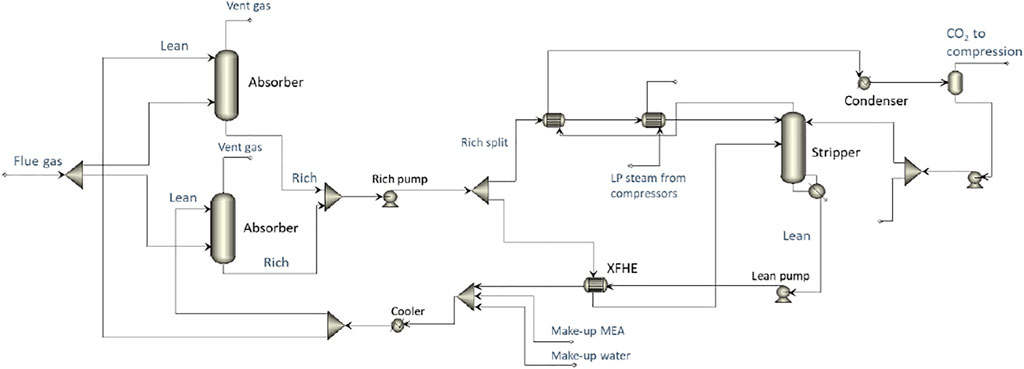
FIGURE 1. Process flow diagram as implemented in the Aspen Plus environment.
3 Modelling for High Capture Levels
3.1 Factors Affecting Stripper Performance
Stripper performance at low lean loadings (down to around 0.1 molCO2/molMEA for MEA) is the key factor in determining PCC performance at higher capture levels. Operation at low lean loadings has not been a priority for “traditional” PCC applications because capture levels have not usually been above 90% and also, when coal power plants were the main target application, because of the relatively high CO2 concentrations in the flue gas. With high-CO2 coal flue gases, relatively high L/G ratios (>1) are desirable to limit solvent temperature rise; this in turn implies a relatively low lean-to-rich loading interval and, hence, since the optimal rich loading is as high as reasonably possible to minimise energy requirements, a relatively high (typically >0.2 molCO2/molMEA) optimal lean loading.
For a given amount of CO2 captured and constant rich loading, lower lean loadings also increase specific energy consumption, as shown in Figure 2, which, for a capture level of 95% using the modified Sherman case (i.e., a fixed CO2 capture rate of 39.985 kg/s), reports calculated specific energy consumption for three rich loadings, 0.422, 0.446, and 0.463 molCO2/molMEA. These rich loading values have been selected from cases that will be presented in the following sections. For all rich loading levels in Figure 2, the increase in SRD is, however, relatively small for lean loadings down to an inflexion point at approximately 0.12 molCO2/molMEA, while below this a sharp increase is observed (and, as will be shown below, in practice the coupled absorber characteristics can lead to slight increases in rich loading in a full PCC system as lean loading is reduced).
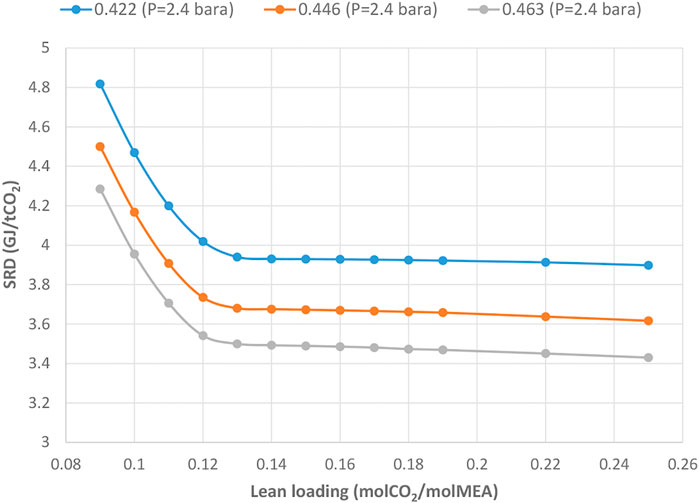
FIGURE 2. Effect of lean loading on the specific reboiler duty for different rich loadings of 0.422, 0.446, and 0.463 molCO2/molMEA (all at a constant CO2 capture level of 95%, corresponding to a capture rate of 39.985 kg/s).
The overall reason for this initial insensitivity to reduced lean loading can be inferred from Figure 3, showing stripper performance data for a constant capture level of 95% (corresponding to a capture rate of 39.985 kgCO2/s) and a constant rich load of 0.446 molCO2/molMEA. Under these conditions, the lean solvent flow (Figure 3A) reduces as the lean loading reduces. Less sensible heat is then required and, as far as the inflexion point, this offsets the increased energy demand due to the slight increase in the temperature of the CO2/vapour mixture leaving the top of the stripper (Figure 3B) and the slight increase in water vapour levels at the top of the stripper (TWV) (Figure 3C). At lean loadings below the inflexion point, however, the TWV rises more rapidly, and the additional latent heat of vaporisation required is not offset by a corresponding decrease in solvent flow; as a consequence, the overall SRD (Figure 3E) exhibits the rapid rise already noted.
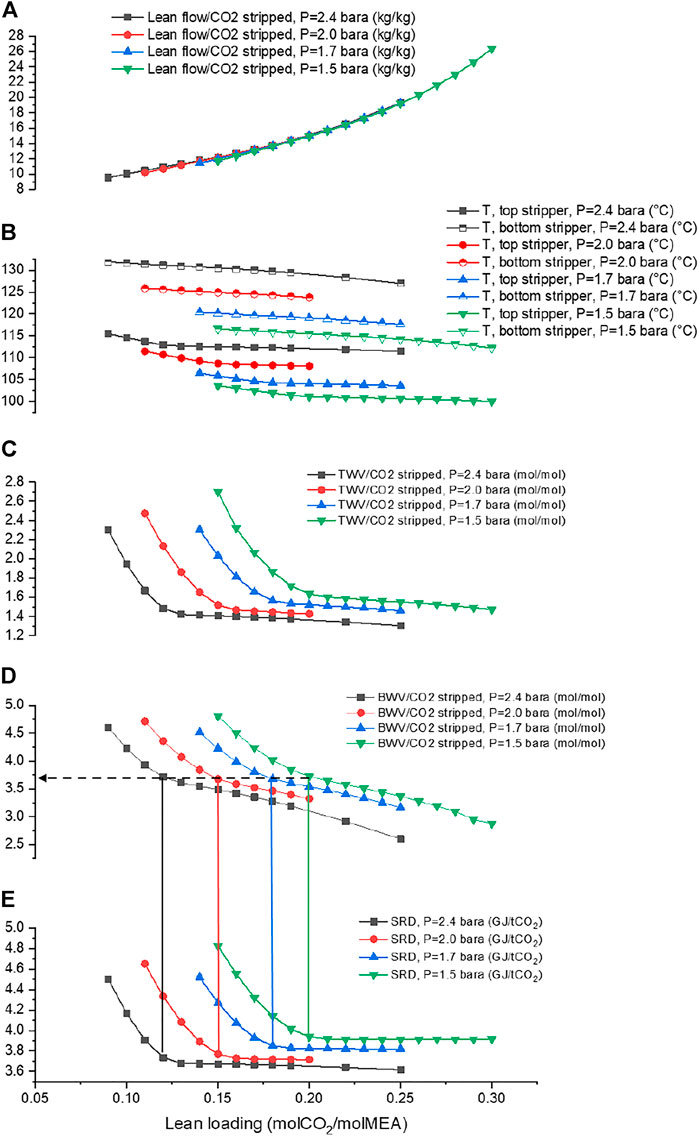
FIGURE 3. Thermodynamic investigation of the stripper for different operating pressures and as a function of the lean loading. Rich loading is 0.446 molCO2/molMEA with a constant capture level of 95%, corresponding to a capture rate of 39.985 kgCO2/s.
The reason for the rapid rise in TWV at the inflexion point is tentatively interpreted as being due to the inability of the stripper column to effectively use all of the available latent heat in the water vapour entering with the CO2 at the bottom (bottom water vapour, BWV) for heating the down coming solvent. This is a thermodynamic and not a kinetic limitation in these modelling results; the CCSI package uses an equilibrium model for the stripper. The Sherman PCC design deliberately provided what was assumed to be ample packing height (20 m), so a close approach to equilibrium is likely to be reasonable in this case. More detailed modelling and pilot tests for verification would be needed to explore the lower limits on stripper packing height.
Figure 3D shows the variation in BWV with lean loading. The BWV flow increases with reducing lean loading (and temperatures at the bottom of the stripper also increase), as required by the H2O/MEA/CO2 vapour/liquid equilibrium (VLE) in the stripper sump/reboiler, until it reaches a critical value (∼3.7 mol/mol CO2 stripped in this example). At lower BWV flows, the sensible heat that can be recovered by condensing rising water vapour in the stripper column is less than that which could be applied to heating the down coming solvent and releasing some of the CO2, with the balance of the heat required being supplied directly in the reboiler. Beyond the inflexion point, however, the heat available from the BWV is greater than required and the excess goes into unproductively raising the temperature and water vapour content (TWV) of the exiting CO2.
In line with the Sherman design, full PCC plant performance results in this paper are reported for a total reboiler pressure of 2.4 bar. Stripper performance results at lower reboiler pressures are, however, also shown in Figure 3. As can be seen, trends at reboiler pressures down to 1.5 bar follow those at 2.4 bar, although the VLE requirements mean there is a trend for lower temperatures and higher vapour/CO2 ratios as the total pressure falls. SRD values at all pressures exhibit an inflexion point that occurs at a similar BWV flow (Figure 3D) but, because of the VLE characteristics, at a lean loading that increases with decreasing pressure.
Operation at higher reboiler/stripper pressures is therefore advantageous for achieving very low lean loadings to allow higher capture levels and also slightly reduced SRD values generally. The drawbacks are expected to be higher levels of thermal degradation of the MEA and increased reclaiming requirements. As discussed in the Sherman FEED study, long-term testing would, however, be required to determine actual solvent management costs with the combination of elevated stripper pressures and semi-continuous reclaiming proposed, noting also that MEA replacement costs were reported as being relatively low (Elliott et al., 2021b) (for a MEA price of 1.15 $/kg, which corresponds to 2.3 $/tCO2 captured at the estimated solvent consumption rate of 2 kg MEA/tCO2).
The rich loading will also have a significant effect on the energetic performance of the PCC plant. The partial pressures of CO2 and water in equilibrium with the liquid in the stripper affect the total heat input required for water evaporation. Additionally, lower rich loadings are associated with increased L/G ratios and hence a higher sensible heat requirement. To examine the impact of rich loading alone, values were varied for three constant lean loadings of 0.25, 0.2, and 0.12 molCO2/molMEA. To do this, an effectively infinite absorber height was assumed and L/G ratios were increased from the value corresponding approximately to the thermodynamic limit (for the 4.19% v/v dry flue gas CO2 concentration in this study and CCSI thermodynamics) of 0.47 molCO2/molMEA to give lower rich loadings. Figure 4 depicts the effect of rich loading on the SRD; it can be seen that for all three cases, there is an almost linear relationship between the rich loading and the SRD. This increase arises because, as Figure 5 confirms, both L/G ratios, and hence sensible heat requirements, and also TWV levels increase approximately linearly with decreased rich loading. Similar trends are observed in the case of a stripper operated at 1.5 bar in which higher energy demands are observed for the same or similar (i.e., low) lean loadings (see Figure 4) and, as depicted in Figure 6 higher amounts of TWV are required compared to Figure 5, even though the lean loading is higher.
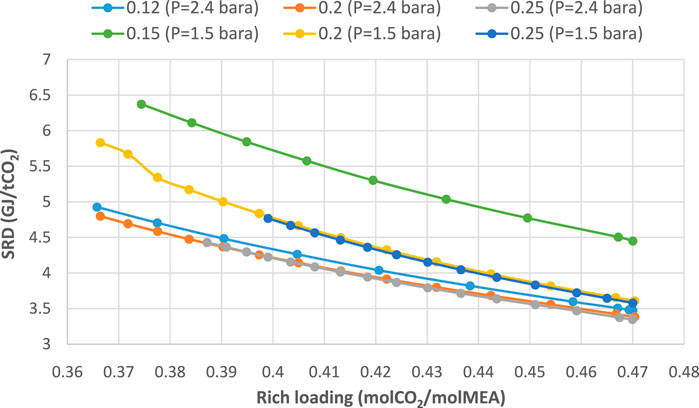
FIGURE 4. Effect of rich loading and stripper pressure on the specific reboiler duty for different lean loadings of 0.12 (only for stripper pressure of 2.4 bar), 0.15 (only for stripper pressure of 1.5 bar), 0.2, and 0.25 molCO2/molMEA.
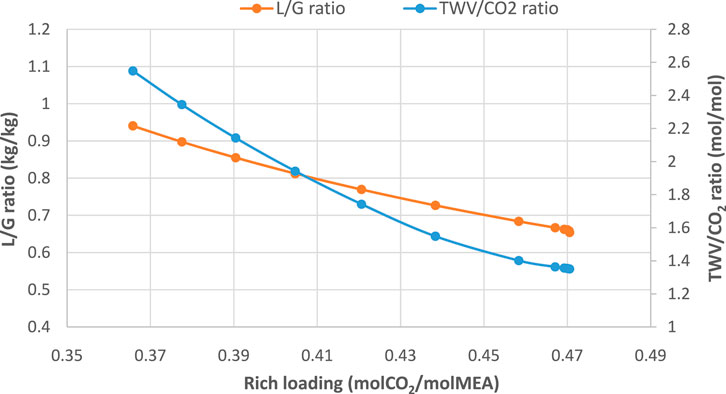
FIGURE 5. L/G ratio and TWV/CO2 ratio as a function of rich loading. Lean loading is 0.12 molCO2/molMEA and stripper pressure is 2.4 bar.
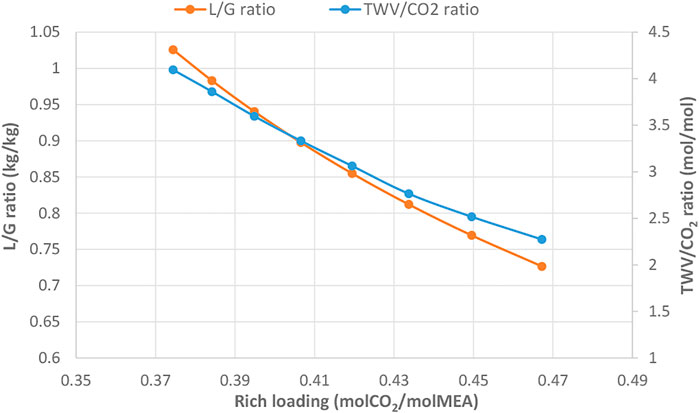
FIGURE 6. L/G ratio and TWV/CO2 ratio as a function of rich loading. Lean loading is 0.15 molCO2/molMEA and stripper pressure is 1.5 bar.
Based on the sensitivity of SRD to low and rich loadings shown above, it can be concluded that, at the design stripper pressure of 2.4 bar, changes in lean loading per se will not have a major effect, down to around 0.12 molCO2/molMEA. If, however, a change in lean loading (increase or decrease) results in a lower rich loading through its effect on processes in the absorber, then a significant increase in SRD can be expected.
3.2 Effect of Lean Loading and Absorber Packing Height at Varying Capture Levels
Figure 7 shows the effect on the SRD of varying the lean loading at discrete 0.01 molCO2/molMEA intervals for capture levels of 90%, 95%, 96%, 97%, 98%, and 99% and for absorber packing heights of 15 m (assumed to be two beds, 6 and 9 m), 18 m (two beds, 9 m each), and 24 m (three beds, 8 m each). Detailed results can be found in the Supplementary Material.
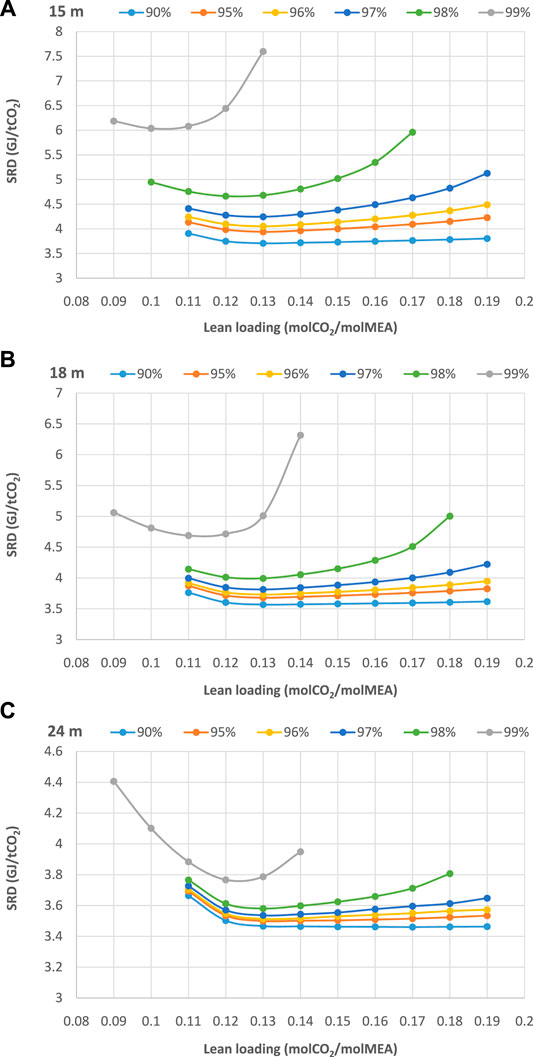
FIGURE 7. Effect of lean loading on the specific reboiler duty in the stripper for different absorber heights (a = 15 m, b = 18 m, c = 24 m) and various capture levels (note different vertical axis scales).
At lower capture levels, the SRD values are relatively insensitive to lean loading, but as the capture level increases, the SRD varies more significantly with lean loading, with the minimum value occurring at lean loadings in the range of 0.10–0.13 in all cases. As would be expected, though, at the lower packing heights, lower rich loadings are achieved, resulting in significantly increased energy requirements.
A summary of the optimal energy performance at varying capture levels is presented in Figure 8. The minimum (within the limits of the discrete L/G values used) SRD values for the 15 m packing height absorber are achieved at a lean loading value of 0.13 molCO2/molMEA for 90% up to 97% capture, and consequently, the L/G ratio has to be increased from 0.67 to 0.84 over this range to meet the desired capture level. Even lower lean loading is necessary for 98% and 99% capture, i.e., 0.12 and 0.1 molCO2/molMEA, respectively. In addition, the available packing area limits rich loading values for 98% and 99% capture, and higher L/G ratios (0.88 and 0.96, respectively) are necessary to capture the additional CO2. The SRD therefore exhibits a sharp increase beyond the 97% capture level with 15 m of absorber packing.
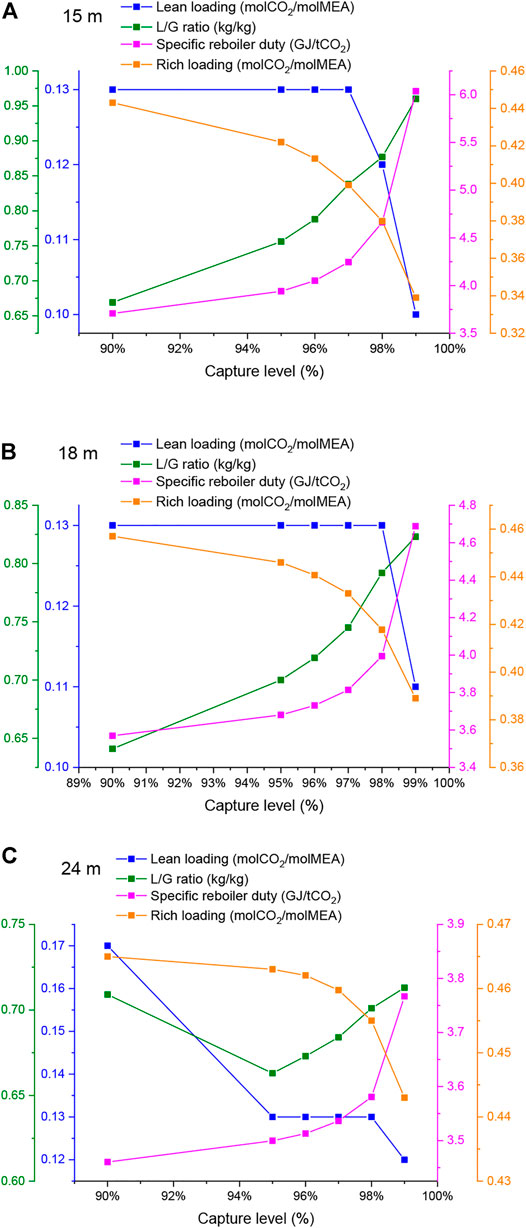
FIGURE 8. General trends for several parameters at optimal operation at different absorber packing heights (a = 15 m, b = 18 m, c = 24 m) and varying capture levels.
For 18 m of packing, low leans of 0.13 molCO2/molMEA are necessary for the absolute minimum SRD values at all capture levels except for the 99% case, for which the minimum occurs at 0.11 molCO2/molMEA. Compared to 15 m of packing, the SRD vs. L/G trend is more flat, since more mass transfer area is available to allow the rich loading to approach its asymptotic value. While a sharp increase in SRD is also observed for 99% capture, the absolute increase is smaller than that for 15 m of packing, at roughly 4.7 GJ/tCO2 instead of around 6 GJ/tCO2.
For 24 m of packing and 90% capture, a relatively higher lean of 0.17 molCO2/molMEA gives the minimum SRD, but for higher capture levels, lean loadings of 0.13 molCO2/molMEA are required, apart from the 99% capture case, where a lean loading of 0.11 molCO2/molMEA is optimal. In addition, the L/G ratios and the energy consumption trend are almost flat for capture levels up to 97%, which might be taken as an indication that 24 m is more than enough packing for this range of capture levels. Small increases in the L/G ratio and the SRD are observed for 98% and 99% capture, however, suggesting that this packing height might be appropriate for ultra-high capture levels without excessive increases in SRD. SRD trends as a function of lean loading for the three packing heights are also plotted for comparison in Figure 9.
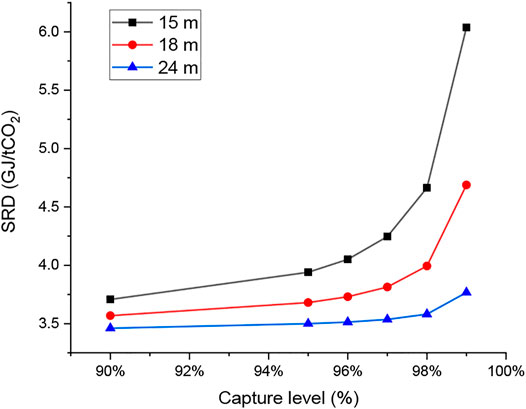
FIGURE 9. The optimal SRD for different capture levels and absorber packing heights.
3.3 Pre-Cooling and Intercooling Effects at Increased Capture Levels
Possible benefits at higher capture levels from greater pre-cooling of the inlet streams to the absorber and from intercooling the (limited to low lean loadings) have also been investigated.
3.3.1 Cooling Absorber Inlet Streams
Pre-cooling the flue gas or the liquid lean streams theoretically has the potential to be helpful, as at high temperatures the rich loading will be limited by the VLE, but on the other hand, lower temperatures decrease the rate of reaction. The effect of cooling the inlet streams to the absorber for 99% capture with the optimal lean loading of 0.12 molCO2/molMEA for 24 m of packing is shown in Table 4. The largest impact is obtained by reducing the temperature of the flue gas to 40°C and retaining a liquid temperature of 49°C, which gives a drop in SRD of 2.2%. Other cooling combinations provide less benefit. Due to greater VLE limitations, the performance of the lean of 0.14 molCO2/molMEA, is more sensitive to changes in temperature. Hence, it can be seen in Table 5 that for the best-case scenario, i.e., again for a gas temperature of 40°C and a liquid temperature of 49°C, the SRD drops by 5.6%. Further, it should be noted that all reduced temperature scenarios in Table 5 are, at best, not an improvement on the optimal base case with lean loading of 0.12 molCO2/molMEA.
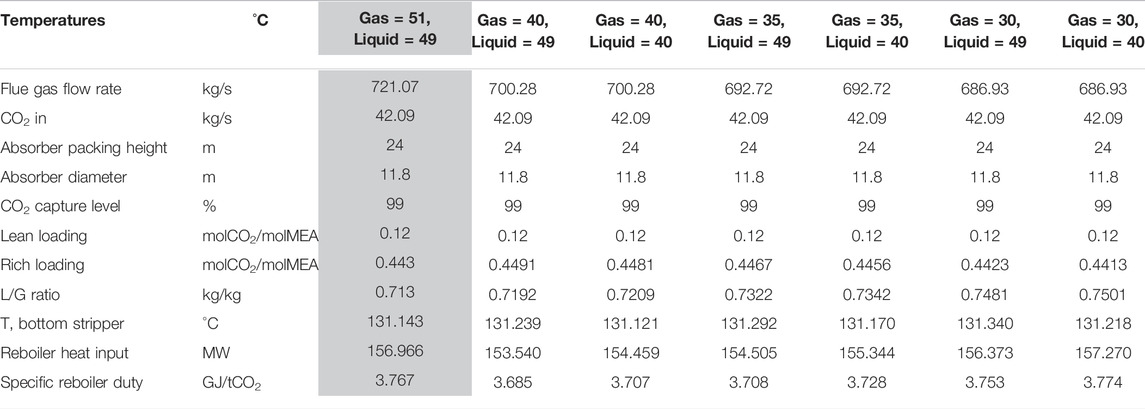
TABLE 4. Results for reduced inlet-to-the-absorber temperatures for 99% CO2 capture and lean loading of 0.12 molCO2/molMEA (the shaded column refers to the base case).
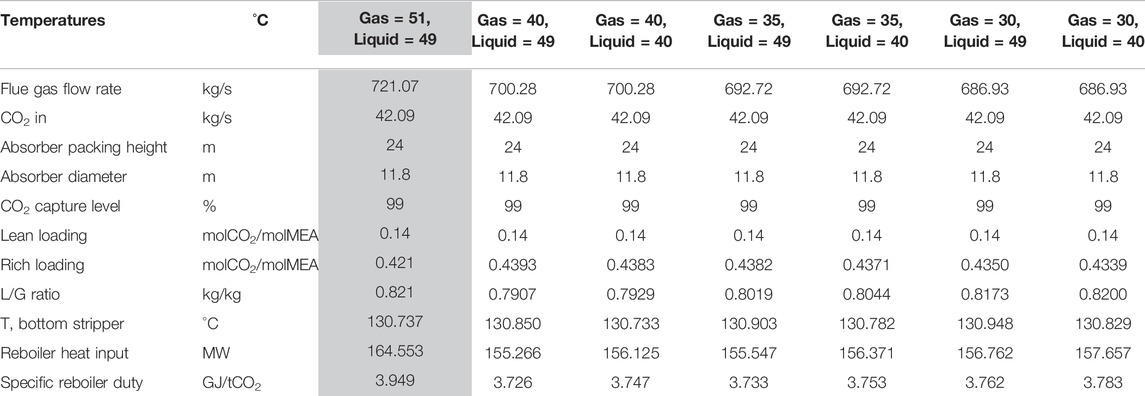
TABLE 5. Results for reduced inlet-to-the-absorber temperatures for 99% CO2 capture and lean loading of 0.14 molCO2/molMEA (the shaded column refers to the base case).
3.3.2 Absorber Intercooling
The scope for improving performance at higher capture levels using solvent intercooling has also been investigated. Figure 10A presents the absorber temperature profile for 24 m of packing and 99% capture level (optimal case, lean = 0.12 molCO2/molMEA) in conjunction with the CO2 partial pressures (actual and equilibrium) along the column. It is apparent that a temperature bulge (∼62°C) exists between 4 and 8 m from the top of the column, accompanied by low mass transfer. Assuming three beds, each 8 m tall, we modelled intercooling between the first and second beds at 40, 35, and 30°C; the absorber profile for 35°C intercooling is presented in Figure 10B. In this case, it can be seen that, even though the impact of intercooling on the driving force is apparent, the mass transfer does not improve by a great deal. As seen in Figure 10A and Figure 11, the bulge occurs away from where the greatest absorption occurs, i.e., the bottom of the column (a similar trend has been reported in Kvamsdal and Rochelle, 2008), and as such, the intercooling should be expected to have a minimal effect on the mass transfer performance of the absorber. Further, the lean loading is too low for mass transfer to be sensitive to temperature changes caused by intercooling. In addition, as Figure 11 shows, the rich loading has increased only slightly for the intercooling cases, yielding a reboiler duty reduction of less than 1% in all scenarios. In addition, the CO2 loading profiles in Figure 11 suggest that a reduction in absorber packing height is not an option for 99% capture with a lean loading of 0.12 molCO2/molMEA, even with intercooling.
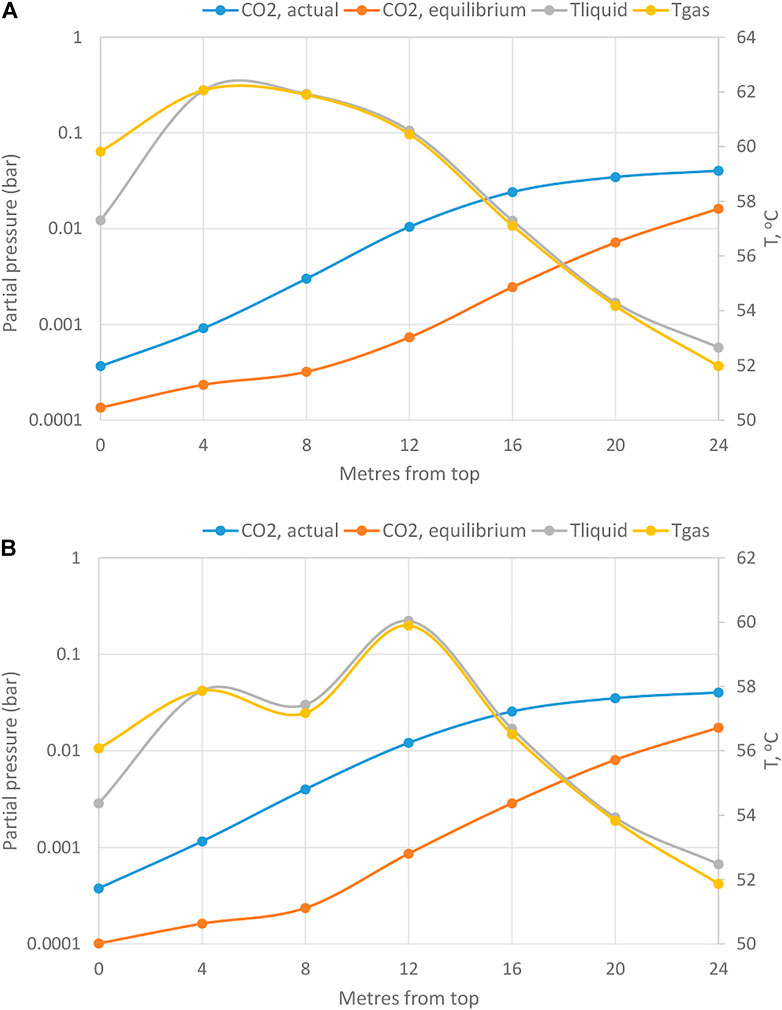
FIGURE 10. Actual and equilibrium CO2 partial pressures and temperature profiles along the absorber for 24 m packing height, capture level of 99% and lean loading of 0.12 molCO2/molMEA [(A) with no intercooling, (B) with intercooling temperature = 35°C].
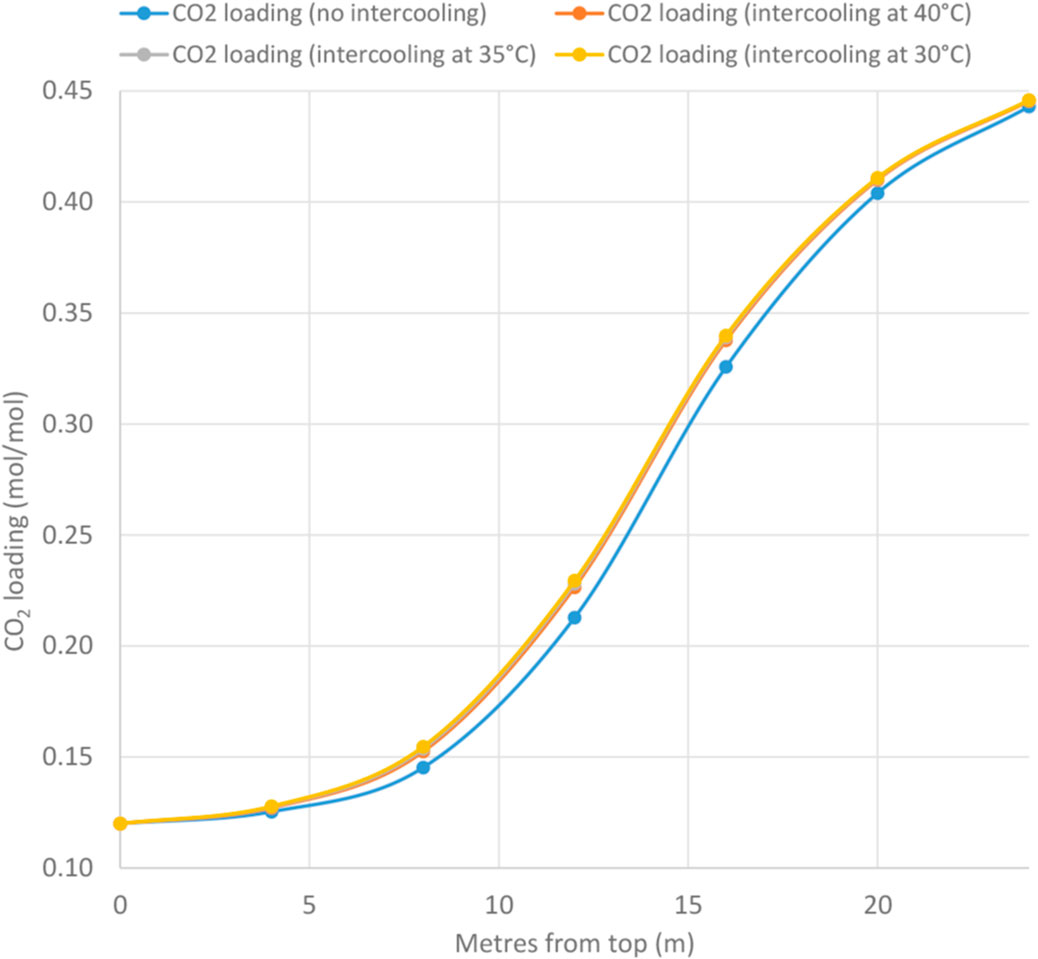
FIGURE 11. Increase in CO2 loading along the absorber for 24 m packing height, 99% capture level, and lean loading of 0.12 molCO2/molMEA.
The effect of intercooling has also been assessed at a higher lean loading of 0.14 molCO2/molMEA, again at 99% capture. As depicted in Figure 12, the relative benefit of intercooling is higher than for the 0.12 molCO2/molMEA lean case because, as shown in Figure 13, the impact of intercooling on the rich loading is greater and consequently reduces the reboiler duty for all intercooling cases by approximately 4%. But, despite the improvement in energetic performance, the curve of CO2 loading indicates that no significant reduction in the absorber height can be achieved by intercooling and, as shown in Table 6, absolute SRD values are not improved over non-intercooled values with a lean loading of 0.12 molCO2/molMEA.
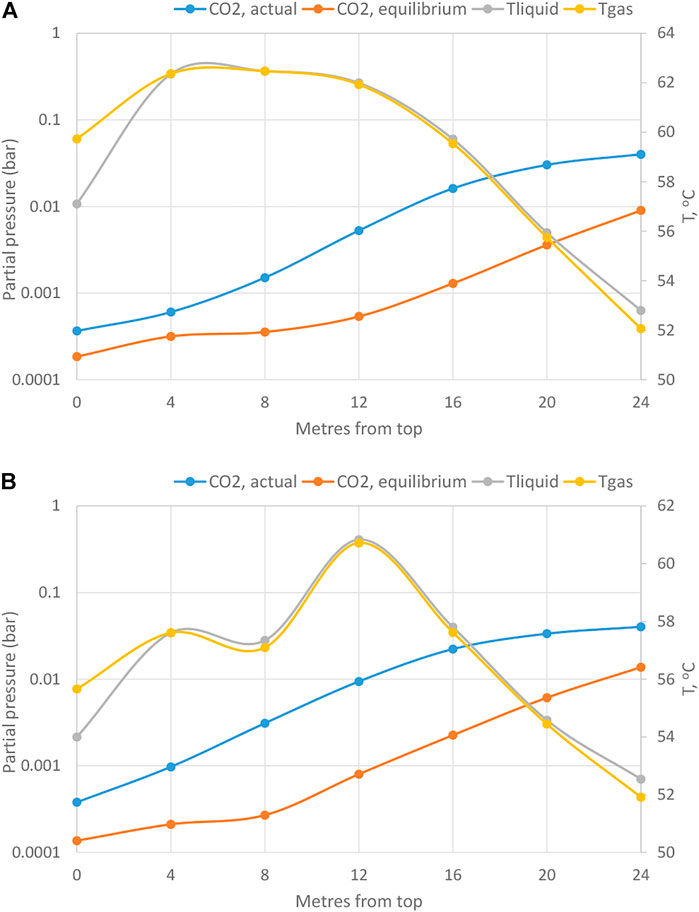
FIGURE 12. Actual and equilibrium CO2 partial pressures and Temperature profiles along the absorber for 24 m packing height, capture level of 99% and lean loading of 0.14 molCO2/molMEA [(A) no intercooling, (B) intercooling temperature = 35°C].
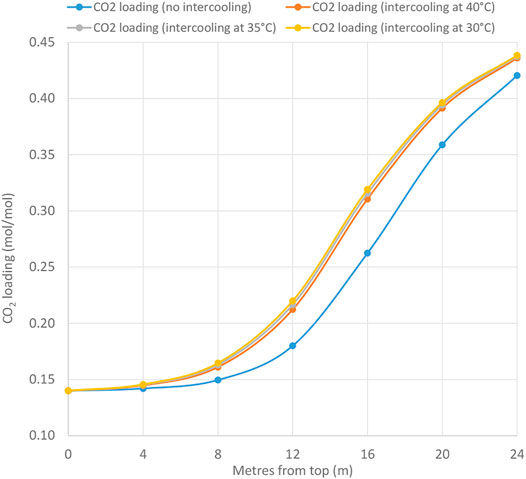
FIGURE 13. Increase in CO2 loading along the absorber for 24 m packing height, capture level of 99% and lean loading of 0.14 molCO2/molMEA.
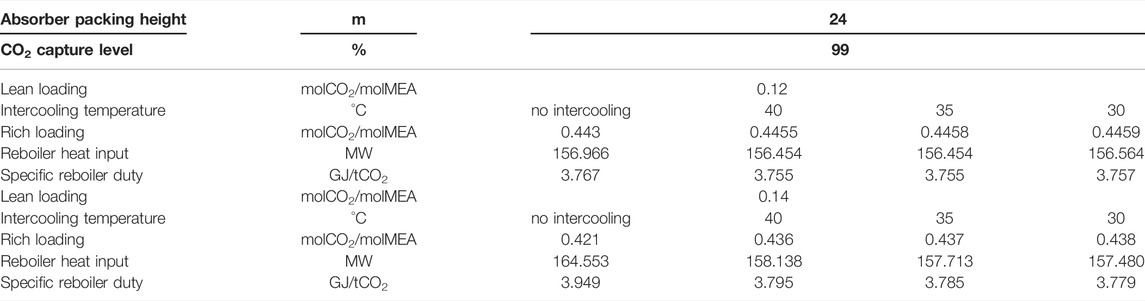
TABLE 6. Results for intercooling for lean loadings of 0.12 and 0.14 molCO2/molMEA at various temperatures with 24 m of packing and 99% capture.
3.4 Implications for Operating a 95% Capture Design at Higher Capture Levels
Current United Kingdom guidance on post-combustion capture for power applications (Environment Agency, 2021) recommends designing PCC systems for a capture level of 95% but, given that market forces can be expected to incentivise higher capture levels in order to achieve net-zero emissions, the scope to operate plants designed for higher capture levels is worth considering. Limits on increasing the capture level beyond 95% are somewhat different, depending on whether they are to be achieved on a plant during:
a) Continuous full-load operation;
b) Variable-load operation, in which the plant is not required to operate at full load all the time due to electricity market constraints (e.g., variable demand, intermittent renewable supplies), with the GT frequently shut down or operating at minimum stable generation (MSG).
For continuous operation at full load, limits on capture level might include:
i. Heat input—additional reboiler steam will be required; in the cases above, the minimum increase, with 24 m of packing, from 95% to 99% capture level was an additional 12%.
ii. Stripper temperature—reboiler steam temperature, and hence pressure, may need to be slightly higher, with consequent changes in steam extraction conditions; elevated stripper temperatures can also be expected to lead to greater thermal degradation and hence increased reclaiming and higher solvent consumption.
iii. Stripper flooding—as higher steam and CO2 flows occur in the stripper, operating conditions will be closer to the flooding limit.
iv. Solvent flow rates—depending on the parameters selected for operation at 95% capture, solvent flow rates may need to increase or decrease, noting that the liquid distributors in the absorber will have a limited operating range, expected to be about 2:1.
v. Intercooling—if intercooling is required at high capture levels then provision to extract and return solvent would have to be implemented in the initial design, with space for the necessary piping and heat exchanger, if relatively major in-service modifications are to be avoided.
vi. Compressor—CO2 mass flow rate will increase by 4.2% from 95% to 99% capture; this may be within operating margins, although there will also be a tendency to require a slightly higher delivery pressure (to offset the greater flow rate) and possibly a slightly-decreased suction pressure (to facilitate leaner solvent); a compression train with some flexibility (e.g. variable speed/variable geometry stage(s)) might therefore be an advantage.
Table 7 shows how these factors vary between 95% and 99% capture for the three packing heights used in this study. As might be expected, the 24 m packing case shows the greatest potential for extension from 95% to 99% capture with minimal or no modifications, although it must be emphasised that project-specific factors will determine actual characteristics.
a) Variable-load operation.
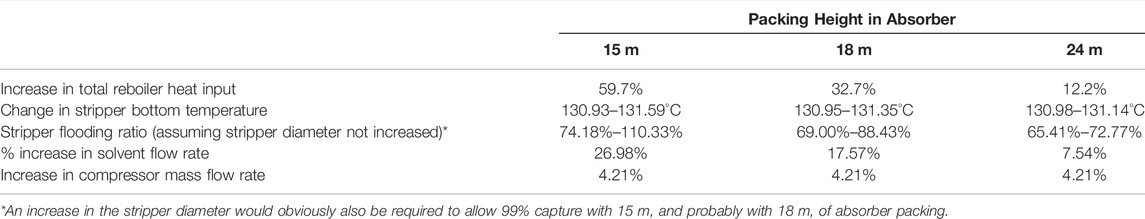
TABLE 7. Changes in operating parameters for a 95% capture design that was operated at 99% capture.
In practice, a CCGT + PCC plant may not be required to operate at full load all of the time due to electricity market constraints (e.g., variable demand, intermittent renewable supplies), with frequent periods with the plant either shut down or operating at minimum stable generation (MSG). This raises the prospect of additional operating modes in which higher capture levels could be desirable. In most cases, variable operation will be predictable for at least a day ahead, and if unpredicted grid requirements demand more urgent action to give an unexpected boost in electricity supplies, then any short-term reduction in capture level due to unpredicted operating requirements should not be an issue since:
a) In a situation like this, generation to ensure supply security will always be more valuable than the extra CO2 emitted.
b) As CO2 emissions can be averaged over long periods (e.g. a year), unexpected deviations may be compensated for, under more favourable circumstances, at a later date.
Operation with higher capture levels might generally be expected to be facilitated at MSG. A PCC plant designed for 100% CCGT output will obviously be operating at below its design levels in all or most respects at MSG. The main problem is likely to be obtaining adequate amounts of reboiler steam at a high enough pressure (and hence saturation pressure)—this may require modifications to the steam cycle, including tapping steam from the hot or cold reheat instead of the IP/LP crossover.
For starts and stops, full capture can be achieved using rich and lean solvent storage, as described in (AECOM, 2020). The AECOM study was based on modelling at 95% capture but, provided sufficient lean solvent at a low enough loading is available, then any capture level would be feasible. If additional PCC plant capacity is, however, also required to regenerate stored rich solvent during the period of operation following storage-supported start-up, as envisaged in this report, then the necessary capacity to shift to running at higher capture levels than the nominal design value may be constrained.
Further analysis is beyond the scope of this paper; detailed project-specific design work would be required to investigate all of the above features and make a judgement on the basis of future expected operating patterns with respect to any additional provisions involving capital expenditure.
3.5 Preliminary Economic Assessment of CO2 Emissions vs. Electricity Costs to Justify Higher Capture Levels
Although a more detailed assessment of capital expenditure issues around increased capture levels is beyond the scope of this paper (and will depend on site-specific factors and also the terms of any support mechanisms for CCS deployment), an illustrative estimate can be made of the conditions under which the costs associated with the reduced electricity output due to higher CO2 capture levels would be offset by the reduction in CO2 emission costs. This corresponds to the operating decisions that would be made in a suitable plant, where any investment costs to enable higher capture levels have already been incurred and so are no longer a factor. Even if actual capture cost support mechanisms may differ, exposure to market electricity and carbon prices is a (GOV.UK, 2021) basic principle. Table 8 depicts the basis for the calculations, and Figure 14 depicts the break-even CO2 emission cost to move from 95% to ultra-high capture levels for different packing heights for an assumed electricity selling price of £100/MWh. Above 98% capture, for all packing heights, an exponential increase (but with different slopes) is observed for the break-even CO2 emission cost. The taller absorber (24 m packing) requires only 80.22 £/tCO2 to break even with the 95% base case. For a packing height of 18 m a value close to 210 £/tCO2 would be needed to move to 99% capture. As a purely illustrative comparative benchmark, the Climate Change Committee’s net-zero scenario studies for the United Kingdom’s Sixth Carbon Budget (CCC, 2020) assume carbon dioxide removal (CDR) costs of 90–300 £/tCO2 for BECCS and 180–300 £/tCO2 for DACCS in 2050, suggesting that operation at capture levels higher than 95% and possibly up to 99% would potentially be cost effective if CDR is the alternative.
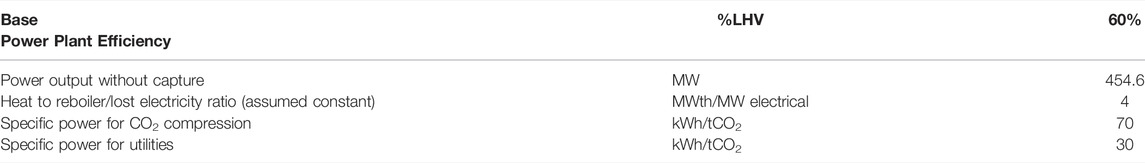
TABLE 8. Basic data is assumed for CCGT + PCC break-even CO2 emission cost calculations.
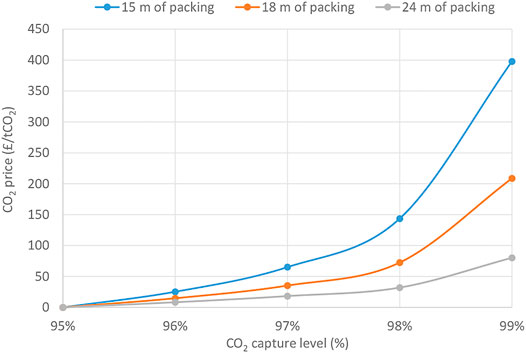
FIGURE 14. Break-even CO2 emission price for a capture level increase from 95% based on operating costs and revenues, assuming an electricity export price of £100/MWh, at packing heights of 15, 18, and 24 m (based on marginal operating costs, so investment costs to allow this increase, including the likely need to increase the stripper diameter for 15 and 18 m of packing at the higher capture levels, are not relevant).
4 Conclusion
The study performed a modelling assessment of a CCGT + PCC plant with a design similar to that described for a commercial FEED study using MEA at 35% w/w and stripper pressure of 2.4 bar. The CCSI/Aspen toolkit, developed by the US DOE, was used to establish the mass and energy balances of the system. Based on the thermodynamics and kinetics used in the CCSI model, the modelling results suggest that it is feasible to reach high capture levels of up to 99% at only moderately increased energy penalties when sufficient packing height is used, provided that appropriately low solvent lean loadings and L/G ratios are used. Other specific indications based on the modelling studies are:
• Lean loading determines the maximum achievable capture level. Inlet flue gas CO2 concentration determines the maximum potential rich loading.
• Specific reboiler duty is a function of liquid flow (lower the better) and rich loading (higher the better) as well as lean loading (higher the better, but a weak dependence down to about 0.12 molCO2/molMEA).
• The optimal rich loading should be as close to the equilibrium limit as possible; if the L/G ratio is too high for a given lean loading, the rich loading will not be able to reach its maximum value, regardless of how much packing is used.
• For a given lean loading and the optimal associated L/G ratio, there is a minimum absorber packing height below the near optimal rich loading, and hence relatively moderate energy penalties, cannot be achieved.
• For the commercial FEED study parameters used in this study (and for current CCSI model kinetics), the absorber packing height of 15 m that was intended for 85% capture can achieve up to 95% capture without energy use increasing significantly, 18 m of packing works well up to around 98% capture, and 24 m is adequate for 99% capture (with lower absolute energy requirements also decreasing with increased packing height).
• Cooling the absorber inlet streams or column intercooling appears to have no significant effect on plant performance, provided that optimal lean loadings and L/G ratios are used.
• For suitably designed plants, operating economics suggest that capture rates higher than 95% would be attractive if carbon dioxide removal from the air is the alternative.
• Although the study was conducted using MEA, the trends are expected to provide general insight and guidance on potentially useful changes in process variables for the relatively new target of 95%-plus capture from low-concentration CO2 streams.
• This study is based only on process modelling assessments; further experimental testing and detailed site-specific design studies are required in order to investigate the further trends that have been found.
Data Availability Statement
The original contributions presented in the study are included in the article/Supplementary Material, further inquiries can be directed to the corresponding author.
Author Contributions
SM and JG: conceptualisation; SM and JG: methodology; SM and JG: investigation; SM: simulations, JG: supervision; SM and JG: formal analysis; SM and JG: writing—original draft; SM and JG: writing—reviewing and editing.
Conflict of Interest
The authors declare that the research was conducted in the absence of any commercial or financial relationships that could be construed as a potential conflict of interest.
Publisher’s Note
All claims expressed in this article are solely those of the authors and do not necessarily represent those of their affiliated organizations, or those of the publisher, the editors, and the reviewers. Any product that may be evaluated in this article, or claim that may be made by its manufacturer, is not guaranteed or endorsed by the publisher.
Acknowledgments
The authors are grateful for funding from the EPSRC under the United Kingdom CCS Research Centre grant (EP/P026214/1) and from the UKRI via the University of Sheffield under the KE-QR-POLICY-SPF programme. Helpful comments from reviewers, particularly on the role of stripper pressure, are also acknowledged.
Supplementary Material
The Supplementary Material for this article can be found online at: https://www.frontiersin.org/articles/10.3389/fenrg.2022.866838/full#supplementary-material
References
Bechtel for Gassnova (2009). Bechtel for Gassnova, CO2Capture Facility at Kårstø, Norway; FEED Study Report. report and 200+ supporting documents. Available at: https://ukccsrc.ac.uk/open-access-carbon-capture-and-storage-at-karsto-norway/.
Brandl, P., Bui, M., Hallett, J. P., and Dowell, N. M. (2021). Beyond 90% Capture: Possible, but at what Cost? Int. J. Greenhouse Gas Control. 105, 103239. doi:10.1016/j.ijggc.2020.103239
CCC (2020). ‘Sixth Carbon Budget - Methodology Report’, Committee on Climate Change. Available at: https://www.theccc.org.uk/publication/sixth-carbon-budget/.
CCSI (2021). CCSI Toolset: MEA Steady State Model. Available at: https://github.com/CCSI-Toolset/.
Du, Y., Gao, T., Rochelle, G. T., and Bhown, A. S. (2021). Zero- and Negative-Emissions Fossil-Fired Power Plants Using CO2 Capture by Conventional Aqueous Amines. Int. J. Greenhouse Gas Control. 111, 103473. doi:10.1016/j.ijggc.2021.103473
Elliott, W., Benz, A., Gibbins, J., and Michailos, S. (2021a). “An Open-Access, Detailed Description of post-combustion CO2 Capture Plant,” in Proceedings of the 15th Greenhouse Gas Control Technologies Conference, 15-18 March 2021, Abu Dhabi. SSRN
Elliott, W., Benz, A., Gibbins, J., and Michailos, S. (2021b). “An Open-Access, Detailed Description of a post-combustion CO2 Capture Plant Retrofit for Panda Energy’s Sherman Combined Cycle Power Plant,” in Presentation in IEAGHG Post Combustion Capture Conference, 6, 19–21. October 2021. PCCC-6. Sheffield: IEAGHG
Environment Agency (2021). Guidance: Post-combustion Carbon Dioxide Capture: Best Available Techniques (BAT). Available at: https://www.gov.uk/guidance/post-combustion-carbon-dioxide-capture-best-available-techniques-bat.
Feron, P., Cousins, A., Jiang, K., Zhai, R., Shwe Hla, S., Thiruvenkatachari, R., et al. (2019). Towards Zero Emissions from Fossil Fuel Power Stations. Int. J. Greenhouse Gas Control. 87, 188–202. doi:10.1016/j.ijggc.2019.05.018
Gibbins, J., and Lucquiaud, M. (2021). BAT Review for New-Build and Retrofit Post-Combustion Carbon Dioxide Capture Using Amine-Based Technologies for Power and CHP Plants Fuelled by Gas and Biomass as an Emerging Technology under the IED for the UK. UKCCSRC Report. Available at: https://ukccsrc.ac.uk/best-available-techniques-bat-information-for-ccs/
GOV.UK (2021). Carbon Capture, Usage and Storage (CCUS): Business Models. Available at: https://www.gov.uk/government/publications/carbon-capture-usage-and-storage-ccus-business-models.
Hirata, T., Tsujiuchi, T., Kamijo, T., Kishimoto, S., Inui, M., Kawasaki, S., et al. (2020). Near-zero Emission Coal-Fired Power Plant Using Advanced KM CDR Process. Int. J. Greenhouse Gas Control. 92, 102847. doi:10.1016/j.ijggc.2019.102847
IPCC (2021). Working Group I Contribution to the Sixth Assessment Report, Intergovernmental Panel on Climate Change. Available at: https://www.ipcc.ch/assessment-report/ar6/.
Khambaty, S., Reddy, S., and Stobbs, R. (2003). “Application of the EconamineFG Plus Process to Canadian Coal-Based Power Plant,” in Clean Coal Session of Combustion Canada Conference (Regina, Canada: Canadian Clean Power Coalition).
Kvamsdal, H. M., and Rochelle, G. T. (2008). Effects of the Temperature Bulge in CO2 Absorption from Flue Gas by Aqueous Monoethanolamine. Ind. Eng. Chem. Res. 47 (3), 867–875. doi:10.1021/ie061651s
Morgan, J. C., Soares Chinen, A., Omell, B., Bhattacharyya, D., Tong, C., Miller, D. C., et al. (2018). Development of a Rigorous Modeling Framework for Solvent-Based CO2 Capture. Part 2: Steady-State Validation and Uncertainty Quantification with Pilot Plant Data. Ind. Eng. Chem. Res. 57 (31), 10464–10481. doi:10.1021/acs.iecr.8b01472
Rezazadeh, F., Gale, W. F., Hughes, K. J., and Pourkashanian, M. (2015). Performance Viability of a Natural Gas Fired Combined Cycle Power Plant Integrated with post-combustion CO2 Capture at Part-Load and Temporary Non-capture Operations. Int. J. Greenhouse Gas Control. 39, 397–406. doi:10.1016/j.ijggc.2015.06.003
Shah, M. I., Silva, E., Gjernes, E., and Asen, K. I. (2021). “Cost Reduction Study for MEA Based CCGT Post-Combustion CO2 Capture at Technology Center Mongstad,” in Proceedings of the 15th Greenhouse Gas Control Technologies Conference 15-18 March 2021, Abu Dhabi. SSRN
Sulzer (2021). Mellapak™ and MellapakPlus™. Available at: https://www.sulzer.com/en/shared/products/mellapak-and-mellapakplus.
Tsai, R. E. (2010). Mass Transfer Area of Structured Packing. Austin, TX: The University of Texas at Austin.
Wood for BEIS (2018). Assessing the Cost Reduction Potential and Competitiveness of Novel (Next Generation) UK Carbon Capture Technology; Benchmarking State-Of-The-Art and Next Generation Technologies. Document Number: 13333-8820-RP-001, Date: 20th July 2018Available at: https://assets.publishing.service.gov.uk/government/uploads/system/uploads/attachment_data/file/864688/BEIS_Final_Benchmarks_Report_Rev_4A.pdf.
Keywords: ultra-high post combustion capture, net-zero, process modelling, Aspen Plus CCSI, technical evaluation
Citation: Michailos S and Gibbins J (2022) A Modelling Study of Post-Combustion Capture Plant Process Conditions to Facilitate 95–99% CO2 Capture Levels From Gas Turbine Flue Gases. Front. Energy Res. 10:866838. doi: 10.3389/fenrg.2022.866838
Received: 31 January 2022; Accepted: 08 March 2022;
Published: 24 May 2022.
Edited by:
Kangkang Li, Commonwealth Scientific and Industrial Research Organisation (CSIRO), AustraliaReviewed by:
Kaiqi Jiang, Commonwealth Scientific and Industrial Research Organisation (CSIRO), AustraliaYang Du, University of Texas at Austin, United States
Copyright © 2022 Michailos and Gibbins. This is an open-access article distributed under the terms of the Creative Commons Attribution License (CC BY). The use, distribution or reproduction in other forums is permitted, provided the original author(s) and the copyright owner(s) are credited and that the original publication in this journal is cited, in accordance with accepted academic practice. No use, distribution or reproduction is permitted which does not comply with these terms.
*Correspondence: Stavros Michailos, cy5taWNoYWlsb3NAc2hlZmZpZWxkLmFjLnVr