 Ti Yue
 Pan Yuan
 Shan Huang
 Lele Zheng
- Science and Technology on Reactor System Design Technology Laboratory, Nuclear Power Institute of China, Chengdu, China
Control rod drop is one of the key measures for the safe shutdown of the reactor. The two important evaluation indicators of the drop process are the drop time-length and the maximum impact force. By theoretical and experimental methods, this paper analyzes the influencing factors and evaluates the performance of a new type of spider hydraulic buffer with compact structure and ingenious design, which couples mechanical force and fluid resistance. First, through experiments, it is found that the real-time curve of the maximum impact force often has a bimodal structure. And the double peaks vary with the change of the internal structure of the hydraulic buffer. Secondly, since there are many variables about the structure (aperture, position, quantity, piston stroke et al.), in order to consider their influence on the maximum impact force, an equivalent ongoing flow area of the drain holes is introduced. It suggested that when the flow area of the working holes which can be covered by the stroke is close to the flow area of the remaining holes, the impact force tends to appear a minimum value. A relationship between the maximum impact force and the structure is proposed accordingly. Finally, this paper proposes a quantitative evaluation method for comprehensive buffering performance, in which the comprehensive performance evaluation factor η (0<η < 1) takes into account both the maximum impact force and the drop time. The smaller the maximum impact force and the rod drop time-length, the closer the evaluation factor η is to 1, indicating that the buffering performance is better. The research in this paper will not only help to further understand the mechanism of the drop rod buffering process, but also contribute to the structural optimization of the subsequent spider hydraulic buffer.
Introduction
In a reactor, the control rod assembly is one of the most important safety and security facilities. The control rod assembly is driven by the drive system to control the reactivity of the reactor, so as to realize the startup, normal shutdown, and power regulation of the reactor, and ensure the safety of the reactor under accident conditions. The two most concerned points in the process of dropping are the drop time-length and the maximum impact forcegenerally. If the rod drop time is too long, the reactor will fail toshutdown in time. While if the maximum impact force is too large, the core equipment will be damaged. Therefore, the control rod drop process needs to be equipped with a suitable buffer mechanism, which can not only effectively buffer the impact force of the rod drop, but also affect the drop time as little as possible.
In the past, the buffering method of the control rod assembly mainly used the reduced diameter section at the bottom of the rod bundle and supplemented the reverse resistance provided by the top spring to complete the rod drop buffer (Rabiee and Alireza, 2016; Xiao et al., 2017a; Xiao et al., 2017b). However, the machining of the reduced diameter section of the guide tube is difficult, and it is easy to cause rod wear or stickingamong droppingbehavior (Fu and Pu, 1997; Andriambololona et al., 2007; Zhang, 2017).
To this end, this paper studies a new type of hydraulic buffer structure, as shown in Figure 1. In addition to the top spring, the buffer also has a liquid cavity inside the handle body of the connecting handle. When the piston is pressed into the spider body, the fluid in the cavity is squeezed out from the drain holes on the wall of the spider body. In this process, the drain holes will hinder the liquid and play the role of hydraulic buffer to a certain extent, so as to avoid the excessive impact force of the falling rod. Due to the coupling of the dual effects of mechanical force and fluid resistance, the hydraulic buffer has a compact structure and ingenious design, so its application potential is great (Qin et al., 2018; Mingmin and Claus, 2013). So far, several researches have analyzed the control rod dropping program by simulated or experimental method (Yoon et al., 2009; Lin et al., 2017; Zhang et al., 2020; Zhang et al., 2021). However, the analysis of the subsequent buffer program during rod dropping, especially the relationship between the buffer performance and structural parameters, has not been systematically studied yet.
FIGURE 1. Working principle diagram of the spider hydraulic buffer. (1-Spider body, 2-spring, 3-center pole, 4-piston body, 5-drain holes).
In this paper, through theoretical analysis and experimental research, the sensitivity analysis of the maximum impact force and the drop time-length of the rod are carried out under different buffer structures such as drain holes and pistons respectively. The relationship between the maximum impact force and the structure is obtained, and a quantitative evaluation method for comprehensive buffering performance is proposed. Based on the above analysis methods, the potential optimal structural suggestionsfor the spider hydraulic buffer are finally given.
Buffering Process
The process can be divided into two stagesfor the control rod drop—the free fall stage and the buffer stage. First, the entire control rod assembly is dropped as a whole with severe control rods. Then, when the bottom of the buffer hits the top plate of the reactor core, the entire control rod assembly is buffered by mechanically or hydraulically action. As follows, the two steps are modeled separately and the effects of mechanical and hydraulic buffering are considered, respectively.
The Free-Falling Process
The kinematic equation describing the vertical fall of the buffer is established using Newton’s second law,
This can be simplified into
Where the c1 and c2 can be described as
Among them, the m1, m2 are the mass of the spider and the piston respectively. The
The Buffering Process
Since the hydraulic buffer couples both mechanical buffering and hydraulic buffering forces at the same time, its buffering effect is enhanced compared to other buffers. After the piston hits the bottom plate, on the one hand, the spring in the buffer chamber hinders the advancement of the piston. On the other hand, the fluid in the buffer chamber is pressed out by the piston, which also hinders the advancement of the piston, so that the impact kinetic energy is gradually dissipated. This coupling mechanism is also one of the advantages of spider hydraulic buffers. Therefore in recent years, the spider hydraulic buffers have begun to be favored in rod drop buffering process.
A simplified mechanical model is established to perform the effects caused directly by impacting behavior in the buffering process, as shown in Figure 2.
FIGURE 2. Mechanical simplified model of buffer calculation.
Impacting Behavior in the Buffering Process
According to the energy law, the vibration differential equation for buffering process can be expressed as Eq. 5,
The
where the
Hydraulic Effects in the Buffering Process
For a long time, the quantitative calculation of hydraulic action in the process of rod dropping has been a major problem for scholars. The fluid resistance is difficult to express because it is related to the relative fluid velocity who often changes with space and time. In the previous drop rod model, the following two methods are usually adopted to calculate the fluid resistance. One is to use the dynamic mesh technique to obtain the resistance effect of the fluid through the iteration of the flow field. The second is to obtain the empirical formula of hydraulic force through the fitting of test data, and finally form the dedicated rod drop program. The buffers involved in this paper have different drain holes structures, and correspondingly, their fluid resistances are different. To solve practical engineering problems, however, this paper does not plan to simulate the actual fluid resistance. Instead, the influence of different drain holes structures on the buffer performance was investigated directly through experiments.
Experimental Setup
In this project, a hydrostatic buffer drop-rod test platform is built. The drop-weight testing machine was used as the subject of the experiment, and the connecting handle assembly with the control rod was placed in a transparent glass water tank. After the power is cut off, the buffer starts to fall from a certain height above the water tank with an initial velocity of zero and hits a flexible stainless steel bottom plate at the bottom of the test platform. After the impacting, the spider hydraulic buffer starts its process and finally ends when the entire spider body is stabilized.
During the experiments, two laser displacement sensors (Type: KEYENCE IL-600) were used to measure the displacement of the buffer during the dropping process and calculate its velocity and acceleration. A ring-shaped force sensor (Type: TH2IC) at the bottom of the water tank is used to measure the impact force on the bottom plate in real time. At the same time, the experimental environment is strictly guaranteed by thermometers and voltmeters.
The schematic diagram of the buffer in this experiment is shown in Figure 3, and its key structural size parameters are shown in Table 1. As the equivalent weight, several rod-shaped structures which have been weighed precisely are fixed around the body of spider body before each test. The specific settings of the variable values in Table 1 are shown in Table 2. The tests here are all univariate experiments. Each Experiment only changes one parameter on the basis of the benchmark case “A0”.
FIGURE 3. Simplified schematic and key parameters of spider hydraulic buffer.
TABLE 1. Key dimensions of spider hydraulic buffer.
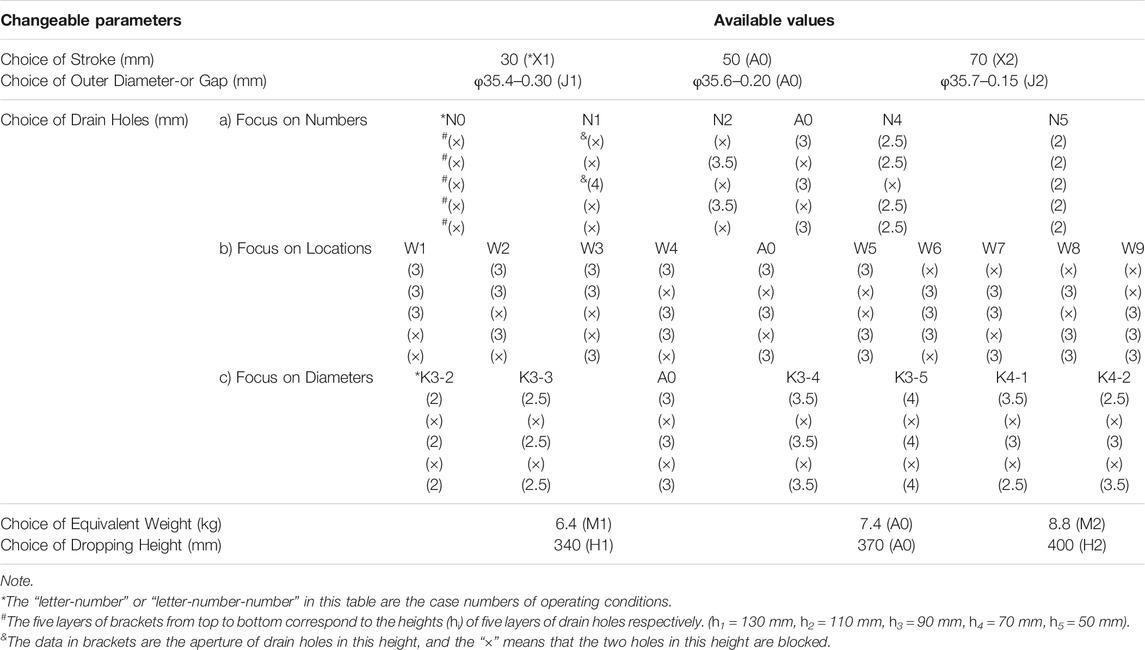
TABLE 2. Settings for Changeable Structures in series of Univariate Experiments.
Results and Discussion
Effects of Piston Structure
The variable dimensions of the piston concerned in this paper mainly include the outer diameter and height, which correspond to the clearance between the piston and the connecting handle and the piston stroke, respectively.
The relationship between the maximum impact force and the piston clearance is shown in Figure 4. With the increase of the clearance, the maximum impact force will first decrease and then increase. By analyzing their real-time curves of the maximum impact force (as shown in Figure 5), it can be found that there are generally two large peaks during the buffering process. The first indicates the impact between the bottom surface of the piston and the bottom plate of the test bench, and the second is the collision between the crown of the piston and the spider body. For different cases, the peak distribution of the two shocks is also different. Taking the A0 case as an example, when the gap flow area is small, the maximum impact force appears at the first peak position. As the gap fluid flow area increases, the first peak decreases and the second peak increases gradually. When the unilateral clearance is increased to 0.30 mm, the maximum impact force will appear at the second peak.
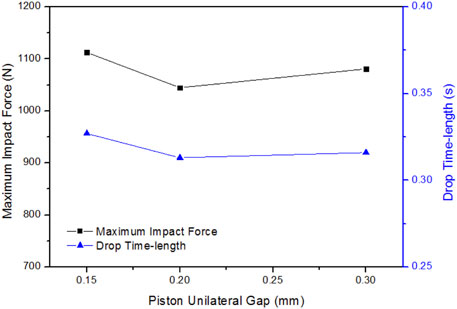
FIGURE 4. The Effects of Piston Unilateral Gap on theMaximum Impact Force and the Drop Time-length.
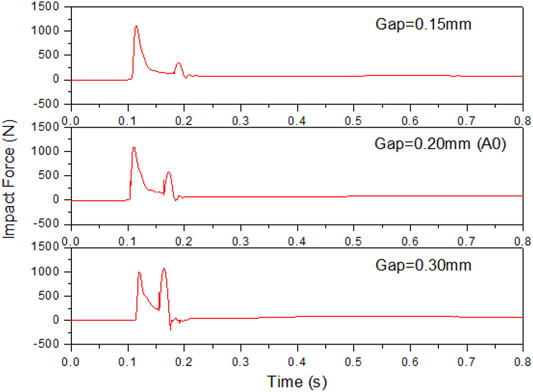
FIGURE 5. The effects of piston unilateral gap on the real-time impact force.
This shows that as the flow area increases, part of the instantaneous impact energy can be converted into fluid kinetic energy, and the impact between the piston and the bottom plate is thus buffered. However, when the flow area is too large, the fluid flow rate is significantly reduced, and the original potential energy cannot be completely released in the first impact, so the impact force will be larger during the second impact.
The relationship between the maximum impact force and the piston stroke is shown in Figure 6. The maximum impact force decreases as the stroke increases. Analysis of the impact force real-time curve in Figure 7 shows that when the stroke is only 30 mm, the kinetic energy of the entire system is not fully consumed by the buffering process due to the short buffering stroke. As a result, after the buffer stroke is completed, the spider body will continue to bounce up and down and generate multiple impact peaks. When the stroke of the piston increases to 70 mm, the buffer can completely consume the potential energy, and the piston will not collide with the spider body.
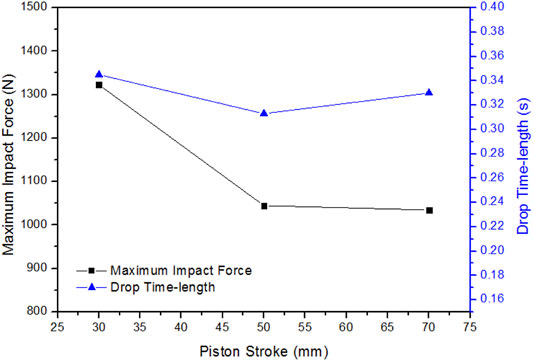
FIGURE 6. The effects of piston stroke on the maximum impact force and the drop time-length.
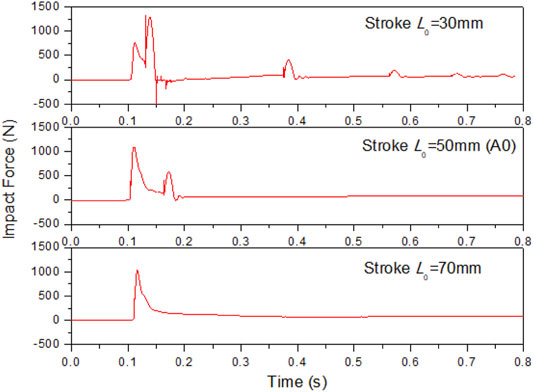
FIGURE 7. The effects of piston stroke on the real-time impact force.
Effects of Drain Holes
Experiments and numerical simulations show that there is a certain relationship between the maximum impact force and the number, diameter, and position of the drain holes, as shown in Figures 8–10. The maximum impact force seems to have a decreasing trend with the increase of the pore size and the number of holes. This may be due to the increase of the flow area with the increase of the pore diameter and the number of holes. Correspondingly, the fluid resistance decreases, so the resistance of the water to the piston decreases, and finally the impact force of the falling rod increases. Although the maximum impact force is somewhat related to the number, diameter, and position of holes, its regularity is still not obvious enough.
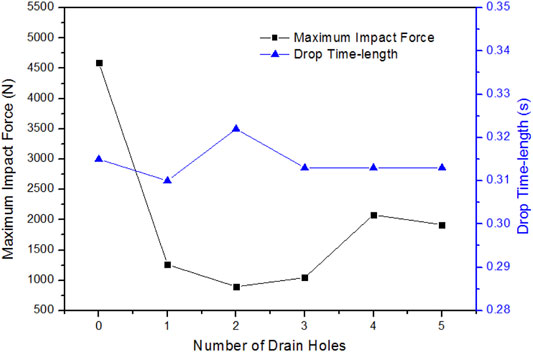
FIGURE 8. The effects of HolesNumber on the maximum impact force and the drop time-length.
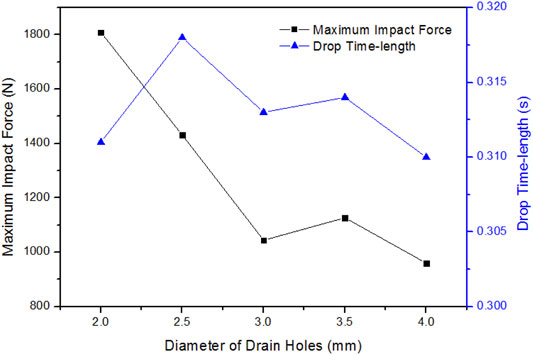
FIGURE 9. The effects of HolesDiameter on the maximum impact force and the drop time-length.
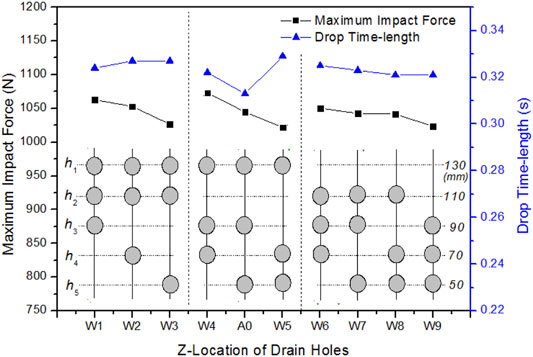
FIGURE 10. The effects of hole location on the maximum impact force and the drop time-length.
To explore the influence law of the drain holes on the maximum impact force more detailed, the real-time change curves of the impact force during the buffering process were compared in Figure 11. For the W1 condition with higher holes position, the values of the two peaks are very close. For the W9 condition with lower holes position, the first peak is obviously higher than the second peak. That is, the impact between the piston and the bottom plate in W9 is more severe than the impact between the piston and the spider. This phenomenon shows that the maximum impact force is not only related to the total flow area but also to the relative position of the piston and the drain holes.
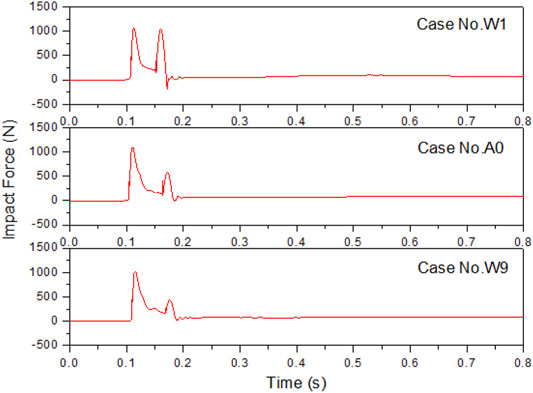
FIGURE 11. The effects of holes location on the real-time impact force.
In order to consider the influence of structural parameters such as hole position and piston size on the buffer process while measuring the total flow area in the buffer cavity, the equivalent ongoing flow area of the drain holes
Where Di is the diameter of each row of holes, hi is the distance from each row of holes to the bottom edge of the spider body (as illustrated in Table 2), L is the penetration depth of the piston when it contacts the spider body (L = L0+30), I is the number of holes in each row (I = 2), and N is the total number of rows.
The relationship between the maximum impact force and the equivalent ongoing flow area of the drain holes is shown in Figure 12. Within this range, the maximum impact force first decreased sharply and then increased slowly with the increase of the equivalent ongoing flow area of the drain holes. When the flow area increases to about 35 mm2, the maximum impact force begins to appear at the second peak. This shows that when the flow area of the drain holes increases initially within the range of (0–60) mm2, the maximum impact force caused by the first peak is slowly released, and when the flow area continues to increase, the effect of the second peak is gradually highlighted. It is speculated from the figure that when the flow area is between 13 and 40 mm2, the impact force will be the smallest (about 1000N) and the buffering effect will be the best.
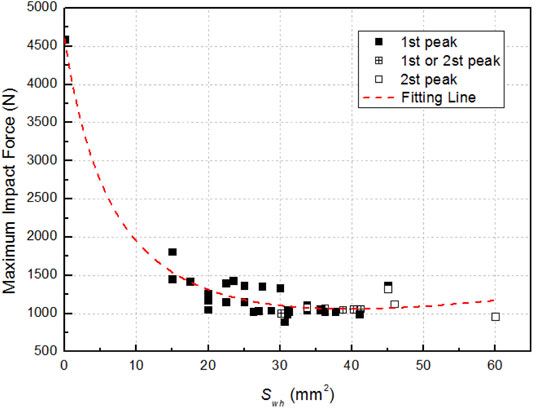
FIGURE 12. The relationship between the maximum impact force and the equivalent ongoing flow area of the drain holes.
A formula for calculating the maximum impact force F and the equivalent ongoing flow area is recommended here, as follows:
Among them,
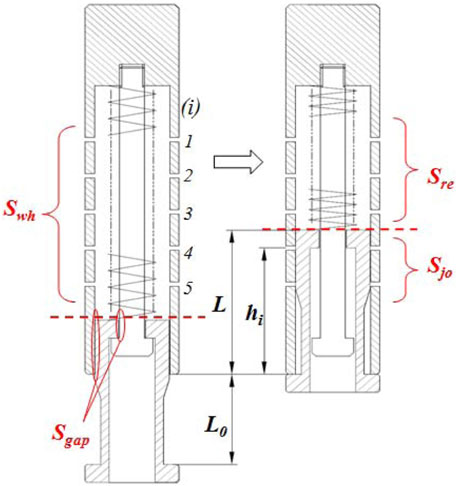
FIGURE 13. Illustration of the Corresponding Definition of the Equivalent flow area.
The
For the cases involved in this paper, the relative error based on the 95% confidence for the above formula is 21%, and the maximum relative error is 35%, as shown in Figure 14.
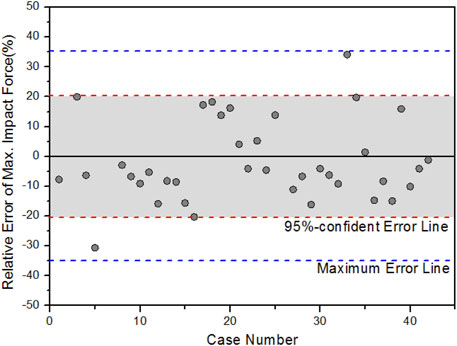
FIGURE 14. The calculation relative error of the maximum impact force.
Under the condition that the total flow area of the drain holes remains unchanged, the impact force F is most likely to have a minimum value when
Effects of Potential Energy
The relationship between the buffering performance, the equivalent weight and the falling height was investigated through experiments. In Figures 15, 16, obviously, the relationship between the maximum impact force and the equivalent weight basically increases linearly. At the same time, the maximum impact force gradually increases with the increase of the drop height. However, in Figure 17, the change rule of the drop time is not obvious.
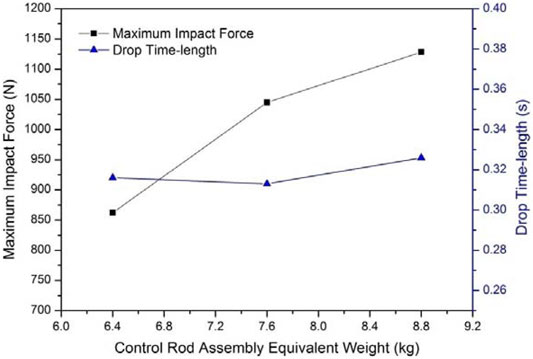
FIGURE 15. The effects of equivalent weight on the maximum impact force and the drop time-length.
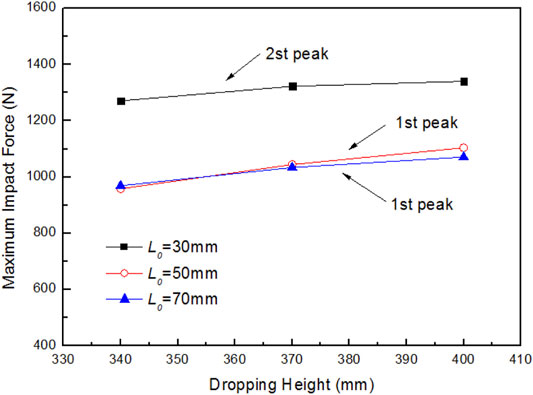
FIGURE 16. The effects of dropping height on the maximum impact force under different piston stroke.
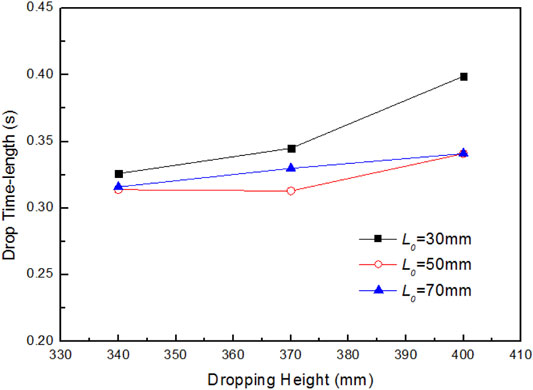
FIGURE 17. The effects of dropping height on the drop time-length under different piston stroke.
In the figure, noting that when the piston stroke is too short (L0 = 30 mm), not only the impact force is significantly increased, but the buffering time-length is also longer. That is, the buffering performance becomes extremely poor. It can be seen from the previous analysis in Figure 7 that due to the short stroke, the energy released during the pressing of the piston is obviously insufficient. After that, although the impact force reaches the maximum at the second impact, there is still some energy remaining. Thus, the piston will continue to bounce and collide multiple times until it stabilizes, which causes the buffer time-length to increase significantly.
Comprehensive Performance Evaluation
In practical engineering applications, the buffer should not only ensure that the impact force is not too large, but also meet the requirement to keep the drop time-length as short as possible. Excessive impact force will cause damage to the core floor, and too long drop time-length will cause the reactor to fail to shut down in time, resulting in a major reactor shutdown accident. Therefore, the buffering performance needs to take into account both the maximum impact force and the drop time.
A comprehensive performance evaluation factor η is proposed here, defined as
Where the F is the maximum impact force during the buffering process, the t is the drop time-length. And the Fcr is the allowable maximum impact force on the upper plate of the core in the actual core (1500N here), and the tcr is the limit drop time-length allowed in the actual rod drop process (1.3 s here). When the maximum impact force F is not greater than the allowable maximum impact force Fcr, if the drop time-length exceeds the limit drop time-length, the evaluation factor η is less than 0.
Accordingly, the relationship between the comprehensive performance evaluation factor and the maximum impact force and the drop time-length is shown in Figure 18. It can be seen that the smaller the maximum impact force and the drop time-length, the closer the comprehensive performance evaluation factor is to 1, and the better the buffering performance. Conversely, the closer the evaluation factor is to 0, the worse the buffer performance is. Overall, when the impact force values of the first peak and the second peak are closer, the comprehensive performance is better, as shown by the scattered points in Figure 18.
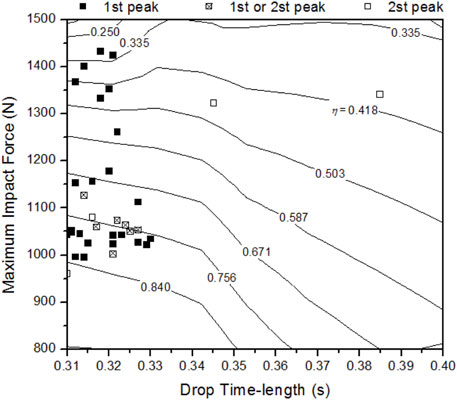
FIGURE 18. The isogram of buffering performance evaluation factor and cases scatter in tests.
By the above evaluation method, under the same weight and drop height, several better performance conditions (η > 0.78) are A0/W9/K3-5/K4-2, and some typical poor performance conditions (η < 0.46) are N0/K3-2/X1. It indicates that for the drain hole structures involved in this paper, the buffering performance is better when: 1) the total flow area of the holes is larger, or 2) there are more holes that can be covered by the piston stroke. On the contrary, the buffering performance is poor when: 1) the total area of the drain holes is small, or 2) the piston stroke is too short. This information will make recommendations for the design optimization of the spider hydraulic buffer.
Conclusion
Aiming at a new type of spider hydraulic buffer adopted in the rod drop buffering, this paper studies the effects of different structural dimensions on the buffer performance, such as the distribution of drain holes, piston stroke and outer diameter, drop height and equivalent weight. The following conclusions are obtained.
(1) The real-time curve of the maximum impact force often has a bimodal structure. Generally, the first impact is the impact between the bottom of the piston and the test platform, and the second impact is the impact between the piston cap and the bottom of the spider body. The double peaks vary with the change of the internal structure of the hydraulic buffer.
(2) The experimental data show some evidently qualitative law when analyzing the maximum impact force. Most obviously, the maximum impact force is positively related to the weight and the dropping height. In addition, for the piston structure, an increase of stroke (30–70 mm) will bring a decrease of the maximum impact force. Meanwhile, an increase of outer diameter (clearance) will cause the maximum impact force to decrease first and then increase, the optimal size of clearance in these tests is 0.2 mm. For the drain holes, the influence of its parameters’ changing (including hole diameter and hole locations) is more complicated. Therefore, it calls for several quantitative features that reflect equivalent flow area to characterize the hydraulic effects of these holes.
(3) In order to simultaneously consider the influence of the drain holes parameters on the maximum impact force, a new characteristic parameter—the equivalent ongoing flow area of the drain holes—is introduced in this paper. The analysis found that with the increase of the equivalent ongoing flow area of the drain holes, the first peak value of the maximum impact force gradually decreased, and the second peak value gradually increased. Under the conditions with the same total flow area of the drain holes, when the flow area of the working holes located within the stroke approximately equal to the flow area of the remaining holes, that is, when the first peak value is close to the second peak value, the impact force seems to have a minimum value. To calculate the impact force under different equivalent ongoing flow areas, a formula with a 95%-confidence relative error of 21% are recommended here. It suggested that when the flow area locates in a range of (13–40) mm2, the impact force will be the smallest (about 1000N) and the buffering effect will be the best.
(4) In order to take into account both the maximum impact force and the drop time-length when analyzing the buffering performance, a comprehensive performance evaluation factor η (0<η < 1) is proposed. For the structures involved in this paper, when the total area of the drain holes is large enough or the holes are mostly located within the piston stroke, the comprehensive buffering performance is better (η > 0.78). While when the total area of the relief holes is small or the piston stroke is too short, the comprehensive buffering performance is poor (η < 0.46).
In summary, the maximum impact force and the comprehensive performance of spider hydraulic buffers are both closely related to their own structure. Designers can further optimize the buffer structure based on the above conclusions to obtain potential best buffer performance.
Data Availability Statement
The raw data supporting the conclusions of this article will be made available by the authors, without undue reservation.
Author Contributions
TY: Conceptualization, Formal analysis, Data curation, and Writing the original draft; PY: Methodology, Data collection and Data curation; SH: Methodology, Supervision; FZ: Conceptualization, Review and editing; YL: Conceptualization, Project administration; CH: Review and editing; LZ: Visualization; HW: Supervision; ML: Supervision.
Funding
This work presented in this paper is supported by the National Key R&D Program of China (2018YFE0116100).
Conflict of Interest
The authors declare that the research was conducted in the absence of any commercial or financial relationships that could be construed as a potential conflict of interest.
Publisher’s Note
All claims expressed in this article are solely those of the authors and do not necessarily represent those of their affiliated organizations, or those of the publisher, the editors, and the reviewers. Any product that may be evaluated in this article, or claim that may be made by its manufacturer, is not guaranteed or endorsed by the publisher.
References
Andriambololona, H., Bosselut, D., and Massin, P. (2007). Methodology for a Numerical Simulation of an Insertion or a Drop of the Rod Cluster Control Assembly in a PWR. Nucl. Eng. Des. 237 (6), 600–606. doi:10.1016/j.nucengdes.2006.09.001
Fu, X. G., and Pu, J. L. (1997). Safety Analysis and Review of Control Rod Falling Time Out of Tolerance in Dayawan Nuclear Power Plant[J]. Nucl. Power Eng. 18 (03), 2–8. doi:10.1007/s00376-997-0061-6
Lin, Z., Zhai, L., Zhu, L., Wang, X., Zhang, X., Cao, Y., et al. (2017). Control Rod Drop Dynamic Analysis in the TMSR - SF1 Based on Numerical Simulation and experiment. Nucl. Eng. Des. 322 (322), 131–137. doi:10.1016/j.nucengdes.2017.06.031
Mingmin, R., and Claus, M. (2013). Predictions of RCCA Drop Times under Consideration of Fuel Assembly Distortions[C]//the Structural Mechanics International Reactor Transactions. San Francisco, California, USA: SMiRT-22.
Qin, B., Li, L., and Bo, H. (2018). Study on the Decelerating Mechanism of the New Control Rod Hydraulic Decelerator for the CRHDS Based on Numerical Simulation and experiment. Ann. Nucl. Energ. 120 (oct), 814–827. doi:10.1016/j.anucene.2018.06.044
Rabiee, A., and Alireza, A. (2016). Control Rod Drop Hydrodynamic Analysis for a Pressurized Water Reactor[J]. Prog. Nucl. Energ. 88, 191–197. doi:10.1016/j.pnucene.2015.12.007
Xiao, C., Luo, Y., Du, H., and Wang, L. (2017). Simulation and Analysis of Single Control Rod DroppingBehavior Based on Dynamic Grid Technique[J]. Nucl. Power Eng. 38 (02), 103–107. doi:10.13832/j.jnpe.2017.02.0103
Xiao, C., Luo, Y., Zhang, H. L., Liu, X., Du, H., Huang, k., et al. (2017). Analysis of Control Rod Dropping and Buffering Behavior ofSupercritical Water-Cooled Reactor Based onDynamic Grid Technology[J]. Nucl. Power Eng. 38 (S2), 79–83. doi:10.13832/j.jnpe.2017.S2.0079
Yoon, K. H., Kim, J. K., Lee, K. H., Lee, Y. H., and Kim, H. K. (2009). Control Rod Drop Analysis by Finite Element Method Using Fluid-Structure Interaction for A Pressurized Water Reactor Power Plant[J]. Nucl. Eng. Des. 239, 1857–1861. doi:10.1016/j.nucengdes.2009.05.023
Zhang, G. L. (2017). Reasons Analysis for Abnormal Control Rod Dropping Behavior in Pressurized Water Reactor Nuclear Power Plant[J]. Nucl. Elect. Detect. Tech. 37 (07), 683–687.
Zhang, J. B., Gao, X. L., and He, H. X. (2020). Dynamics Numerical Calculation for Control-Rod Drop[J]. Nucl. Power Eng. 41 (6), 218–223.
Zhang, J. B., Li, Y. M., and Huang, C. L. (2021). Study on the Buffer Design Method of the Control Rod Assembly Buffer Structure[J]. Nucl. Power Res. Des. 14 (1), 35–39. www.cnki.net
Keywords: control rod drop, spider hydraulic buffer, maximum impact force, drop time-length, performance evaluation
Citation: Yue T, Yuan P, Huang S, Zhu F, Li Y, Huang C, Zheng L, Wang H and Liu M (2022) Experimental Analysis and Performance Evaluation of Spider Hydraulic Buffer for Rod Dropping in Reactor. Front. Energy Res. 10:868211. doi: 10.3389/fenrg.2022.868211
Received: 02 February 2022; Accepted: 28 February 2022;
Published: 15 March 2022.
Edited by:
Luteng Zhang, Chongqing University, ChinaReviewed by:
Kui Zhang, Xi’an Jiaotong University, ChinaWei Ding, Helmholtz Association of German Research Centres (HZ), Germany
Copyright © 2022 Yue, Yuan, Huang, Zhu, Li, Huang, Zheng, Wang and Liu. This is an open-access article distributed under the terms of the Creative Commons Attribution License (CC BY). The use, distribution or reproduction in other forums is permitted, provided the original author(s) and the copyright owner(s) are credited and that the original publication in this journal is cited, in accordance with accepted academic practice. No use, distribution or reproduction is permitted which does not comply with these terms.
*Correspondence: Fawen Zhu, MjU0MDg1NjM0QHFxLmNvbQ==