 Shiqi Liu
 Zhenju Chuang1*†
 Chunzheng Li
- 1Naval Architecture and Ocean Engineering College, Dalian Maritime University, Dalian, China
- 2School of Marine Science and Engineering, South China University of Technology, Shenzhen, China
- 3State Key Laboratory of Coastal and Offshore Engineering, Dalian University of Technology, Dalian, China
Technology innovation has led to an increase in floating wind turbine size aimed at releasing the pressure on capital cost and increasing its capacity factor. Large-size turbines pose high challenges regarding design with essential structure reliability. The dynamic performance of an integrated 15-megawatt (MW) wind turbine under extreme sea loads is investigated in this paper. Platform motions, mooring system positioning forces, sizeable blades, and tower behaviors are all studied under the targeted typhoon condition and extreme coherent gust with direction change (ECD) wind condition. Potential flow theory is used to analyze the first-order wave load, mean-drift wave load, and second-order difference-frequency wave load on the substructure of the ultra-large 15 MW floating offshore wind turbine (FOWT). The blade element momentum (BEM) theory is adopted for the calculation of the aerodynamic loads on the floating wind turbine, and the finite element method (FEM) is applied to analyze the mooring lines of the floating wind turbine. The results show that the effect of quadratic transfer function (QTF) will significantly increase the dynamic response of FOWT under the typhoon sea state. The ECD wind condition has an influential impact on the motion responses, the axial force of the mooring lines, and structural responses under the normal operating state.
Introduction
Wind energy, which has the advantages of abundant reserves and wide distribution, is developing rapidly presently. The electricity demand met by wind power will expand from 1,270 terawatt-hours per year (TWh) in 2018 to 17,840 TWh in 2050 as offshore wind production increases from about 70 TWh in 2018 to 7,400 TWh in 2050 (DNV, 2021). Compared with the onshore wind energy resources, offshore wind energy has the advantages of more abundant storage and less demand for the land space. By 2050, the production of offshore oil will shrink 51% compared with that in 2019, and the energy yield of offshore wind will be approximately the same as that of offshore oil (DNV, 2021). The offshore wind turbine plants tend to move from shallow to deep waters (Campanile et al., 2018). Floating offshore wind turbines (FOWTs) are the most effective tools for exploiting offshore wind power in deep water depth. However, the construction, transportation, installation, and maintenance costs of FOWTs are very high at present. Individual larger power-capacity wind turbines can reduce the cost per kilowatt-hour of wind power, which is an effective way to make wind power parity.
The harsh sea conditions in deep waters pose a significant threat to the stability and economy of floating wind turbines. Utsunomiya et al. (2013) analyzed the dynamic behaviors of an FOWT with Spar floating foundation during the typhoon event through the numerical simulation tool developed by the authors. The results showed that the simulated dynamic responses of the FOWT are basically consistent with the measured data. Muliawan et al. (2013) investigated the coupled extreme responses of the combined spar-type floating wind turbine and floating wave energy converter (STC) system through using time-domain numerical simulation. The results indicated that wave-induced responses dominate the extreme responses mainly, and the wave loads on the STC system are much larger than the aerodynamic loads. Han et al. (2017) studied and compared the dynamic characteristics of the submerged tension leg platform (STLP) wind turbine during the operation phase under different water depths. The results showed that the standard deviation (STD) value of the platform motion will become larger and the STD value of the tower base bending moment will be smaller under a larger water depth. Raed et al. (2020) used two environmental contour approaches to study the uncertainty on the extreme responses of an FOWT. Hsu et al. (2017) investigated seven experiments of a moored FOWT in extreme storm conditions and presented a probability distribution model for the dynamic tension of the mooring system which considers the influence of snap events. Lee et al. (2020) carried out the structural strength analysis of the floating platform for a 5 MW wind turbine under different environmental conditions and offered the suggestion of steel materials for the design according to the results of the strength analysis. Liu et al. (2021) investigated and compared the dynamic performances of the single offshore wind turbine and the offshore wind turbine plants with floating barge platforms under the wind–wave coupled action in the extreme sea state. However, few studies on the dynamic performances of the ultra-large 15 MW floating wind turbine in typhoon sea conditions in the South China Sea are carried out presently.
Ma et al. (2020) studied the dynamic responses of the mooring system for the National Renewable Energy Laboratory (NREL)’s 5 MW semi-submersible FOWT under the ECD wind condition and the consequence caused by the ECD condition. The results showed that the ECD wind condition has a great influence on the movement and mooring line tension of the FOWT owing to the considerable transient change of wind load. Storey et al. (2014) investigated the turbine loads of the NREL 5 MW research wind turbine under the extreme transient wind event using large eddy simulation and an actuator model. The previous research studies which studied the responses of the wind turbines under extreme wind conditions mainly aim at the NREL 5 MW wind turbine, the dimension and coupled responses of which are different from those of the 15 MW FOWT. However, the dynamic behaviors of the 15 MW floating wind turbine in extreme wind conditions are seldom investigated currently.
Zhao et al. (2020) studied the influence of second-order wave forces on the dynamic performances and structural fatigue behavior of the 10 MW floating wind turbine under different environmental conditions. The results showed that the motion behaviors may be underrated without considering the difference-frequency wave forces. Moreover, the structural responses of the FOWT are enormously influenced by the sum-frequency wave forces. Zhang et al. (2020) conducted the hydrodynamic analysis of the FOWTs with three different semi-submersible floating foundations considering second-order wave loads. In addition, the dynamic responses of the three semi-submersible platforms were also investigated in two water depths under various load conditions. The results showed that the resonance of the pitch motion can be dramatically excited by difference-frequency wave forces. Chuang et al. (2020) studied the effect of the slow-drift wave loads on the motion responses, the mooring system, and the structures of the 5 MW semi-submersible FOWT under different sea conditions. The results showed that the floating wind turbine is drifted away along the wave heading under the action of the mean-drift and slow-drift wave loads.
The main objective of this paper is to investigate the dynamic response of the ultra-large 15 MW FOWT under the extreme environmental condition in the South China Sea. Due to the frequent occurrences of typhoon in the South China Sea, the coupled response of 15 MW FOWT is investigated under the typhoon sea condition. Furthermore, this paper also analyzed the dynamic behaviors of the 15 MW FOWT under the ECD wind condition. The difference-frequency quadratic transfer function (QTF) is considered in the hydrodynamic analysis of 15 MW FOWT to acquire accurate results in extreme environmental conditions. This research could offer the reference about dynamic behaviors of the ultra-large 15 MW FOWT under the severe environmental conditions in the South China Sea. Besides, this paper may also contribute to further studies aimed at the ultra-large FOWT, such as the fatigue analysis and integrated optimization, making progress in the eventual application of the ultra-large FOWT in practical engineering.
Theoretical Background
The aero-hydro-servo coupled method is used for the dynamic analysis of the 15 MW FOWT. In addition, the finite element method (FEM) is used for the analysis of the mooring lines of the FOWT.
Methodology of Wave Load
Potential flow theory (Faltinsen, 1993; Teng, 2015) is used to calculate the hydrodynamics on marine structures. The viscous effect from the flow is significant for the slender structural member of the marine structures. Morison’s equation (Morison et al., 1950) is used to calculate the wave loads acting on the slender structural member to take into account the viscous effect in this paper.
Second-order wave loads are significant for the hydrodynamic problem of the moored marine structures. The solution of the second-order problems results in mean forces and forces oscillating with difference frequencies and sum frequencies in addition to the linear solution (Faltinsen, 1993). The method of calculating mean-drift wave loads includes momentum conservation in the three horizontal degrees of freedom and direct pressure integration method in HydroD (DNVGL, 2017a).
The equation of direct pressure integration method is given by (Faltinsen, 1980; Chuang et al., 2020)
where c is the waterline curve;
Second-order difference-frequency wave loads excite resonance by the non-linear interaction between the wave and the floating structure, resulting in a large slow-drift motion of the floating structure. The calculation of second-order difference-frequency wave load is described by (Faltinsen, 1993)
where
Methodology of Aerodynamic Load
Blade element momentum (BEM) theory is applied to analyze the aerodynamic load on the floating wind turbines in this paper (Hansen, 2015). BEM theory is implemented by decomposing the blade of wind turbine into multiple elements along the span (Moriarty and Hansen, 2005). And the local thrust coefficient of the individual blade elements is corrected based on the Glauert correction:
where
Wind Turbine Control Strategy
The generator variable-speed torque controller and the blade pitch controller are used in the 15 MW FOWT. In below-rated wind speeds, in order to maximize the power capture, the rotor speed is regulated to operate at the turbine’s optimal tip-speed ratio with a proportional integral (PI) controller on the generator torque (Gaertner, 2020). Within this range, the aerodynamic performance of the wind turbine is easily affected by the variation of wind speed (Li et al., 2018). In above-rated wind speeds, the rotor speed is regulated via a PI controller on the blade pitch angle, and the objective of the blade pitch controller is to regulate the rotor speed to its rated value (Gaertner, 2020). And the aerodynamic load on the wind turbine is significantly influenced by the blade pitch angle.
NPD Wind Spectrum
Currently, the API wind spectrum and NPD wind spectrum are commonly used to simulate the fluctuating wind by the offshore industry. In this paper, the NPD spectrum is chosen to simulate the actual fluctuating wind in different environmental conditions.
The Norwegian Petroleum Directorate, NPD, wind profiles, gust factors, and spectra are all defined by a single parameter. The characteristic parameter is the 1 h mean wind speed at 10 m above the sea level,
The maximum wind speed, in 1 h, averaged over ts (
where
Extreme Coherent Gust With Direction Change (ECD) Condition
According to IEC 61400-1 (International Electrotechnical Commission, 2019), the extreme coherent gust with direction change shall have a magnitude of
The wind speed shall be defined by
where
The rise in wind speed shall be assumed to occur simultaneously with the direction change
The simultaneous direction change is then given by
where
Numerical Model of the Semi-Submersible 15 MW FOWT
Wind Turbine Model
Integrated analysis of the coupled response of the FOWT is carried out in this paper. The 15 MW wind turbine model used in this paper was developed by the NREL, the Technical University of Denmark (DTU), and the University of Maine (UMaine) (Gaertner, 2020). The primary properties of the wind turbine are listed in Supplementary Table S1. “MSL” means the mean still water level.
The Floating Platform Model
The semi-submersible floating platform could be adopted in various water depths. In this paper, the UMaine VolturnUS-S reference platform (Allen et al., 2020), designed by UMaine and NREL, is utilized to support a 15 MW reference wind turbine. The detailed properties of the semi-submersible platform are shown in Supplementary Table S2. “CoG” and “CoB” mean the center of gravity and the center of buoyancy, respectively.
Mooring System
The mooring system of UMaine VolturnUS-S semi-submersible platform consists of three catenary mooring lines, which are positioned at 120° between every two mooring lines. The characteristics of the mooring system are listed in Supplementary Table S3, and the drag and mass coefficients of the mooring lines are listed in Supplementary Table S4 (Allen et al., 2020). The detailed arrangement of the mooring lines is shown in Figure 1A. The numerical models of the blades, nacelle, tower, floating platform, and mooring system are coupled in SIMA (SIMO/RIFLEX/AERODYN) (SINTEF Ocean, 2021), and the integrated numerical model of the semi-submersible 15 MW FOWT is shown in Figure 1B.
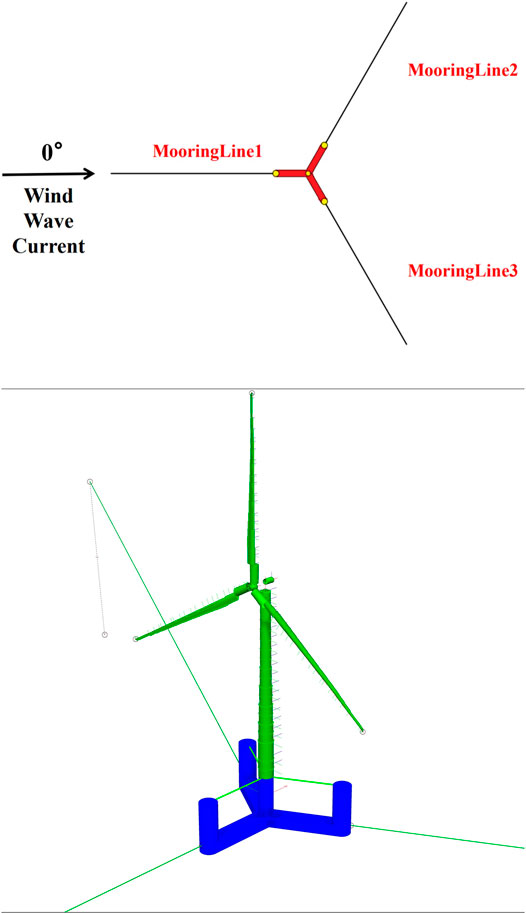
FIGURE 1. Numerical model of the semi-submersible 15 MW FOWT. (A) Detailed arrangement of the mooring lines. (B) Integrated numerical model in SIMA.
Model Verification
Free-Decay Test
This paper conducted surge and heave free-decay tests with the integrated floating wind turbine system. The purpose is to acquire information about the natural frequencies of the motion and the damping behaviors of the integrated FOWT numerical model. In this paper, the duration of the surge free-decay test is 500s, and the heave free-decay test lasts 100s. The time steps of the free-decay tests are both 0.5s. The initial values of the surge and heave displacements are, respectively, 30 and 5 m. The results of the free-decay tests show that the natural frequencies of the motion of the numerical model are basically consistent with the results from the NREL (Allen et al., 2020). Good agreement of the results is shown in Figures 2A,B.
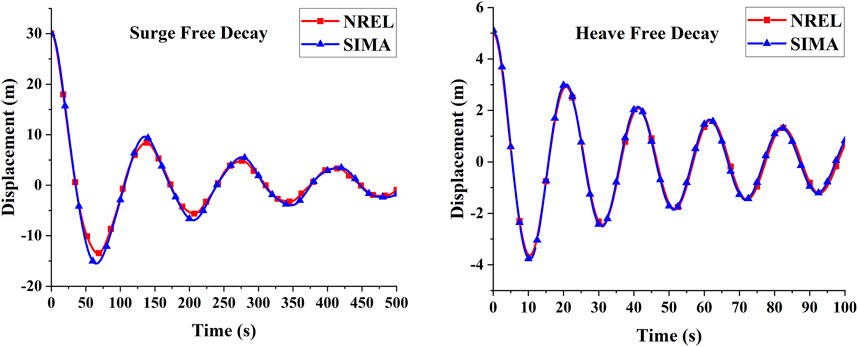
FIGURE 2. Results of the free-decay test. (A) Surge decay test. (B) Heave decay test.
Convergence Study of the Platform Mesh Resolution
Both potential force and viscous effect are taken into consideration in this numerical model of the platform. The panel model and Morison model are used to calculate the hydrodynamic loads of the FOWT. The panel model is applied to the columns and pontoons of the substructure. And the Morison model is used for the estimation of the viscous effect of the fluid on the slender horizontal braces. Figure 3A shows the hydrodynamic model of the semi-submersible platform.
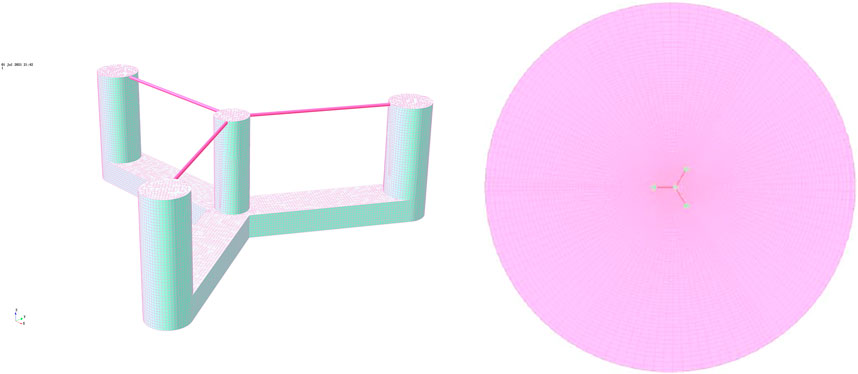
FIGURE 3. Mesh models of hydrodynamic analysis. (A) Selected mesh models of the semi-submersible platform. (B) Free surface mesh for QTF calculation.
To ensure the accuracy of the panel models, the convergence study is carried out in this paper. Three different meshes are tested in this paper. Information of the meshes is introduced in Supplementary Table S5. Surge, heave, and pitch motion responses of three mesh models are compared and analyzed with different wave directions, and the results of the convergence study with the 0-degree and 60-degree incoming wave directions are shown in Figures 4A–F.
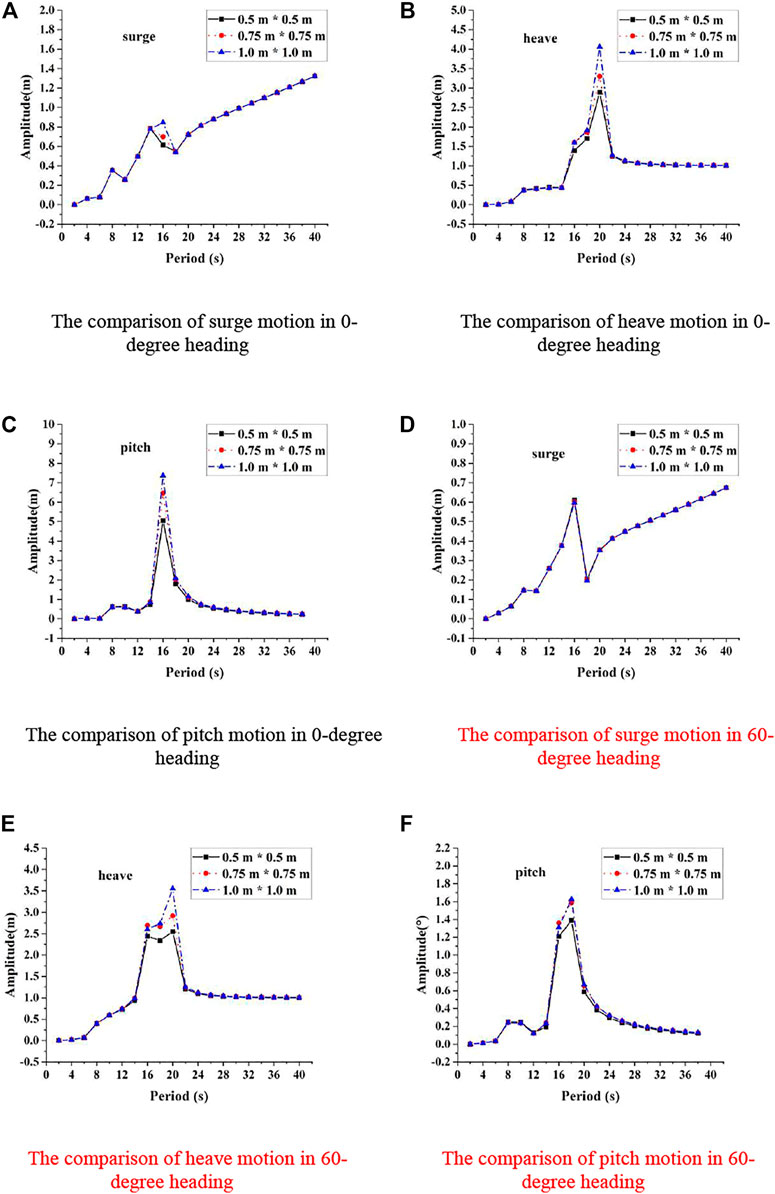
FIGURE 4. Comparison of the motion responses of three kinds of mesh models in the frequency domain with 0-degree and 60-degree incoming wave directions. (A) Comparison of surge motion in 0-degree heading. (B) Comparison of heave motion in 0-degree heading. (C) Comparison of pitch motion in 0-degree heading. (D) Comparison of surge motion in 60-degree heading. (E) Comparison of heave motion in 60-degree heading. (F) Comparison of pitch motion in 60-degree heading.
For the surge motion, the predicted values of the three models are basically the same. It can be observed from Figure 4C that the predicted values of pitch motion for model 1 have a lower peak. And as shown in Figure 4B, model 3 predicts a higher peak value of the heave motion because of the coarse mesh. In addition, the calculation of model 1 takes a lot of time due to the huge number of meshes. Therefore, taking into account all factors to ensure the efficiency and accuracy of the calculation, model 2 is selected for further study in this paper, as shown in Figure 3A.
Subsequently, first-order exciting forces from the diffraction potential of the platform model are computed in WADAM (DNVGL, 2017b) in this paper. Compared with the reference data from WAMIT (WAMIT and Technology, 2021) provided by the NREL (Allen et al., 2020), the first-order wave excitation coefficients from WADAM are basically consistent with the reference data in three-degree-of-freedom directions, as shown in Figure 5, indicating that the hydrodynamic performance of substructure model established in this paper is reliable.
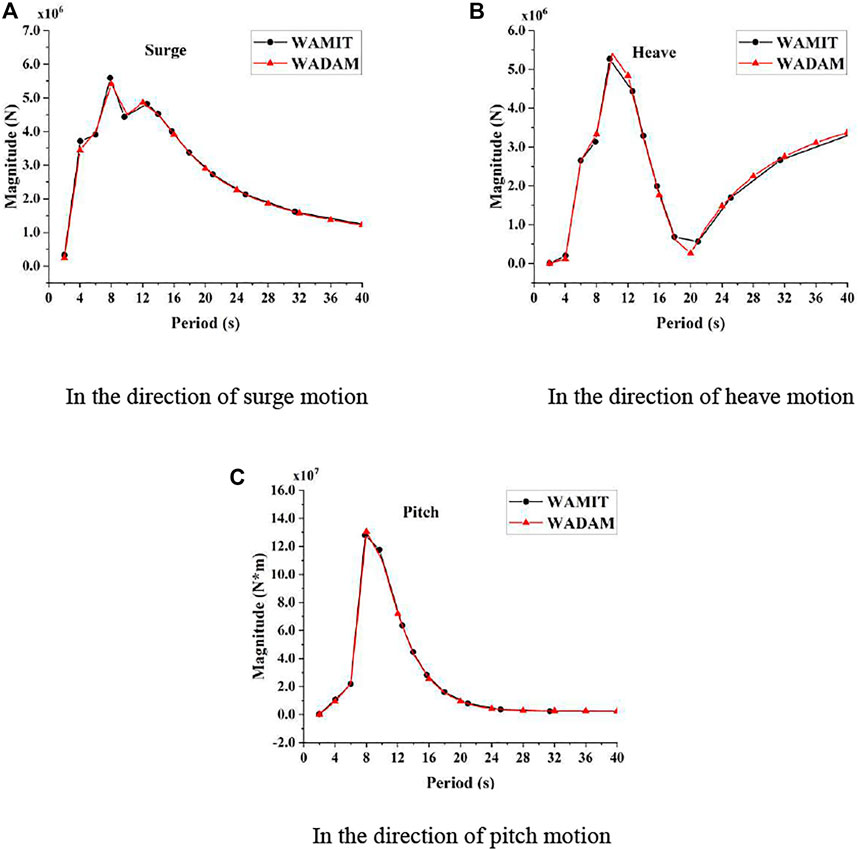
FIGURE 5. Magnitude of the force in the direction of (A) surge motion, (B) heave motion, and (C) pitch motion of the FOWT.
Based on the above, the free surface needs to mesh in the difference-frequency QTF calculation. In this paper, the diameter of the free surface area with about 9,936 panels, which should be about 5–10 times the characteristic length of the floating structure (DNVGL, 2017b), is about eight times the characteristic length of the platform model, meeting the requirements of the calculation, as shown in Figure 3B. Accordingly, the partial motion and force results of the difference-frequency QTF are demonstrated for a 0-degree wave heading in Figure 6. The term “Force 3” denotes the forces on the floating foundation in the direction of heave motion.
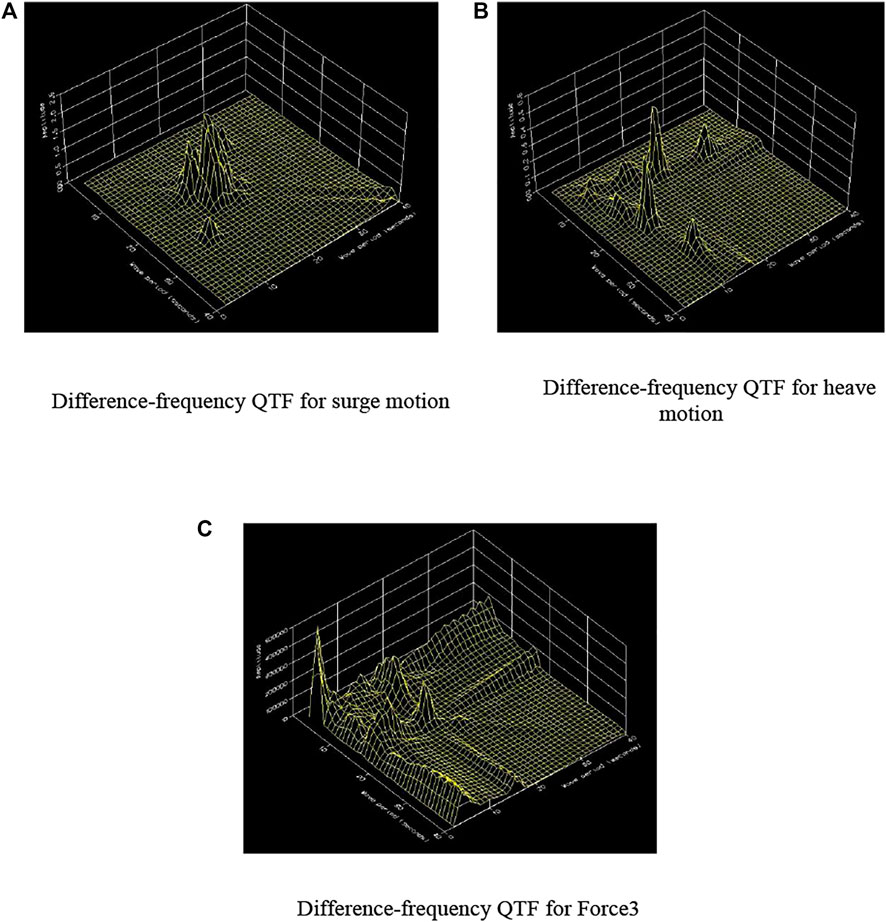
FIGURE 6. QTF of the semi-submersible platform with the zero-degree incoming wave direction. (A) Difference-frequency QTF for surge motion. (B) Difference-frequency QTF for heave motion. (C) Difference-frequency QTF for Force 3.
Design Load Cases
Five environmental conditions are studied in this paper. Detailed environmental information is shown in Supplementary Table S6. The terms “LC1,” “LC2,” and “LC3” represent the moderate sea state, the extreme sea state with a return period of 100 years, and the typhoon sea state in the South China Sea, respectively. The LC1 condition is determined based on the joint probability distributions of average annual significant wave height and average wave period provided by Wen et al. (2018). And the LC2 and LC3 conditions refer to the suggestion offered by DNV-OS-E301 (DNVGL, 2020). The terms “LC4” and “LC5” represent the moderate sea state with the normal turbulent wind condition and the ECD wind condition, respectively. The propagation directions of the wave, wind, and current are all 0°.
Results and Discussion
In this paper, the dynamic responses of the integrated 15 MW FOWT under several sea states are studied. The motion responses in the six-degree-of-freedom directions and the axial forces of mooring lines are analyzed and discussed under the moderate sea state, extreme sea state, and typhoon sea state. And the structural dynamic responses of the 15 MW FOWT under different sea states are also presented, such as the tower base fore-aft bending moments, tower top x-direction displacements, and blade root flapwise moments. Furthermore, the influences of difference-frequency QTF on the dynamic responses of the 15 MW FOWT are investigated. The coupled responses of the FOWT in the normal wind condition and ECD wind condition are also discussed in this paper.
The Effect of the Difference-Frequency QTF
The Effect on Motion Responses
Statistical analysis of the motion responses in the time domain of the FOWT is presented in Figures 7A–F, which shows the effect of the difference-frequency QTF on the motion of the FOWT in all degree-of-freedom directions under different sea states. The maximums of the surge and sway motions under the typhoon sea state are much larger than those without considering the difference-frequency QTF. The standard deviation of the surge motion under the typhoon sea state considering the difference-frequency QTF is 11.656 m, which is about 3.85 times the amount of that without considering the difference-frequency QTF.
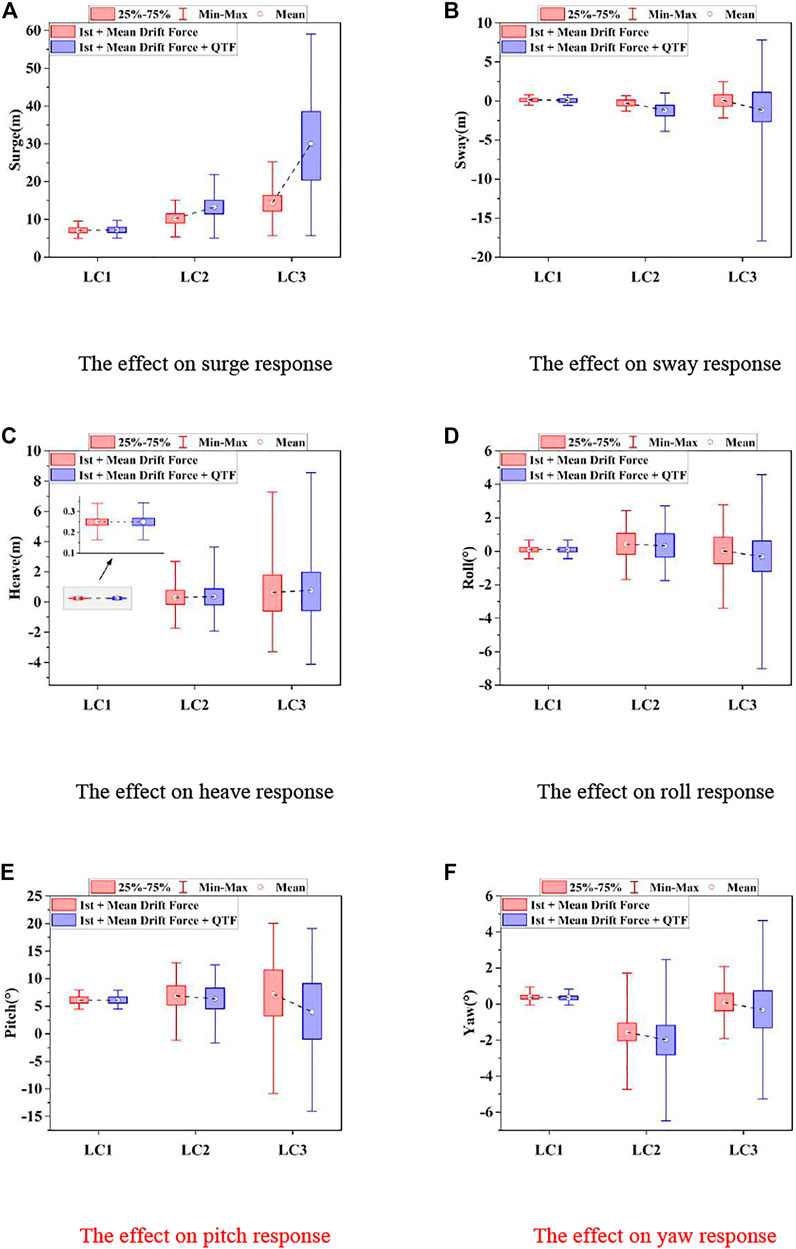
FIGURE 7. Statistical results of the effect of the difference-frequency QTF on motion responses. (A) Effect on surge response. (B) Effect on sway response. (C) Effect on heave response. (D) Effect on roll response. (E) Effect on pitch response. (F) Effect on yaw response.
In addition, the maximal offset of the sway motion in the negative direction is -17.875 m in the typhoon condition, which is approximately eight times the magnitude of that without the difference-frequency QTF. The standard deviation (STD) of the sway motion is four times as large as that without considering the difference-frequency QTF. Moreover, it can be observed in Figures 7C,D that the difference-frequency QTF also makes the roll motion and yaw motion of the FOWT more severe under the typhoon sea state. All these illustrate that the effect of the difference-frequency QTF on the movement of 15 MW FOWT should be emphasized under the non-linear typhoon sea state.
The Effect on the Axial Force Response of the Mooring Lines
The effect of the difference-frequency QTF on the axial forces of the mooring lines is also analyzed in this paper, as shown in Figure 8A.
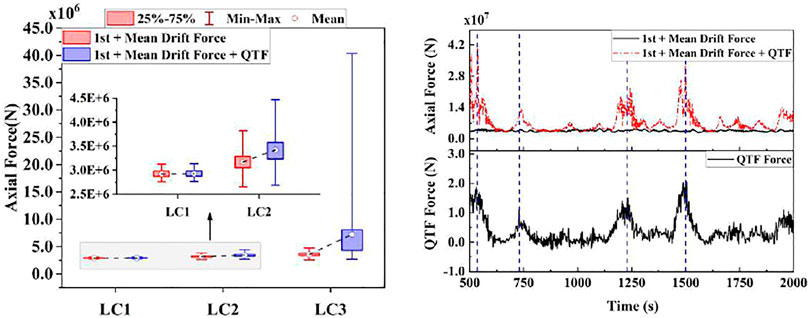
FIGURE 8. Effect of the difference-frequency QTF on ML1 axial force response. (A) Statistical results. (B) Time-domain curves of the ML1 tension and QTF force.
The STD value of the axial forces of ML1 under the typhoon condition is 4,797.374 kN, which is 14 times the magnitude of that without difference-frequency QTF. This illustrates that the axial forces of the mooring lines of the FOWT increase greatly, and the fluctuation of the axial forces is more severe when considering the difference-frequency QTF. Figure 8B shows the time-history curves of the axial forces of ML1 under the typhoon condition with and without the difference-frequency QTF and the time-history curves of the QTF forces for the difference-frequency wave loads under the typhoon sea state. It can be observed in Figure 8B that the axial forces of ML1 with difference-frequency wave load increase sharply in the region of 500s, 750s, 1250s, and 1500s in the time-domain simulation process, and the positions where the axial force of ML1 reaches the maximum are basically consistent with those where the QTF force reaches the maximum in these curves. Furthermore, the trend of the two curves is very similar. These indicate that the difference-frequency QTF forces have an important impact on the axial force of the mooring lines under the typhoon sea state.
The Effect on the Structural Dynamic Responses
Figure 9 shows the comparison between the tower base fore-aft bending moment responses, tower top x-direction displacements, and blade root flapwise moment responses of the FOWT with and without the difference-frequency wave loads under three sea states. It can be found in Figure 9 that the mean value of the tower top x-direction displacement increases, and the STD value of that decreases when considering the difference-frequency QTF, indicating that the coupling effect of the difference-frequency wave forces and aerodynamic loads makes the mean value of the offset at the top of the tower larger, but the vibration of the tower of the wind turbine becomes relatively moderate. In addition, from Figure 9, it can be seen that the difference-frequency wave forces have little influence on the tower base fore-aft moment of the FOWT under all three sea conditions. The effect of difference-frequency wave loads on the blade root flapwise moments is not apparent either.
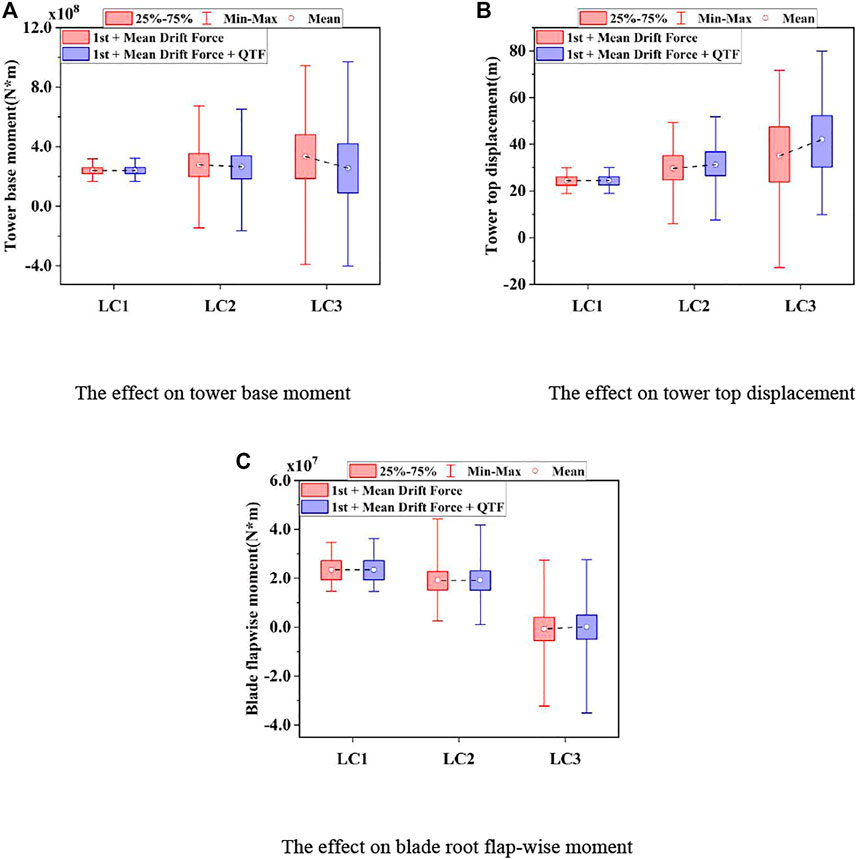
FIGURE 9. Statistical results of the effect of the difference-frequency QTF on the structural dynamic response. (A) Effect on tower base moment. (B) Effect on tower top displacement. (C) Effect on blade root flapwise moment.
The Motion Response of the 15 MW FOWT Under Three Different Sea States
The time-domain motion responses of the FOWT are presented in Figure 10. The total simulation time is 2000s, and the first 500s of the time-domain simulation results have not been considered in order to eliminate the transient effect at the beginning of the time-domain simulation.
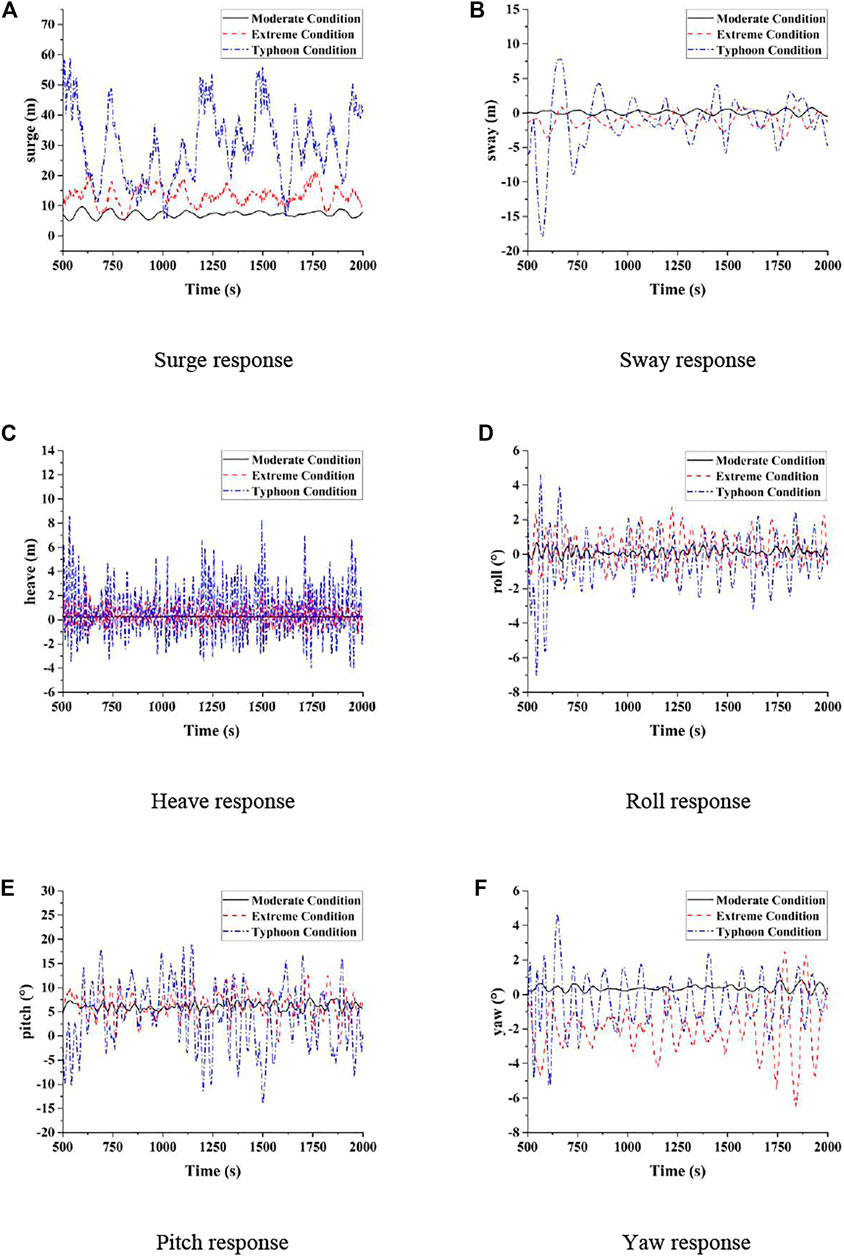
FIGURE 10. Motion responses of the 15 MW FOWT under three different sea states. (A) Surge response. (B) Sway response. (C) Heave response. (D) Roll response. (E) Pitch response. (F) Yaw response.
According to the time-history curves of the surge motion, the extreme values of the surge motion of the FOWT under the typhoon condition are much higher than those under the moderate condition, and the maximal amplitude of the surge responses under the typhoon condition is 59 m. In comparison, the maximal amplitude of the surge motion under the moderate condition is 9.7 m. This reflects that the surge motion of 15 MW FOWT is much more violent under typhoon than under the moderate condition. Obviously, the typhoon condition influences the longitudinal motion of the 15 MW floating wind turbine significantly.
With respect to the sway motion response, the maximal value of the lateral movement of the FOWT under the typhoon condition is 17.87 m away from the initial equilibrium position, which is 23 times as large as the maximal value of that under the moderate condition, demonstrating that the lateral movement of the offshore wind turbine is more dramatic in the typhoon sea condition.
For the heave motion, the STD value of the heave responses under LC3 is 1.999 m, which is 72.5 times the magnitude of that under LC1, indicating that the heave motion of 15 MW FOWT in the typhoon condition is much more dramatic, compared with that in the moderate condition.
In addition, since the semi-submersible platform of 15 MW FOWT is the symmetrical structure, the mean values of sway, roll, and yaw motions do not become much larger, while the fluctuation of those motion responses is more drastic.
The Axial Force of Mooring Lines Under Three Different Sea States
The mooring system is used to control the position of the FOWT, in order to ensure that the FOWT can still maintain its equilibrium position and operate normally under the wind–wave coupling action. If the wind loads and wave loads are extremely violent, the axial forces of the mooring lines will become too large, and it is likely to cause the breakage failure of the mooring lines, leading to serious collision accidents consequently (Ma et al., 2020). The axial forces of the mooring lines are studied in the time-domain simulation in this paper, as shown in Figures 11A,B.
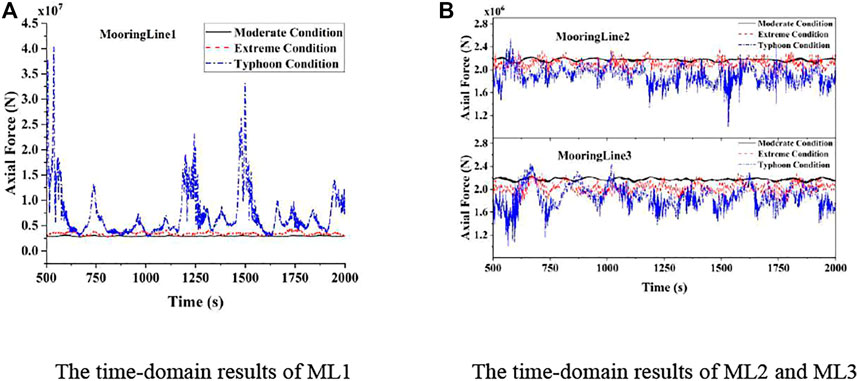
FIGURE 11. Axial force of mooring lines under three different conditions. (A) Time-domain results of ML1. (B) Time-domain results of ML2 and ML3.
It can be observed from Figure 11A that the snap tension of the windward ML1 occurs several times under the LC3 condition. The maximum of the axial forces on ML1 is 40,322.5 kN under the LC3 condition in the time-domain simulation process, which is 12 times the maximum of that under the LC1 condition. In the LC3 condition, the extreme value of the axial forces on ML1 is also much larger than that in the LC1 condition. The STD value of the axial forces on ML1 is 67 times the value of that in the LC1 condition, indicating that the fluctuation of the axial force on ML1 is extremely drastic in the LC3 condition, which poses a great threat to the safety of the mooring system and the stability of the 15 MW FOWT. Therefore, it is necessary to analyze the strength of the mooring lines not only under the environmental load with the highest probability of occurrence but also under the ultimate load.
The Structural Dynamics of 15 MW FOWT Under Three Different Sea States
The harsh marine climate environment will threaten the structural safety of the 15 MW FOWT. In order to ensure the safety of the structure, it is necessary to study the dynamic responses of the critical structural parts of the FOWT under the extreme sea state and typhoon sea state. The time-domain analysis and statistical analysis of the tower base fore-aft bending moment, tower top x-direction displacement, and blade root flapwise bending moment are carried out in this paper, as shown in Figures 12A–C.
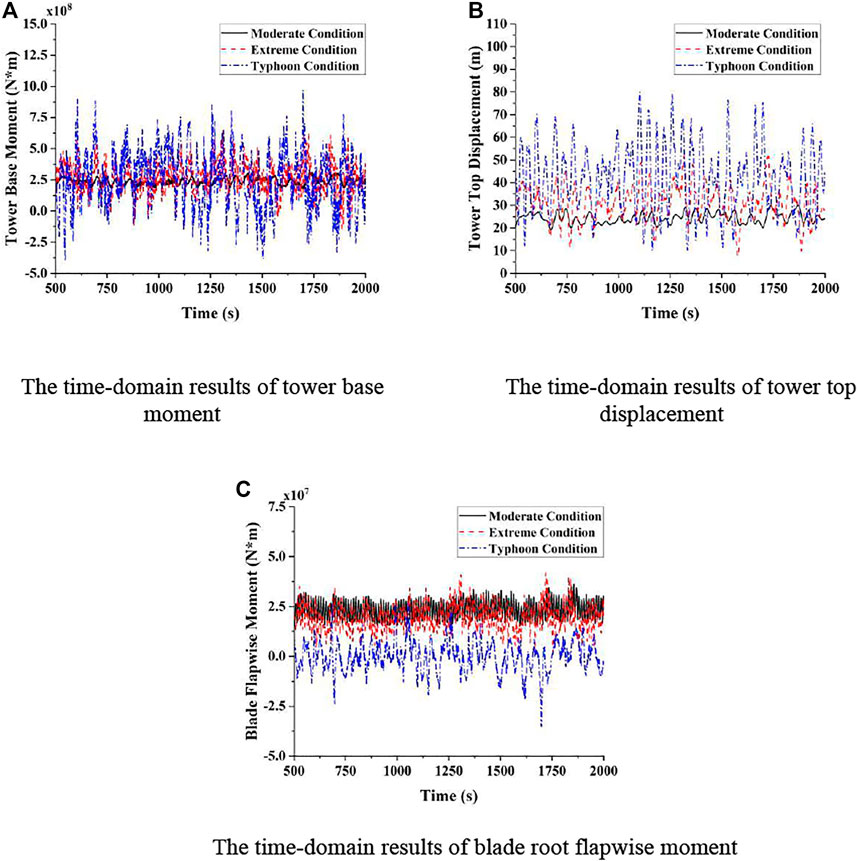
FIGURE 12. Structural response of the 15 MW FOWT under three different sea states. (A) Time-domain results of the tower base moment. (B) Time-domain results of the tower top displacement. (C) Time-domain results of the blade root flapwise moment.
For the whole tower structure of the FOWT, the bending moment at the bottom of the tower is the largest. Hence, the tower base fore-aft bending moment response of the FOWT is analyzed in this paper to determine whether the tower structure will be damaged under the typhoon sea condition. Regarding the tower base bending moment, the mean amplitudes of the time-domain results are similar in the LC1, LC2, and LC3 conditions, while the STD value in the LC3 condition is 8.46 times the STD value in the LC1 condition. The extreme value change of the tower base bending moment under LC3 is much more significant than that under LC1, indicating that the vibration of the tower structure becomes much more drastic under the typhoon sea state. The drastic vibration of the tower poses a great threat to the structure of the FOWT, and the risk of damage to the 15 MW FOWT under the typhoon sea state is greater.
The tower top x-direction displacement responses of the 15 MW FOWT are analyzed under three different kinds of sea states in the time domain in this paper. As can be seen from Figure 12B, compared with LC1 and LC2, the mean amplitude of the tower top x-direction displacement response is larger under the action of the typhoon sea state. In addition, the STD value of the tower top displacement response under LC3 is 6.3 times the STD value of that under LC1, which indicates that the tower top displacement response is more unstable and the displacement of the nacelle of the 15 MW FOWT is significantly intensified under the typhoon condition. It can be seen that the typhoon sea state has a significant effect on the tower top x-direction displacement of the 15 MW FOWT.
The blade is the very critical structural component of the FOWT, which affects the aerodynamic load on the FOWT. Because the bending moment at the root of the blade is the largest in the whole blade and the direction of the wind load is 0°, this paper focuses on analyzing the blade flapwise bending moment at the joint connecting with the hub in various sea conditions. It can be observed from Figure 12 that the mean value of the blade root flapwise bending moment under LC1 is much larger than the mean value of that under LC2 and LC3. This is because the FOWT is in the shutdown state in the LC2 and LC3 conditions, and the blade pitch controller of the FOWT takes effect. The blade pitch angle of the FOWT changes to 90° to withstand the severe environmental loads better under LC3, and the change of the pitch angle under LC2 is not as large as the change of that under LC3. The feathering of the blades in the shutdown state greatly reduces the aerodynamic load on the blade of the wind turbine, so the mean value of the blade root flapwise bending moment under the moderate condition is larger than the mean value of that under the extreme condition and typhoon condition. However, the STD value of the flapwise bending moment response under LC3 is 1.73 times the value of that under LC1, which indicates that the blade root flapwise bending moment response varies more drastically in the typhoon condition than in the moderate condition. It can be seen that the change of the blade pitch angle of the FOWT will significantly affect the aerodynamic load on the blade and thus influence the corresponding dynamic response of the integrated FOWT.
Dynamic Response of 15 MW FOWT Under Normal Wind Condition and ECD Wind Condition
The dynamic responses of the 15 MW FOWT in the normal wind condition (LC4) and ECD wind condition (LC5) are investigated and compared in this paper. The total simulation time is 2000s, and the ECD wind condition occurs at 1000s of the time-domain simulation. In order to exclude the transient effect at the beginning of the time-domain simulation, the first 500s of the simulation results are not considered in this part. According to the definition of ECD wind condition in IEC 61400-1 (International Electrotechnical Commission, 2019), the rise time of ECD condition is 10 s, the variation of the wind velocity under the ECD condition is 15 m/s, and the maximal angle of the wind direction under gust conditions is 67.989°. The reference wind speed is 50 m/s in this paper.
The Motion Responses
Figure 13 shows the time-history curves of the motion responses of the 15 MW FOWT under LC4 and LC5. After the 1000s of the time-domain simulation, the surge motion of the FOWT is significantly reduced, while the amplitude of the sway motion increases greatly in the ECD wind condition. Supplementary Table S7 presents that the mean value of the sway motion under LC5 is about 28 times that under LC4. And the FOWT shows more obvious roll and yaw motion responses under LC5, as can be seen in Figure 13. In addition, affected by the sharp variation of the wind speed and direction in the ECD wind condition, the pitch motion response of the FOWT shows a temporary increase followed by a decrease. As for the heave motion response, the ECD wind condition has little influence on the heave motion of the FOWT.
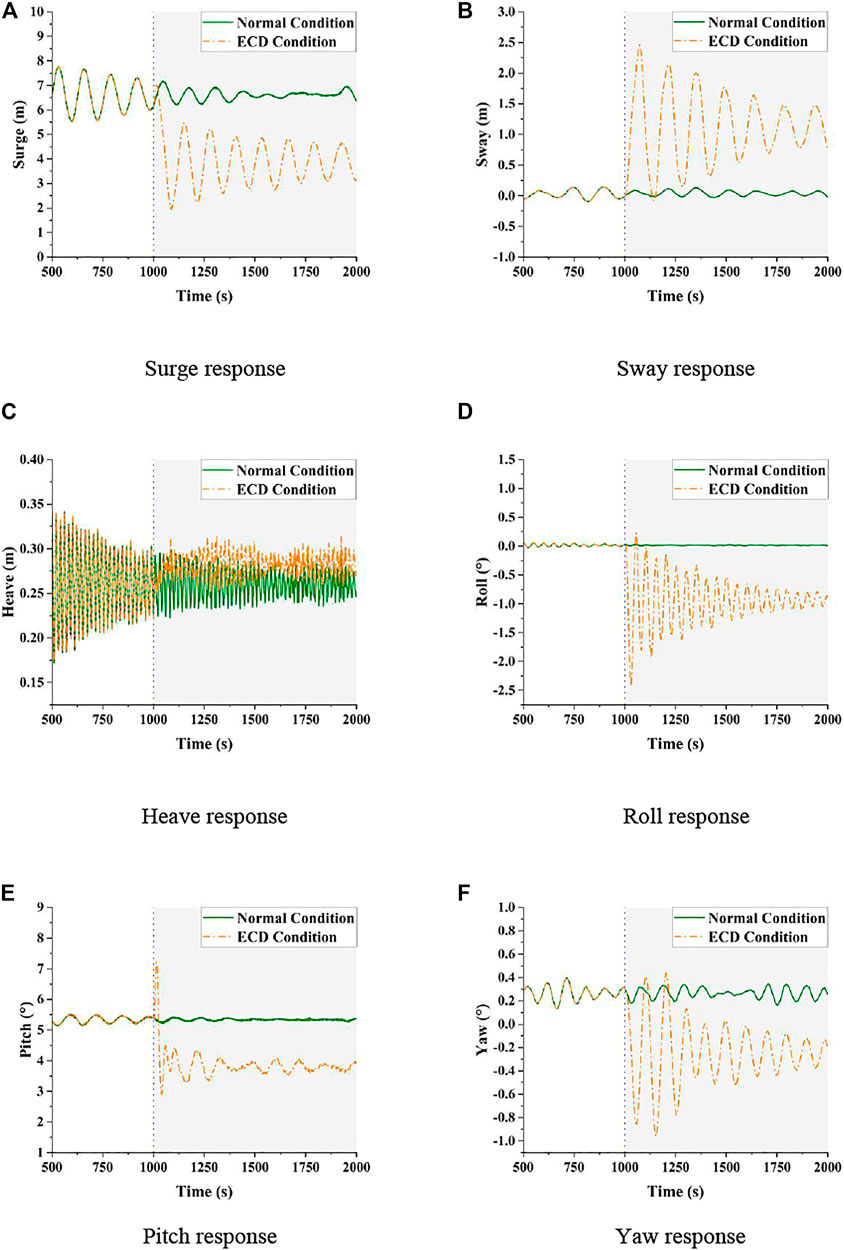
FIGURE 13. Motion response of the 15 MW FOWT under the normal condition and ECD condition. (A) Surge response. (B) Sway response. (C) Heave response. (D) Roll response. (E) Pitch response. (F) Yaw response.
From the above discussion, it can be known that the sharp changes of the wind speed in the ECD condition make the motion response of the FOWT more drastic, and the changes of the wind direction cause the FOWT to move significantly more in the corresponding direction.
The Axial Force Responses of the Mooring System
Figure 14 depicts the time-history curves of the axial force of the mooring lines under the normal wind condition (LC4) and ECD wind condition (LC5), and Supplementary Table S8 lists the statistical results of the axial force response of the mooring lines under LC4 and LC5. It is presented in Figure 14 that, after the ECD wind condition occurs, the axial force response of ML1 initially rises briefly and then drops rapidly and fluctuates. Owing to the change of the wind heading in the ECD condition, the mean value of the axial force of ML1 is reduced by 197.301 kN. Moreover, the standard deviation value of the axial force response on ML1 under LC5 is about five times that under LC4, which demonstrates that the axial force response of ML1 changes more drastically in the ECD wind condition.
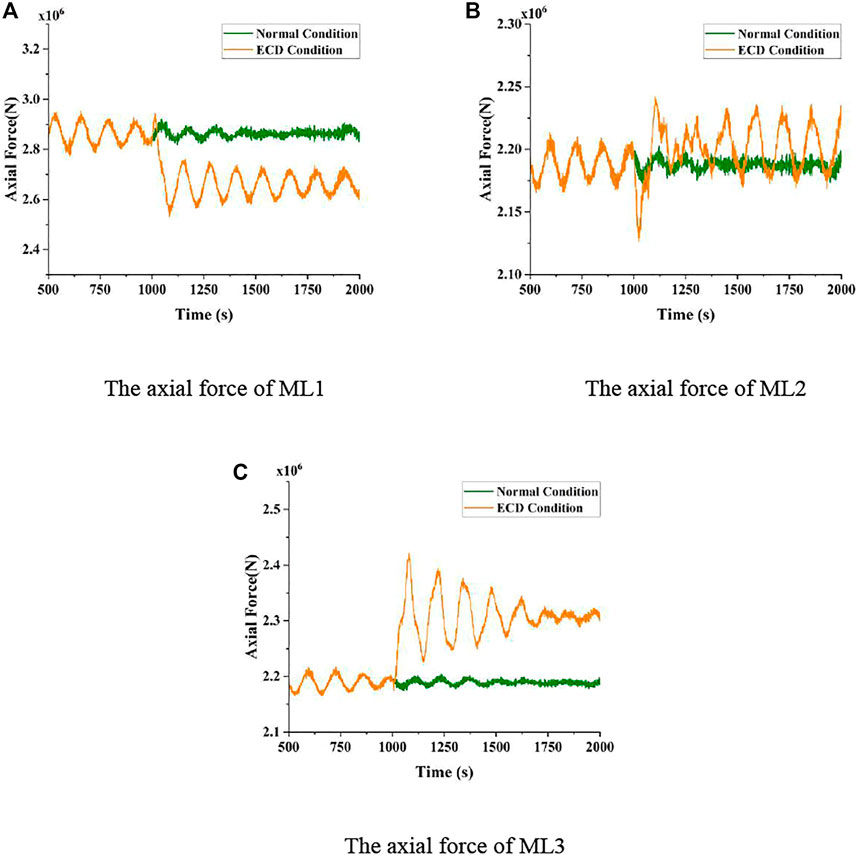
FIGURE 14. Axial force response of mooring lines of the 15 MW FOWT under the normal condition and ECD condition. (A) Axial force of ML1. (B) Axial force of ML2. (C) Axial force of ML3.
For ML2, after the ECD wind condition occurs, the axial force response curve of ML2 under LC5 tends to fall sharply initially and then rises rapidly and fluctuates dramatically. This is because the wind direction changes by 67.989° under the ECD wind condition, which makes the FOWT perform reciprocation in the transverse direction. Due to the reciprocating motion, the axial force response curve of ML2 under LC5 presents a trend of violent fluctuation. In addition, the axial force on ML2 increases by 105.355 kN from the minimum to the maximum in a short time under the ECD condition, which would significantly affect the safety of the mooring lines.
It can also be found from Figure 14 and Supplementary Table S8 that, after the occurrence of the ECD wind condition, the axial force response of ML3 increases dramatically by approximately 227.288 kN under LC5. The STD value of the axial force on ML3 under LC5 is eleven times that under LC4, which illustrates that the ECD wind condition makes the axial force response of ML3 change very drastically.
Thus, under the ECD wind condition, the sharp increase and violent fluctuation of the axial force response of the mooring lines may lead to the breakage and failure of the mooring system of the 15 MW FOWT and affect the safe operation of the FOWT.
The Structural Dynamic Responses
When the ECD wind condition occurs, the aerodynamic load on the FOWT will also change due to the changes of the wind speed and the wind direction. The tower base fore-aft bending moment, tower top x-direction displacement, and blade root flapwise bending moment responses of the FOWT are investigated under LC4 (normal wind condition) and LC5 (ECD wind condition) in this paper. Figure 15 describes the time-domain results of the three structural dynamic responses under LC4 and LC5, and their statistical values are shown in Supplementary Table S9.
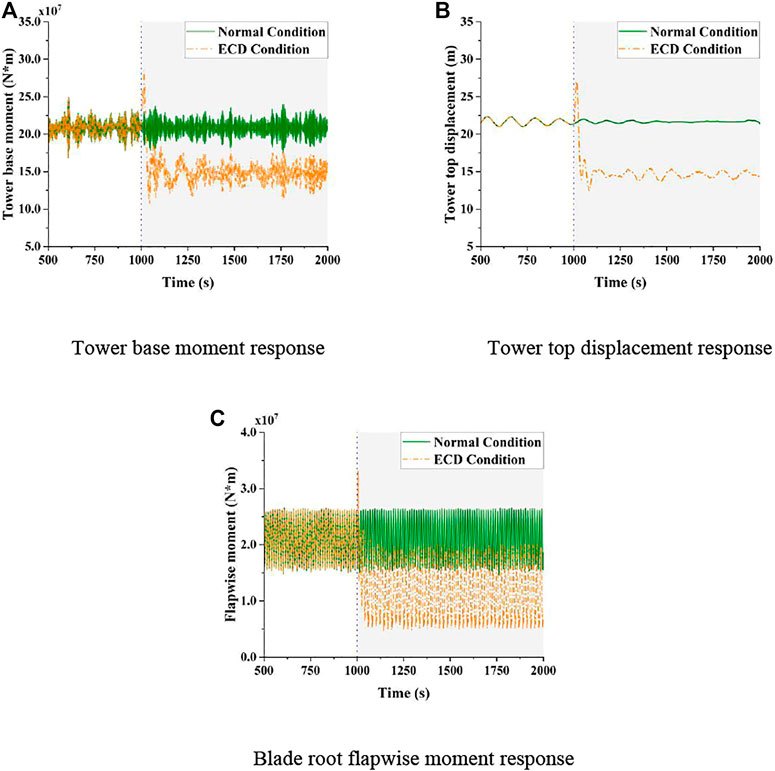
FIGURE 15. Structural dynamic response of the 15 MW FOWT under the normal condition and ECD condition. (A) Tower base moment response. (B) Tower top displacement response. (C) Blade root flapwise moment response.
During the rise time at the beginning of the ECD wind condition, the tower base fore-aft bending moment increases by about 77,499 kN*m, the tower top x-direction displacement increases by 5.403 m, and the blade root flapwise bending moment increases by 121.353 kN*m under LC5. This indicates that, during the rise time of the ECD wind condition, three structural responses show a transient growth due to the change of the wind speed within a short time, resulting in a similar effect to the impact load (Ma et al., 2020). After the ECD wind condition, the change of the wind direction of the ECD wind condition causes the tower base fore-aft bending moment response, the tower top x-direction displacement, and the blade root flapwise bending moment responses to become smaller under LC5. In addition, the STD values of the three structural responses of the FOWT under LC5 all increase, which illustrates that the ECD wind condition makes the three structural responses of the 15 MW FOWT change more dramatically. In particular, the STD value of the tower top x-direction displacement is 14 times the STD value of that under LC4.
It can be seen that the dynamic responses of the 15 MW FOWT in the original wind direction become weak under the ECD wind condition, and the dynamic responses of the FOWT in the changed wind direction are intensified. In addition, due to the short rise time of the ECD wind condition, the ECD wind condition has an effect similar to the impact load on the structural response of the FOWT, which will affect the structural safety of the FOWT and the normal operation of the wind turbine.
Conclusion
In this paper, the dynamic performance of the integrated 15 MW FOWT under severe environmental conditions is investigated, including the motion responses, the axial forces of mooring lines, and the dynamic behaviors of the blades and tower. The effect of ECD condition on the 15 MW FOWT under the operating state is also studied. In addition, the difference-frequency wave loads are taken into account in the hydrodynamic analysis of the floating wind turbine. The conclusions can be drawn in the following aspects:
1) The difference-frequency QTF has little effect on the dynamic response of the 15 MW FOWT under the moderate sea state. However, in the extreme sea state and especially the typhoon sea state, the difference-frequency wave force has a significant influence on the motion response of the FOWT. Under the typhoon sea condition, the difference-frequency QTF significantly affects the surge motion and the sway motion response of the FOWT, making the roll motion and yaw motion of the FOWT more drastic as well. The axial force of ML1, which mainly limits the movement of the FOWT and bears most of the environmental load, increases considerably and fluctuates very drastically under the typhoon sea condition when considering the difference-frequency QTF. The axial force response of the other two mooring lines is also affected and becomes more unstable. For the structural dynamic behavior of the 15 MW FOWT, the difference-frequency QTF has little effect on them, especially for the tower base fore-aft bending moment response. Therefore, in the moderate sea condition, the dynamic response of the 15 MW FOWT will not be greatly affected without considering the second-order difference-frequency wave load. However, for the typhoon sea state, if the effect of the difference-frequency wave load is neglected, the accuracy of the dynamic response results of the FOWT will be significantly affected, especially for the motion of the floating substructure and the axial force of the mooring system, which will be underestimated.
2) The dynamic response of the FOWT under the typhoon sea state is very different from the dynamic responses under the moderate condition and extreme condition. The amplitude of the surge, sway, and heave motion responses of the FOWT is amplified in the typhoon condition, especially for the surge motion. The mean amplitudes of the roll and yaw motions change little due to the symmetry of the semi-submersible platform. And the mean value of the pitch motion is even smaller due to the less aerodynamic load caused by the shutdown state and blade feathering of the wind turbine, but the fluctuation of the roll, pitch, and yaw motions is more dramatic in the typhoon condition. For the mooring system under the typhoon sea state, the snap tension of the windward ML1 occurs several times under the typhoon sea condition. ML2 and ML3 can be relaxed, and the mean values of the axial force of both decrease, but the fluctuation of the axial force response amplitude of those is more dramatic. In addition, for the structural responses of the FOWT, it can be seen from the STD values that all the three structural dynamic responses studied in this paper fluctuate more drastically under the typhoon sea state. This illustrates that the blades and tower of the wind turbine oscillate more violently under the typhoon condition, leading to that these structures are more likely to be damaged. And the stable operation of the nacelle and the safety of the construction of the wind turbine will be greatly influenced owing to the more dramatic fluctuation of the tower top displacement. Therefore, for the typhoon-prone sea areas, such as the South China Sea, it is necessary to investigate the dynamic response of the ultra-large FOWT in the typhoon sea condition to ensure the stability and structural integrity of the FOWT under the typhoon sea condition, and to avoid the damage and cause significant losses.
3) The ECD wind condition has a remarkable impact on the 15 MW FOWT. In this paper, after the occurrence of the ECD wind condition, the motion responses of the FOWT change significantly, and the variation of the motion responses is more dramatic, except for the heave motion. The effect of the ECD wind condition on the heave motion response is relatively slight. The axial response of ML1 decreases rapidly and fluctuates more dramatically influenced by the ECD wind condition, and the axial force responses of ML2 and ML3 increase significantly in a short time and have a great fluctuation under the action of the ECD wind condition. For the structural response of the 15 MW FOWT, under the action of the ECD wind condition, the sharp change of the wind speed within a short period of time has a similar effect to the impact load on the structure of the FOWT, and the structure has a transient response. It can be seen that the ECD wind condition will make the motion amplitude of the FOWT increase rapidly in the changed wind direction, and the mooring line that restricts its movement will also bear a greater axial force, causing a larger force to be exerted on the mooring line and the structure for a short time, which to some extent threatens the stability and safety of the structure and normal operation of the 15 MW FOWT.
Data Availability Statement
The raw data supporting the conclusions of this article will be made available by the authors, without undue reservation.
Author Contributions
ZC put forward the idea and the research approach. SL and ZH developed the numerical model of the FOWT and carried out the dynamic analysis. CL, YQ and XL offered the suggestion and help during the process of model establishment and calculation. ZC and SL wrote the original manuscript. All authors have read and agreed to the published version of the manuscript.
Funding
This research was funded by the Dalian Science and Technology Innovation Fund Project (No. 2020JJ25CY016) and State Key Laboratory of Coastal and Offshore Engineering Fund (LP2115).
Conflict of Interest
The authors declare that the research was conducted in the absence of any commercial or financial relationships that could be construed as a potential conflict of interest.
Publisher’s Note
All claims expressed in this article are solely those of the authors and do not necessarily represent those of their affiliated organizations, or those of the publisher, the editors, and the reviewers. Any product that may be evaluated in this article, or claim that may be made by its manufacturer, is not guaranteed or endorsed by the publisher.
Supplementary Material
The Supplementary Material for this article can be found online at: https://www.frontiersin.org/articles/10.3389/fenrg.2022.874438/full#supplementary-material
References
Allen, C., Viscelli, A., Dagher, H., Goupee, A., Gaertner, E., Abbas, N., et al. (2020). Definition of the UMaine VolturnUS-S Reference Platform Developed for the IEA Wind 15-Megawatt Offshore Reference Wind Turbine. Golden, CO (United States): National Renewable Energy Lab.NREL.
API American Petroleum Institute (2005). Design and Analysis of Stationkeeping System for Floating Structures. Washington, DC: API Publishing Services.
Campanile, A., Piscopo, V., and Scamardella, A. (2018). Mooring Design and Selection for Floating Offshore Wind Turbines on Intermediate and Deep Water Depths. Ocean Eng. 148, 349–360. doi:10.1016/j.oceaneng.2017.11.043
Chuang, Z., Liu, S., and Lu, Y. (2020). Influence of Second Order Wave Excitation Loads on Coupled Response of an Offshore Floating Wind Turbine. Int. J. Naval Architecture Ocean Eng. 12, 367–375. doi:10.1016/j.ijnaoe.2020.01.003
Faltinsen, O. M. (1980). “Prediction of Resistance and Propulsion of a Ship in a Seaway,” in Proceedings of the 13th symposium on naval hydrodynamics, Tokyo.
Faltinsen, O. (1993). Sea Loads on Ships and Offshore Structures. Cambridge: Cambridge University Press.
Gaertner, E. (2020). Definition of the IEA Wind 15-megawatt Offshore Reference Wind Turbine. Tech. Rep. National Renewable Energy Laboratory Golden, CO) NREL/TP-5000-75698.
Han, Y., Le, C., Ding, H., Cheng, Z., and Zhang, P. (2017). Stability and Dynamic Response Analysis of a Submerged Tension Leg Platform for Offshore Wind Turbines. Ocean Eng. 129, 68–82. doi:10.1016/j.oceaneng.2016.10.048
Hsu, W.-T., Thiagarajan, K. P., and Manuel, L. (2017). Extreme Mooring Tensions Due to Snap Loads on a Floating Offshore Wind Turbine System. Mar. Structures 55, 182–199. doi:10.1016/j.marstruc.2017.05.005
International Electrotechnical Commission (2019). Wind Energy Generation Systems-Part 1: Design Requirements. Switzerland: International Electrotechnical Commission.
Lee, D.-C., Cho, S., Yang, H.-I., Na, S.-K., and Kim, C.-W. (2020). Load Analysis and Structural Strength Evaluation of Semi-Submersible Platform for Wind Turbines in Jeju Island Sea States Using Hydrodynamic-Structure Interaction Analysis. J. Mech. Sci. Technol. 34 (3), 1227–1235. doi:10.1007/s12206-020-0221-5
Li, L., Liu, Y., Yuan, Z., and Gao, Y. (2018). Wind Field Effect on the Power Generation and Aerodynamic Performance of Offshore Floating Wind Turbines. Energy 157, 379–390. doi:10.1016/j.energy.2018.05.183
Liu, Q. S., Miao, W. P., Yue, M. N., Li, C., and Ding, Q. (2021). Dynamic Response of Offshore Wind Turbine on 3×3 Barge Array Floating Platform under Extreme Sea Conditions. China Ocean Eng. 35 (2), 186–200. doi:10.1007/s13344-021-0017-0
Ma, G., Zhong, L., Zhang, X., Ma, Q., and Kang, H.-S. (2020). Mechanism of Mooring Line Breakage of Floating Offshore Wind Turbine under Extreme Coherent Gust with Direction Change Condition. J. Mar. Sci. Technol. 25, 1283–1295. doi:10.1007/s00773-020-00714-9
Moriarty, P. J., and Hansen, A. C. (2005). AeroDyn Theory Manual. Golden, CO (US): National Renewable Energy Lab.
Morison, J. R., Johnson, J. W., and Schaaf, S. A. (1950). The Force Exerted by Surface Waves on Piles. J. Pet. Technol. 2 (05), 149–154. doi:10.2118/950149-g
Muliawan, M. J., Karimirad, M., Gao, Z., and Moan, T. (2013). Extreme Responses of a Combined Spar-type Floating Wind Turbine and Floating Wave Energy Converter (STC) System with Survival Modes. Ocean Eng. 65, 71–82. doi:10.1016/j.oceaneng.2013.03.002
Raed, K., Teixeira, A. P., and Guedes Soares, C. (2020). Uncertainty Assessment for the Extreme Hydrodynamic Responses of a Wind Turbine Semi-submersible Platform Using Different Environmental Contour Approaches. Ocean Eng. 195, 106719. doi:10.1016/j.oceaneng.2019.106719
SINTEF Ocean (2021). Sintef Ocean Website [Online]. Available: https://www.sintef.no/programvare/sima/ (Accessed December 20, 2021).
Storey, R. C., Norris, S. E., and Cater, J. E. (2014). “Modelling Turbine Loads during an Extreme Coherent Gust Using Large Eddy Simulation,” in Science of Making Torque from Wind 2014. (TORQUE 2014). Bristol: IOP Publishing. doi:10.1088/1742-6596/524/1/012177
Utsunomiya, T., Sato, I., Yoshida, S., Ookubo, H., and Lshida, S. (2013). “Dynamic Response Analysis of a Floating Offshore Wind Turbine during Severe Typhoon Event,” in Proceedings of the Asme 32nd International Conference on Ocean, OFFSHORE AND ARCTIC ENGINEERING - 2013, Nantes, France, June 9–14, 2013. doi:10.1115/omae2013-10618
WAMIT and Technology (2021). WAMIT Website [Online]. Available: https://www.wamit.com/index.htm (Accessed December 20, 2021).
Wen, Y., Wang, W., Liu, H., Mao, L., Mi, H., Wang, W., et al. (2018). A Shape Optimization Method of a Specified point Absorber Wave Energy Converter for the South china Sea. Energies 11 (10), 2645. doi:10.3390/en11102645
Zhang, L., Shi, W., Karimirad, M., Michailides, C., and Jiang, Z. (2020). Second-Order Hydrodynamic Effects on the Response of Three Semisubmersible Floating Offshore Wind Turbines. Ocean Eng. 207, 107371. doi:10.1016/j.oceaneng.2020.107371
Keywords: floating offshore wind turbine, dynamic performance, 15 MW FOWT, typhoon sea state, ECD wind condition, second-order wave load
Citation: Liu S, Chuang Z, Qu Y, Li X, Li C and He Z (2022) Dynamic Performance Evaluation of an Integrated 15 MW Floating Offshore Wind Turbine Under Typhoon and ECD Conditions. Front. Energy Res. 10:874438. doi: 10.3389/fenrg.2022.874438
Received: 12 February 2022; Accepted: 10 March 2022;
Published: 13 April 2022.
Edited by:
Wei Shi, Dalian University of Technology, ChinaReviewed by:
Decheng Wan, Shanghai Jiao Tong University, ChinaLiang Li, Ocean University of China, China
Copyright © 2022 Liu, Chuang, Qu, Li, Li and He. This is an open-access article distributed under the terms of the Creative Commons Attribution License (CC BY). The use, distribution or reproduction in other forums is permitted, provided the original author(s) and the copyright owner(s) are credited and that the original publication in this journal is cited, in accordance with accepted academic practice. No use, distribution or reproduction is permitted which does not comply with these terms.
*Correspondence: Zhenju Chuang, emhlbmp1Y2h1YW5nQGRsbXUuZWR1LmNu; Yan Qu, cXlkbHV0QHFxLmNvbQ==
†These authors have contributed equally to this work and share first authorship