 Yan Cui
 Beihua Cong
 Jianghong Liu1
- 1Ocean Science and Engineering College, Shanghai Maritime University, Shanghai, China
- 2Shanghai Institute of Disaster Prevention and Relief, Tongji University, Shanghai, China
Fire accidents constitute a significant safety concern for automotive lithium-ion battery packs and have impeded the development of electric vehicles (EVs). While fire safety concerns have been raised about EVs, their fire performance remains unknown, especially for plug-in hybrid electric vehicles (PHEVs). Hence, this paper conducted full-scale fire experiments of PHEVs to explore their fire behavior and characteristics. Two brand new PHEVs were employed, and their power battery packs were ignited as the origin of the fire to simulate the representative fire scenario. Results showed that visible flames appeared around the chassis after about 60 min of the experimental procedure. Around the fire emerged, the battery packs intermittently released plenty of white smoke, which induced gas-phase explosions. The main component of the smoke was combustible gases. The SUV-type PHEV test took 9 min 11 s for the chassis flames to evolve into a passenger compartment fire. Due to the slow propagation of the fire in sedan-type PHEV, it required 9 min 56 s for flames to engulf the rear part of the sedan. The maximum temperature of PHEV fires was 843.6°C, while the maximum height of the fire reached around 3 m. At a distance of 1 m, the radiative heat emitted from burning PHEVs peaked at 1.151 kW/m2. Moreover, some secondary hazards of PHEV fires were illustrated. These results stimulate future experiments seeking novel flame retardant materials for PHEVs and provide helpful guidance on screening reliable PHEV fire prediction and protection strategies.
Introduction
Due to limited natural energy resources and increased environmental pollution, electric vehicles (EVs) are being vigorously promoted. EVs are now subdivided into battery electric vehicles (BEVs) and plug-in hybrid electric vehicles (PHEVs). BEVs can only operate on the electrical energy of batteries, while PHEVs can rely on either electric motors or internal combustion engines for propulsion (Sun et al., 2020). However, fires in EVs are becoming more frequent. The thermal runaway (TR) of automotive battery packs is a significant cause of these fire accidents (Wang et al., 2012; Wang et al., 2019). TR means that batteries enter a process of uncontrolled heat release and rapid temperature rise. Because of the unpredictable operation environment of EVs, the battery packs may suffer from TR when they are exposed to thermal damage, electrical failure, or mechanical abuse. More importantly, EVs contain more high energy density combustibles than internal combustion engine vehicles (ICEVs), making EV fires have the characteristics of high flame intensity, rapid spread, and possible explosions (Cui and Liu, 2021). Only using specially designed firefighting equipment such as electric vehicle fire enclosure (EVFE) and water spray systems can suppress developed EV fires (Cui et al., 2022; Qiu et al., 2022).
Therefore, EVs should be tested and improved on their fire safety. Full-scale fire experiments are vital to understanding the EV’s potential safety hazards and drawbacks. So far, some tests on burning EVs have previously been carried out concerning their fire hazards and characteristics. Lecocq et al. (2012) and Truchot et al. (2018) compared the fire consequences of a BEV and an ICEV. The thermal and toxic hazard factors governing the fire risk were quantified. Another significant result is that the BEV does not lead to an apparent increase in harmful gas emissions. Only the total yield of hydrogen fluoride rises, but the toxic effect of the battery pack appears after approximately 30 min. Macneil et al. (2015) used a propane sand burner to ignite several EVs and measured the heat release rate (HRR) and temperature in the EV fires. Some parameters that may influence HRR were discussed in their experiments, such as the EV type, state of charge (SOC), and battery capacity. Boe (2017) investigated the fire behaviors of a BEV when exposed to mechanical impact. Immediately after the crash, smoke appeared from its battery pack, and the BEV was engulfed in flames after 9 min. The maximum temperature measured during the test is above 1,000°C. In the experiments conducted by Andersson et al. (2016), the temperature distribution and CO concentration inside a burning electric hybrid bus were analyzed to generate the strategies of the personnel evacuation. They observed that when the battery pack starts to burn, the bus fire is intense, and the severity of other explosions is relatively low compared to tyre explosions.
Due to the high cost of conducting fire experiments using full-size EVs, some fire risks of EVs have been extrapolated by performing battery pack fire tests. Long et al. (2013) and Blum and Long (2015) used a battery pack with a capacity of 16 kWh and induced it to TR with 400 kW propane-fueled burners. The peak HRR of the battery pack is approximately 300 kW. When visible flaming ceases, the observed exterior maximum temperature is around 400°C. Li et al. (2020) studied the rate of fire propagation to surrounding combustibles following the TR of a battery pack. A body frame of an EV was applied, and a battery pack was mounted on the frame. It is worth mentioning that it took about 22 s to evolve a triggered TR event to the worst case that the fire spread throughout the whole car compartment. Gao et al. (2017) conducted experiments and simulations to evaluate the safety of battery packs under TR propagation. And they proposed a lumped parameter model that can simulate the TR propagation characteristics. The simulation results indicate that the heating power significantly affects the TR propagation. They also found that the thermal features of battery modules vary in different phases, and the upward direction of flames and heat flow highlight the importance of fire protection design in the onboard battery packs (Gao et al., 2019). However, the thermal hazards of a battery pack cannot reflect the actual fire danger of EVs.
Previous works focus on the fire safety of BEVs, and there is a gap in research on the fire characteristics of PHEVs. Fire safety issues are further complicated by the fact that the two energy supply systems are located in one vehicle body. Thus it is necessary to know the burning behaviors and characteristics of PHEVs. In this paper, full-scale experiments are conducted to explore the fire evolution process and burning characteristic parameters of PHEVs. Two PHEVs are ignited by their power battery packs that suffer TR, and an external electrical failure triggers the TR. Temperature distribution inside and outside the vehicles and the heat flux to surrounding objects are measured. The fire characteristics of different types of PHEVs are compared. Moreover, potential risks in PHEV fires are illustrated by analyzing the experimental phenomena. These results provide a fundamental understanding of PHEV fire dynamics and play an essential role in the fire safety design of EVs.
Experimental Setup
Description of the Cars
The full-scale fire tests of PHEVs were conducted in an open field. A total of two tests were executed, and Table 1 summarizes the types and properties of vehicles used in the tests. PHEV A was an SUV, while PHEV B was a sedan passenger vehicle. They were both brand new vehicles produced by one of the global leading car companies. All windows of the vehicles were closed during the tests. A lithium-ion battery pack, which was an original production, was located in the vehicle’s chassis and protected by steel armor plates in each car. Rear seats were situated directly above the battery packs. These battery packs were triggered to TR by the external short circuit, as a typical fire scenario, to simulate PHEV fires initiated by electrical faults of batteries.

TABLE 1. Vehicle types and properties.
Instrumentation
K-type thermocouples and heat flux gauges were arranged around the vehicles. And the thermocouples were also attached to the interior of the cars. The experimental data were collected at 1-second intervals. The specific locations of these sensors are represented in Figure 1. It is noteworthy that the directions of the left or right side mentioned in this study were taken the driver’s perspective as a benchmark. Moreover, after a test was completed, professional firefighters from fire departments extinguished the EV fire using compressed air foam.
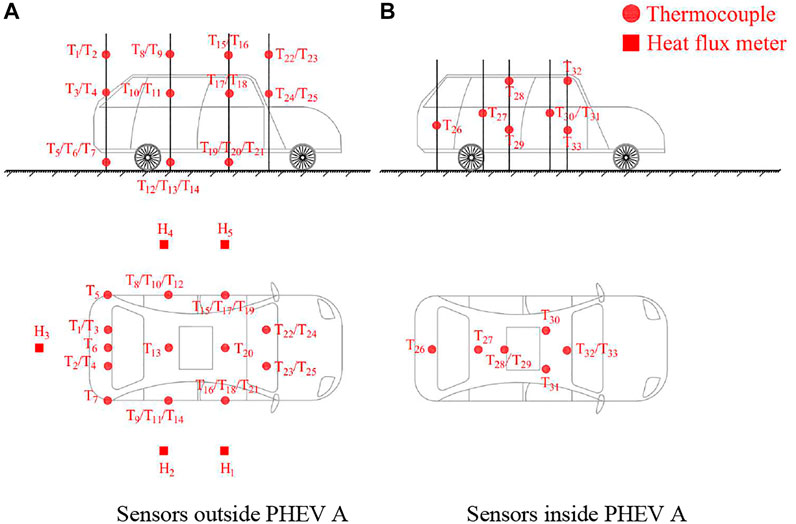
FIGURE 1. Schematic of experimental apparatus of test 1. (A) Sensors outside PHEV A (B) Sensors inside PHEV A.
In test 1, a total of 33 K-type thermocouples were employed to record the temperature variation. Four bunches of thermocouples (T1∼T7, T8∼T14, T15∼T21, and T22∼T25) were used to measure the flame temperature in the exterior space of different vehicle compartments, including the trunk, rear passenger compartment, and front passenger compartment. Thermocouples T3∼4, T10∼11, T17∼18, and T24∼25 were mounted near windows and about 3 cm away from the windows. The distance between two vertically adjacent thermocouples above the level of the chassis was 0.5 m. The thermocouples (T5∼7, T12∼14, and T19∼21) near the chassis were about 0.15 m above the ground. Five heat flux meters were placed on the sides and rear of PHEV A to record the influence of the vehicle fire on surrounding objects. The heat flux gauges were 1.5 m from the ground and 1 m away from the car body. Moreover, eight thermocouples (T26∼T33) were placed inside PHEV A. In order to describe the burning behaviors of plastic parts and seats, thermocouple T26 was mounted inside the trunk, and thermocouples T27, T30, and T31 were placed above the seats. Thermocouples T28 and T32 were installed on the roof of the car to measure the temperature of smoke collecting on the top. Thermocouples T29 and T33 were placed above the floor of the passenger compartment. The sensor placement pattern in test 2 was similar to that in test 1.
Results and Discussion
Fire Propagation Behaviors of the Plug-In Hybrid Electric Vehicles
The fire progress of PHEV A is shown in Figure 2. The time at which the battery pack of PHEV A experienced the external short circuit was defined as the experiment start time or ignition timing. The pressure relief valve of the battery pack broke at 6 min 36 s, and the battery pack began to release white smoke. The battery pack emitted white smoke several times before a visible flame was created. These smokes were quickly dispersed due to the wind. 63 min 28 s after the start of the experiment, a cloud of white smoke gathered at the vehicle chassis, as illustrated in Figure 2A, and exploded 1 s later. The combustion wave of the explosion can be seen clearly in Figure 3. This phenomenon indicates that the smoke emitted in the early stage of an EV fire is flammable and easily causes an explosion if the smoke is not dispersed in time. It also explains why EVs exploded when they caught fire in many fire accidents. No such phenomenon occurs in ICEVs, from ignited to fully-developed burning (Li et al., 2017; Okamoto et al., 2018; Hu et al., 2020). Therefore, the explosive gas was emitted from the TR battery pack of the tested PHEV. Evaporated electrolytes, hydrogen, carbon monoxide, and alkanes are the main gaseous products of TR side reactions as well as the components of the white smoke (Sun et al., 2016; Diaz et al., 2019; Wang et al., 2019). The mixture of these TR gases reached its explosive limit at the chassis and exploded when it met a spark.
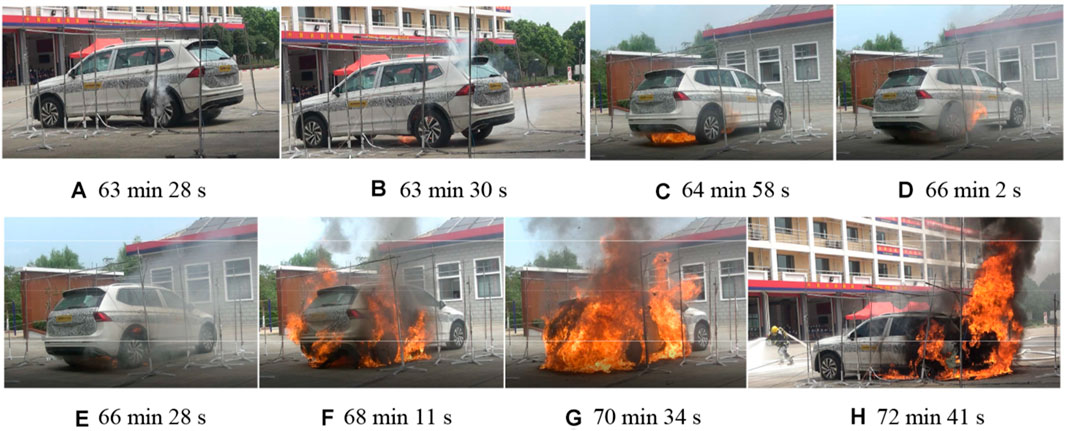
FIGURE 2. The burning process of PHEV A. (A) 63 min 28 s (B) 63 min 30 s (C) 64 min 58 s (D) 66 min 2 s (E) 66 min 28 s (F) 68 min 11 s (G) 70 min 34 s (H) 72 min 41 s.
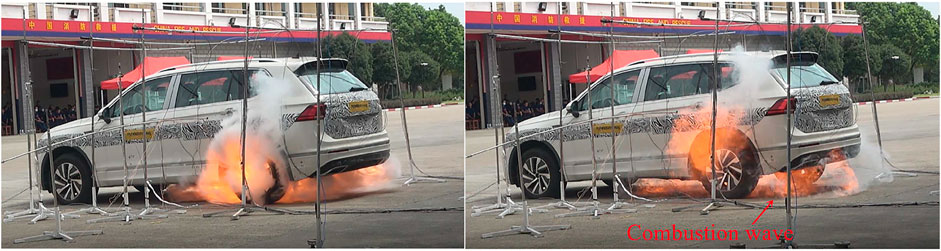
FIGURE 3. Explosion phenomenon in Test 1.
At the end of the explosion, flames appeared at the vehicle chassis (Figure 2B), and white smoke no longer emerged from the chassis, but dark gray smoke was generated. The flames transformed into a jet fire at 64 min 58 s and lasted approximately 4 s (Figure 2C). Flames then propagated toward rear wheels and their splash guards. As shown in Figure 2D, the jet flame reappeared at 66 min 2 s, and it escaped from the sides of the vehicle and lasted for about 7 s. The flames gradually spread from the wheels to the rear bumper and expanded around the posterior part of the vehicle (Figure 2E). During this process, plastic parts of the car increasingly melted. Some melted materials dripped onto the ground and burned continuously. At 68 min 11 s after ignition, the flames had surrounded the rear passenger compartment (Figure 2F). At this moment, the height of the flame was comparable to that of the vehicle. The left rear wheel burst at 68 min 34 s, which caused the car to tilt backward, while the right rear wheel did not burst. At 70 min 34 s, the flames besieged the front passenger compartment (Figure 2G). Most of the flames that enveloped the front part of the vehicle derived from the pool fires formed by the dripping materials and the flames escaping from the undercarriage. Firefighters intervened at 72 min 41 s after ignition (Figure 2H). The maximum height of the vehicle fire reached about 3 m.
The burning process of the PHEV in test 2 was similar to that in test 1. Figure 4 shows the progress of the fire in test 2. At about 4 min after ignition, white smoke poured from the chassis near the battery pack, and then the smoke was released intermittently at the same location for 51 min 19 s. At 55 min 19 s, an explosion occurred at the chassis of PHEV B (Figure 4A), which was also caused by the explosive smoke. The explosion process during that one second is presented in Figure 5. A flame from the chassis failed to contact the white smoke immediately, as the smoke that had collected at the bottom of the vehicle was blown away by the wind, as shown in Figure 5A. The wind also affected the flame, and it deflected toward the smoke (Figure 5B). The fire thus engaged with the smoke, resulting in an explosion. The smoke did not thoroughly burn because it moved faster than the combustion wave. As shown in Figure 5D, the flame contracted, and the smoke dispersed.
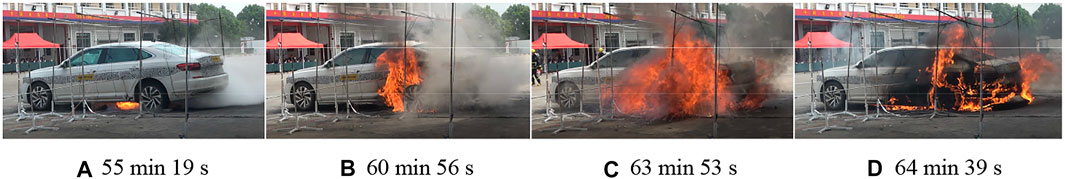
FIGURE 4. The burning process of PHEV B. (A) 55 min 19 s (B) 60 min 56 s (C) 63 min 53 s (D) 64 min 39 s.
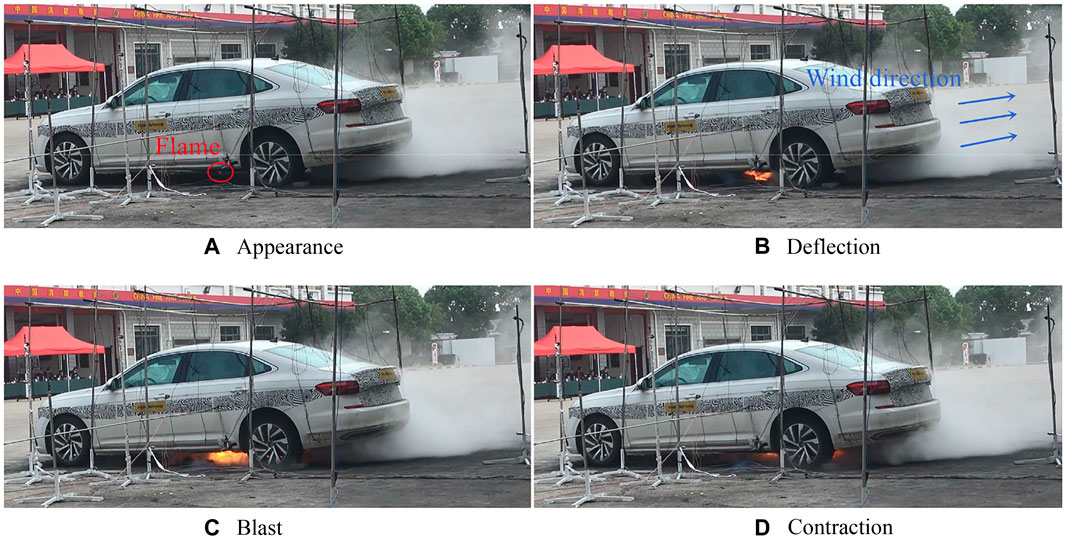
FIGURE 5. Explosion process of PHEV B. (A) Appearance, (B) Deflection, (C) Blast, (D) Contraction.
After the explosion, flames lingered near the chassis and gradually spread from the chassis to the rear part of PHEV B. Meanwhile, a quantity of light brown smoke overflowed from the slits of the vehicle. After 59 min 19 s of the experimental procedure, the left rear splash guard burned. Fire shifted along the edge of the undercarriage. The pool fire formed by the melted materials on the ground accelerated the fire spread process. The passenger compartment windows increasingly went black at about 60 min 56 s, meaning that combustibles of the compartment were ignited (Figure 4B). Since the windows were closed during the experiment, these combustibles were in a state of smoldering. PHEV B did not show a significant jet flame. Its jet fire may be bounced back by the battery pack’s cover and the fabric. The left rear wheel burst at 63 min 53 s, while the right rear wheel was engulfed in flames but did not burst. The moment of the burst is shown in Figure 4C. It is worth mentioning that firefighters should stay away from burning wheels during a fire rescue to avoid being involved in the flames of the burst. At 64 min 39 s, the rearward bumper could not withstand the thermal effect of fire and fell off completely (Figure 4D). Finally, the fire experiment of PHEV B ended at 65 min 15 s. The vehicle’s trunk was utterly destroyed, and its flames reached a maximum height of around 2 m.
Temperature Distribution of the Burning Plug-In Hybrid Electric Vehicles
As shown in Figure 6, the space around the PHEVs was divided into three fire zones. As an example for PHEV A, the area above the vehicle roof where flames may appear was called the gushing flame zone and was noted as Zone α. Passenger compartment flames referred to the flames near car windows and were denoted as Zone β. Flames at the level of the vehicle chassis, including the battery pack fire, were called chassis flames and were labeled as Zone γ. These three zones were further subdivided according to the positions of thermocouples, and there were 12 sub-zones. Furthermore, the path from the trunk to the engine compartment was defined as the positive longitudinal direction of the vehicle, while the orientation from the roof to the chassis was the positive vertical direction.
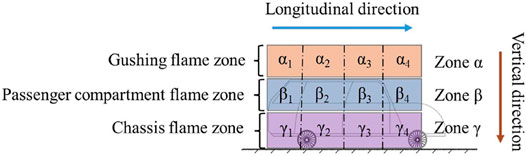
FIGURE 6. Fire zones of the PHEV.
Figure 7 records temperature variation curves for the thermocouples T1∼21 in test 1 from 3,570 to 5,870 s. Furthermore, peak temperatures at these places are listed in Table 2, and they were in the range of 153.1–843.6°C. Since the flames did not reach the engine compartment, no significant change in temperature occurred in Zones α4, β4, and γ4. These maximum temperatures, arranged in the table according to their locations, reflect the origin of the car fire and the regional variations in the burning state. Influenced by fire at the chassis level, the temperature of Zones γ1 and γ2 rose sharply at 3,864 s, and the maximum temperature of the two zones was 843.6°C. Because Zone γ3 was far from the fire source (TR battery pack), its temperature experienced a change at 3,990 s. On account of the small capacity of the battery pack (13 kWh), other burning parts, such as thermoplastics and rubbers, may dominate the flames from the chassis. In the early stage of the fire, the temperature of Zones β1 and β2 fluctuated slightly in response to thermals rising from Zone γ. At 4,079 s, the temperature of Zone β2 changed dramatically and rose to 428.7°C in 47 s. Readings of the thermocouples in Zone β1 did not rise until 4,150 s and reached a maximum of 798.8°C. The temperature in Zone β3 increased after 4,100 s. Fiercely burning rear wheels provided most of the heat for the increase in temperature of these zones. As fire gradually engulfed the vehicle, the temperature of Zones α1, α2, and α3 changed at 4,090, 4,020, and 4,100 s, respectively. The highest temperature of gushing flames was found in Zone α1 and was 754.4°C.
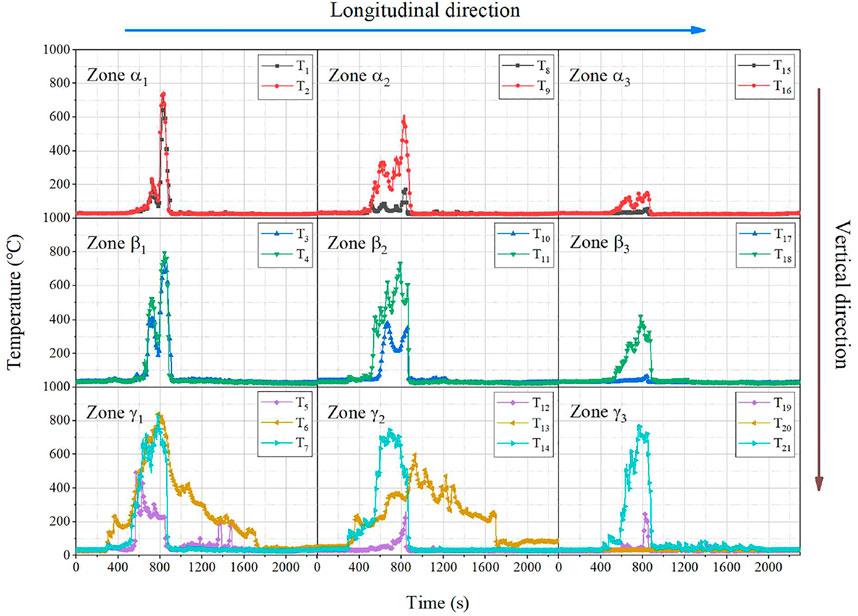
FIGURE 7. Temperature curves outside the PHEV in test 1.
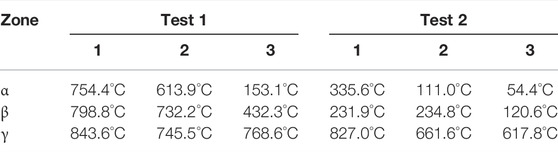
TABLE 2. Maximum temperatures of fire zones.
Curves of the temperature evolution in the compartments of PHEV A are plotted in Figure 8. At about 4,170 s after ignition, the trunk and passenger compartment temperature started to change, and the temperature eventually peaked at 696.8°C. It’s worth noting that the time at which the temperature within the compartments began to escalate was later than the time when fire surrounded the passenger compartment. The fire originated in the chassis, and it took 306 s for heat to penetrate the bodywork and heat combustibles inside. Rear seats and combustibles in the trunk were the first to catch fire as they were closest to the burning battery pack. Fire effluents with the high temperature accumulated in the car roof and consequently affected readings of thermocouple T28. The hot smoke did not influence thermocouple T29 at the compartment’s base. Moreover, the rear compartment bottom temperature was at ambient temperature from start to finish. It indicates that the armor plate of the battery pack or the vehicle frame had a certain degree of fire resistance, which could prevent flames or heat from igniting the vehicle’s interior floor. Chassis flames did not propagate directly upward through the chassis but entered the car by igniting the door sealing rubber or through the crack between car doors and its frame. It took about 30 s for the fire to travel from rear seats to front seats. The temperature of thermocouples T30∼31 only amounted to 250.6°C owing to the incomplete combustion of seats. For the same reason, the thermal readings of thermocouples T32 near the roof and T33 below seats did not show a significant variation.
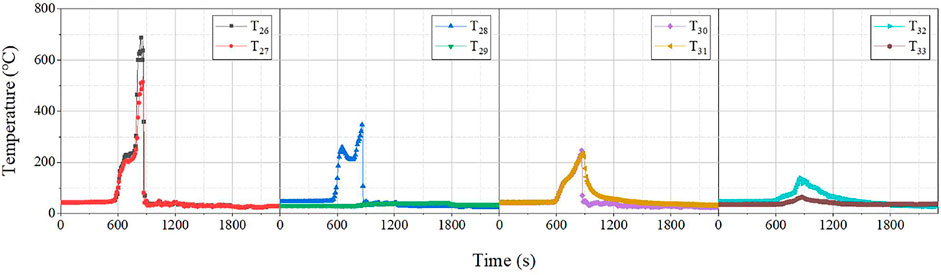
FIGURE 8. Temperature evolutions in the compartments of PHEV A.
Figure 9 shows temperature changes in the space around the PHEV B between 3,319 and 4,319 s. The temperature at the chassis of PHEV B started to increase at 3,369 s, caused by the hovering flames. After flames reached the rear passenger compartment, the temperature in Zones α and β began to rise (at about 3,690 s). The maximum temperatures in the fire zones of test 2 are listed in Table 2. The period between the appearance of fire and the intervention of firefighters was known as the combustion phase. The combustion phase lasted 9 min 56 s for PHEV B and 9 min 11 s for PHEV A. Although the burning duration of PHEV B was longer than that of PHEV A, the fire of PHEV B was less intense, both in terms of flame form and flame temperature. A comparison of fire-spreading events between the two tests is represented in Table 3. The geometric characteristics of vehicles may be an essential factor in the combustion characteristics of PHEVs. Directions of flame propagation were similar in both tests, i.e., upward along the car body and forward along with the chassis. The low car body of PHEV B limited the development of flames in the vertical direction. The restricted fire was also less able to spread horizontally. For PHEV A, its SUV-style trunk provided more combustibles for the fire that tended to move upward. Flames that had accumulated enough heat thus moved faster toward the passenger compartment. The temperature evolution in the compartments of PHEV B is illustrated in Figure 10. The temperature inside the car started to change at about 3,519 s, and the time gap between the temperature variation inside and outside the vehicle was 150 s. The temperature trends and smoke distribution within PHEV B were similar to those in PHEV A. The maximum temperature inside was 259.7°C, which was lower than the highest temperature of 696.8°C in the compartments of PHEV A. At the end of the combustion phase, the readings of thermocouples dropped as firefighters intervened.
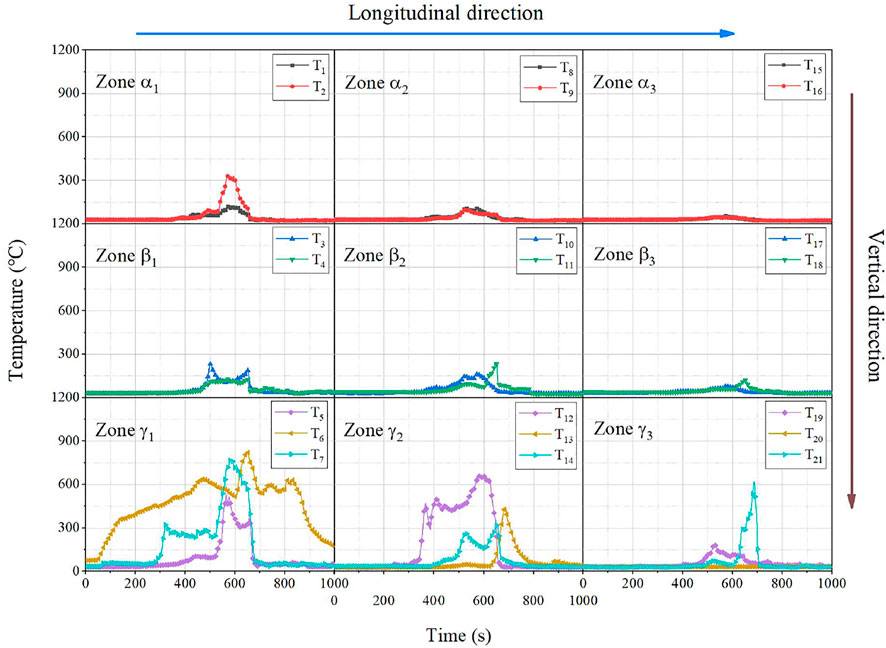
FIGURE 9. Temperature curves outside the PHEV in test 2.
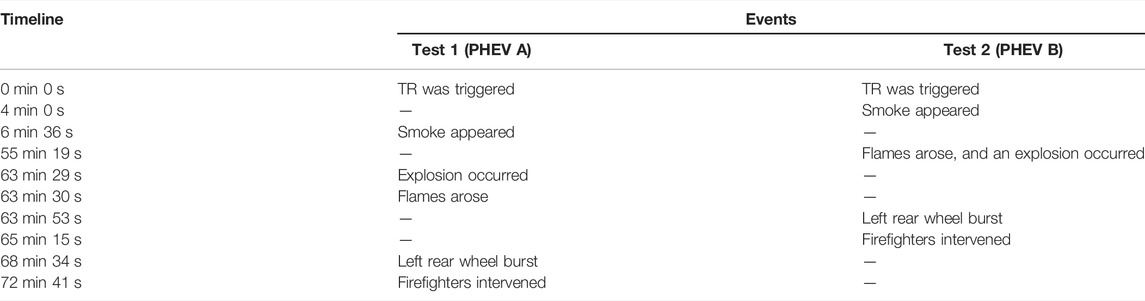
TABLE 3. Timeline of the burning process.
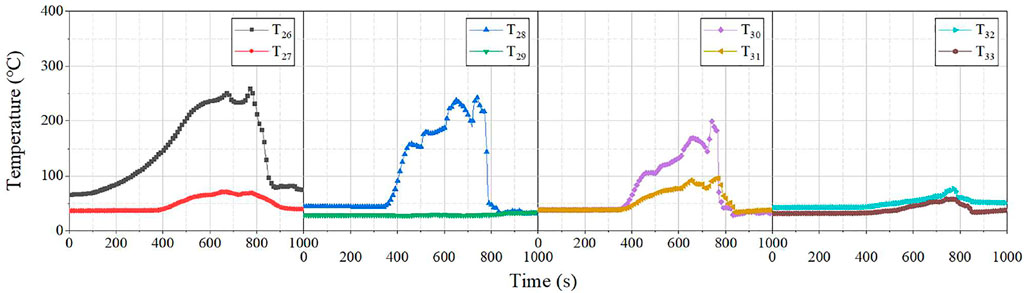
FIGURE 10. Temperature evolutions in the compartments of PHEV B.
Heat Flux Around the Burning Plug-In Hybrid Electric Vehicles
The profiles for heat flux from both the sides and rear of PHEV A are presented in Figure 11. At 68 min 15 s, heat flux readings fluctuated upward as flames engulfed vehicle compartments. The effect of burning parts of the PHEV on the measured values is noticeable. The maximum measurement of the heat flux meter H1 was obtained at 70 min 35 s and was 1.151 kW/m2. This value reflected the thermal radiation from the flames that enveloped the front passenger compartment to this location. At the moment, flame temperatures in Zones α3, β3, and γ3 were 115.7, 238.1, and 392.4°C, respectively. The fire from the trunk influenced the heat flux gauge H3. Toward the end of test 1, the impact of the trunk flame on the surrounding objects reached its maximum, and the heat flux meter H3 showed a reading of 0.620 kW/m2. By this time, the maximum temperature of the trunk fire was 781.4°C. Moreover, two spikes in heat flux were observed. As shown in Figure 12, a fire whirl (Pinto et al., 2017) formed behind the vehicle at about 70 min 45 s and moved toward the heat flux gauge H3. Although the fire whirl dissipated on the way, it still affected the data curves. At 71 min 44 s, the rear window burst, and flames emanating from it provided additional heat radiation to the instrument. At around 73 min 50 s, the extinguishing agent absorbed a large amount of heat, resulting in negative readings on heat flux meters. The heat flux meter H2 was damaged during the test.
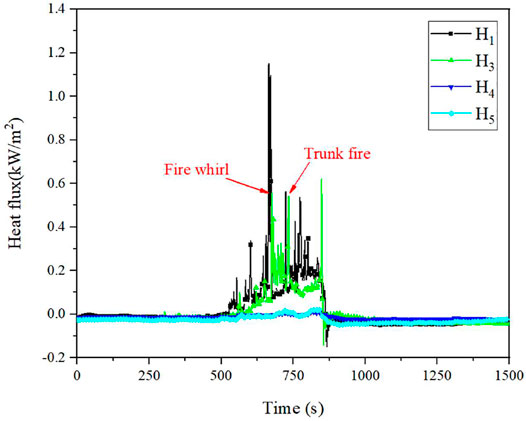
FIGURE 11. Evolutions of heat flux in test 1.
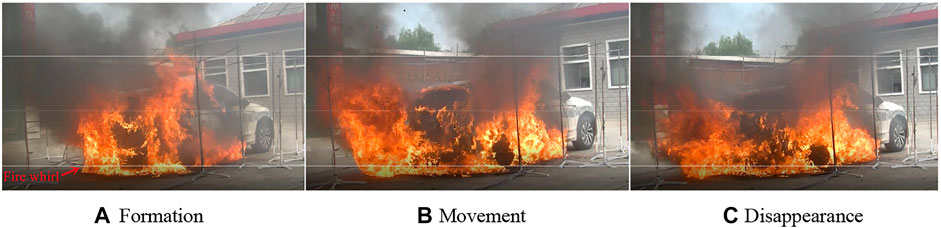
FIGURE 12. Formation of a fire whirl during test 1. (A) Formation (B) Movement (C) Disappearance.
Heat flux meters in test 2 did not provide output data that could be analyzed because PHEV B did not burn violently. Thus, the radiant heat emitted by the PHEV fires did not exceed the tolerance limit for exposure of skin [2.5 kW/m2 (Purser and McAllister, 2016)] under these experimental conditions. The propagation of a PHEV fire to other objects is also a low probability event without considering the direct impact of flame or hot smoke on the combustible things (convective heat transfer). However, the thermal hazard is likely to increase in a confined field. In an ICEV fire test room with a volume of 3,375 m3, the maximum heat flux in the lateral direction (1.5 m high, 1 m from a burning minivan passenger car) is almost 20 kW/m2 (Okamoto et al., 2018). A heat flux gauge with a height of 1.2 m measuring at a distance of 5.5 m from a minivan (ICEV) has a maximum of about 2.5 kW/m2, and the experiment was conducted in an ample space (Hu et al., 2020). The outdoor experimental area and the wind may affect the measurement, resulting in heat radiation sources failing to collect near the PHEVs. Since the burning behavior of PHEVs after flames spread to the compartments is similar to that of ICEVs, the thermal hazard and safety distance of PHEV fires in confined space can be estimated by referring to existing fire experiments of ICEVs.
Generalized Discussion
The above discussion shows the fire progression and characteristics when the PHEV fire is initiated in the battery pack. Nevertheless, some secondary hazards are not identified by existing research, so this section focuses on the fire risks that PHEVs may pose.
The explosion hazard caused by lithium-ion batteries is becoming more and more pronounced. In Beijing, an energy storage power station occurred a severe fire and explosion accident on 16 April 2021. The unexpected explosion in the north building of the station resulted in three deaths and one injury, and two firefighters sacrificed their lives in the explosion. The blast was directly caused by the detonation of a large amount of white flammable gas released from batteries in the building (Unknown, 2021). The reason for this explosion accident is the same as that for PHEVs in this paper, both caused by white smoke mixed with air. In the future, such blasts are highly likely to occur during PHEV fires in enclosed facilities such as ro-ro vessels, underground car parks, and tunnels. Therefore, preventing or reducing the generation of combustible gases from PHEVs and eliminating them using fire fighting methods may be the focus of future research.
Roll-on/roll-off ships are an essential means of transporting PHEVs. However, on 4 June 2020, a fire broke out in ro-ro vehicle carrier Höegh Xiamen, destroying the Höegh Xiamen and its cargo of 2,420 used vehicles. The National Transportation Safety Board determined that the fire was probably caused by electrical faults in one of the vehicles that did not have appropriately secured batteries (Homendy et al., 2021). A similar fire incident happened on the car carrier Felicity Ace on 16 February 2022, which also caused severe economic losses. The unfortunate fire accidents force us to emphasize the safety of ro-ro vessels that transport PHEVs. In the vehicle cabin of the ship, there are many holes in the deck for securing the vehicles. Although the hot smoke and heat flow from the PHEV fires move upward, the melted combustibles will drip through these holes and ignite the combustibles on the lower deck. This process undoubtedly speeds up the evolution of ship fires. Thus, in order to improve the safe transport conditions of PHEVs, the fire safety design of ro-ro vessels may need to be adapted. In addition, vigilance is required against fire whirls that may be induced in PHEV fires.
Conclusion
This paper described the development and characteristics of PHEV fires based on temperature data, heat flux records, and photo images. Two vehicle types were used for the experiments, and their fires were ignited by external short-circuit faults in the battery packs.
PHEV fires induced gas-phase explosions. The PHEVs released a large amount of white smoke before flames appeared, which lasted for approximately 60 min. The white smoke originated from the battery pack that was experiencing TR. Combustible gases were the main component of the smoke. When the gas encountered a spark or flame, it exploded. Flames appeared at the chassis around the explosion. Under these experimental conditions, chassis flames of SUV-type PHEV moved to the front passenger compartment in 9 min 11 s, while that of sedan-type PHEV developed for 9 min 56 s before advancing to the rear passenger compartment. Eventually, vehicle flames reached a maximum height of about 3 m. Melted materials formed pool fires during the fire developing process, which accelerated the vehicle fire propagation. Furthermore, wheels enveloped in the fire were at risk of bursts.
The PHEVs that entered the combustion phase for around 9 min 30 s had a maximum external flame temperature of 843.6°C and a maximum compartment flame temperature of 696.8°C. The car type significantly influenced the rate of development of PHEV fires. Flames propagated markedly slower in the sedan passenger vehicle than in the SUV. After the flame surrounded the passenger compartment, the temperature inside the cars started to increase. As the fire experiments were conducted in an open space, PHEV fires produced a maximum heat flux of 1.151 kW/m2 to objects at a horizontal distance of 1 m from it. And the maximum heat flux from the trunk flames during the period of intense burning was 0.620 kW/m2.
Furthermore, there are several potential hazards in the PHEV fires, such as explosions of combustible gases, pool fires of molten materials, and fire whirls. Although these hazards surfaced in these fire tests, their hazardous characteristics in a particular scene are yet to be explored.
Data Availability Statement
The original contributions presented in the study are included in the article/supplementary material, further inquiries can be directed to the corresponding author.
Author Contributions
YC: Investigation, methodology, formal analysis, writing—original draft, and visualization. BC: Conceptualization, writing—review and editing, resources, funding acquisition, and supervision. JL: Writing—review and editing, validation, funding acquisition, and supervision. MQ: Data curation and visualization. XH: Validation, project administration, and funding acquisition.
Funding
The study was funded by Project 20dz1200900 supported by the Science and Technology Commission of Shanghai Municipality and Project 2021YBR015 supported by the Top-notch Innovative Talent Training Program for Graduate Students of Shanghai Maritime University.
Conflict of Interest
The authors declare that the research was conducted in the absence of any commercial or financial relationships that could be construed as a potential conflict of interest.
Publisher’s Note
All claims expressed in this article are solely those of the authors and do not necessarily represent those of their affiliated organizations, or those of the publisher, the editors and the reviewers. Any product that may be evaluated in this article, or claim that may be made by its manufacturer, is not guaranteed or endorsed by the publisher.
References
Andersson, P., Brandt, J., and Willstrand, O. (2016). Full Scale Fire-Test of an Electric Hybrid Bus. Sweden: SP Technical Research Institute of Sweden.
Blum, A., and Long, R. T. (2015). Full-scale Fire Tests of Electric Drive Vehicle Batteries. SAE Int. J. Passeng. Cars - Mech. Syst. 8, 565–572. doi:10.4271/2015-01-1383
Boe, A. S. (2017). Full Scale Electric Vehicle Fire Test. [Online]. Available at: https://www.fireproductsearch.com/full-scale-electric-vehicle-fire-test/(Accessed April 15, 2021).
Cui, Y., Liu, J., Han, X., Sun, S., and Cong, B. (2022). Full-scale Experimental Study on Suppressing Lithium-Ion Battery Pack Fires from Electric Vehicles. Fire Saf. J. 129, 103562. doi:10.1016/j.firesaf.2022.103562
Cui, Y., and Liu, J. (2021). Research Progress of Water Mist Fire Extinguishing Technology and its Application in Battery Fires. Process Saf. Environ. Prot. 149, 559–574. doi:10.1016/j.psep.2021.03.003
Diaz, F., Wang, Y., Weyhe, R., and Friedrich, B. (2019). Gas Generation Measurement and Evaluation during Mechanical Processing and thermal Treatment of Spent Li-Ion Batteries. Waste Management 84, 102–111. doi:10.1016/j.wasman.2018.11.029
Gao, S., Feng, X., Lu, L., Ouyang, M., and Ren, D. (2017). A Test Approach for Evaluating the Safety Considering thermal Runaway Propagation within the Battery Pack. ECS Trans. 77 (11), 225–236. doi:10.1149/07711.0225ecst
Gao, S., Lu, L., Ouyang, M., Duan, Y., Zhu, X., Xu, C., et al. (2019). Experimental Study on Module-To-Module thermal Runaway-Propagation in a Battery Pack. J. Electrochem. Soc. 166, A2065–A2073. doi:10.1149/2.1011910jes
Homendy, J., Graham, M., Landsberg, B., and Chapman, T. (2021). Fire Aboard Roll-On/roll-Off Vehicle Carrier Höegh Xiamen. United States: National Transportation Safety Board.
Hu, Y., Zhou, X., Cao, J., Zhang, L., Wu, G., and Yang, L. (2020). Interpretation of Fire Safety Distances of a Minivan Passenger Car by Burning Behaviors Analysis. Fire Technol. 56, 1527–1553. doi:10.1007/s10694-019-00938-1
Lecocq, A., Bertana, M., Truchot, B., and Marlair, G. (2012). “Comparison of the Fire Consequences of an Electric Vehicle and an Internal Combustion Engine Vehicle,” in 2. International Conference on Fires in Vehicles - FIVE 2012 (Chicago, United States).
Li, D., Zhu, G., Zhu, H., Yu, Z., Gao, Y., and Jiang, X. (2017). Flame Spread and Smoke Temperature of Full-Scale Fire Test of Car Fire. Case Stud. Therm. Eng. 10, 315–324. doi:10.1016/j.csite.2017.08.001
Li, H., Peng, W., Yang, X., Chen, H., Sun, J., and Wang, Q. (2020). Full-scale Experimental Study on the Combustion Behavior of Lithium Ion Battery Pack Used for Electric Vehicle. Fire Technol. 56, 2545–2564. doi:10.1007/s10694-020-00988-w
Long, R. T., Blum, A. F., Bress, T. J., and Cotts, B. R. T. (2013). “Best Practices for Emergency Response to Incidents Involving Electric Vehicles Battery Hazards: a Report on Full-Scale Testing Results,” in Emergency Response to Incident Involving Electric Vehicle Battery Hazards (United States: The Fire Protection Research Foundation).
Macneil, D. D., Lougheed, G., Lam, C., Carbonneau, G., Kroeker, R., Edwards, D., et al. (2015). “Electric Vehicle Fire Testing,” in: 8th EVS-GTR Meeting (Washington, United States).
Okamoto, K., Ichikawa, T., Shimizu, K., and Honma, M. (2018). Thermal Effect on Surrounding Combustibles in Minivan Passenger Car Fires. Fire Mater. 42 (6), 583–592. doi:10.1002/fam.2512
Pinto, C., Viegas, D., Almeida, M., and Raposo, J. (2017). Fire Whirls in forest Fires: An Experimental Analysis. Fire Saf. J. 87, 37–48. doi:10.1016/j.firesaf.2016.11.004
Purser, D. A., and McAllister, J. L. (2016). “Assessment of Hazards to Occupants from Smoke, Toxic Gases, and Heat,” in SFPE Handbook of Fire Protection Engineering. Editors M. J. Hurley, D. Gottuk, J. R. Hall, K. Harada, E. Kuligowski, M. Puchovskyet al. (New York: Springer), 2308–2428. doi:10.1007/978-1-4939-2565-0_63
Qiu, M., Cui, Y., Niu, S., and Cong, B. (2022). Experimental Study on the Effectiveness of Water spray Systems in Suppressing Electric Vehicle Fires. Fire Sci. Technology 41 (1), 82–86.
Sun, J., Li, J., Zhou, T., Yang, K., Wei, S., Tang, N., et al. (2016). Toxicity, a Serious Concern of thermal Runaway from Commercial Li-Ion Battery. Nano Energy 27, 313–319. doi:10.1016/j.nanoen.2016.06.031
Sun, P., Bisschop, R., Niu, H., and Huang, X. (2020). A Review of Battery Fires in Electric Vehicles. Fire Technol. 56, 1361–1410. doi:10.1007/s10694-019-00944-3
Truchot, B., Fouillen, F., and Collet, S. (2018). An Experimental Evaluation of Toxic Gas Emissions from Vehicle Fires. Fire Saf. J. 97, 111–118. doi:10.1016/j.firesaf.2017.12.002
Unknown (2021). Investigation Report of 'April 16' Fire Accident in Fengtai District". China: Beijing Emergency Management Bureau.
Wang, Q., Mao, B., Stoliarov, S. I., and Sun, J. (2019). A Review of Lithium Ion Battery Failure Mechanisms and Fire Prevention Strategies. Prog. Energ. Combustion Sci. 73, 95–131. doi:10.1016/j.pecs.2019.03.002
Keywords: full-scale fire experiment, plug-in hybrid electric vehicle, lithium-ion battery, burning behavior, fire characteristic
Citation: Cui Y, Cong B, Liu J, Qiu M and Han X (2022) Characteristics and Hazards of Plug-In Hybrid Electric Vehicle Fires Caused by Lithium-Ion Battery Packs With Thermal Runaway. Front. Energy Res. 10:878035. doi: 10.3389/fenrg.2022.878035
Received: 17 February 2022; Accepted: 22 March 2022;
Published: 13 April 2022.
Edited by:
Weiguang An, China University of Mining and Technology, ChinaReviewed by:
Bihe Yuan, Wuhan University of Technology, ChinaJie Ji, University of Science and Technology of China, China
Copyright © 2022 Cui, Cong, Liu, Qiu and Han. This is an open-access article distributed under the terms of the Creative Commons Attribution License (CC BY). The use, distribution or reproduction in other forums is permitted, provided the original author(s) and the copyright owner(s) are credited and that the original publication in this journal is cited, in accordance with accepted academic practice. No use, distribution or reproduction is permitted which does not comply with these terms.
*Correspondence: Beihua Cong, Ymhjb25nQHRvbmdqaS5lZHUuY24=