 Jun-Li Wang
 Xing-Yuan Chen
 Maxime Binama
 Wen-Tao Su
 Jian Wu
- 1College of Petroleum Engineering, Liaoning Shihua University, Fushun, China
- 2School of Energy Science and Engineering, Harbin Institute of Technology, Harbin, China
Unstable flow within a reactor coolant pump (RCP)’s mechanical seal may cause the change of its sealing parameters, possibly threatening RCP’s safe operations. In this study, based on the moving grid technology, a 3D fluid–structure interaction analysis model is established, where the influence of parameters such as the inlet pressure fluctuation, closing force fluctuation, and speed fluctuation on mechanical seal performance characteristics within an RCP is numerically studied. Study results have shown that when pressure and closing force fluctuations are applied, the static ring displacement, the inlet-to-outlet temperature difference, and the leakage difference show similar variational rules. In addition, it is found that the sealing parameters are more sensitive to the step form of fluctuation. When the step change of 4% closing force was applied, the static ring displacement was more than 36.7%, the change of the temperature difference between inlet and outlet zones exceeded 53.5%, and the leakage difference was more than 127.2%. The change of speed has also been found to significantly affect the temperature difference between the RCP mechanical seal’s inlet and outlet, but the effect on the leakage and opening force was negligible.
Introduction
The reactor coolant pump is one of the most critical equipment and the only rotating equipment in the primary circuit of the pressurized water reactor nuclear power plant, which transports and pressurizes the working fluid of the primary circuit (Liu et al., 2019). The reactor coolant pump works under high-temperature and high-pressure conditions, in a radioactive environment with high technical requirements. Nuclear material leakage is one of the biggest hidden dangers of nuclear power plants. Figure 1A schematically shows the main components of a reactor coolant pump. The shaft seal is composed of three similar mechanical seals in series. A single mechanical seal is mainly composed of a stationary ring and rotating ring, as shown in Figure 1B (Su et al., 2020). For the sake of addressing some of the operational problems such as wear, elastic deformation, and thermal deformation, the design of the sealing end face geometry involves some radial and circumferential deviations. The deviation from the plane in the radial direction is called taper, and the deviation from the plane in the circumferential direction is called waviness. The radial taper directly determines the load supported by hydrostatic pressure, which determines the thickness and performance of the film. Waviness has a great impact on hydrodynamic lubrication and can produce strong hydrodynamic pressure carrying capacity (Lebeck, 1991; Cochain, 2018), which makes the seal produce sufficient opening force and is used for the sealing of high-parameter machinery such as reactor coolant pump. Many scholars have conducted a large number of studies on the mechanical seal of reactor coolant pumps, including the influence of structural parameters on mechanical seal performance (Liu et al., 2011), the problem of work–heat conversion and heat conduction considering viscosity–temperature effect (Brunetière and Modolo, 2009; Ma et al., 2021), the multiphase flow caused by cavitation (Liu et al., 2015), the fluid–solid thermal coupling problem considering mechanical stress and thermal stress (Liao et al., 2011), and manufacture and experiment of mechanical seal (Feng et al., 2020; Guang and Ma, 2021). These studies mainly focus on the steady-state process of the flow field inside the mechanical seal of the reactor coolant pump. However, the reactor coolant pump presents strong unsteady characteristics during startup (Gao et al., 2013) and sliding (Lu et al., 2019), and the parameters such as speed, head, and temperature change drastically. Even under rated operating conditions, unstable vortex and vortex shedding inside the reactor coolant pump will also cause severe pressure pulsation and unit vibration (Ni et al., 2017; Ni et al., 2020; Zhou et al., 2021). The rotating speed of the reactor coolant pump, temperature of sealing medium, pressure pulsation, and vibration of unit will affect the mechanical seal.
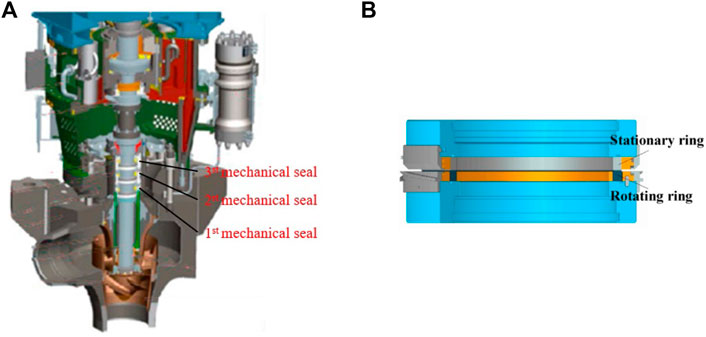
FIGURE 1. Illustrations of (A) the typical reactor coolant pump and (B) the mechanical seal assembly structure (Su et al., 2020).
In recent years, unsteady flow field characteristics in reactor coolant pumps’ mechanical seals have increasingly attracted the attention of scholars. Liu et al. (2013) established a three-dimensional theoretical model to study the influence of the initial position and velocity of the static ring on the dynamic performance of the waveform end mechanical seal of the reactor coolant pump and found that the amplitude of the static ring was an important parameter affecting the performance of the rotating ring. Falaleev and Vinogradov (2015) established a dual-mass dynamic model applicable to the mechanical seal end face and analyzed the dynamic characteristics of seal theoretically and experimentally. Migout et al. (2015) studied the influence of rising inlet water temperature on mechanical seal through numerical simulation. Their results showed that the mechanical seal oscillated when the inlet water temperature was raised to 170°C, with a minimum film thickness change of 25% and a more significant flow rate change, but the liquid film temperature change was not significant. Chávez and De Santiago (2020) conducted an experimental study on the mechanical seal and obtained the pressure response function under 5–440 Hz excitation by pressure sensor measurement. In addition, the numerical predictions of the pressure response function were conducted at two different static supply pressures and two different dynamic pressures. These predictions indicate that the static supply pressure has no effect on the dynamic pressure response function and that the dynamic response is linear with respect to the dynamic input pressure. Luo et al. (2020) studied the relationship between fault degree and dynamic characteristics of a reactor coolant pump by theoretical analysis and numerical simulation. Their results showed that extrusion failure is more likely to occur when the liquid film thickness is too large or too small, and the opening force is both affected by the lubrication state of the liquid film and the degree of sealing extrusion failure. With the increase in rotating speed, leakage failure may occur in the seal, and the fluctuation of leakage growth reflects the severity of the failure. Blasiak and Zahorulko (2016) used numerical methods to solve the nonlinear Reynolds equation and the motion equation of the static ring and then comparatively studied the characteristics of four mechanical seals with different end faces. The results showed that for some specific conditions, the sharp increase in angular vibration amplitude leads to the contact of rotating and static rings, and the reasonable selection of parameters can significantly reduce the amplitude of stator angular vibration. Chen et al. (2017) used numerical methods to study the disturbance behavior of gas film thickness and pressure of mechanical seals with or without angular excitation, where it was found that the dynamic wedge clearance with a fixed angle between sealing surfaces would be formed under the action of angular excitation. Li et al. (2020) established a 3-DOF dynamic model considering the cavitation effect, extrusion effect, and end face contact, where the dynamic response of a spiral groove liquid film seal under three impacts (pressure change, shaft drift, and shaft bending) was studied. The results showed that the mechanical seal can keep the hydrodynamic lubrication state without surface contact when the pressure Gaussian pulse changes. But it will cause excessive leakage when the axial drift and bending impact conditions occur. Badykov et al. (2018) took the mechanical secret recipe with rotary grooves as the research object and introduced the fluid–structure coupling simulation method, where the Reynolds average Navier–Stokes equation and the rigid body motion dynamics equation were solved. They investigated the response of the stationary ring and the change of film thickness under different excitation signals applied by the rotating ring.
It can be seen from the aforementioned research status and associated analysis that although some scholars have carried out research on the dynamic characteristics of mechanical seals, there are few studies on mechanical seals that require higher safety performance and working ranges such as reactor coolant pumps. Moreover, many studies have only focused on the theoretical analysis of simplified models. Therefore, in this study, the dynamic characteristics of a waveform end face mechanical seal in a reactor coolant pump are numerically studied by unsteady computational fluid dynamics. The rigid body dynamic equations and Navier–Stokes equations were numerically solved by fluid–structure coupling method, and the dynamic grid technology was introduced to deal with the dynamic motion of the rotating ring. The inlet pressure fluctuation, closing force fluctuation, and mechanical seal dynamic characteristics of reactor coolant pump during the start–stop process were studied. This study and associated findings considerably contribute to an in-depth understanding of mechanical seal operating mechanism and associated design optimization within reactor coolant pumps.
First, based on the dynamic grid technology, the three-dimensional fluid–structure coupling model of the mechanical seal of the reactor coolant pump is established, and the grid independence is verified. Then, the effects of inlet pressure and closing force fluctuations on the mechanical seal’s performance characteristics and the internal flow field structure are analyzed. Finally, the influence of speed change on the mechanical seal performance of the reactor coolant pump is studied.
Theoretical Model
Geometry Model
The mechanical seal is composed of a rotating ring, a sealing cavity, and a fixed static ring. The end face of the rotating ring is processed into a flat plane, while the surface of the static ring is processed into a convergent end face with a taper or amplitude. Static and dynamic pressure effects occur when the sealing medium flows through the gap between dynamic and static rings.
Figure 2 shows a wave–tilt–dam mechanical seal structure diagram. The thickness of liquid film in the gap of the sealing ring can be expressed by the following formula:
where Ro and Ri are the outer and inner diameters of the sealing ring, respectively; Rd is the turning radius; r is the radius at any point; β is the taper of the stator face; the tangent of β can be expressed as
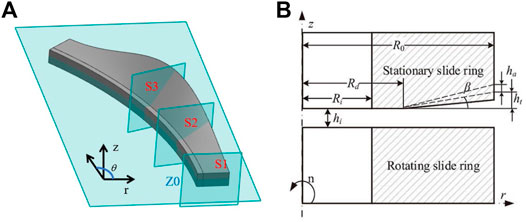
FIGURE 2. Illustrations of (A) the geometry of the wave-tilt-dam mechanical seal and (B) schematic of the mechanical seal (Liu et al., 2011).
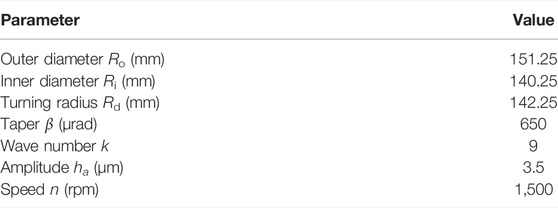
TABLE 1. Geometric parameters of hydrostatic seal (Liu et al., 2011).
Seal leakage is one of the key parameters that represent the mechanical seal’s performance. For the fluid mechanical seal, if the leakage is too small, the end faces of the seal ring may directly contact, thus causing the wear of the seal ring. If the leakage is too large, the seal fails. In numerical simulation, the leakage is calculated by monitoring the flux at the outlet, that is, r = Ri:
Sealing opening force represents the bearing capacity of the liquid film in the seal ring clearance, and it can be obtained by integrating the liquid film pressure along the end face of the seal:
The temperature of the sealing medium has a significant effect on the mechanical seal of a reactor coolant pump. Too high working medium temperature would cause vaporization of the liquid film, which leads to the vibration of the sealing surface during operation, and subsequent sealing failure. High working medium temperature would also cause thermal deformation of the sealing ring, thus increasing the friction, and further deterioration of the working environment. The temperature of the working medium increases gradually along the flow direction, so the maximum temperature usually occurs at the outlet. In this study, the average temperature difference between the seal’s outlet and the inlet zones is used as one of the parameters to measure the performance of mechanical seals, which is defined as follows:
Governing Equations
For the unsteady flow of incompressible Newtonian fluid, its governing equation includes the following:
Continuity equation:
where u is velocity vector.
Momentum equation:
where p is the pressure, ρ is density, t is time, and ν is kinematic viscosity.
Energy equation:
where cp is specific heat capacity, λ is the heat conduction coefficient of the sealing medium, and Φ is the dissipation function, or otherwise, the heat from end face viscous shear friction. The latter is expressed as follows:
The stator moves rigidly along the axial direction, and the equation of motion is as follows:
where m is the static sub-mass; Fopen is the opening force, which is positive along the positive direction of z-axis; and Fclose is the opening force, which is negative along the z axis.
Boundary Conditions
During the operation, the rotating ring rotates, and the static ring is fixed with the sealing cavity. Therefore, the static ring surface is set with no slip boundary condition, while the rotating ring is set with a rotating speed of 1,500 rpm. The inlet and outlet boundary conditions are set to pressure inlet and pressure outlet, respectively. When the inlet pressure fluctuation is not considered, the total inlet pressure is 5 MPa, and the outlet static pressure is set as 101325 Pa. The total inlet temperature is set to 323.15 K. Due to the fact that the geometric model of the investigated mechanical seal’s wavy end face has periodicity, a period is selected in the calculation, leading to a periodic boundary condition with a period of 40° (Su et al., 2020).
Numerical Method
In this study, numerical simulations are performed with Fluent software. The finite volume method is used to discretize the equations in time and space. The SIMPLE algorithm is used to decouple pressure and velocity. The second-order discrete scheme is used for the spatial discretization of pressure field, while the second-order upwind discrete scheme is applied to both the momentum and energy equations. Only the laminar flow calculation model is considered. The equation of motion is solved by using the Newmark-β method. For unsteady calculation, different time steps are selected to calculate the mechanical seal without disturbance. When the time step was 4 × 10⁻⁶ s, the Courant–Friedrichs–Lewy (CFL) number in most areas of the computational domain is less than 1, so the time step of unsteady calculation was set as 4 × 10⁻⁶ s, and the residual error of each time step was reduced to 10−4 or the calculation was completed at 50 iterations.
Ansys Fluent’s dynamic mesh method module provides three features, namely, smoothing, layering, and remeshing, which are respectively, applied to different situations. The core of the layering method is to split (or merge) after stretching (or compressing) to realize the motion of the boundary. There are two methods of updating the grid: one is based on the mesh height and the other based on the mesh ratio. The process involved in the height-based dynamic layer update method is as follows: First, it is assumed to exist at an ideal height li on the motion boundary that needs to be updated. The boundary movement eventually leads to the grid being stretched or compressed. As shown in Figure 3A, when the mesh height
FIGURE 3. Schematic diagram of grid (A) computational domain grid and (B) dynamic layer grid update method.
In the numerical simulation, the grid independence was verified by changing the number of axial, radial, and circumferential grids, as shown in Table 2. In this study, wave–tilt–dam mechanical seals with a base film thickness of 5 μm are selected for the grid independence verification. Figure 4 shows the evolution of both inlet-to-outlet temperature difference and leakage with the increasing grid number. It can be seen that for both cases as the grid number increases, both the inlet-to-outlet temperature difference and leakage go through a brief steep variation before stabilizing for a wider range of grid numbers. When the computational domain grid increases from 4 million to 7.5 million, inlet-to-outlet temperature and leakage change by 0.13 and 0.14%, respectively. Therefore, the grid of 4 million nodes has been selected for further numerical calculations under different working conditions.
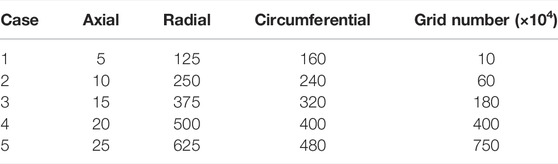
TABLE 2. Grid number in different examples.
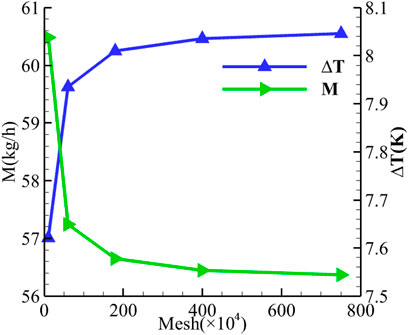
FIGURE 4. Variation of M and ∆T as the mesh increases.
Results and Discussions
In this research, typical wave–tilt–dam mechanical seals are used to study the effect of three operating conditions, namely, the fluctuating inlet pressure, fluctuating closing force, and changing rotational speed on the mechanical seal’s operating characteristics under start–stop circumstances. Based on the steady-state calculation results of the wave–tilt–dam mechanical seal with a 5-μm-base film thickness, the unsteady state calculation was conducted. The dynamic characteristics of the mechanical seal were studied by deliberately inflicting different disturbances, and the influence laws were mainly explored through the selected parameters such as leakage, base film thickness, and inlet-to-outlet temperature difference. The disturbance modes mainly included the sinusoidal and step change modes of fluctuated parameters. The unfluctuated parameters remained unchanged. When a sinusoidal disturbance was applied, the calculation was conducted for seven cycles, with a 300-Hz fluctuation frequency. On the other hand, when a step disturbance was applied, the calculation was run until the stabilization of the main testing parameters (leakage, inlet-to-outlet temperature difference, and liquid film thickness) and then put to stop.
Influence of Inlet Pressure Fluctuation on Mechanical Seal Dynamic Characteristics
Two forms are adopted for inlet pressure fluctuation, where sinusoidal fluctuation is shown as follows:
where pin is the inlet pressure during unsteady calculation; p0 is the inlet pressure in steady-state calculation; a is the fluctuation amplitude, where 4, 6, 8, and 10% are selected for this study; and f is the fluctuation frequency, which is selected as 300 Hz for this study.
Step fluctuation is shown as follows:
where a is the fluctuation amplitude, and 4, 6, 8, and 10% are selected for this study.
Figure 5 shows the variation patterns of performance parameters such as static ring displacement, inlet-to-outlet temperature difference, and the outlet flow rate with time under sinusoidal fluctuations of different amplitudes. For the static ring displacement, the results show that when the inlet pressure fluctuation amplitude is 10%, the maximum static ring displacement appears at t = 1.504 ms, while the maximum displacement increases by 32.27% compared with the thickness of the base film. The displacement change from the fourth peak to the fifth peak is no more than 0.3%, so the fluctuation region can be considered stable, and the corresponding time is 11.580 ms. The average frequency between the fourth peak and the seventh peak is 300 Hz, which is equal to the pressure fluctuation frequency. The displacement fluctuation amplitude is 18.93% of the base film thickness, and the offset distance is 0.1417 μm. When the fluctuation amplitude of inlet pressure was 4%, it showed a similar pattern. However, its fluctuation amplitude decreased, while the maximum displacement increased by 10.78% compared with the initial test value. The fluctuation amplitude in stable fluctuation was 6.90%. When the amplitude of inlet pressure fluctuation was 6 and 8%, the displacement fluctuation was between the aforementioned two conditions.
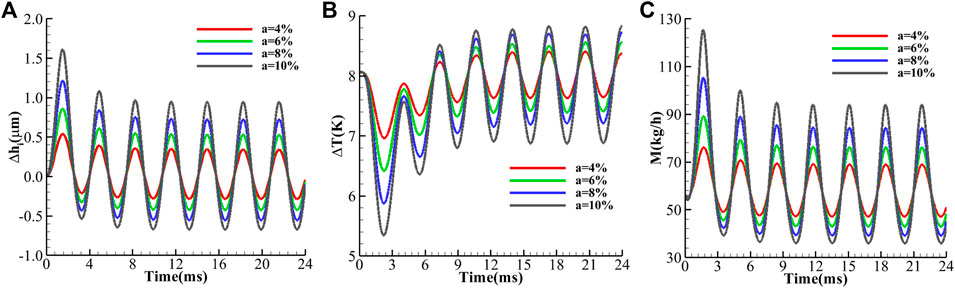
FIGURE 5. Variation of parameters with time (A) static ring displacement, (B) inlet-to-outlet temperature difference, and (C) the leakage.
For the inlet-to-outlet temperature difference, when the inlet pressure fluctuation amplitude is 10%, the minimum inlet-to-outlet temperature difference appears at the moment t = 2.212 ms, which is 0.708 ms later than the maximum displacement moment. At this moment, the inlet-to-outlet temperature difference is 5.341 K, representing a 33.54% decrease as compared to the initial moment, and the displacement change from the fourth valley to the fifth valley is no more than 0.3%. It can be considered that the fluctuation region is stable, and the corresponding time is 12.262 ms. When the fluctuation is stable, the fluctuation amplitude is 14.63%, and the offset is 7.85 K, which is lower than the inlet-to-outlet temperature difference at the initial moment. When the inlet pressure fluctuation amplitude is 4%, the inlet-to-outlet temperature difference is 6.96 K, and the initial moment decreases by 13.33%. It is worth noting that the inlet-to-outlet temperature difference corresponding to low pressure fluctuation is always higher than that corresponding to high pressure fluctuation in the period from t = 0 to T = 6.700 ms, which is different from the variation law of static ring displacement.
For leakage, when the amplitude of inlet pressure fluctuation is 10%, the maximum leakage appears at t = 1.664 ms, which is 0.160 ms later than the maximum displacement moment. The maximum leakage increases by 122.10% as compared to the initial value. The displacement changes from the fourth peak value to the fifth peak value are no more than 0.3%. Therefore, the fluctuation region can be considered stable. The corresponding time, fluctuation amplitude, and deviation distance are 11.748 ms, 66.72%, and 65.07 kg/s, respectively. This deviation distance is higher than the initial leakage. When the fluctuation amplitude of inlet pressure was 4%, it showed a similar pattern, but its fluctuation amplitude decreased, the maximum leakage increased 34.74% compared with the initial test value, and the fluctuation amplitude in stable fluctuation was 22.31%. When the amplitude of inlet pressure fluctuation is 6 and 8%, the leakage fluctuation is between the previous two situations, and its fluctuation frequency is 300 Hz. It is worth noting that in the period from t = 0 to T = 0.468 ms, the leakage is lower than that at the initial test time, and the flow decreases with the increase in pressure fluctuation. The trough value appears at t = 0.240 ms, and the lowest value decreases by 4.25% compared with the initial time.
Through the analysis of the main performance parameters of the mechanical seal of the reactor coolant pump, it can be seen that when the sinusoidal pressure fluctuation is applied, the sealing performance parameters exhibit unstable fluctuations for a period of time, followed by stable fluctuations. The fluctuation intensity is much higher than the disturbance intensity, and they tend to deviate from the initial values. In addition, the fluctuation amplitude of leakage is not proportional to the fluctuation amplitude of static ring displacement. The fluctuation range of leakage is much larger than that of static ring displacement, indicating that the change of the static ring position changes not only the liquid film flow area but also the liquid film flow field distribution.
In order to further analyze the flow field of the sealing liquid film, the distribution law of physical quantity in section Z0 = 4 μm (as shown in Figure 2A) at typical time was analyzed. Figure 6 shows the pressure distribution variation of Z0 at different times when the pressure fluctuation amplitude is 4 and 10%. The results show that the high-pressure region appears in the static loop peak region at the initial moment, and the pressure changes greatly from the turning radius to the outlet, while the pressure change is not obvious near the entrance. In the region of the static ring trough however, the pressure changes drastically near the entrance. When t = 0.24 ms, the pressure near the turning radius of the static loop trough decreases compared with the initial moment, and the pressure decrease degree increases with the inlet pressure fluctuation range. At this moment, the leakage reaches the maximum value, and the pressure near the turning radius of the static ring trough increases, while the pressure gradient tends to be uniform. At t = 23.52 ms, representing the moment when the leakage fluctuates steadily, the leakage is at its lowest value, while pressure near the turning radius of the static ring trough decreases as compared to the initial moment. The low-pressure zone occupies most of the area, and the pressure gradient near the entrance rises. It can therefore be seen that inlet pressure fluctuations mainly affect the pressure distribution rule at the static ring trough, where with the increase in inlet pressure fluctuation amplitude, the pressure fluctuation at the static ring trough becomes larger. However, this has little influence on the pressure distribution at the crest.
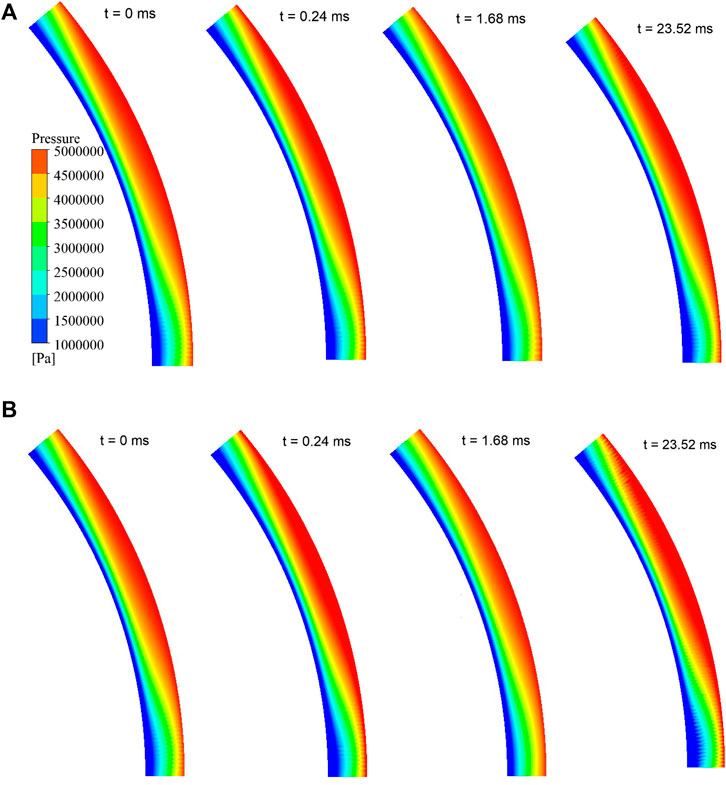
FIGURE 6. Pressure distribution varies with time (A) a = 4% and (B) a = 10%.
Figure 7 shows the temperature distribution variation of Z0 at different times when the pressure fluctuation amplitude is 4 and 10%. It is shown that a low-temperature region appears in the static ring peak region, while the high-temperature region appears between the static ring peak and the trough near the exit. At t = 0.24 ms, the temperature drops slightly as compared to the initial time. At t = 1.68 ms however, it decreases significantly, with the increase in the inlet pressure fluctuation range. At t = 23.52 ms, although the leakage reached the trough value, the temperature did not reach the peak value, and the temperature distribution was similar to the initial time. This indicates that the increase in fluid flow does not immediately take away the heat generated; there is a delay effect, and the decrease in flow does not immediately “accumulate” the heat and cause the temperature to increase.
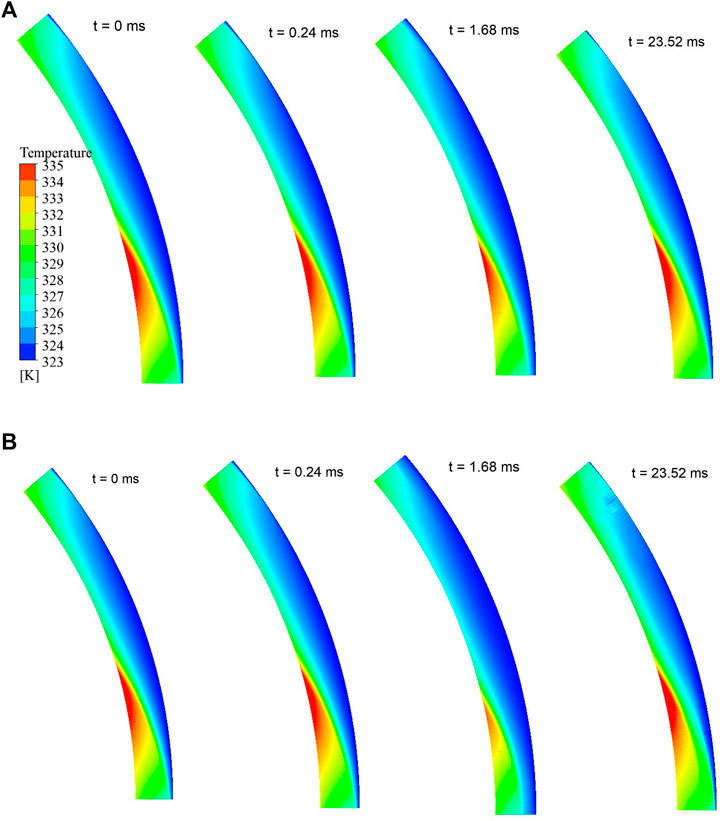
FIGURE 7. Temperature distribution varies with time (A) a = 4% and (B) a = 10%.
Figure 8 shows the velocity distribution change law on Z0 in different times for pressure fluctuation amplitudes of 4 and 10%. It can be seen that high-speed zones appear in the initial times on the static ring wave area, and the velocity gradient near the turning radius is bigger. Low-speed areas appear in the static ring trough area with the almost uniform distribution, leading to a smaller velocity gradient. At t = 0.24 ms, there is no significant difference in velocity distribution mode compared to the initial time. At t = 1.68 ms however, the velocity increases significantly compared with the initial moment and increases with the increase in the inlet pressure fluctuation range. At t = 23.52 ms, the velocity decreases significantly, leading to a corresponding increase in the velocity gradient near the turning radius of the static ring crest. A large velocity change occurs before and after the turning radius. When a = 10%, the flow rate is lower (smaller velocity), and the velocity gradient at the turning radius is larger.
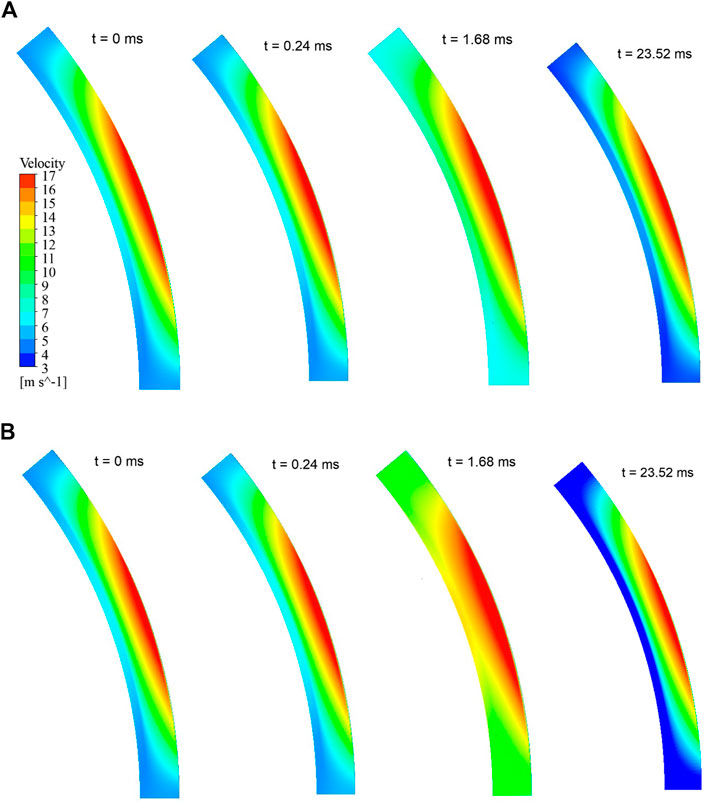
FIGURE 8. Velocity distribution varies with time (A) a = 4% and (B) a = 10%.
In order to further study the relationship between the flow change, static ring displacement, and velocity change, Figure 9 has been used to show the radial velocity distribution contour diagram of different circumferential sections. In this figure, the S1 section is at α = 0°, corresponding to the static ring trough. The S3 section is at α = 20°, corresponding to the static ring peak. The S2 section is at α = 10°, thus being between the S1 and S3 (as shown in Figure 2A). It is shown that the radial velocity of the circumferential section increases gradually from the static ring trough to the static ring peak at the initial moment. For S1 and S2 sections, the velocity distribution is uniform, while it increases slightly in the exit section. For the S3 section, the velocity increases significantly in the exit section. This feature is more pronounced in the vicinities of the rotating ring. When t = 0.24 ms, the static ring moves up as a result of a slight increase in the base film thickness. The cross-sectional velocity in the S3 section is also found to increase, while that in the S1 section decreased. In addition, the velocity of the inlet section is higher than that of the outlet section, which is more obvious when a = 10%. This, in other words, implicates the existence of large pressure fluctuations. This situation can also be seen from Figure 4C. It indicates that the leakage does not increase with the increase in the thickness of the base film, mainly due to the decrease in the cross-sectional velocity at S1. When t = 1.68 ms, the static ring moves up further, the thickness of the foundation film increases further, and the velocity in S1, S2, and S3 sections increases significantly. This corresponds to Figure 4C, when t = 1.68 ms, the leakage is much higher than the initial moment, and when a = 10%, the leakage increases by 122.10%. However, the increase in base film thickness is only 30.96%, which indicates that the increase in leakage is the result of both the increase in base film thickness and radial velocity simultaneously. When t = 1.68 ms, the static ring moves down, the thickness of the base film decreases, and the radial velocity of each section decreases (the leakage decreases).
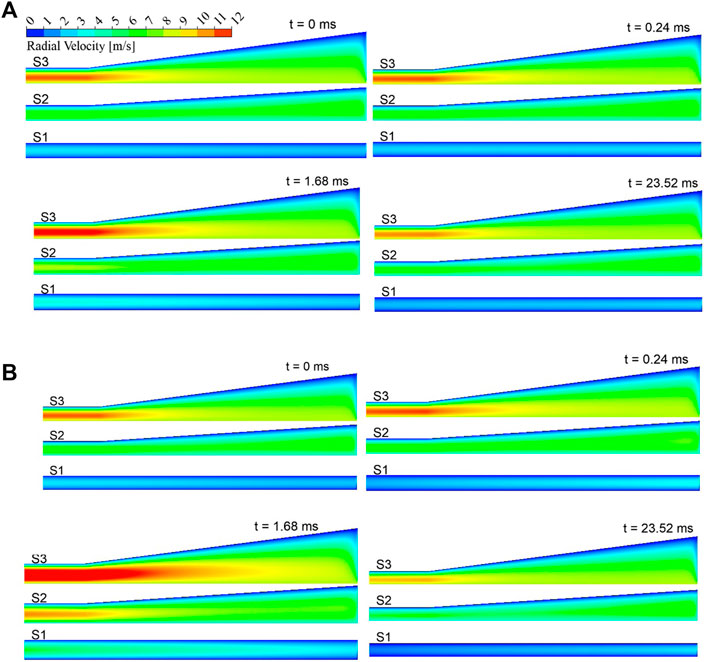
FIGURE 9. Radial velocity distribution varies with time (A) a = 4% and (B) a = 10%.
Figure 10 shows the evolution of main performance parameters with time, considering different inlet pressure’s step fluctuations. Study findings, as presented in this figure, show that the growth of static ring displacement and leakage in the early stage is rapid, followed by a slowly ascending trend. But there has been a brief leakage decrease at the beginning of time (close to t = 0.1 ms), followed by a steep ascent. As for the inlet-to-outlet temperature difference, a rapid descent is recorded within the time interval from 0.2 to 2.8 ms, although there have been slight differences in evolutional trends for different step fluctuations. For the 10% step disturbance, static ring displacement exceeded 99.57%, the change of inlet-to-outlet temperature difference exceeded 75.94%, and leakage change was as high as 572.06%. For the 4% step disturbance, static ring displacement exceeded 34.56%, the change of inlet-to-outlet temperature difference exceeded 52.35%, and leakage change exceeded 126.55%. It therefore can be seen that even a small step disturbance would inflict a great impact on the sealing performance.
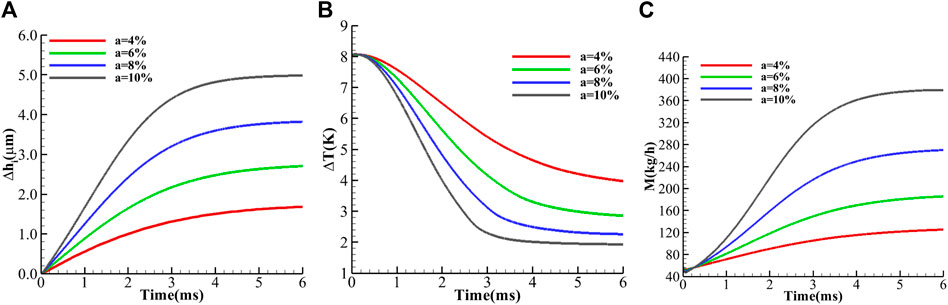
FIGURE 10. Variation of parameters with time (A) static ring displacement, (B) inlet-to-outlet temperature difference, and (C) the leakage.
Influence of Closing Force Fluctuation on Dynamic Characteristics of Mechanical Seals
For the fluctuation of closing force, two pressure fluctuation forms are adopted, whose sinusoidal fluctuation is shown as follows:
where Fclose is the closing force in unsteady calculation; F0 is the closing force in steady calculation; a is the fluctuation amplitude where 4, 6, 8, and 10% are selected fluctuation amplitudes in this study; and f is the fluctuation frequency, which is selected as 300 Hz.
Step fluctuation is shown as follows:
where a is the fluctuation amplitude, and 4, 6, 8 and 10% are selected for this study.
Figure 11 shows the change law of main performance parameters with time, under different closing force fluctuation amplitudes. The results show that for the static ring, when a 10% closing force fluctuation is applied, the static ring’s maximal displacement is recorded at t = 1.500 ms. The maximum displacement increased by more than 33.66% compared with the initial film thickness, which was very similar to the peak time when the inlet pressure fluctuated, but the static ring displacement was slightly larger than the inlet pressure fluctuation displacement (32.27%). Similarly, the variation of static ring displacement from the fourth peak to the fifth peak is no more than 0.3%, and the corresponding time is 11.576 ms. The subsequent static ring displacement fluctuation amplitude is 19.54% of the initial film thickness, and the offset is 0.1591 μm, which are larger than the amplitude and offset of inlet pressure fluctuation. When the amplitude of closing force fluctuation decreases from 8% to 6–4%, the intensity of displacement fluctuation decreases accordingly.
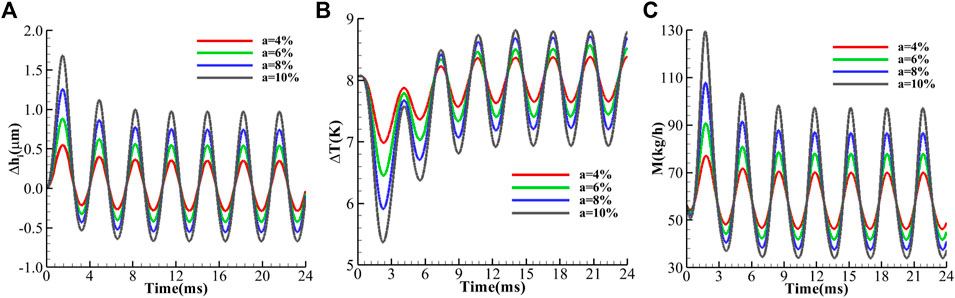
FIGURE 11. Variation of parameters with time (A) static ring displacement, (B) inlet-to-outlet temperature difference, and (C) the leakage.
For the inlet-to-outlet temperature difference, when the inlet pressure fluctuation amplitude is 10%, the minimum temperature difference appears at the moment t = 2.252 ms, 0.752 ms later than the maximum displacement moment, and the temperature difference at this moment decreases 33.21% compared with the initial moment. In the stable fluctuation, the fluctuation amplitude is 13.95%, and the deviation distance is 7.86 K. The temperature fluctuation range is smaller, and the deviation distance is closer to the initial temperature. When the amplitude of closing force fluctuation is 4%, the minimum temperature difference is 6.99 K, which is 13.06% lower than the initial time. It is noteworthy that the temperature difference corresponding to the fluctuation of low closing force is always higher than that corresponding to the fluctuation of high closing force in the period from t = 0 to t = 6.780 ms, which is different from the variation law of static ring displacement.
For leakage, when the fluctuation amplitude of closing force is 10%, the maximum leakage appears at t = 1.760 ms, 0.260 ms later than the maximum displacement moment. The maximum leakage increases 129.05% compared with the initial value, and the displacement change from the fourth to the fifth peak is no more than 0.3%. So the fluctuation region can be considered stable. The corresponding time is 11.824 ms, the fluctuation amplitude is 72.63%, and the deviation distance is 65.59 kg/s, which is higher than the initial leakage. When the amplitude of closing force fluctuation is 4%, it shows a similar pattern, but its fluctuation amplitude decreases. The maximum leakage increases by 36.36% compared with the initial test value, and the fluctuation amplitude in stable fluctuation is 24.12%. When the amplitude of inlet pressure fluctuation is 6 and 8%, the leakage fluctuation is between the aforementioned two situations. It is worth noting that in the period from t = 0 to t = 0.680 ms, the leakage is lower than that at the initial test time, and the flow decreases with the increase in closing force fluctuation. The trough value appears at t = 0.400 ms, and the lowest value decreases by 10.06% compared with the initial time.
Through the analysis of the main performance parameters of the reactor coolant pump’s mechanical seal, it can be seen that when the sinusoidal closing force fluctuation is applied, the sealing performance parameters have distribution rules similar to that when the sinusoidal inlet pressure fluctuation is applied. But the fluctuation degree of both the static ring displacement and leakage are more severe, while the fluctuation degree of the inlet-to-outlet temperature difference is reduced. The time delay of maximum leakage and minimum inlet-to-outlet temperature difference is more obvious than that of the maximum static ring displacement. In addition, compared with sinusoidal inlet pressure fluctuation, the time of phenomenon of flow increases in a very short time after applying closure force disturbance, and the valley flow decreases significantly.
In order to further analyze the flow field of the sealing liquid film, the distribution law of physical quantities in section Z0 = 4 μm (as shown in Figure 2A) at typical times was analyzed. Figure 12 shows the pressure distribution variation rule of Z0 at different times when the fluctuation range of closing force is 4 and 10%. The distribution rule is similar to that when the inlet pressure fluctuation is applied. At the initial moment, a high-pressure region appears in the static loop peak region, and the pressure change from the turning radius to the outlet is quite large, while it is not obvious near the entrance. In the region of the static ring trough however, the pressure is found to drastically change, especially near the entrance. When t = 0.40 ms, the pressure near the turning radius of the static loop trough decreases as compared to the initial moment, where the decreasing pace increases with the inlet pressure fluctuation range. This goes hand in hand with the leakage characteristics at t = 0.40 ms, as presented in Figure 10C. When t = 0.40 ms, the leakage reaches the maximum value, and the pressure near the turning radius of the static ring trough increases, while the pressure gradient tends to be uniform. At t = 23.68 ms, corresponding to the trough moment when the leakage fluctuates steadily, the leakage is the lowest at this moment, and the pressure near the turning radius of the static ring trough decreases compared with the initial moment. The low-pressure area occupies most of the area, and the pressure gradient near the entrance rises. It can be seen that the fluctuation of the closing force mainly affects the pressure distribution law at the static ring trough, where the same pressure fluctuation at the static ring trough increases with the inlet pressure fluctuation amplitude, and has little influence on the pressure distribution at the peak.
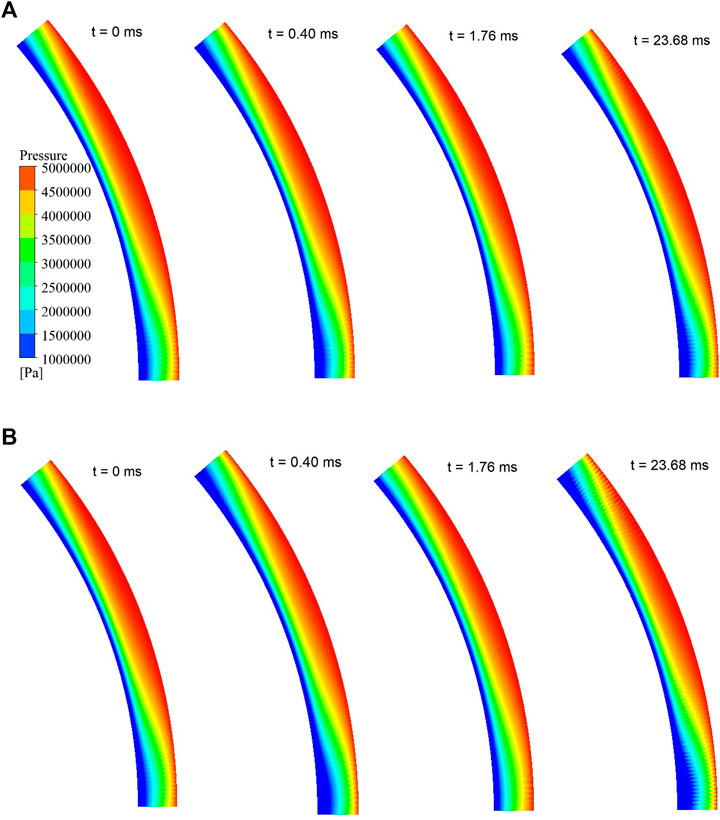
FIGURE 12. Pressure distribution varies with time (A) a = 4% and (B) a = 10%.
Figure 13 shows the temperature distribution variation of Z0 at different times when the applied fluctuation amplitude of closing force is 4 and 10%. The low-temperature region appears in the static ring peak region, while high-temperature region appears between the static ring peak and the trough near the exit. At t = 0.40 ms, the temperature drops slightly compared with the initial time. At t = 1.76 ms, the temperature decreased significantly with the increase in the inlet pressure fluctuation range. At t = 23.68 ms, although the leakage had reached the trough value, the temperature did not reach the peak value. The temperature distribution was similar compared with the initial time, and the value was the same. This indicates that the increase in fluid flow does not immediately take away the heat generated, and there is a delay effect. Moreover, the decrease in flow does not immediately “accumulate” the heat and cause the temperature to increase.
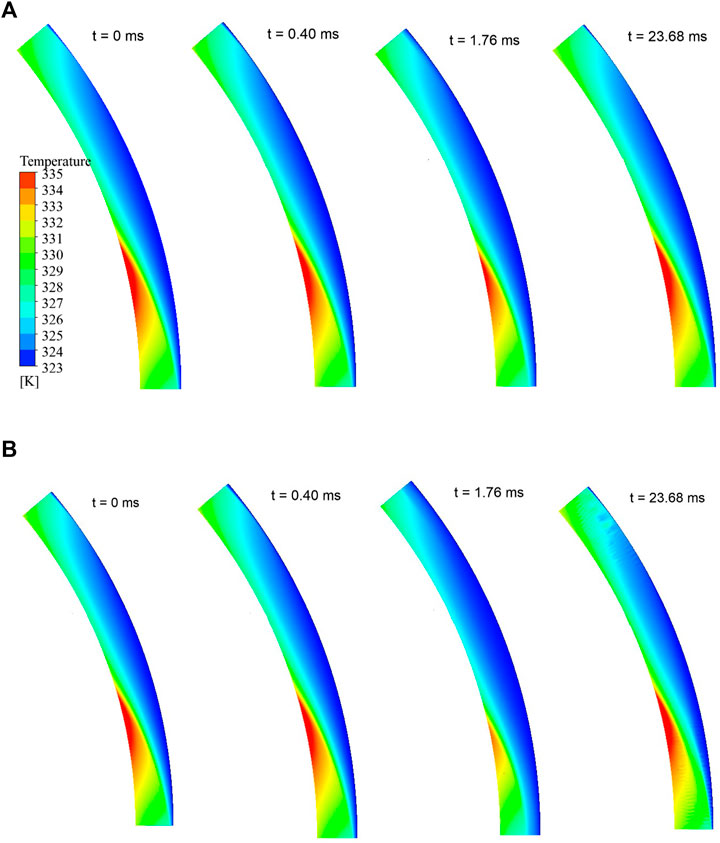
FIGURE 13. Temperature distribution varies with time (A) a = 4% and (B) a = 10%.
Figure 14 shows the velocity distribution change law at Z0 in different times, for the closing force fluctuation amplitudes of 4 and 10%. Study results show that high-speed zones appear at the initial time in the static ring wave area, and the velocity gradient near the turning radius is bigger. The low-speed zone, on the other hand, appear in the static ring trough area with a somewhat uniform distribution (velocity gradient is smaller). At t = 0.40 ms, there is no significant difference in the velocity distribution mode as compared to the initial time. At t = 1.76 ms, the velocity obviously increases with the closing force fluctuation range. At t = 23.68 ms, the velocity decreases significantly compared with the initial moment, leading to a subsequently large velocity gradient near the turning radius of the static ring crest. Large velocity change is found occur before and after the turning radius. When a = 10%, the flow rate is lower, corresponding velocity is also smaller, and the velocity gradient at the turning radius is larger.
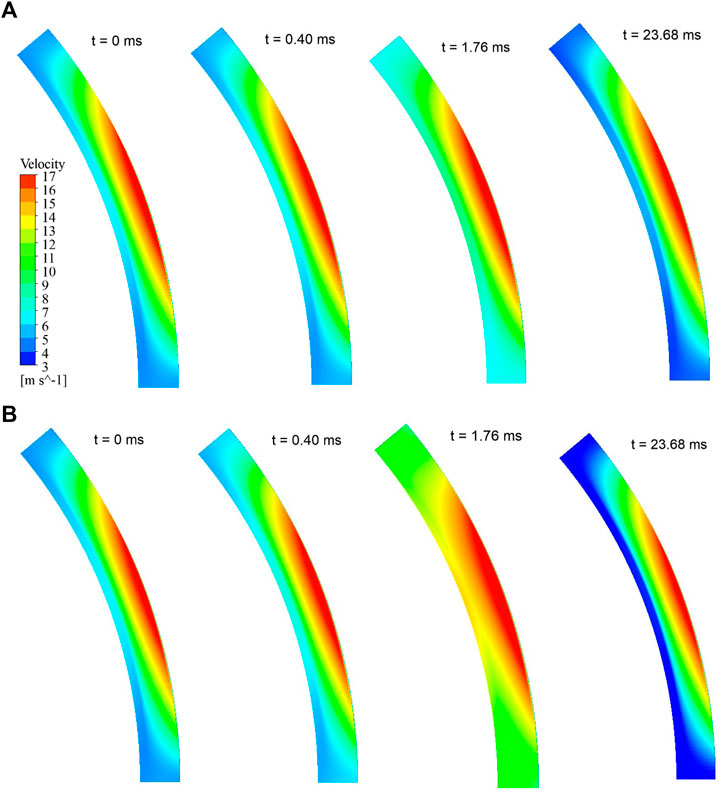
FIGURE 14. Velocity distribution varies with time (A) a = 4% and (B) a = 10%.
The relationship between flow change, static ring displacement, and velocity change is further studies using the radial velocity distribution cloud diagram of different circumferential sections, as shown in Figure 15. The results show that the radial velocity at the circumferential section increases gradually from the static ring trough to the static ring peak at the initial moment. For S1 and S2 sections, the velocity distribution is uniform, while it slightly increases in the exit section. For the S3 section, the velocity increases quickly, especially in the exit section, where high-velocity zones are predominantly located in the vicinal area to the rotating ring region. When t = 0.40 ms, the static ring moves up, the thickness of the base film slightly increases and the cross-sectional velocity of S3 increases; while the velocity in the S1 cross section decreases. In addition, the velocity of the inlet section is higher than that of the outlet section, which is more obvious when a = 10%., implicating that the pressure fluctuation is large. This corresponds to Figure 10C where when t = 0.240 ms, the leakage is lower than the initial moment, indicating that the leakage does not increase with the increase in foundation film thickness, mainly due to the velocity decrease in the S1 cross section. When t = 1.76 ms, the static ring moves up further, the thickness of the base film increases further, and the velocity of S1, S2, and S3 sections all increase significantly, which corresponds to Figure 10C; when t = 1.76 ms, the leakage is much higher than the initial moment. When a = 10%, the leakage increases as high as 129.05%. The increase in base film thickness is only 33.66%, which indicates that the increase in leakage is the result of a simultaneous increase in both the base film thickness and radial velocity. When t = 1.76 ms, the static ring moves down, the thickness of the base film decreases, the radial velocity of each section decreases, and the leakage consequently decreases.
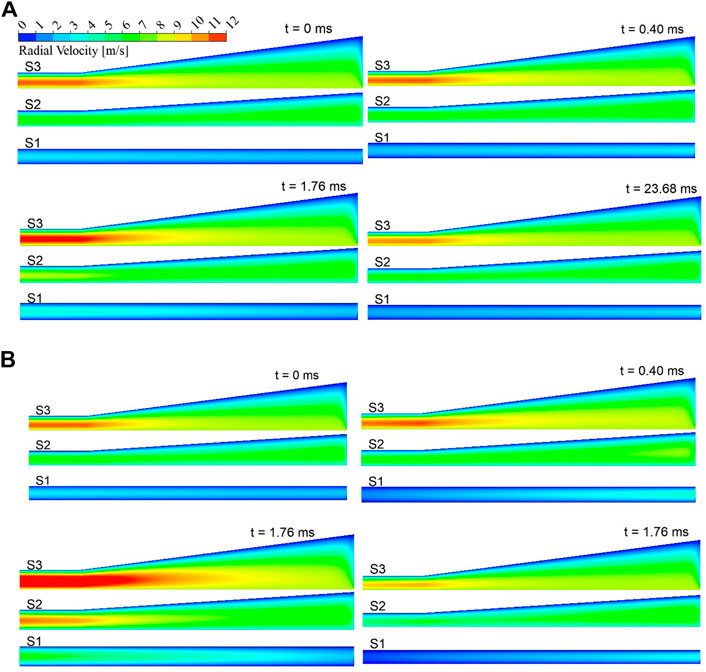
FIGURE 15. Radial velocity distribution varies with time (A) a = 4% and (B) a = 10%.
In general, when the closing force and inlet pressure fluctuations are applied, the distribution law of the liquid film flow field is similar for both cases, but there is a slight difference in terms of numerical values.
Figure 16 shows the variation rules of main performance parameters under different step fluctuations of closing force. It is shown that at t = 6.0 ms, the performance parameters are all stable. On the other hand, from t = 0 ms, both the static ring displacement and leakage are found to increase rapidly in the early stage, while they tend to slow down in the later stage. But the leakage decreases in a very short period of time at the beginning. The rapid change of the inlet-to-outlet temperature difference mainly occurs in the middle stage, and the change is slow afterward. Under a 10% step disturbance, static ring displacement is more than 115.82%, the change of inlet-to-outlet temperature difference is more than 78.98%, and leakage change is as high as 649.19%. Even for a step disturbance as low as 4%, static ring displacement is more than 36.74%, the change of inlet-to-outlet temperature difference is more than 53.50%, and the leakage change is more than 127.22%. It can therefore be seen that even a small step disturbance will have a great impact on the sealing performance. In addition, the change caused by the closing force fluctuation, in terms of static ring displacement, inlet-to-outlet temperature difference, and leakage, is larger than that caused by the inlet pressure fluctuation.
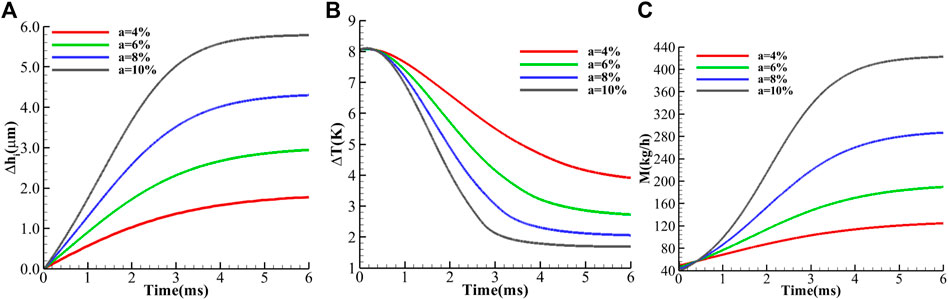
FIGURE 16. Variation of parameters with time (A) static ring displacement, (B) inlet-to-outlet temperature difference, and (C) the leakage.
Influence of Speed Fluctuation on Dynamic Characteristics of Mechanical Seals
It is also necessary to study the influence of speed fluctuation on the mechanical seal performance of a reactor coolant pump. Table 3 shows the steady-state calculation results under different rotational speeds. With the increase in the rotational speed, the leakage decreases gradually, but the change range is very small. Even if the rotational speed reaches 133%, the leakage only decreases by 0.36%. Similarly, the opening force decreases gradually with the increase in the rotational speed. When the rotational speed reaches 133%, the opening force decreases by 0.23%. When the rotational speed is 1500 rpm, the inlet-to-outlet temperature difference is 8.036 K. With the rotational speed decreasing from 1500 to 0 rpm, the inlet-to-outlet temperature difference decreases by 85.28%. When the speed is 133% of the normal rated speed, the inlet-to-outlet temperature difference increases by 58.29% compared with that at the normal rated speed. When the moving ring is stationary, that is, the rotation speed is 0 rpm, the inlet-to-outlet temperature difference is 1.183 k, indicating that there is a shear force in the flow direction of the liquid film, but the shear force in the flow direction is small, and the temperature difference between the inlet and outlet is small. With the increase in rotational speed, the tangential shear force increases gradually. When the speed reaches the rated speed, the tangential shear force is much larger than the flow direction shear force, and the fluid temperature increases rapidly.
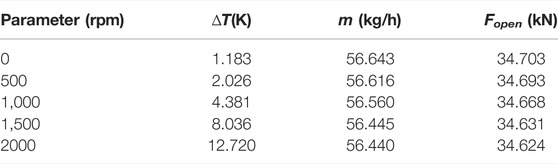
TABLE 3. Performance of two kinds of speed.
In order to further study the temperature of the liquid membrane as the rotational speed change, Figure 17 shows the Z0 cross-sectional temperature distribution under different speeds. The results show that as the speed increases, the cross-sectional temperature is gradually increased, and the temperature distribution is uneven. When the rotational speed is 0 rpm, the temperature distribution of Z0 cross section is relatively uniform, and the temperature at the exit is slightly elevated. With the increase in the speed, the temperature of the inlet is gradually increased, and the temperature at the outlet is gradually increased, but the temperature rise at the peak is small, the temperature rise in the wave valley is large, and the inlet temperature distribution is unevenly distributed. This is due to the thickness of the liquid membrane at the imported peak, the fluid cutting shear is weak, and the temperature rise is not obvious.
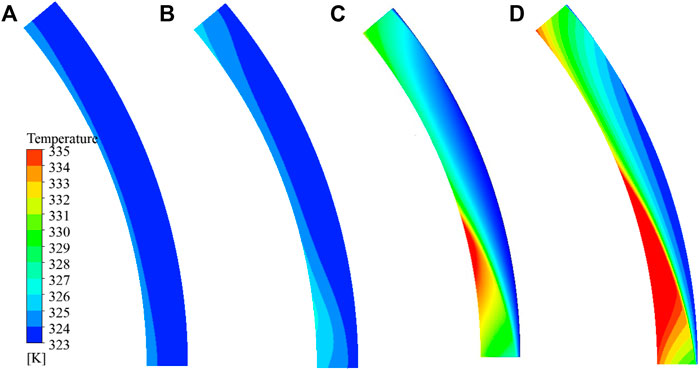
FIGURE 17. Temperature distribution at different speeds (A) 0 rpm, (B) 500 rpm, (C) 1500 rpm, and (D) 2000 rpm.
Conclusion
In this study, the waveform end face mechanical seal of a reactor coolant pump is taken as the research object. A three-dimensional thermal fluid–structure coupling analysis model is established, and the dynamic grid technology is introduced. Then, the effect mechanism of three parameters, namely, the inlet pressure fluctuation, closing force fluctuation, and speed fluctuation on the seal performance characteristics, is numerically studied. This study’s main concluding remarks are drawn as follows:
1) When sinusoidal pressure fluctuation is applied, the sealing performance parameters appear unstable for a period of time then present almost stable fluctuations. The fluctuation intensity is much higher than the disturbance intensity, and the fluctuation deviates from the initial value. When a 10% fluctuation is applied, there are significant changes in static ring displacement, inlet-to-outlet temperature difference, and leakage, where their respective peak values change by 32.27, 33.54, and 122.10%, as compared to the initial test state. The change of the static ring position changes not only the liquid film flow area but also the liquid film flow field distribution. The peaks of inlet-to-outlet temperature difference and leakage were 0.708 and 0.160 ms later than that of the static ring displacement, respectively. In addition, seal parameters are more sensitive to step form fluctuations, where, for instance, an applied step fluctuation as small as 4% results in static ring displacement that exceeds 34.56%, temperature difference exceeding 52.35%, and leakage beyond 126.55%.
2) When the sinusoidal form of closing force fluctuation is applied, the static ring displacement, inlet-to-outlet temperature difference, and leakage change show similar distribution rules as when the sinusoidal form of inlet pressure fluctuation is applied. However, the static ring displacement and leakage fluctuation degree are more severe, and the fluctuation degree of inlet-to-outlet temperature difference decreases. The time delay of maximum leakage and minimum temperature difference is more obvious than that of maximum displacement. In addition, the change of static ring displacement, inlet-to-outlet temperature difference, and leakage caused by step fluctuation of the closing force is larger than that caused by the step fluctuation of inlet pressure. When a 4% step disturbance is applied, the static ring displacement is over 36.74%, the temperature difference is over 53.50%, and the leakage goes beyond 127.22%.
3) The effect of speed change on the reactor coolant pump mechanical seal’s inlet-to-outlet temperature difference is remarkable, whereas its impact on leakage and opening force is negligible. It is found that when the speed is decreased from 1500 to 0 rpm, the inlet-to-outlet temperature difference decreases by 85.28%; where, on the other hand, the leakage and opening force increase by 0.35 and 0.21%, respectively.
Data Availability Statement
The original contributions presented in the study are included in the article/Supplementary Material, further inquiries can be directed to the corresponding author.
Author Contributions
J–LW: conceptualization, methodology, software, formal analysis, and writing—original draft. X–YC: methodology, software, formal analysis, and writing—original draft. MB: methodology, formal analysis, and writing—review and editing. WS: conceptualization, methodology, formal analysis, writing—review and editing, supervision and, funding acquisition. JW: methodology, formal analysis, and supervision.
Funding
This work is supported by the National Natural Science Foundation of China (51976043), LiaoNing Revitalization Talents Program (XLYC2007083), Liaoning BaiQianWan Talents Program (LNBQW2020Q0141), and Talent scientific research fund of LSHU (2020XJJL-010).
Conflict of Interest
The authors declare that the research was conducted in the absence of any commercial or financial relationships that could be construed as a potential conflict of interest.
Publisher’s Note
All claims expressed in this article are solely those of the authors and do not necessarily represent those of their affiliated organizations, or those of the publisher, the editors, and the reviewers. Any product that may be evaluated in this article, or claim that may be made by its manufacturer, is not guaranteed or endorsed by the publisher.
References
Badykov, R., Falaleev, S., Wood, H., and Vinogradov, A. (2018). “Gas Film Vibration Inside Dry Gas Seal Gap,” Global Fluid Power Society PhD Symposium GFPS, Samara, Russia, 1–6. doi:10.1109/GFPS.2018.8472383
Blasiak, S., and Zahorulko, A. V. (2016). A Parametric and Dynamic Analysis of Non-contacting Gas Face Seals with Modified Surfaces. Tribology Int. 94, 126–137. doi:10.1016/j.triboint.2015.08.014
Brunetière, N., and Modolo, B. (2009). Heat Transfer in a Mechanical Face Seal. Int. J. Therm. Sci. 48 (4), 781–794. doi:10.1016/j.ijthermalsci.2008.05.014
Chávez, A., and De Santiago, O. (2020). Determining a Pressure Response Function of the Hose and Sensor Arrangement for Measurements of Dynamic Pressure in a Dry Gas Seal Film. Tribol Int. 143, 106007.
Chen, Y., Jiang, J., and Peng, X. (2017). Dynamic Characteristics and Transient Sealing Performance Analysis of Hyperelliptic Curve Groove Dry Gas Seals. Tribology Int. 116, 217–228. doi:10.1016/j.triboint.2017.07.017
Cochain, J. (2018). Numerical and Experimental Study of Misaligned and Wavy Mechanical Face Seals Operating under Pressure Pulses and Pressure Inversions. Université de Poitiers.
Falaleev, S. V., and Vinogradov, A. S. (2015). Analysis of Dynamic Characteristics for Face Gas Dynamic Seal. Proced. Eng. 106, 210–217. doi:10.1016/j.proeng.2015.06.026
Feng, X., Su, W., Ma, Y., Wang, L., and Tan, H. (2020). Numerical and Experimental Study on Waviness Mechanical Seal of Reactor Coolant Pump. Processes 8, 1611. doi:10.3390/pr8121611
Gao, H., Gao, F., Zhao, X., Chen, J., and Cao, X. (2013). Analysis of Reactor Coolant Pump Transient Performance in Primary Coolant System during Start-Up Period. Ann. Nucl. Energ. 54, 202–208. doi:10.1016/j.anucene.2012.11.020
Guang, F., and Ma, X. (2021). Positioning Accuracy Determination of the Servo Axes for Grinding Wavy-Tilt-Dam Seals Using a Four-Axis Grinder. Micromachines 2, 388. doi:10.3390/mi12040388
Li, Y., Hao, M., Sun, X., Li, Z., Wang, Y., Xu, L., et al. (2020). Dynamic Response of Spiral Groove Liquid Film Seal to Impact Conditions. Tribology Int. 141, 105865. doi:10.1016/j.triboint.2019.105865
Liao, C., Huang, W., Suo, S., Liu, X., and Wang, Y. (2011). Fluid-solid strong-interaction Model of Mechanical Seals in Reactor Coolant Pumps. Sci. China Technol. Sci. 54 (9), 2339–2348. doi:10.1007/s11431-011-4427-8
Liu, M., Tan, L., and Cao, S. (2019). Theoretical Model of Energy Performance Prediction and BEP Determination for Centrifugal Pump as Turbine. Energy 172, 712–732. doi:10.1016/j.energy.2019.01.162
Liu, W., Liu, Y., Huang, W., Suo, S., and Wang, Y. (2013). Effect of Disturbances on the Dynamic Performance of a Wavy-Tilt-Dam Mechanical Seal. Tribology Int. 64, 63–68. doi:10.1016/j.triboint.2013.02.021
Liu, W., Liu, Y., Wang, Y., and Peng, X. (2011). Parametric Study on a Wavy-Tilt-Dam Mechanical Face Seal in Reactor Coolant Pumps. Tribology Trans. 54 (6), 878–886. doi:10.1080/10402004.2011.611325
Liu, Y., Liu, W., Li, Y., Liu, X., and Wang, Y. (2015). Mechanism of a Wavy-Tilt-Dam Mechanical Seal under Different Working Conditions. Tribology Int. 90, 43–54. doi:10.1016/j.triboint.2015.03.020
Lu, Y., Zhu, R., Wang, X., An, C., Zhao, Y., and Fu, Q. (2019). Experimental Study on Transient Performance in the Coasting Transition Process of Shutdown for Reactor Coolant Pump. Nucl. Eng. Des. 346, 192–199. doi:10.1016/j.nucengdes.2019.03.007
Luo, Y., Fan, Y., Han, Y., Zhang, W., and Acheaw, E. (2020). Research on the Dynamic Characteristics of Mechanical Seal under Different Extrusion Fault Degrees. Processes 8 (9), 1057. doi:10.3390/pr8091057
Ma, Y., Wang, Y., Zhou, H., and Su, W. (2021). Characteristics of the Waviness End-Face Mechanical Seal in Reactor Coolant Pump Considering the Viscosity-Temperature Effect. Front. Energ. Res. 9. doi:10.3389/fenrg.2021.763074
Migout, F., Brunetière, N., and Tournerie, B. (2015). Study of the Fluid Film Vaporization in the Interface of a Mechanical Face Seal. Tribology Int. 92, 84–95. doi:10.1016/j.triboint.2015.05.029
Ni, D., Yang, M., Zhang, N., Gao, B., and Li, Z. (2017). Unsteady Flow Structures and Pressure Pulsations in a Nuclear Reactor Coolant Pump with Spherical Casing. ASME. J. Fluids Eng. May 139 (5), 051103. doi:10.1115/1.4035638
Ni, D., Zhang, N., Gao, B., Li, Z., and Yang, M. (2020). Dynamic Measurements on Unsteady Pressure Pulsations and Flow Distributions in a Nuclear Reactor Coolant Pump. Energy 198, 117305. doi:10.1016/j.energy.2020.117305
Su, W.-T., Li, Y., Wang, Y.-H., Zhang, Y.-N., Li, X.-B., and Ma, Y. (2020). Influence of Structural Parameters on Wavy-Tilt-Dam Hydrodynamic Mechanical Seal Performance in Reactor Coolant Pump. Renew. Energ. 166, 210–221. doi:10.1016/j.renene.2020.11.123
Keywords: mechanical seal, dynamic characteristics, reactor coolant pump, numerical analysis, moving grid technology
Citation: Wang J-L, Chen X-Y, Binama M, Su W-T and Wu J (2022) A Numerical Study on Mechanical Seal Dynamic Characteristics Within a Reactor Coolant Pump. Front. Energy Res. 10:879198. doi: 10.3389/fenrg.2022.879198
Received: 19 February 2022; Accepted: 29 March 2022;
Published: 05 May 2022.
Edited by:
Xiao Liu, Harbin Engineering University, ChinaReviewed by:
Tang Xuelin, China Agricultural University, ChinaLei Tan, Tsinghua University, China
Jin-Hyuk Kim, Korea Institute of Industrial Technology, South Korea
Copyright © 2022 Wang, Chen, Binama, Su and Wu. This is an open-access article distributed under the terms of the Creative Commons Attribution License (CC BY). The use, distribution or reproduction in other forums is permitted, provided the original author(s) and the copyright owner(s) are credited and that the original publication in this journal is cited, in accordance with accepted academic practice. No use, distribution or reproduction is permitted which does not comply with these terms.
*Correspondence: Wen-Tao Su, c3V3ZW50YW9AbG5wdS5lZHUuY24=