 Quande Yuan
 Yuzhen Pi1,2
 Lei Kou
- 1Changchun Institute of Technology, Changchun, China
- 2National Local Joint Engineering Research Center for Smart Distribution Grid Measurement and Control with Safety Operation Technology, Changchun Institute of Technology, Changchun, China
- 3Qilu University of Technology (Shandong Academy of Sciences), Qingdao, China
- 4State Grid Xinjiang Electric Power Research Institute, Urumqi, China
Cybersecurity is the security cornerstone of digital transformation of the power grid and construction of new power systems. The traditional network security situation quantification method only analyzes from the perspective of network performance, ignoring the impact of various power application services on the security situation, so the quantification results cannot fully reflect the power information network risk state. This study proposes a method for quantifying security situation of the power information network based on the evolutionary neural network. First, the security posture system architecture is designed by analyzing the business characteristics of power information network applications. Second, combining the importance of power application business, the spatial element index system of coupled interconnection is established from three dimensions of network reliability, threat, and vulnerability. Then, the BP neural network optimized by the genetic evolutionary algorithm is incorporated into the element index calculation process, and the quantitative model of security posture of the power information network based on the evolutionary neural network is constructed. Finally, a simulation experiment environment is built according to a power sector network topology, and the effectiveness and robustness of the method proposed in the study are verified.
Introduction
Along with the deep transformation of the new power grid, China’s power network has gradually established a set of computer network architecture from the national grid data center down to the provinces and municipalities (Dileep, 2020; Huang et al., 2021). However, while the new form of the power grid is more intelligent, a large number of power electronic devices and digital monitoring terminals are connected. The security risk brought by the information side of the power grid has become one of the important hidden dangers that threaten the security of the power grid. (Pliatsios et al., 2020; Butt et al., 2021). Existing network attack methods are more threatening, purposeful, and large-scale. The full realization of the security situation awareness of the power information network can better assist the security managers to grasp the power grid status in time and maintain the power grid security (Lei et al., 2021). Therefore, in view of the development trend and characteristics of the new power information network, it is of great practical significance to study practical and effective methods for quantifying the security posture (Wang and Govindarasu, 2020).
In recent years, scholars around the world have considered using different methods to accurately quantify the security situation of power information networks. Wang et al. (2016) summarize the functions of various network protection systems and technologies in security defense by analyzing the impact of the structure of the communication network of electric power companies on network security. It proposed a specific scheme for applying firewall and the intrusion detection system to the communication network of electric power companies and discussed the construction of related technologies and the network security system (Li et al., 2022). Based on the system security engineering capability maturity model (SSE-CMM) proposed in Li B. et al. (2020) and Ganjkhani et al. (2021), the comprehensive fuzzy judgment method of power information security engineering is used to establish the power information network model, and the entropy weight coefficient of each evaluation factor is determined using the entropy weight coefficient method. The validity of the established model is verified through actual arithmetic cases. Panda and Das (2021) establish a new protection model for power communication networks and further clarifies the multiple elements that interfere with the security problems of power communication networks. Based on the fuzzy mathematical theory, Li Q. et al. (2020) and Qu et al. (2021) calculate element weight coefficients by constructing a fuzzy evaluation model for multiple elements, and then measure the security posture and network defense performance of the power communication network.
In summary, domestic research on power information network security is limited to traditional internet security awareness techniques or risk assessment methods based on flat systems. The quantitative index system of security posture lacks the combination with the application business of the power information network, which leads to the quantitative results cannot monitor the power information network in all aspects.
In this study, integrating business importance and network performance, we proposed a method to quantify the security posture of the power information network based on the evolutionary neural network and realized the comprehensive quantitative analysis of power information network posture. The main contributions of this study are as follows:
1) By considering the business characteristics of power grid applications, a new type of network security situational awareness architecture is designed.
2) A three-dimensional element index system with multi-dimensional network attributes is established to ensure the coupling and interconnection of element indexes and power application business, at the same time, the mathematical characterization of key element indexes is carried out.
3) The back propagation (BP) neural network optimized by the genetic evolutionary algorithm is incorporated into the calculation process of elemental indicators. The quantitative model of the security posture of the power information network is constructed, which effectively realizes the efficient calculation of the comprehensive perception process of the network security posture and the accurate quantification of the results.
This article is organized as follows: Section 2 provides a brief description of the architecture of the security posture quantification system for power information networks. The method for quantifying the security posture of power information networks is described in detail in section 3. Section 4 verifies the effectiveness of the proposed method based on the simulated experimental environment. Finally, conclusions and future recommendations are presented in section 5.
Power Information Network Security Posture Quantification System Architecture
The power information network includes a multi-layer network structure of power grid data centers, backbone networks, research networks, office networks, and provincial and local municipal networks (Liu J. et al., 2020). This means that the security situation must be a combination of security situations of each network in a certain way (Cao et al., 2019). At the same time, different departments and sub-networks have deployed different firewalls, intrusion detection systems, security audit devices, and security hierarchies. If network security data information cannot be collected from sub-networks and the information is processed centrally and interactively, the network data information is isolated from each other, leading to the emergence of security network security silos. Therefore, an accurate and intuitive situation value is an indispensable part of the security situation awareness of the power information network (Wang et al., 2021; Zhang et al., 2021).
The network security situational awareness architecture is the basis of situational awareness research for power private communication networks (Liang et al., 2021), and whether its design is reasonable to directly affect the overall feasibility of network situational awareness. In the article, the network security situation quantification of the power information network (PIN-NSSQ) architecture is designed by analyzing three levels: network hierarchy, data aggregation and analysis, and situational assessment visualization of the power information network.
Power Information Network Security Situation Quantification Method
In order to concretely reflect the state of the network security posture, the information of the element indicators gathered in the respective networks is realized as a centralized interactive process. Combined with the PIN-NSSQ architecture, different network levels are integrated to reflect the network application system complexity, network security equipment configuration defects, and other attribute characteristics of the information network (Hou et al., 2020; Qu et al., 2018). The three-dimensional security situational awareness element index system of the power information network is constructed from three dimensions of network reliability, threat, and vulnerability, and the mathematical characterization of element indexes is carried out.
Cyber Security Situation Space Elements Index System
By constructing the spatial index system of network security posture elements as shown in Figure 1, it enables the coupling and interconnection of each element index and power information network application business under the cross of attribute dimensions. An accurate, systematic, and comprehensive representation of the security situation of the power information network can be realized, and the main indicators are as follows:
1) Network vulnerability indicators: when network vulnerability element index information is obtained, the statistics of vulnerabilities are targeted at all online devices, meanwhile increasing the integrity of the device configuration and the redundancy of the network topology.
2) Network reliability index: for the actual acquisition of data information in the power information network, a comprehensive analysis of redundancy and stability is conducted.
3) Network threat indicators: when the network is attacked, it will have an impact on the operation of the equipment in the network, using threatening element attributes to fully demonstrate the severity of the threat to the network.
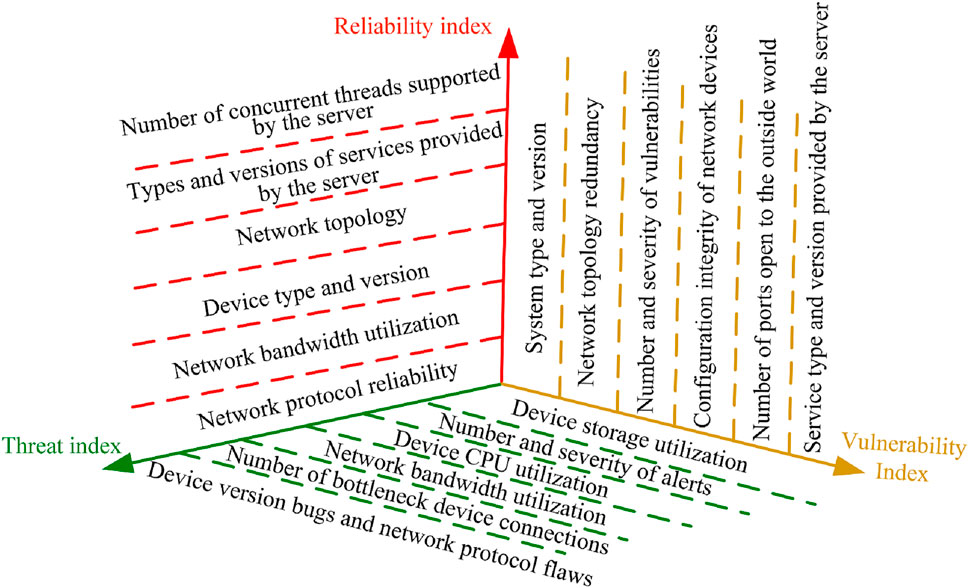
FIGURE 1. Spatial index system of network security situation elements.
Mathematical Characterization of the Power Information Network Security Situation Elements
Mathematical characterization of the vulnerability index, reliability index, and threat index of the power information network, the calculation of elemental index values, and the weighted optimization of some parameters in combination with the actual network performance are realized. The foundation is laid for the quantification of power information network situation (Xie, 2022; Shahsavari et al., 2019).
Power information network vulnerability index
where
Power information network reliability index
where
Power information network threat index
where u is the number of active network devices, servers, and hosts in the network.
Quantitative Model of Security Situation of the Power Information Network Based on the Evolutionary Neural Network
The quantification method of each dimensional element in the spatial index system is the core of the index system (Li et al., 2019). The quantitative model of perception factor index proposed in this article calculates the vulnerability index
The model is mainly divided into two steps: BP neural network index hierarchical quantification and genetic algorithm security situation value optimization. The execution process is shown in Figure 2. According to the characteristics of the three-dimensional element index system, a suitable BP neural network is constructed (Liu S. et al., 2020). The massive historical data of the power information network security situation awareness database is used as the training data of the BP neural network. The trained BP neural network can output by the prediction function according to the basic data of the current situation of the information network. In the process of optimizing the security situation value of the genetic algorithm, the prediction result of the BP neural network integrated with the performance parameter adjustment is taken as the individual fitness value. Through selection, crossover, and mutation operations, the optimal security situation value under network security threats is found. The security situation of the power information network can be accurately quantified.
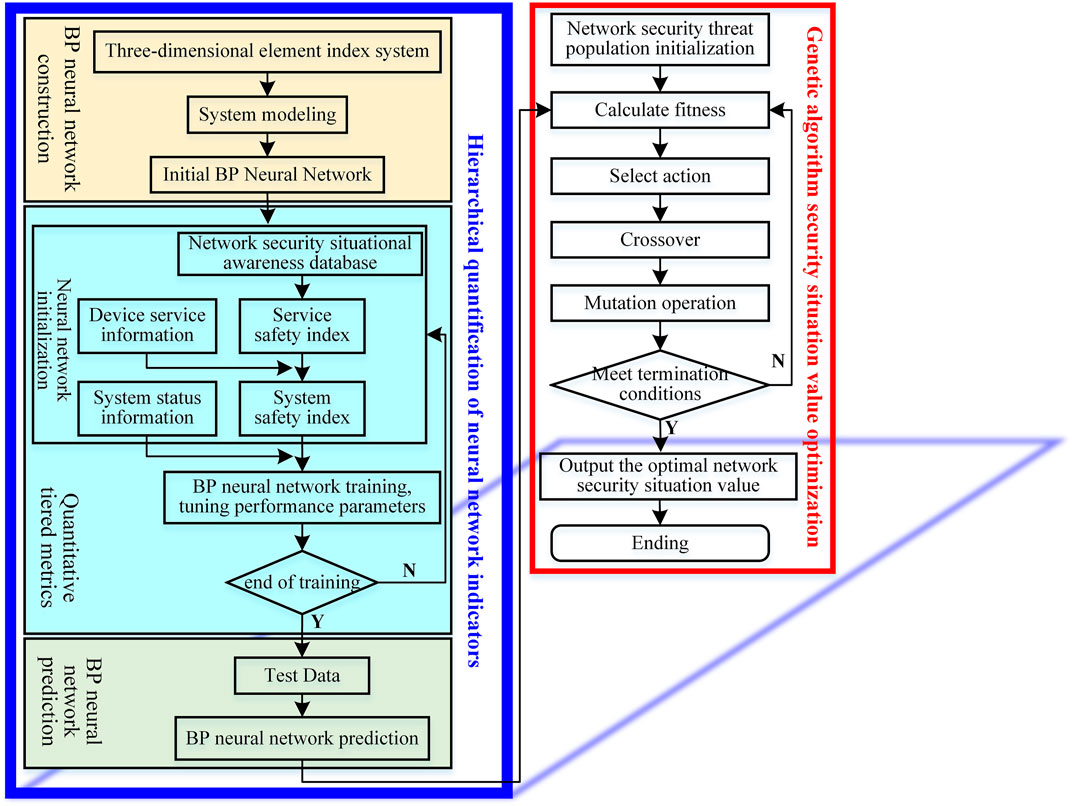
FIGURE 2. Quantitative model of the power information network security situation.
The specific steps are as follows:
Step 1. By collecting the original data of the dimension of network security situation elements, the key data is filtered and correlated and fused. The number and severity of attacks suffered by network services are analyzed. According to the three-dimensional element index system of the power information network, the number of nodes in the input layer
Step 2. Calculate the network vulnerability index
Step 3. Determine the optimal learning rate and activation function for the model (Sang, 2021).
where
Step 4. Output layer according to the hidden neuron
Step 5. Solve the individual fitness value
where
Step 6. In terms of genetic selection, the calculation method of the selection probability
In Eq. 7,
Step 7. Screen individuals through genetic selection, crossover, and mutation, so that individuals with accurate network security situation value predictions are retained, and individuals with abnormal situation values are eliminated. The new group not only integrates the information of the previous generation but also is better than the previous generation, so it iterates and loops until the termination condition is satisfied. The security situation value
Experiment Analysis of Examples
In order to verify the practicability and effectiveness of the method for quantifying the security situation of the power information network proposed in this article, the information and communication network of the power sector in a certain region is taken as an example. The experimental network topology is built through OpenNet, and three business data flows of mail service, marketing business, and conference phone system in the power information system are simulated.
Comprehensive Calculation of Network Security Situation Element Index Values
Select a time period of 10 min, and the interval of each time period is 1 min, which is represented by
Mathematically characterizing the attack severity of different services of each system in each period, and the spatial index system can clearly reflect the network status of a certain type of power application business under attack. Taking the power marketing business as an example, Figure 3 intuitively shows that 16 different states of the power information network are randomly selected by simulating different attack methods in 10 consecutive minutes.
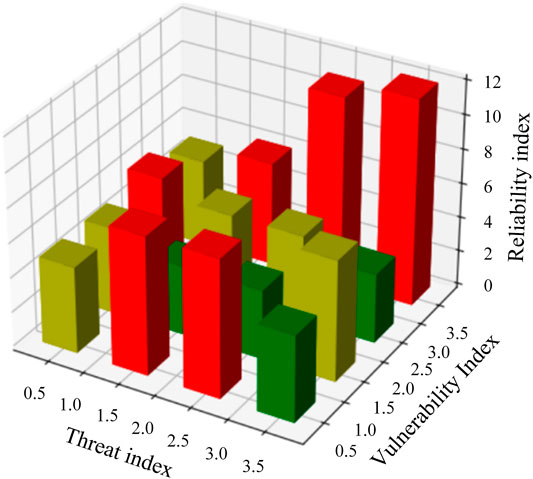
FIGURE 3. Spatial element index simulation under the attack state.
As shown in Figure 3, the composite index of vulnerability index is 3.5, and the composite index of threat index is 3.5. When both indices are high, it indicates that there are more vulnerabilities in the servers and other equipment running the power marketing business. The attack suffered is highly targeted to this type of business. At this time, the comprehensive index of the reliability index corresponding to the spatial index system is 11.8, and the communication network urgently needs a high-reliability solution for security protection. However, when the composite index of threat indicators is higher, it also reaches 3.5. The composite index of network equipment or application system vulnerability index is only about 0.5. The comprehensive index of reliability index only reaches level 3, indicating that the entire information and communication network does not need maintenance of reliability programs. The marketing business system may be able to directly detect such attacks, or the device has strong self-healing ability.
Therefore, after analyzing the simulation results of the network security situation element space index system, the application business characteristics should be combined when quantifying the security situation value of the power information network. According to the different dimension indices obtained, the security situation of the power information network can be evaluated more accurately, systematically, and comprehensively.
Validation of the Quantification Method for Security Situation of the Power Information Network
In the event of a network attack, it is analyzed based on the relevant performance information and log data of the firewall and server host. Take 4,000 sets of data, randomly select 3,900 sets of data to train BP neural network, and 100 sets of data as test data. The fitting performance of the BP neural network is tested by algorithm comparison.
The output of the proposed power information network security situational awareness prediction algorithm is compared with the actual security situation value, and compared with the newer research literature (Wang et al., 2020), the network security situation quantification method is based on the improved LSTM neural network. The results are shown in Figure 4A. The prediction error of the network security situation quantification value of the algorithm in this article is shown in Figure 4B.
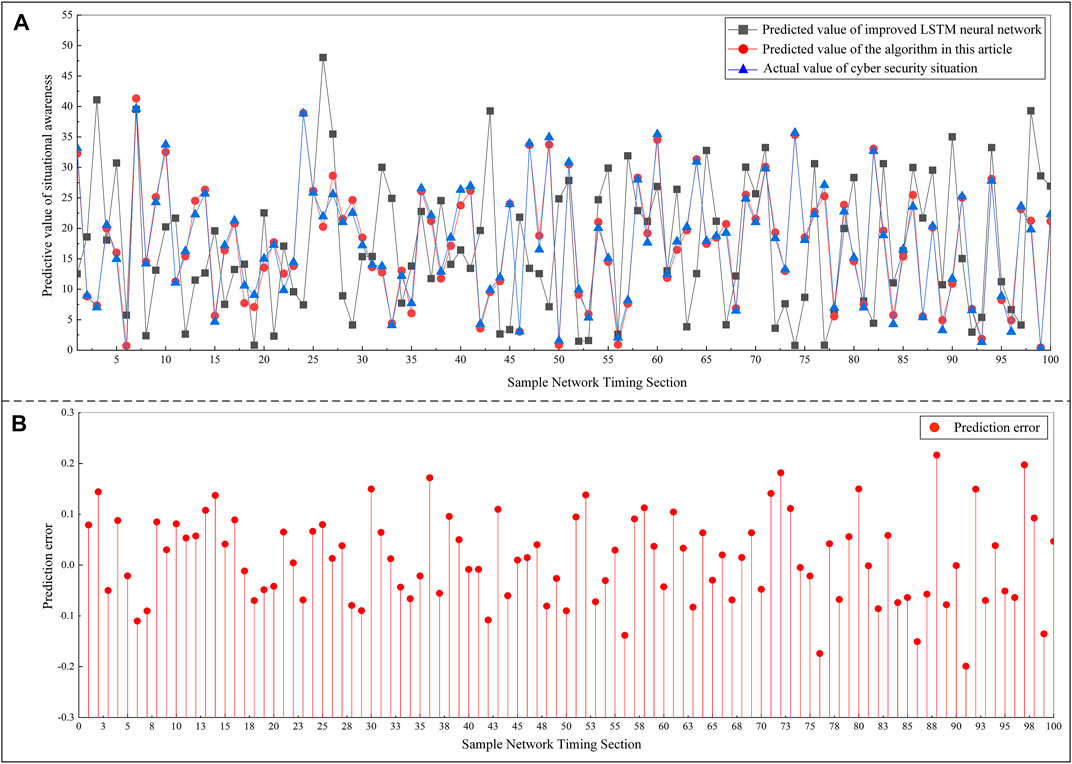
FIGURE 4. Comparison experiment of network security situation quantification results: (A) Comparison between the predicted value and the actual value. (B) Prediction error.
It can be seen from Figure 4A that the model in this article can accurately predict the situation value of network equipment, servers, and hosts running in the power information network when they are under attack threats, and compared with the improved LSTM neural network, the predicted value can be closer to the actual value. Figure 4B shows that the error between the predicted output of the network model and the expected output is mostly maintained between [−0.02, 0.02], which can effectively calculate the individual fitness. It lays a good foundation for the optimization of the security situation value of the comprehensive power information network by using the genetic evolution algorithm.
Conclusion
Based on the background of the new power information network, this article analyzes the specific characteristics of the information network and the power services it carries. An evolutionary neural network security situation quantification method for the power information network is proposed. The proposal of this technology improves the quantification accuracy of the security situation of the power information network to a certain extent. The experimental simulation results verify the following main conclusions:
1) A PIN-NSSQ architecture of a power information network is designed, taking into account the importance of network performance and power services.
2) From the three dimensions of reliability, threat, and vulnerability, a three-dimensional element index system of network security situation is established. At the same time, the mathematical representation of the element indicators around the comprehensive indicators of indicators is proposed, which lays a core foundation for the construction of a quantitative model of network security situation.
3) A new method to quantify the security situation of the power information network is proposed. The algorithm adopts BP neural network data fitting, and introduces the genetic evolution algorithm to realize the accurate calculation of the network security situation value. The method provides powerful data decision support for power network administrators to master and strengthen network security.
Data Availability Statement
The original contributions presented in the study are included in the article/Supplementary Material; further inquiries can be directed to the corresponding author.
Author Contributions
QY: designed this study. YP: contributed to the power information network security posture quantification system architecture. LK: contributed to the power information network security situation quantification method. FZ: collected and cleansed the data. BY: conducted simulation experimental analysis based on actual power information topologies. All authors contributed to the writing of the article and all agreed to the submitted version of the article.
Funding
This research is supported by the Science and Technology Development Plan Project of Jilin Province (grant number 20210201049GX), the Science and Technology Projects of Education Department of Jilin Province (grant numbers: JJKH20191262KJ and JJKH20191258KJ).
Conflict of Interest
The authors declare that the research was conducted in the absence of any commercial or financial relationships that could be construed as a potential conflict of interest.
Publisher’s Note
All claims expressed in this article are solely those of the authors and do not necessarily represent those of their affiliated organizations, or those of the publisher, the editors, and the reviewers. Any product that may be evaluated in this article, or claim that may be made by its manufacturer, is not guaranteed or endorsed by the publisher.
References
Cao, Z., Ji, X., Wang, J., Zhang, S., Ji, Y., and Wang, J. (2019). Security-reliability Tradeoff Analysis for Underlay Cognitive Two-Way Relay Networks. IEEE Trans. Wireless Commun. 18 (12), 6030–6042. doi:10.1109/TWC.2019.2941944
Dileep, G. (2020). A Survey on Smart Grid Technologies and Applications. Renew. Energ. 146, 2589–2625. doi:10.1016/j.renene.2019.08.092
Ganjkhani, M., Gilanifar, M., Giraldo, J., and Parvania, M. (2021). Integrated Cyber and Physical Anomaly Location and Classification in Power Distribution Systems. IEEE Trans. Ind. Inf. 17 (10), 7040–7049. doi:10.1109/TII.2021.3065080
Hou, W., Jiang, Y., Lei, W., Xu, A., Wen, H., and Chen, S. (2020). A P2P Network Based Edge Computing Smart Grid Model for Efficient Resources Coordination. Peer-to-peer Netw. Appl. 13 (3), 1026–1037. doi:10.1007/s12083-019-00870-9
Huang, Y., Ding, T., Li, Y., Li, L., Chi, F., Wang, K., et al. (2021). Decarbonization Technologies and Inspirations for the Development of Novel Power Systems in the Context of Carbon Neutrality. Proc. CSEE 41 (S1), 28–51. doi:10.13334/j.0258-8013.pcsee.211016
Lei, W., Wen, H., Wu, J., and Hou, W. (2021). MADDPG-based Security Situational Awareness for Smart Grid with Intelligent Edge. Appl. Sci. 11 (7), 3101. doi:10.3390/app11073101
Li, B., Cao, W., Qi, B., Sun, Y., and Cheng, Z. (2020). A Bandwidth Optimization Strategy of Demand Response Services in Electric Power Communication Network. Proc. CSEE 40 (19), 6227–6238. doi:10.13334/j.0258-8013.pcsee.191348
Li, Q., Cao, Z., Tanveer, M., Pandey, H. M., and Wang, C. (2020). An Effective Reliability Evaluation Method for Power Communication Network Based on Community Structure. IEEE Trans. Ind. Applicat. 56 (4), 1. doi:10.1109/TIA.2019.2954272
Li, Y., Huang, G.-G., Wang, C.-Z., and Li, Y.-C. (2019). Analysis Framework of Network Security Situational Awareness and Comparison of Implementation Methods. J. Wireless Com Netw. 2019 (1), 1–32. doi:10.1186/s13638-019-1506-1
Li, Y., Zhang, M., and Chen, C. (2022). A Deep-Learning Intelligent System Incorporating Data Augmentation for Short-Term Voltage Stability Assessment of Power Systems. Appl. Energ. 308, 118347. doi:10.1016/j.apenergy.2021.118347
Liang, Z. H. A. N. G., Gang, Q. U., Huixing, L. I., and Haochun, J. I. N. (2021). Research and Application of Key Technologies of Network Security Situation Awareness for Smart Grid Power Control Systems. J. Shanghai Jiaotong Univ. 55 (S2), 103. doi:10.16183/j.cnki.jsjtu.2021.S2.017
Liu, J., Zhao, Z., Ji, J., and Hu, M. (2020). Research and Application of Wireless Sensor Network Technology in Power Transmission and Distribution System. Intell. Converged Netw. 1 (2), 199–220. doi:10.23919/ICN.2020.0016
Liu, S., You, S., Yin, H., Lin, Z., Liu, Y., Yao, W., et al. (2020). Model-free Data Authentication for Cyber Security in Power Systems. IEEE Trans. Smart Grid 11 (5), 4565–4568. doi:10.1109/tsg.2020.2986704
Majeed Butt, O., Zulqarnain, M., and Majeed Butt, T. (2021). Recent Advancement in Smart Grid Technology: Future Prospects in the Electrical Power Network. Ain Shams Eng. J. 12 (1), 687–695. doi:10.1016/j.asej.2020.05.004
Panda, D. K., and Das, S. (2021). Smart Grid Architecture Model for Control, Optimization and Data Analytics of Future Power Networks with More Renewable Energy. J. Clean. Prod. 301, 126877. doi:10.1016/j.jclepro.2021.126877
Pizzuti, C. (2018). Evolutionary Computation for Community Detection in Networks: A Review. IEEE Trans. Evol. Computat. 22 (3), 464–483. doi:10.1109/TEVC.2017.2737600
Pliatsios, D., Sarigiannidis, P., Lagkas, T., and Sarigiannidis, A. G. (2020). A Survey on SCADA Systems: Secure Protocols, Incidents, Threats and Tactics. IEEE Commun. Surv. Tutorials 22 (3), 1942–1976. doi:10.1109/COMST.2020.2987688
Qu, Z., Li, M., Zhang, Z., Cui, M., and Zhou, Y. (2021). Dynamic Optimization Method of Transmission Line Parameters Based on Grey Support Vector Regression. Front. Energ. Res. 9, 17. doi:10.3389/fenrg.2021.634207
Qu, Z., Zhang, Y., Qu, N., Wang, L., Li, Y., and Dong, Y. (2018). Method for Quantitative Estimation of the Risk Propagation Threshold in Electric Power CPS Based on Seepage Probability. IEEE Access 6, 68813–68823. doi:10.1109/ACCESS.2018.2879488
Sang, B. (2021). Application of Genetic Algorithm and BP Neural Network in Supply Chain Finance under Information Sharing. J. Comput. Appl. Mathematics 384, 113170. doi:10.1016/j.cam.2020.113170
Shahsavari, A., Farajollahi, M., Stewart, E. M., Cortez, E., and Mohsenian-Rad, H. (2019). Situational Awareness in Distribution Grid Using Micro-PMU Data: A Machine Learning Approach. IEEE Trans. Smart Grid 10 (6), 6167–6177. doi:10.1109/TSG.2019.2898676
Wang, D., Chen, C., Yan, J., Guo, L., and Lai, F. (2016). Pondering a New-Generation Security Architecture Model for Power Information Network. Automation Electric Power Syst. 40 (02), 6–11. doi:10.7500/AEPS20150117004
Wang, P., and Govindarasu, M. (2020). Multi-agent Based Attack-Resilient System Integrity protection for Smart Grid. IEEE Trans. Smart Grid 11 (4), 3447–3456. doi:10.1109/TSG.2020.2970755
Wang, Q., Bu, S., He, Z., and Dong, Z. Y. (2021). Toward the Prediction Level of Situation Awareness for Electric Power Systems Using Cnn-Lstm Network. IEEE Trans. Ind. Inf. 17 (10), 6951–6961. doi:10.1109/TII.2020.3047607
Wang, T., Long, Q., Gu, X., and Chai, W. (2020). Information Flow Modeling and Performance Evaluation of Communication Networks Serving Power Grids. IEEE Access 8, 13735–13747. doi:10.1109/ACCESS.2020.2966489
Xie, M. (2022). Smart Grid Borderless Access Control Technology Based on Network Security Situational Awareness. Energ. Rep. 8, 415–423. doi:10.1016/j.egyr.2022.01.203
Keywords: power information network, cybersecurity, mathematical representation, evolutionary neural network, situational awareness
Citation: Yuan Q, Pi Y, Kou L, Zhang F and Ye B (2022) Quantitative Method for Security Situation of the Power Information Network Based on the Evolutionary Neural Network. Front. Energy Res. 10:885351. doi: 10.3389/fenrg.2022.885351
Received: 28 February 2022; Accepted: 11 April 2022;
Published: 10 May 2022.
Edited by:
Chengzong Pang,Wichita State University, United StatesReviewed by:
Cheng Qian,First Affiliated Hospital of Zhengzhou University, ChinaJun Yin, North China University of Water Resources and Electric Power, China
Copyright © 2022 Yuan, Pi, Kou, Zhang and Ye. This is an open-access article distributed under the terms of the Creative Commons Attribution License (CC BY). The use, distribution or reproduction in other forums is permitted, provided the original author(s) and the copyright owner(s) are credited and that the original publication in this journal is cited, in accordance with accepted academic practice. No use, distribution or reproduction is permitted which does not comply with these terms.
*Correspondence: Lei Kou, a291bGVpMTk5MUBob3RtYWlsLmNvbQ==