 Ye Zhou
 Jianfeng Ma
 Dengfeng Cao
 Lielong Wu
- 1Institute of Hydraulic Machinery, Department of Operation Support, China Institute of Water Resources and Hydropower Research, Beijing, China
- 2Institute of Mechanical and Electrical Product Reliability Engineering, Zhejiang Sci-Tech University, Hangzhou, China
The energy efficiency characteristics of the turbine, cavitation performance of the runner, and operation stability of the unit are the three major concerns of a hydropower field, the latter two factors leading to the units’ cavitation and stability problems under some operation conditions and fatigue failure of the runner blades, which are the main causes of structural and mechanical failure for the hydropower units. In this article, three conventional unit startup processes are introduced, and combined with the optimal impulse control strategy, an optimized unit startup method is proposed. As the optimal guide vane opening adjustment setting value is obtained by solving the planned startup control strategy, 3D modeling and CFD simulation are carried out, then the equivalent stress characteristics are obtained by finite element calculation when the unit is running from startup to no load at a rated speed on three different startup modes. At last, the dynamic stress tests of the runner blade are performed at the hydropower station by using wireless acquisition and transmission technology, and the peak value and characteristics of the dynamic and static stresses of the blade under different startup processes are obtained. In this, the validity of the model analysis is proved by the comparison between the simulation calculation and the measured results, and the effectiveness of the startup control strategy is proved by combining the runner blade dynamic stress simulation, calculation, and the field dynamic stress test results. The optimization method of the startup process proposed in the article can alleviate the abnormal vibration of the unit and provide a basis for long-term stable operation of the hydropower unit.
Introduction
With the development of the design, manufacture, and installation technology of hydropower units, the capacity and size of the turbine are getting larger and larger, and the development and application of conventional turbines, especially the reaction turbines, are becoming more and more extensive. Due to the increase in size and capacity of the unit, the specific speed of the turbine is also increased accordingly, the rigidity of the runner structure is relatively reduced, and the turbine blades of some units develop cracks and breaks; furthermore, some hydropower units built, both domestic and abroad, have problems such as runner cracks. So, in addition to the efficiency and cavitation characteristics, the stability of the hydropower unit is gaining more and more attention.
Currently, more and more scholars, both domestic and abroad, conduct finite element analysis on turbine models and prototypes, predict the operation characteristics of turbines, and carry out optimal design research to achieve better design results. In this article, three conventional unit startup processes are introduced, and combined with the optimal impulse control strategy, an optimized unit startup method is proposed. As the optimal guide vane opening adjustment setting value is being obtained by solving the planned startup control strategy, the 3D modeling and CFD simulation are carried out, then the equivalent stress characteristics are obtained by finite element calculation, when the unit is running from startup to no load at a rated speed on three different startup modes. At last, the dynamic stress tests of the runner blade are performed at the hydropower station by using the wireless acquisition and transmission technology, and the peak value and characteristics of the dynamic and static stress of the blade under different startup processes are obtained. In this, the validity of the model analysis is proved with the comparison between the simulation calculation and measured results, and the effectiveness of the startup control strategy is proved by combining the runner blade dynamic stress simulation, calculation, and the field dynamic stress test results. The optimization method of the startup process proposed in the article can alleviate the abnormal vibration of the unit and provide a basis for the long-term stable operation of the hydropower unit.
Startup Process of Hydropower Unit
Common Startup Processes
The common startup control methods of the hydropower units include open-loop control, closed-loop tracking control, and open–closed loop–combined control (Lei et al., 2021).
An open-loop control mainly means that after the governor receives the power-on command, the guide vane will be opened to the preset opening at the maximum opening speed, and the opening will remain unchanged. When the frequency rises to the preset value, the guide vane will be opened again. close to the predetermined no-load opening, such that the unit quickly rises to rated speed and stabilizes.
Closed-loop tracking control means that the governor is always in a closed-loop adjustment state during the startup process, tracking the frequency given curve to 50 Hz.
Open and closed loop joint control means that when the governor receives the start command, it is set in the opening control mode first, the given value of the opening is set as the start opening, the frequency is set to a certain setting value less than 50 Hz, and then the opening is quickly increased to the start opening. When the frequency is increased to the set value, the PID adjustment is automatically activated, and the set frequency value is automatically increased to 50 Hz (Chen et al., 2019; Hou et al., 2019).
The dynamic characteristics of the turbine are obviously nonlinear because the water diversion system has the water hammer effect and the inertia of the turbine unit is large. Therefore, it is difficult to use the typical linear feedback method to control effectively. The traditional PID control and the derived feedback control are usually simulated and calculated by the simple linearized approximate model of the system, and it is difficult to effectively control the real turbine control and operation system.
Therefore, in this article, the optimal guide vane opening adjustment setting value is obtained by solving the planned startup control strategy, and the effectiveness of the startup control strategy is proved by combining the runner blade dynamic stress simulation, calculation, and the field dynamic stress test results.
According to the requirements of the planned startup control strategy, the best control method is to make the guide vane opening act according to the time curve shown in Figure 1, that is, the operating speed of the guide vane is started, and after reaching a certain opening, it is closed to the no-load opening at the maximum allowable operating speed.
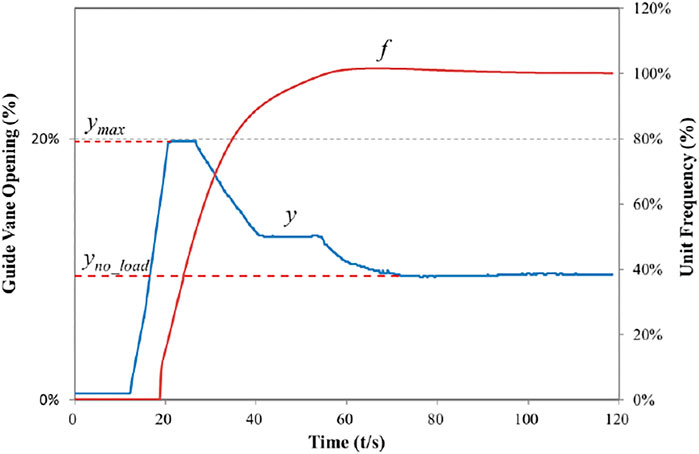
FIGURE 1. The common change process of the guide vane opening for hydropower unit.
Startup Process Optimization
According to the characteristics of hydraulic flow energy, when the startup process ends, the water energy used by the turbine is exactly equal to the energy consumed by overcoming various resistances during the startup process and the kinetic energy required for increasing the rotor speed; this is the basic principle of the optimal impulse control strategy (Sun et al., 2018; Wang et al., 2019). The common change process of the guide vane opening for hydropower unit is shown in Figure 1.
In Figure 1, f is the percent of unit frequency against 50 Hz, y is the percent of guide vane opening, and the top point of the guide vane opening curve is the peak value ymax. The value yno_load corresponding to the last straight section of the guide vane opening curve is the stable opening of the unit at a given speed with no load. In order to determine the maximum guide vane opening ymax during startup and the stable opening yno_load during the no-load running, the solution can be solved according to the principle of optimal energy balance.
The theoretical formula for turbine flow is:
where q is the flow discharge of the turbine, y is the guide vane opening, and
The input power N of turbine is:
Therefore, the sum of the power due to the water flow of the turbine can be obtained by integrating the power N. The kinetic energy stored by the rotor at the current speed is:
where J is inertia of the unit, and ω is the rotational speed.
According to the optimal impulse control strategy, the unit reaches the speed ω at time of td, and so we can get the power loss s each time before td.
where si is the power loss at time i, and ωi is the speed at time i.
Then, we can calculate with the formula:
When ω = ωn—here ωn is the rated speed—the guide vane opening yno_load at no load can be obtained by calculations. Similarly, through the power loss formula, the relationship between t and ω after time td can be calculated, and the ymax value that meets the requirements is obtained by iterative calculations (Tan and Islam, 2004).
Therefore, we can use the effective impulse principle in the startup process to obtain the curve y of the guide vane opening and formulate the control strategy of the startup process according to the prediction model of the guide vane opening.
Simulation of Runner Blade Dynamic Stress
Numerical Calculation Model
The three-dimensional incompressible unsteady Navier–Stokes equation is used for the time-averaged method, and the Reynolds average method is performed to obtain the control equation in the time-averaged form (Hong et al., 2015; Xing and Xu, 2015):
The momentum equation is:
where
The turbulence model adopts the SST model, which has great advantages in predicting the turbulent scale of near-wall flow or flow with adverse pressure gradient. Therefore, the model is selected when solving the unsteady turbulent flows in the draft tube. The turbulent kinetic energy equation and turbulent dissipation rate equation of the SST model are, respectively (Kang et al., 2016; Tiwari et al., 2020):
The calculation uses the discrete method of the finite volume method. The finite volume method is also called the control volume method (Bai et al., 2012). Its basic principle is to divide the computational domain into tiny control volumes corresponding to the grid nodes, one to one. Each control volume does not repeat each other. The equations are integrated to obtain a set of discrete equations. In order to give the integral form of the control volume, assumptions are made about the convective flux at the nodes of the control volume grid, such that different forms of discrete equations can be derived.
Computational Domain Model
As the geometry of each part of the turbine flow passage is relatively complex, to accurately simulate the flow channel shape of the real turbine during the modeling process, Siemens NX software is used to geometrically model the entire flow channel of the turbine. The entire calculation area includes spiral case, static vanes, guide vanes, runners, and draft tubes. The overall computational domain geometric model is shown in Figure 2. To accurately simulate the internal flow of the flow components of the turbine and minimize the error in the numerical calculation, high-precision hexahedral meshes are used to mesh the flow components.

FIGURE 2. The geometric model of the overall computational domain.
The object of the numerical analysis is the model hydraulic turbine, and its overall geometric modeling is completed by the Siemens NX software platform. All the flow parts are divided into high-precision hexahedral meshes by the ANSYS ICEM-CFD software to make field analysis calculations. Through the analysis, the flow field calculation of the runner and other flow components is obtained as the load of the structure field calculation.
For the calculation of the flow field in the Francis turbine and the calculation of the structure field of the runner, the three-dimensional geometric models for the calculation of the flow field and the structure field are established, respectively. Figure 3 shows the models for flow field calculation, structure field calculation, and the fluid–structure interaction surface.
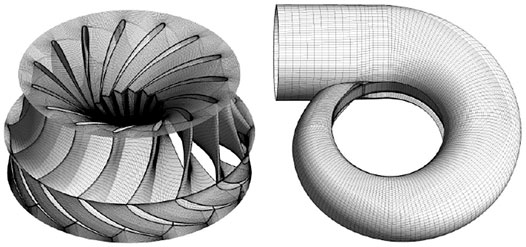
FIGURE 3. The geometric models of Francis runner and spiral case.
The calculation object of the structure field is the Francis turbine runner, and the constraint condition is a fixed constraint given on the connecting surface of the upper crown of the runner and the main shaft flange. The load on the runner includes inertial force and surface force. The inertial force includes the force caused by the runner’s gravity and rotation. The surface force is mainly the water pressure on the fluid–solid interface caused by the fluid flow, which is obtained from the results of the runner flow field calculation.
The total pressure at the inlet of the spiral case and its velocity direction are used as the inlet conditions, and the average static pressure at the draft tube outlet is used as the outlet conditions for the flow field calculation. Through the CFD calculation of the overall flow channel, the calculated inner flow field is more accurate, and a more accurate blade surface pressure load is provided for the subsequent structural field calculation.
Measurement of Runner Blade Stress
To compare the force of the runner under different startup modes, the dynamic stress test of the runner blade was carried out, that is, the strain gauge was pasted on the runner blade, the data were collected and stored by wireless transmission, and the relationship between the static stress and the dynamic stress with the guide vane opening was analyzed. The layout of the strain gauge is shown in Figure 4.
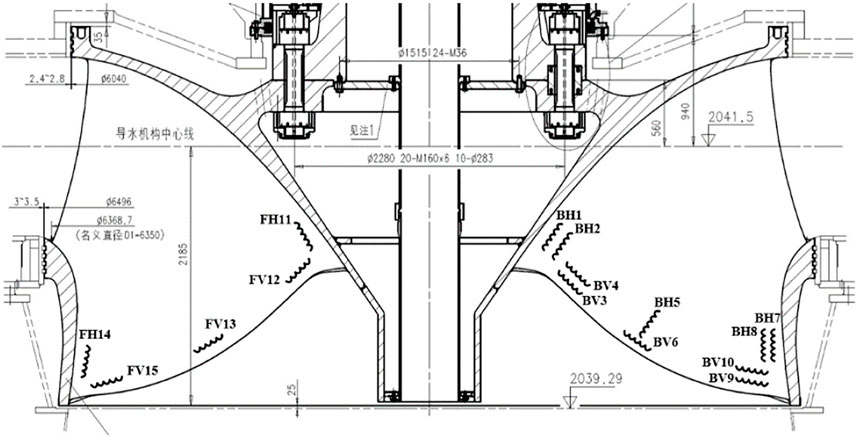
FIGURE 4. The layout of the strain gauges for Francis turbine runner.
The photos of the strain gauge fixing and protection are shown in Figures 5 and 6.
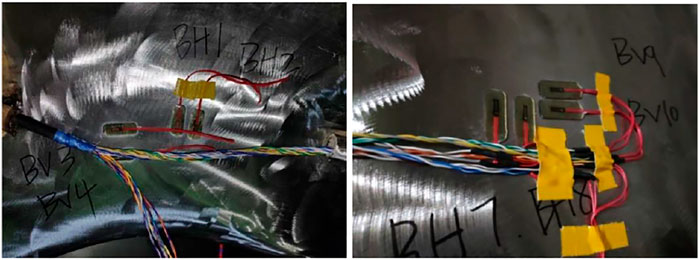
FIGURE 5. The photos of fixing the strain gauges by special glue.
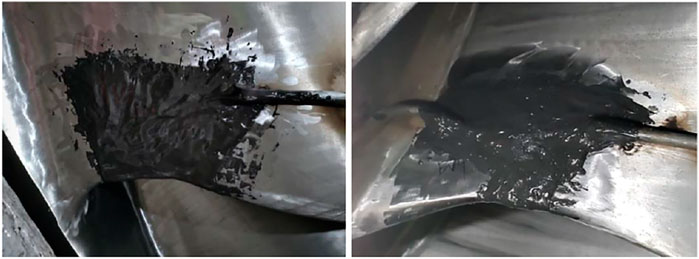
FIGURE 6. The photos of protection of the strain gauges by metal protective coating.
The cables are led from the large hollow shaft to the accessories of the top air supply valve, and the test instruments and equipment are fixed by bolts and welding to ensure that the equipment does not detach or is not thrown out when the unit rotates at high speed. All measurement signals are stored offline in the acquisition instrument and transmitted to the engineer’s computer synchronously. The photos of data acquisition equipment are shown in Figure 7.
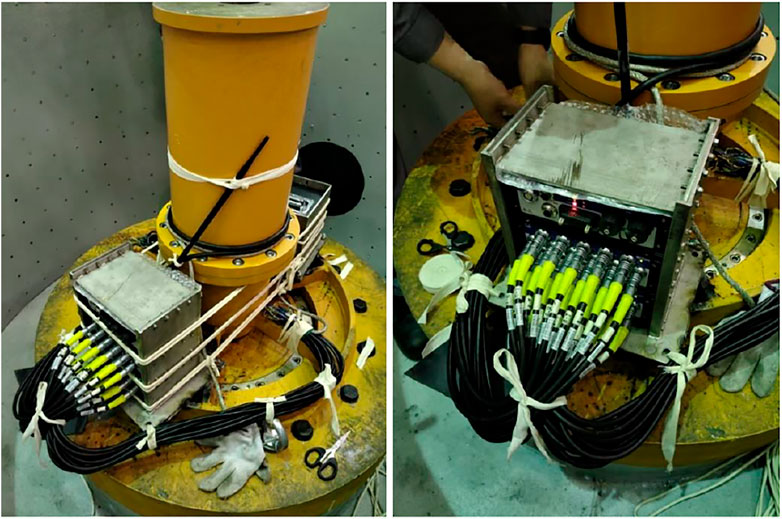
FIGURE 7. The photos of data acquisition equipment fixed by bolts and welding.
Result of Stress Measurement for Different Startup Processes
Conventional Control Methods
Two conventional control methods were carried out on-site, and the guide vane opening process and speed rise curve were recorded, that is, after the governor received the starting command, the guide vane was opened to the set opening at the fastest speed, then kept unchanged. When the frequency rises to the set value, the opening of the guide vane servomotor was adjusted to the set value of no load, then the servomotor control mode was turned to PID adjustment mode.
Here, we select the strain–stress point at BV3 shown in Figure 4, where the previous runner crack appeared as the characteristic parameter, and analyze the stress change at this location under different startup processes.
The sampling rate of the stress signal is 1,200 Hz, and the static stress and dynamic stress are calculated by sliding for the period of 1 s. The average value of the static stress is calculated, and the peak-to-peak value of the dynamic stress is calculated.
For the first time, the single stage acceleration adjustment was adopted, the guide vane opening process and speed rise curve are shown in Figures 8–10.
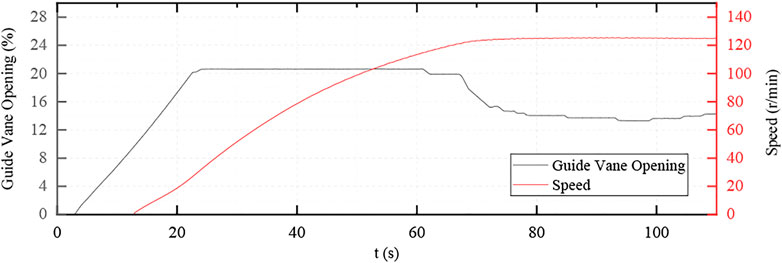
FIGURE 8. The curve of the guide vane opening and the speed (single-stage acceleration).
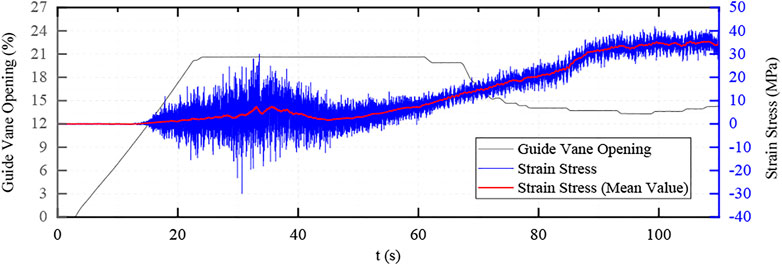
FIGURE 9. The stress curve of the blade back in the direction of vertical water flow (single stage acceleration).
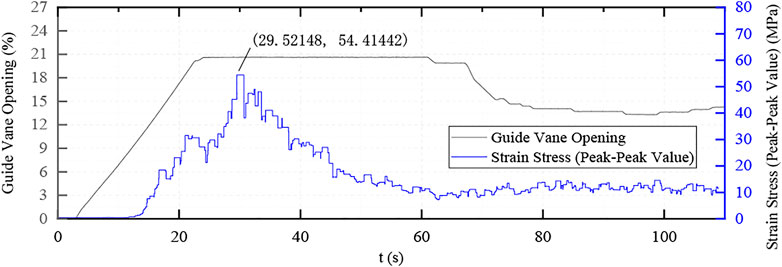
FIGURE 10. The dynamic strain–stress curve with the guide vane opening (single-stage acceleration).
As the guide vane is directly opened to the no-load opening degree in this adjustment method, the dynamic stress in the process is relatively large and the maximum dynamic stress is about 55 MPa, but the duration is short, about 2–4 s.
Then the second conventional adjustment mode test is carried out, but the guide vane adjustment mode is two-stage acceleration, and the adjustment curves and typical dynamic stress curves are shown in Figures 11–13.
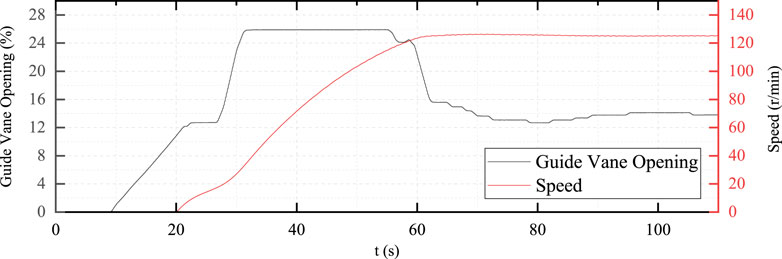
FIGURE 11. The curve of the guide vane opening and the speed (two-stage acceleration).
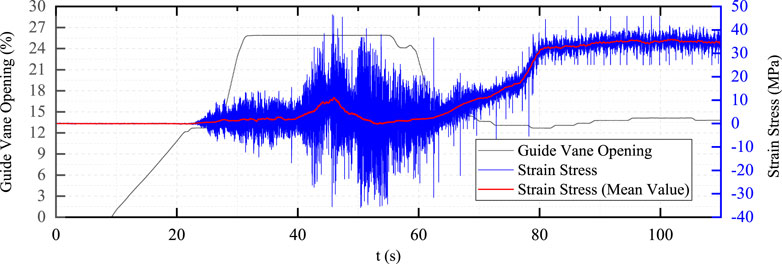
FIGURE 12. The stress curve of the blade back in the direction of vertical water flow (two-stage acceleration).
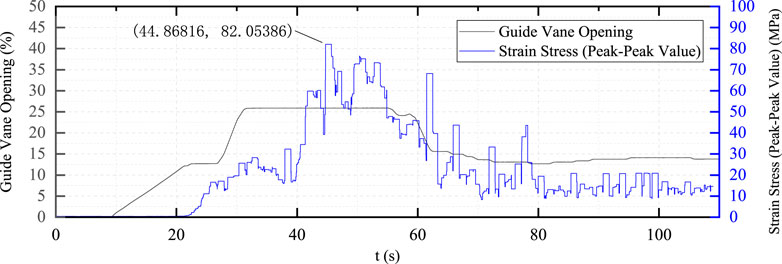
FIGURE 13. The dynamic strain–stress curve with the guide vane opening (two-stage acceleration).
In the two-stage adjustment process, the accelerated opening time of the second stage of the guide vane is relatively long, and the static and dynamic stress of the vane increases significantly. The maximum dynamic stress was about 82 MPa, which exceeds the maximum dynamic stress of the first test.
Optimized Control Method
Combined with the effective impulse principle and two-stage startup strategy, an over adjustment mode is added to optimize the control mode. The calculation results in ymax = 21.5%, yno_load = 13.5%, and the startup curve are as in Figures 14–16.
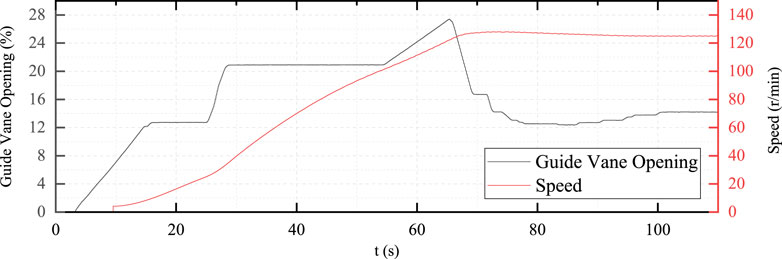
FIGURE 14. The curve of the guide vane opening and the speed (optimized control mode).
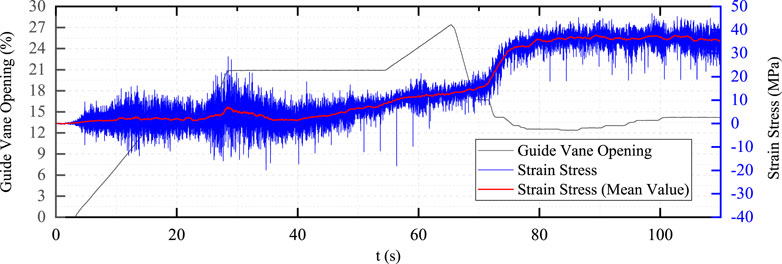
FIGURE 15. The stress curve of the blade back in the direction of vertical water flow (optimized control mode).
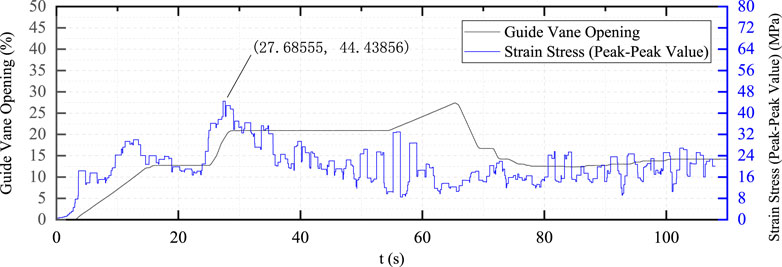
FIGURE 16. The dynamic strain–stress curve with the guide vane opening (optimized control mode).
It can be seen from Figure 16 that in the process of accelerating the speed of the unit from zero to 100 r/min, the blade is subjected to a large dynamic stress, and the maximum dynamic stress is about 44 MPa. Compared with the single-stage startup, the guide vanes are opened in two stages during the optimized startup process, and the maximum dynamic stress is greatly reduced, but the duration of the dynamic stress is increased.
Data Analysis and Comparison
As the SST and k-ε turbulence model are used to simulate the internal flow of each flow-through component of the turbine, and the error is minimized in the numerical calculation, all flow-through components are divided into high-precision hexahedral meshes by the ANSYS ICEM-CFD software. The ANSYS runner structure finite element calculation model has 853,000 mesh elements and 1,233,000 nodes, as shown in Figure 17.
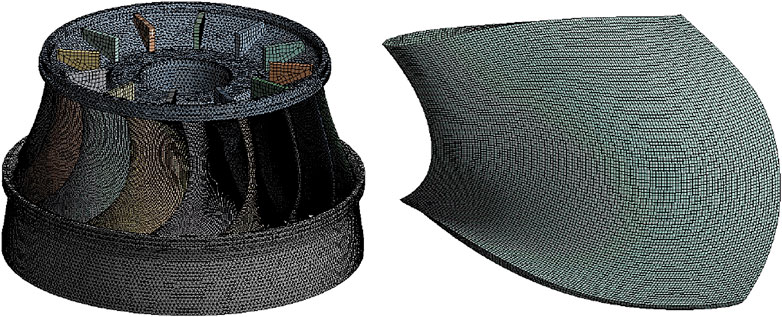
FIGURE 17. The structure finite element calculation model of the runner and blade.
The blade surface pressure is changed with time, and the hydrodynamic pressure load is carried out according to the following steps:
1) According to the results of the unsteady flow analysis, the water pressure values at each node on the blade surface of the finite element model at each moment are taken out, and the water pressure load file at each moment is established after processing.
2) In the finite element preprocessing file, the water pressure load array is established, and the water pressure load array is assigned values through the water pressure load file at each moment.
3) At different times, the blade pressure is loaded on the nodes of the computing network, and the time load step file is written.
According to the parameters of the three startup processes, the CFD simulation of the turbine fluid is carried out. When the unit reaches no load, the simulation results of the force cloud diagram of the blade are shown in Figures 18–20:

FIGURE 18. The stress cloud diagram for the runner and blade (single-stage acceleration).
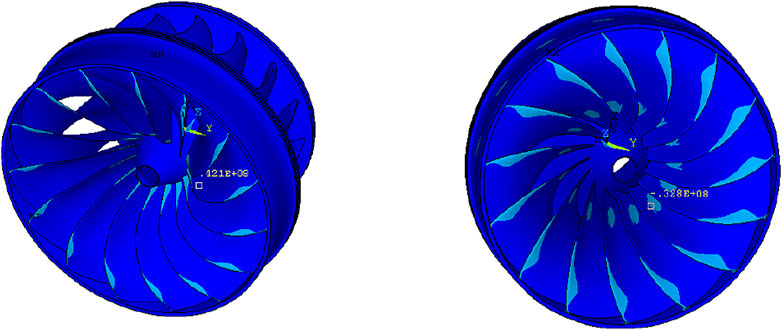
FIGURE 19. The stress cloud diagram for the runner and blade (two-stage acceleration).
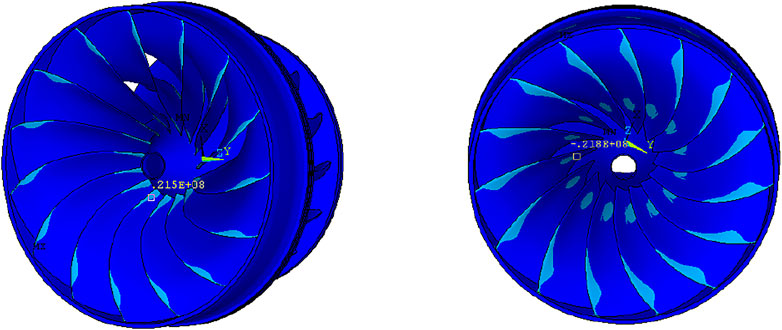
FIGURE 20. The stress cloud diagram for the runner and blade (optimized control mode).
The governor parameter setting, maximum dynamic stress test, and simulation results are shown in Table 1:
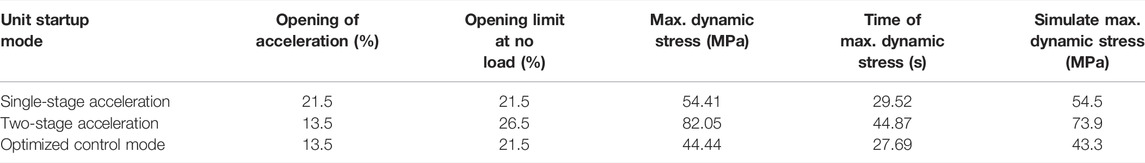
TABLE 1. The governor parameter, max. dynamic stress test, and simulation results.
Conclusion
1) The dynamic stress test of the rotating parts for the hydraulic machinery, especially the turbine runner, is currently difficult in field testing, and many key technologies have to be paid attention to. The metal repair agent currently used for the protective layer on the surface of the strain gauge may affect the stress measurement, and further verification and analysis are required. The protective steel pipe of the strain gauge transmission cable is welded on the surface of the runner cone, and then the wire is combined with a steel rope from the large hollow shaft to the top, which may also have a certain impact on the flow state of the runner outlet. However, these two methods ensure that the strain gauge can work effectively during the long-term startup, shutdown, and load changing processes of the unit and that it will not peel off or fail to work. Most runner dynamic stress tests in the past failed due to the loss of strain gauge signal or sensor detachment in a short period of time (Huang et al., 2014; Unterluggauer et al., 2019).
2) From the test and simulation results, it can be seen that when the optimal pulse control strategy is adopted, the best parameters of the unit adjustment process can be obtained, such as the opening acceleration and the no-load opening limit and other data. The maximum dynamic stress on the runner blades when the unit starts up on the optimized control mode is only 81.6% the maximum dynamic stress on the single-stage control mode and 54.2% of the maximum dynamic stress on the two-stage acceleration control mode—almost only about half of it. Therefore, it can be verified that the optimal pulse control strategy can achieve a very good optimization effect.
3) Through the CFD simulation and calculation, with the guide vane opening, flow rate, and pressure data at the moment of maximum dynamic stress under the condition of no load on the runner, it can be seen that the difference between the simulation results and the actual measurement results under the three adjustment processes of the runner blade is 54.41, 82.05, and 44.44 MPa and proves that the CFD calculation can play a guiding and correcting effect in the common test of different startup modes of the unit.
4) The current dynamic stress test only analyzes the whole process data from the startup to 100% rated speed and then to the no-load of the unit. In fact, the whole dynamic stress test covers the load changing process, startup, and shutdown process of the unit, and the displacement, vibration, and pressure pulsation data of the unit’s operation are measured synchronously. If further analysis can be carried out under these operating conditions, it can provide further guidance for the optimization and zoning of the operating load of the unit.
Data Availability Statement
The original contributions presented in the study are included in the article/Supplementary Material, and further inquiries can be directed to the corresponding author.
Author Contributions
YZ, JM, and DC contributed to the conception and design of the study. DC organized the database. YZ and JM performed the statistical analysis. YZ wrote the first draft of the manuscript. LW performed the infinite element calculation. All authors contributed to manuscript revision, and read and approved the submitted version.
Conflict of Interest
The authors declare that the research was conducted in the absence of any commercial or financial relationships that could be construed as a potential conflict of interest.
Publisher’s Note
All claims expressed in this article are solely those of the authors and do not necessarily represent those of their affiliated organizations, or those of the publisher, the editors, and the reviewers. Any product that may be evaluated in this article, or claim that may be made by its manufacturer, is not guaranteed or endorsed by the publisher.
References
Bai, B., Zhang, L., Guo, T., and Liu, C. (2012). Analysis of Dynamic Characteristics of the Main Shaft System in a Hydro-Turbine Based on ANSYS. Proced. Eng. 31, 654–658. doi:10.1016/j.proeng.2012.01.1081
Chen, S., Li, G., Wang, D., Wang, X., Zhang, J., and Yu, X. (2019). Impact of Tail Water Fluctuation on Turbine Start-Up and Optimized Regulation. Energies 12 (15), 2883. doi:10.3390/en12152883
Hong, H., Yong-Zhong, Z., Hui-Yan, W., Shun-Bing, O., Zhi-Zhong, Z., and Xiao-Bing, L. (2015). Numerical Analysis of Solid-liquidtwo-phase Turbulent Flow in Francis Turbine Runner with Splitter Bladesin sandy Water. Adv. Mech. Eng. 7 (3), 168781401557382. doi:10.1177/1687814015573821
Hou, J., Li, C., Guo, W., and Fu, W. (2019). Optimal Successive Start-Up Strategy of Two Hydraulic Coupling Pumped Storage Units Based on Multi-Objective Control. Int. J. Electr. Power Energ. Syst. 111, 398–410. doi:10.1016/j.ijepes.2019.04.033
Huang, X., Oram, C., and Sick, M. (2014). Static and Dynamic Stress Analyses of the Prototype High Head Francis Runner Based on Site Measurement. IOP Conf. Ser. Earth Environ. Sci. 22 (3), 032052. doi:10.1088/1755-1315/22/3/032052
Kang, M.-W., Park, N., and Suh, S.-H. (2016). Numerical Study on Sediment Erosion of Francis Turbine with Different Operating Conditions and Sediment Inflow Rates. Proced. Eng. 157, 457–464. doi:10.1016/j.proeng.2016.08.389
Lei, L., Li, F., Kheav, K., Jiang, W., Luo, X., Patelli, E., et al. (2021). A Start-Up Optimization Strategy of a Hydroelectric Generating System: From a Symmetrical Structure to Asymmetric Structure on Diversion Pipes. Renew. Energ. 180, 1148–1165. doi:10.1016/j.renene.2021.09.010
Sun, Y., Cao, L., and Zhou, H. (2018). “Research on Closed-Loop Start-Up Process of Hydraulic Turbine Based on Adaptive Variable Parameters of Water Head” in IOP Conference Series Materials Science and Engineering (IOP Publishing), 452, 1–6. doi:10.1088/1757-899x/452/4/042007
Tan, K., and Islam, S. (2004). Optimum Control Strategies in Energy Conversion of PMSG Wind Turbine System without Mechanical Sensors. IEEE Trans. Energ. Convers. 19 (2), 392–399. doi:10.1109/tec.2004.827038
Tiwari, G., Kumar, J., Prasad, V., and Patel, V. K. (2020). Utility of CFD in the Design and Performance Analysis of Hydraulic Turbines - A Review. Energ. Rep. 6, 2410–2429. doi:10.1016/j.egyr.2020.09.004
Unterluggauer, J., Doujak, E., and Bauer, C. (2019). Fatigue Analysis of a Prototype Francis Turbine Based on Strain Gauge Measurements. Wasser Wırt Schaft 109 (1), 66–71. doi:10.1007/s35147-019-0238-9
Wang, X., Zhang, J., Yu, X., Lv, J., and Zhang, X. (2019). Multi-objective Intelligent Start-Up Strategy for Small Hydropower Plants Based on Adaptive Variable Parameters of Water Head. J. Renew. Sustainable Energ. 11 (1), 014703. doi:10.1063/1.5043368
Keywords: Francis turbine, stress measurement, startup process, hydropower unit, optimal impulse control
Citation: Zhou Y, Ma J, Cao D and Wu L (2022) Startup Process Optimization of Hydropower Unit Based on Stress Measurement of Francis Turbine Runner. Front. Energy Res. 10:885634. doi: 10.3389/fenrg.2022.885634
Received: 28 February 2022; Accepted: 24 March 2022;
Published: 12 May 2022.
Edited by:
Ling Zhou, Jiangsu University, ChinaReviewed by:
Yongxue Zhang, China University of Petroleum, ChinaLiu Demin, Dongfang Electric Machinery Co., Ltd., China
Weiguo Zhao, Lanzhou University of Technology, China
Copyright © 2022 Zhou, Ma, Cao and Wu. This is an open-access article distributed under the terms of the Creative Commons Attribution License (CC BY). The use, distribution or reproduction in other forums is permitted, provided the original author(s) and the copyright owner(s) are credited and that the original publication in this journal is cited, in accordance with accepted academic practice. No use, distribution or reproduction is permitted which does not comply with these terms.
*Correspondence: Ye Zhou, emhvdXllQGZveG1haWwuY29t