 Mengru Zhang
 Enhua Wang
 Jingwen Mao1
- 1School of Mechanical Engineering, Beijing Institute of Technology, Beijing, China
- 2State Key Laboratory of Automotive Safety and Energy, Tsinghua University, Beijing, China
Hydrogen as an energy carrier is critical for building a zero-carbon emission society. Solid oxide electrolysis cell (SOEC) is a feasible technology for hydrogen production with a high efficiency. Currently, the durability of SOEC systems still needs to be improved and technical issues need to be overcome. Reducing the working temperature is helpful for the lifetime. A good cell design to avoid delamination is also very important. In this study, the performance of a metal-supported intermediate-temperature SOEC is estimated using gadolinium doped ceria Gd0.1Ce0.9O2-δ (GDC) as the main electrolyte. First, a mathematical model is setup for the metal-supported SOEC. The effects of the porosity and tortuosity of the electrodes are analyzed. Subsequently, the influences of the working temperature, pressure, and steam concentration are estimated. Finally, the partial oxygen pressure inside the multi-layer electrolyte is determined and the risk of delamination is discussed. The results indicate that increasing the operation temperature can decrease the activation, concentration, and ohmic overpotentials simultaneously while increasing the pressure also can enhance the performance. Compared with the conventional design of Ceres Power, the new design using 10Sc1CeSZ as the barrier layer can increase the partial oxygen pressure of the GDC layer close to the cathode such that decomposition of GDC is avoided. Meanwhile, the partial oxygen pressure inside the multi-layer electrolyte close to the anode declines and the risk of delamination is reduced. Hence, the new design of the SOEC is beneficial for the durability of metal-supported SOEC.
1 Introduction
Carbon dioxide (CO2) emission is the main reason for global warming and climate changing (Pfeifer et al., 2020). The Intergovernmental Panel on Climate Change suggested that reducing the CO2 emission to zero before 2050 (Intergovernmental Panel on Climate Change, 2018). The employment of hydrogen energy is an important strategy (Peng et al., 2020; Tanaka et al., 2020). It is urgent to develop high-efficiency hydrogen production facilities (Greene et al., 2020). Solid oxide electrolysis cell (SOEC) is such a device suitable for large-scale hydrogen production based on steam electrolysis technology (Zheng et al., 2017). An SOEC can also be used to electrolyze CO2 or co-electrolyze CO2 and H2O mixture. Furthermore, based on Power-to-X (PtX) technology, the products H2 and CO can be used to produce liquid fuels such as methane, and chemicals. In addition, waste heat from various industries can be utilized by SOEC systems and the efficiency will be increased (Biswas et al., 2020). To June 2020, 220 PtX projects had been carried out in Europe and many of them were based on SOEC technology (Wulf et al., 2020).
The working process of an SOEC is basically the inverse of a solid oxide fuel cell (SOFC) (Wu et al., 2020). Thus, a similar device can be designed (Hatagishi and Arai, 1996; Iora and Chiesa, 2009; Schiller et al., 2010; Zhang et al., 2017). Generally, an electrolyte-supported or electrode-supported design is adopted. Park et al. designed a Ni-YSZ (yttrium stabilized zirconia) cathode-supported SOEC with a thin bilayer GDC (gadolinium doped ceria)/YSZ electrolyte. A high performance with a fuel cell power density of 3 W/cm2, and an electrolysis current density of 4 A/cm2 at 800°C was achieved (Park et al., 2020). Most SOECs use YSZ as the electrolyte because of its high stability. However, to achieve a high ionic conductivity, these SOECs need to operate at a temperature greater than 800°C (Sun et al., 2019; Schefold et al., 2020). Such a high operation temperature is the major limitation for the durability because the ceramic sealing must be used and the degradation rate will increase due to the temperature variation, particularly at high steam to hydrogen concentration in the cathode such as over 90% (AlZahrani and Dincer, 2022). Compared with YSZ, ScSZ has a higher oxygen ionic conductivity under the temperature lower than 700°C, which has been employed in several investigations. Uchida et al. adopted the ScSZ as the electrolyte and Ni-GDC as the cathode. The steam electrolysis device operated at 1.0 A/cm2 for 211 h at 800°C (Uchida et al., 2021). Shi et al. investigated the CO2 electrolysis performance based on an SOEC using ScSZ as the electrolyte (Shi et al., 2013). To prevent the chemical reaction of YSZ with the anode perovskite material such as LSCF, GDC is often used as the barrier layer coated on the surface of YSZ. A thin and dense barrier layer of GDC could reduce the residual stress and increase the mechanical strength of the multi-layer electrolyte by up to 78% (Riegraf et al., 2021). For SOFC applications, GDC is also often employed as the main electrolyte that can operate at the intermediate temperature range of 550–700°C. However, GDC is a mixed ionic electronic conducting (MIEC) material and severe electronic current may occur during the working process of an SOEC. Because the electronic leakage characteristic of GDC, very few work has been reported using GDC as the main electrolyte in SOECs (Nechache and Hody, 2021). For ceria-based oxide, Ce4+ may be reduced to Ce3+ and electron leakage occurs, leading to a very low open cell voltage (OCV) (Ding et al., 2010). To stop the internal shortage caused by electronic leakage, a barrier layer is often coated on the surface of GDC layer. In the SOEC system designed by Temluxame et al., a thin YSZ layer was inserted as the barrier layer to prevent electronic leak current through the main GDC electrolyte. When the input voltage was 1.3 V, a current of 0.7 A/cm2 was measured at 800°C (Temluxame et al., 2021). Luo et al. employed a Ba-rich electron blocking layer and the cell achieved an electrolysis current of 0.86 A/cm2 at 1.3 V (Luo et al., 2019). The reduction of ceria will generate chemical expansion as well. A phase transition occurs (decomposition) if ceria is reduced enough (Lein et al., 2006; Sunarso et al., 2008). Accordingly, a substantial chemical expansion/contraction appears, causing mechanical durability issues (Dejoie et al., 2020). Therefore, doped ceria is often used as the barrier layer in SOECs to prevent the chemical reaction between YSZ and the perovskite material in the anode (Nguyen et al., 2004; Min et al., 2009; Xu, 2012; Milcarek et al., 2016; Wain-Martin et al., 2019). Nevertheless, further investigations are required to explore the feasibility of GDC as the electrolyte of SOEC.
Metal-supported solid oxide cells have been successfully applied in SOFC systems, taking advantages of high reliability and low cost. Nielsen et al. adopted a relatively thin metal-supported SOFC (MS-SOFC) with a substrate thickness of 175 μm and a high cell performance was demonstrated (Nielsen et al., 2018). Long-term operations of MS-SOFC stacks had been demonstrated by Topsoe Fuel Cell (McKenna et al., 2013) and Ceres Power (Leah et al., 2021). Currently, for SOEC applications, most investigations were focused on electrolyte-supported and electrode-supported type cells. Similar to MS-SOFC, metal-supported SOEC (MS-SOEC) uses a porous ferritic steel as the substrate and normally operates under a lower temperature compared with conventional electrolyte- or electrode-supported SOECs. MS-SOECs have an excellent redox stability and a good thermal cycling durability (Wang et al., 2019). Visvanichkul et al. (Visvanichkul et al., 2021) studied the performance of a Ni-Fe-foam supported SOEC. The cell manifested a high current density of 0.95 A/cm2 with an input voltage of 1.1 V at 1073 K.
To avoid the rapid corrosion of metal substrate, MS-SOEC must operate under a relatively low temperature such as less than 700°C. It is critical to search an appropriate electrolyte that has a high oxygen ionic conductivity under such a low temperature. Rare-earth doped ceria is a good candidate. For instance, Gd or Sm can be doped with ceria and therefore oxygen defection is formed. The doped ceria has a high ionic conductivity in the intermediate temperature range (Artini, 2018). GDC10 (Ce0.9Gd0.1O2–δ) can operate in the temperature range of 500–700°C, whose ionic conductivity is greater than YSZ by one order of magnitude. Furthermore, operation below 700°C allows the metal seal and the degradation issues alleviate significantly. 10Sc1CeSZ is another suitable electrolyte for intermediate-temperature SOECs (Tanaka et al., 2021). Subotic et al. (2021) designed an electrolyte-supported SOEC (NiO/10Sc1CeSZ|10Sc1CeSZ|GDC|LSCF) with an electrolyte thickness of 200 μm. Lawrence Berkeley National Laboratory investigated the durability of an MS-SOEC. 10Sc1CeSZ was used as the main electrolyte and a durability test with over 1,000 h was performed. Nano-voids in the electrolyte and elements contamination were not found (Shen et al., 2020).
SOECs need to operate at a high current density and severe delamination phenomenon and associated degradation may occur in practice (Ye and Xie, 2021). A barrier layer between the anode and the electrolyte is helpful to prevent the chemical reaction of YSZ or the electronic leakage of GDC. However, investigations indicated that a very high oxygen partial pressure might still exist and the interfacial stability of SOEC was affected (Wang et al., 2020). Zhang et al. employed a charge carrier transport model for a multilayer electrolyte, the oxygen chemical potential across the electrolyte was estimated and the fracture or void formation near the GDC/YSZ interface was predicted (Zhang et al., 2021). Additionally, possible zirconate phase may occur due to the GDC/YSZ interdiffusion during the high-temperature sintering process. This low conductivity region might cause an even higher oxygen partial pressure at the interface (Zhang et al., 2020).
GDC has been successfully used as the main electrolyte of MS-SOFC, as demonstrated by Ceres Power. To prevent the electron leakage, Ceres Power adopted a thin YSZ layer as the barrier layer. Although GDC cannot be used as the electrolyte of SOEC solely, it is common to use GDC together with another electrolyte to form a bilayer structure. For example, Mahmood et al. (2015) fabricated a thin bi-layered ScSZ/GDC electrolyte and tested the polarization curve in SOEC mode. Sumi (Sumi et al., 2017) designed a cell using GDC as the main electrolyte and BCY as the blocking layer for water electrolysis. However, the possibility of using GDC as the main electrolyte in an MS-SOEC needs to be explored further. Mogensen (Mogensen, 2020) has predicted that a three-layer cell design as 10Sc1CeSZ|GDC|10Sc1CeSZ might be suitable for reversible solid oxide cells. However, the performance of such a design needs to be evaluated, especially for the SOEC mode with a high current density. Therefore, in this study, such a three-layer electrolyte design is studied. GDC is used as the main electrolyte and 10Sc1CeSZ is adopted as the barrier layer and coated on both sides of the GDC layer. A mathematical model is established for the designed intermediate-temperature MS-SOEC. The influences of the porosity and tortuosity of the electrodes are analyzed at first. Then, the performance of the MS-SOEC is estimated under various temperatures, pressures, and steam concentrations in the cathode. Finally, the oxygen partial pressure inside the multilayer electrolyte is determined and compared with the conventional design using YSZ as the barrier layer. The outcomes of this study show that the new design can improve the oxygen partial pressure distribution inside the electrolyte while a high steam electrolysis performance is maintained.
2 System modeling
2.1 SOEC cell design
The new design of the MS-SOEC is shown in Figure 1A. A 5 μm GDC layer is used as the main electrolyte while a 1 μm 10Sc1CeSZ layer is deposited on both sides of the GDC layer. As a comparison, the cell structure of the MS-SOFC developed by Ceres Power (Leah et al., 2005) is displayed in Figure 1B. MS-SOEC has a high reliability and can endure frequent quick starts. The ferritic substrate normally has a thickness of 100–300 μm. Small holes with a diameter of 10–30 μm are drilled by lasers to form a porous region. The cathode layer is deposited on the porous substrate, which is composed of Ni/GDC with a thickness of 15 μm. The main GDC electrolyte layer is fabricated by screen printing or tape casting. For the case of Figure 1B, the thickness is set to 5.8 μm. To prevent electron leakage, a 1 μm thick YSZ layer is deposited on the surface of GDC. Finally, a 0.2 μm thin GDC layer is deposited on YSZ layer as a barrier layer to prevent the direct solid reaction of YSZ with the anode material (LSCF) and the formation of low-conductivity impure phase. The anode (LSCF/GDC) and cathode (Ni/GDC) are the same with that of the MS-SOFC of Ceres Power.
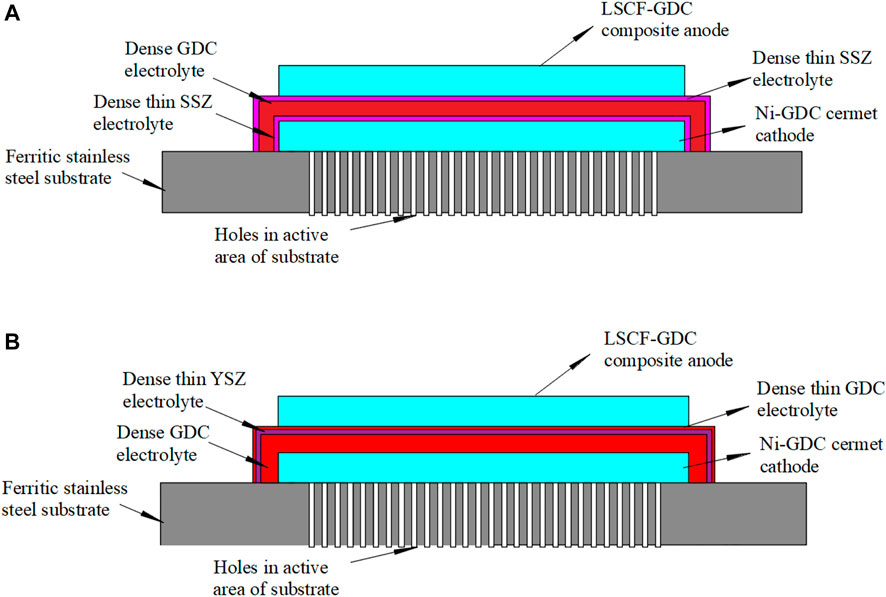
FIGURE 1. Two different designs of MS-SOEC: (A) 10Sc1CeSZ|GDC|10Sc1CeSZ multilayer electrolyte; (B) GDC|YSZ|GDC multilayer electrolyte.
2.2 Mathematical model
During the working process of the MS-SOEC, high-temperature steam-hydrogen mixture is supplied to the cathode and diffused to the triple phase boundary (TPB). Therein, steam is electrolyzed as Eq. 1 shows. The generated oxygen ions are transported to the anode through the dense electrolyte layer. In the anode, Reaction (2) occurs and oxygen is generated.
An electrochemical model is setup to describe the performance of the MS-SOEC. The overall input voltage is determined by
where E is the input voltage, E0 is the thermodynamically reversible voltage that the electrochemical reactions need,
The reversible voltage is predicted by the following Nernst equation according to the temperature and pressure of the species.
where
The activation overpotentials are the voltage losses controlled by the kinetics of the electrochemical reactions. It is expressed by the Butler-Volmer equation as a function of the current density.
For the anode,
For the cathode,
where JI (A/m2) is the operating current density,
where
where
The concentration overpotential occurs due to the mass transport inside the porous electrodes and cannot be neglected under high operating currents. The concentration losses of the anode and the cathode are denoted by Eqs 9, 10, respectively (Ni et al., 2007).
where
The dust gas model is used to describe the mass transport processes inside the electrodes. There are two diffusion mechanisms inside the porous electrode: molecular diffusion and Knudsen diffusion. When the hole diameter is much greater than the mean free path of the molecule, the actions among molecules dominate the diffusion process. Otherwise, the collision between the molecule and the hole wall is the main part (Knudsen mechanism). For the mass transport of the electrodes, both mechanisms are important. The effective diffusion coefficient is expressed by (Andreassi et al., 2007; Shi et al., 2022)
where
The Knudsen diffusion coefficient is determined by
where
The binary diffusion coefficient is denoted by (Todd and Young, 2002)
where Mi,j is the relative molecular weight of the mixture, Vi is the special diffusion volume of the species i.
where Mi and Mj are the relative molecular weights of the species i and j.
The mass transport of the steam and the hydrogen in the porous cathode is important for the kinetics of the electrochemical reaction. It is assumed that the mean diffusion path is estimated by the thickness of the small holes of the substrate and the hole pitch. The partial pressures of the hydrogen and oxygen at the TPB are determined by (Kim, 1991; Virkar et al., 2000; Chan et al., 2001)
where τholepitch is the hole spacing of the substrate, τsubatrate is the thickness of the metal substrate, Deff, cathode is the effective diffusion coefficient of the gases in the cathode.
Similarly, the partial pressure of the oxygen in the TPB of the anode is denoted by (Laurencin et al., 2011)
where τanode is the thickness of the anode, Deff, anode is the thickness of the metal substrate, P is the operating pressure of the anode.
The ohmic overpotential considers the mass transfer of oxygen ions and electrons inside the electrolyte and the electrodes and is expressed by
where ηohm is ohmic overpotential, τanode, τcathode, and τei are the thicknesses of the anode, the cathode and the electrolyte, respectively,
2.3 Equivalent circuit model
Oxygen ion flow is the main part of the mass transport in the multilayer electrolyte. However, for the MIEC material such as GDC, the electronic transport should also be considered. Equivalent circuit model can be used to model the equilibrium potential inside the electrolyte and hence the partial pressure of the oxygen ions can be estimated (Virkar, 1991). Figure 2 shows the equivalent circuit for the designed multilayer electrolyte. The left side is the cathode and the right side is the anode. From the cathode to the anode, the layers of the multilayer electrolyte are labelled with 1 through 3. Point L is the contact site between the first layer of the electrolyte and the cathode. Point C is the contact site between the second layer and the first layer of the electrolyte. Point D is the contact site between the third layer and the second layer of the electrolyte. Point R is the contact site between the anode and the third layer of the electrolyte.
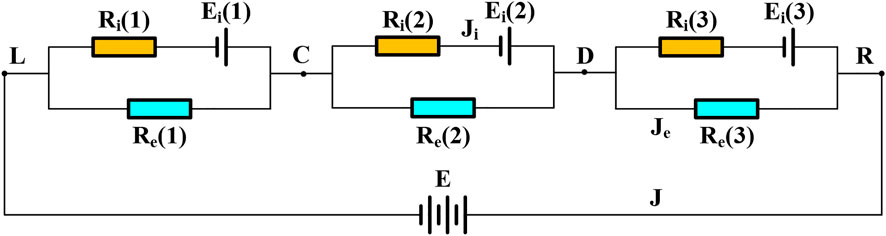
FIGURE 2. Equivalent circuit of the multilayer electrolyte.
According to Nernst-Plank equation, the oxygen chemical potential can be expressed as a function of the oxygen partial pressures on the two sides of a single electrolyte layer.
where Ei is the electromotive force determined by Nernst-Planck equation,
In fact, there are two flow paths in parallel inside the electrolyte: the ionic transport path and the electrical path. The ionic and electrical resistances of the kth layer can be determined by
where Ri(k) and Re(k) are the ionic and electronic resistances of the electrolyte at the kth layer in the equivalent circuit, respectively, τ(k) is the thickness of the kth layer, σi(k) and σe(k) are the ionic and electronic conductivities of the kth layer, respectively. Herein, k equals to 1, 2, or 3 counted from the left to right according to the sequence of the multilayer electrolyte shown in Figure 2.
According to the Kirchhoff law, the following equations are obtained.
where Ji is the current density of the oxygen ion, Je is the current density of the electron, ΦR is the potential at the position between the anode and the electrolyte layer, ΦL is the potential at the position between the cathode and the electrolyte layer, E is the voltage between the positions of L and R, ΦC and ΦD are the potentials at the positions of C and D, just shown as Figure 2, J is the overall current density, Ei(k) is the oxygen chemical potential at the kth electrolyte layer.
When the circuit is in equilibrium, the electrical current is denoted by
If the potential at the left side is assumed zero, the potentials at points C and D are denoted by
The oxygen chemical potentials of the three layers of the electrolyte are expressed by
Finally, the oxygen partial pressures at the interfaces between the adjacent layers inside the electrolyte are determined according to Eq. 19.
In this study, the mathematical model of the MS-SOEC was implemented in the MATLAB R2018a software. The corresponding key parameters and boundary conditions are listed in Tables 1 and 2, respectively. The data for the oxygen ionic conductivity are given in Table 1. The data for the electrical conductivity of GDC are the same as Ref. (Leah et al., 2005). The electrical conductivity of YSZ is set to one thousandth of the corresponding oxygen ionic conductivity of this material. Similar assumption is used for 10Sc1CeSZ. The established mathematical model is validated based on the MS-SOFC shown in Figure 1B. The results of the polarization curve are compared with that of Ceres Power at 873 K (Leah et al., 2005), and displayed in Figure 3A. The porosity is set to 40% and the tortuosity is 4.5. The tendency of the simulated profile is consistent with that in (Leah et al., 2005). The relative deviations are shown in Figure 3B. When the operating current density is less than 0.65 A/cm2, the relative deviation is less than 2%. The maximum relative deviation is 3.05% in the region with a large current density. The precision of the built model is acceptable and can be used for the performance estimation of the designed MS-SOEC. Since the data of SOEC mode similar to such a design cannot be found, the results of SOFC mode are used to validate the established mathematical model. For the SOEC mode, the polarization losses are assumed as the same with that of the SOFC mode. It is assumed that the default porosity is 40% and the tortuosity is 4.5 for the following analysis.
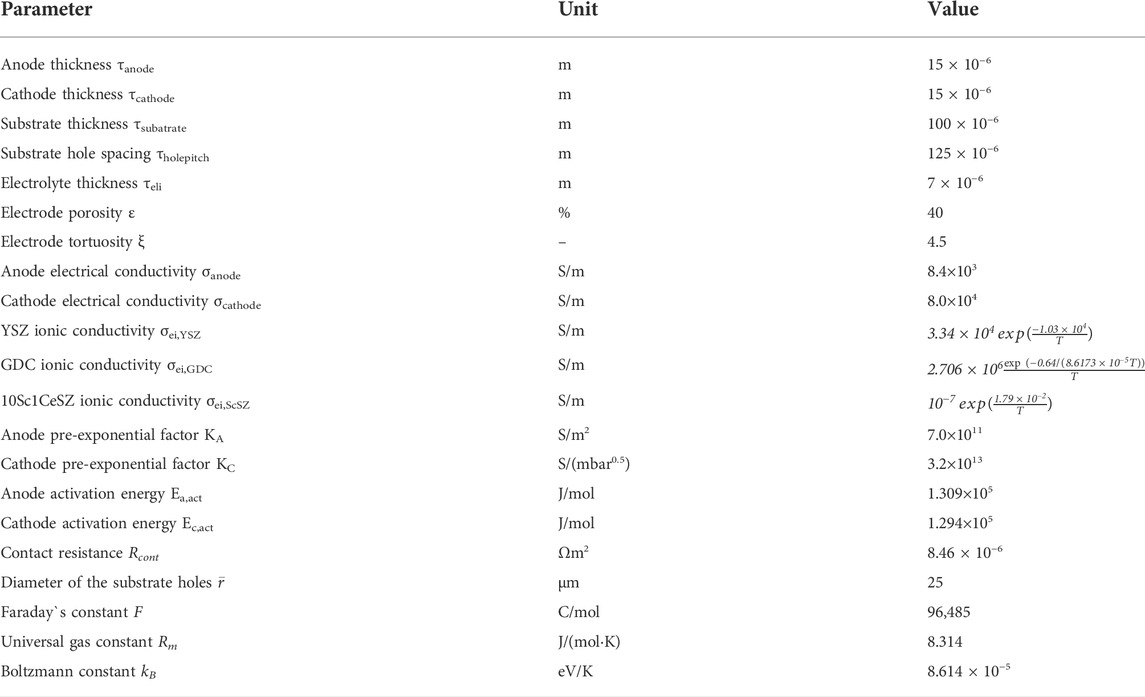
TABLE 1. The main parameters of the mathematical model.

TABLE 2. The boundary conditions of the model.
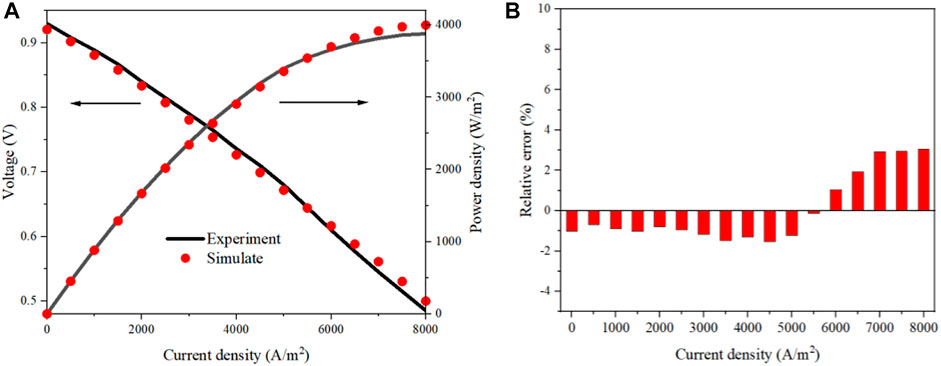
FIGURE 3. Validation of the mathematical model: (A) polarization curve; (B) relative deviation.
3 Results and discussion
3.1 Effects of porosity and tortuosity
The effects of porosity and tortuosity on the performance of MS-SOEC are evaluated at first. These parameters will affect the mass transports in the cathode and anode. An inappropriate configuration will increase the concentration losses. The operating temperature is set to 600°C and a mixture of steam and hydrogen is supplied to the cathode with a steam mole concentration of 0.8. Air is input to the anode. First, Eq. 3 through (18) are used to determine the performance of the SOEC. The effects of porosity and tortuosity are evaluated based on Eqs. (11) through (14). The results are displayed in Figures 4A,B, respectively, when the porosities are set to 20 and 60%. The concentration and ohmic losses increase almost linearly with the increase of the current density. The activation loss ascends rapidly in the small current density region and increase slowly when the current density is large. The variation of the porosity almost has no effect on the ohmic losses. However, as the porosity rises, the concentration loss declines evidently. When the current density is 0.7 A/cm2, the concentration loss is 43.72 mV with a porosity of 20% while it is 16.85 mV when the porosity is 60%, which is decreased by 61.46%.
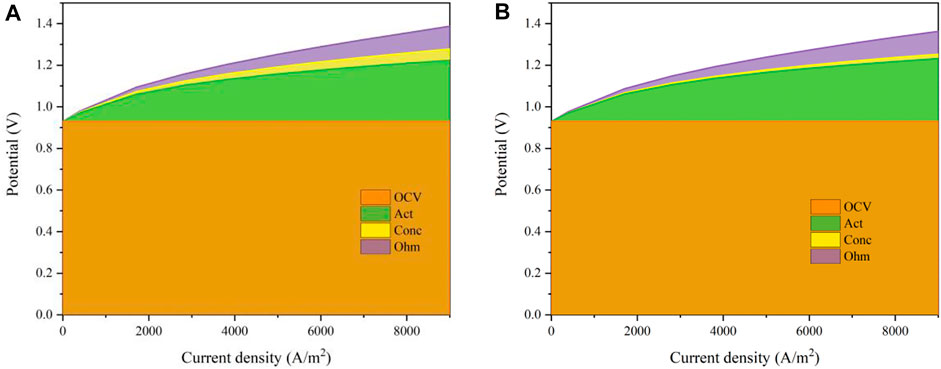
FIGURE 4. Effects of electrode porosity on the cell performance: (A) ε = 0.2; (B) ε = 0.6.
The concentration losses of the electrodes are compared as the porosity increases from 0.2 to 0.6. The results are shown in Figure 5. Both the concentration losses decrease as the porosity increases, especially in the regions with a large current density. When the current density is 0.7A/cm2, the concentration losses of the cathode and anode are decreased by 61.41 and 66.36%, respectively, as the porosity increases from 0.2 to 0.6. Meanwhile, the concentration overpotential of the anode is obviously less than that of the cathode. The overpotential of the cathode is 81–107 times greater than the anode and this proportion increases with the decrement of the current density or the increment of the porosity. This is because of the existence of the metal substrate on the cathode. As the current density increases, the mass flow rates of the species need to be increased as well. This requires a large mass transport capacity and a large porosity is beneficial for the improvement of the diffusion process. This is because the probability of the collision of the molecules against the hole walls is decreased for a larger porosity. The effective diffusion coefficients of the electrodes are shown in Figure 5C. The effective diffusion coefficients increase linearly as the current density rises. When the porosity is increased from 0.2 to 0.6, the effective diffusion coefficient of the cathode is increased from 0.712 × 10⁻⁶ m2/s to 2.137 × 10⁻⁶ m2/s while it is increased from 2.460 × 10⁻⁶ m2/s to 7.381 × 10⁻⁶ m2/s in the anode. The effective diffusion coefficient of the anode is about 3.45 times of the cathode, indicating that the metal substrate in the cathode has an obvious influence on the mass transport.
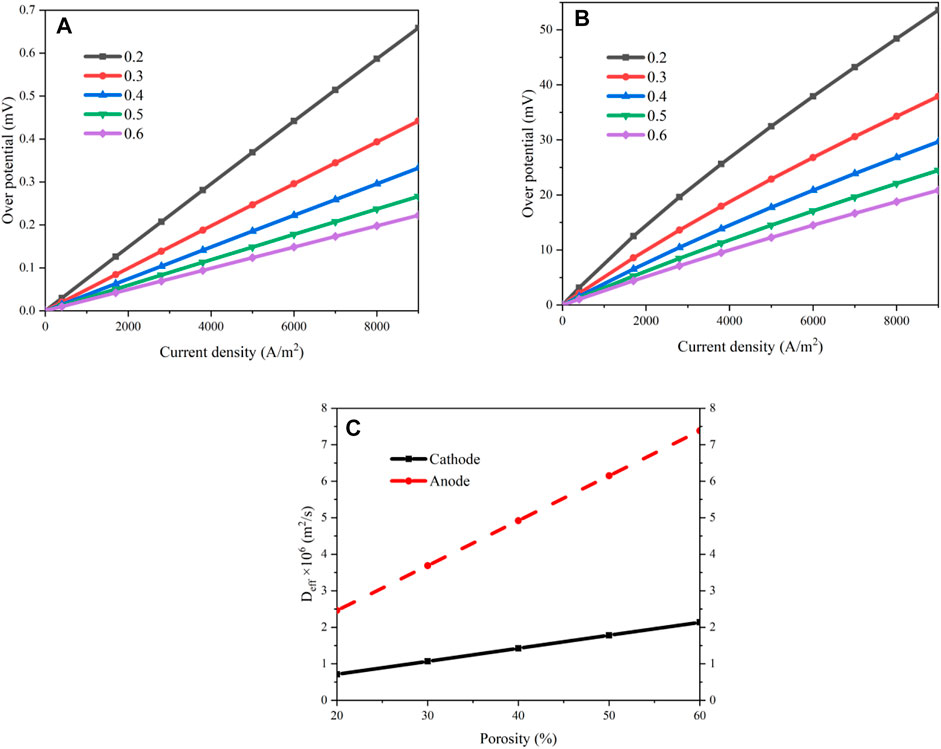
FIGURE 5. Results of the concentration losses under various porosities: (A) overpotential of the anode; (B) overpotential of the cathode; (C) effective diffusion coefficients of the electrodes.
The effects of the tortuosity are analyzed on the same working conditions with a porosity of 40%. Figure 6 shows the polarization curves and the different overpotentials when the tortuosity is 2.5 and 6.5, respectively. For a fixed tortuosity, the variations of the overpotentials versus the current density are similar with that in Figure 4. However, the proportion of the concentration loss increases apparently as the tortuosity rises. When the current density is 0.7A/cm2, a concentration overpotential of 14.29 mV is obtained for a tortuosity of 2.5 while it increases to 33.14 mV when the tortuosity is 6.5, which is increased by 131.9%.
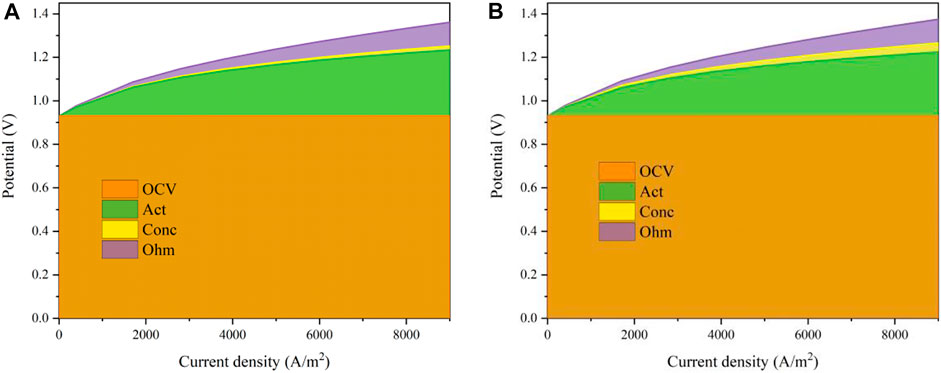
FIGURE 6. Effects of the electrode tortuosity on the cell performance: (A)
A comparison of the concentration losses of the cathode and the anode is shown in Figure 7 when the tortuosity increases from 2.5 to 6.5. The concentration overpotentials of the anode and cathode are increased gradually with the increment of the tortuosity. As the current density rises, this augmentation tendency is more significant. The reason is attributed to a poorer mass transport due to a larger tortuosity. As the current density rises, the amounts of the reactants need to be increased, the mass flow rates must be increased accordingly, leading to a larger flow resistance. When the current density is 0.7A/cm2, the concentration overpotentials of the anode and the cathode are increased by 158.4 and 131.7%, respectively, as the tortuosity rises from 2.5 to 6.5. Figure 7C shows the effective diffusion coefficients of the electrodes as a function of the tortuosity. As the tortuosity increases, these coefficients decrease. The effects of the tortuosity on the cathode are more significant than that on the anode, especially when the tortuosity is small.
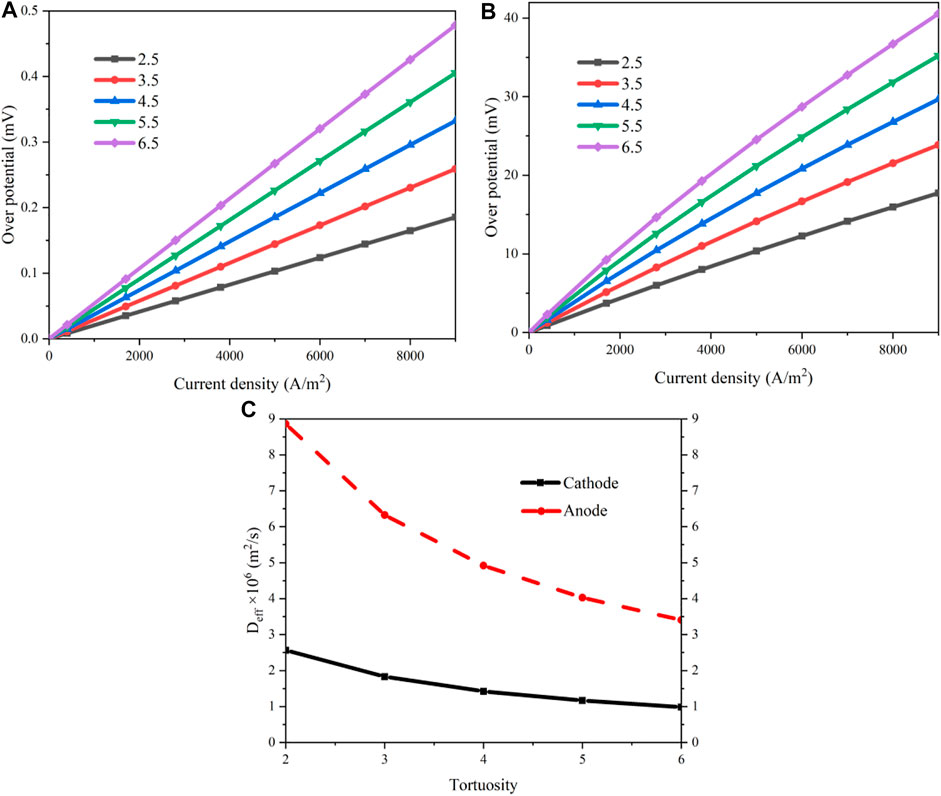
FIGURE 7. Results of the concentration losses as a function of the tortuosity: (A) concentration overpotential of the anode; (B) concentration overpotential of the cathode; (C) effective diffusion coefficients of the electrodes.
3.2 Effects of operating parameters
During the working process of an SOEC, the operating temperature, pressure, and the steam concentration in the cathode are three important parameters. The influences of these parameters on the steam electrolysis performance are analyzed in this section.
3.2.1 Operating temperature
The operation temperature has a complex impact on the system performance according to Eqs 3–18. It will affect the activation loss as Eqs 5–8, the concentration loss as Eqs 9 and 10, and the ohmic loss as Eqs 15–18. The polarization curves of the designed MS-SOEC are determined as the operating temperature varies from 550 to 750 °C. The operating pressure is set to 1 bar and a mixture of steam and hydrogen is supplied to the cathode with a steam mole fraction of 0.8. The results are shown in Figure 8A. The solid line represents the input voltages and the dashed lines labels the input power, which are also used for the exhibition of the other polar curves. The required input voltage increases as the increment of the current density. The change rate is more evident in the region with a small current density when the operating temperature is low. The input voltage decreases gradually as the operating temperature rises. When the current density is 0.7 A/cm2, the input voltage and power arrive at 1.483 V and 1.038 W/cm2 under the temperature of 550°C. When the temperature increases to 650°C, the input voltage reduces to 1.181 V and the input power drops to 0.827 W/cm2, which is decreased by 31.267%. If the temperature rises to 750 °C further, the input voltage and power decrease to 1.019 V and 0.714 W/cm2, respectively.
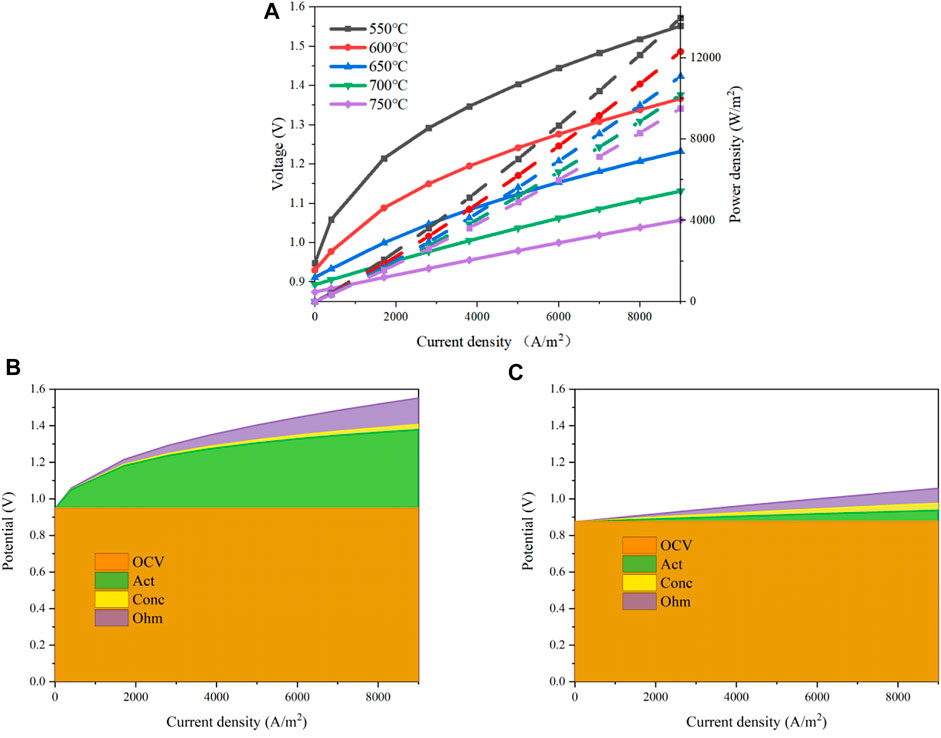
FIGURE 8. Performances of the designed MS-SOEC under various operating temperatures: (A) polarization curves; (B) overpotential losses with an operating temperature of 550°C; (C) overpotential losses with an operating temperature of 750°C.
A comparison of the overpotentials of the cell is shown in Figures 8B,C when the operating temperatures are 550°C and 750°C. It can be seen that both the activation and ohmic losses decrease as the operating temperature rises while the concentration loss is enlarged slightly, especially in the region with a large current density. When the current density is 0.7 A/cm2, the activation overpotential is 398.8 mV and the ohmic overpotential is 113.5 mV with an operating temperature of 550°C, while the concentration overpotential is 22.17 mV. When the temperature rises to 750°C, the activation and ohmic overpotentials are reduced to 50.04 and 64.38 mV whereas the concentration overpotential increases to 30.29 mV. The activation and ohmic overpotentials are decreased by 87.45 and 43.25% , respectively. However, the concentration overpotential is increased by 36.63%. To sum up, increasing the operating temperature can decrease the overall overpotential losses and the system performance is increased.
3.2.2 Operating pressure
The operating pressure of a fuel cell may oscillate during the working process (Kulikovsky, 2021). Hence, the effects of the operating pressure are estimated. The operating temperature is set to 600°C and a mixture of steam and hydrogen is supplied to the cathode with a steam mole fraction of 0.8. The operation pressure mainly affects the activation loss shown as Eq. 4, Eqs 7 and 8 and the concentration loss as Eqs 9 and 10. The results are shown in Figure 9. When the operating pressure increases from 0.5 to 4 bar, the polarization curves are displayed in Figure 9A. The input voltage declines as the pressure increases from 0.5 to 3 bar in the region when the current density is greater than about 20 mA/cm2. An opposite trend exhibits when the current density is lower, where the maximum difference occurs at the OCV point. This can be explained according to Eq. 4. In the region with a larger current density, the greater the current density, the larger the decrement magnitude of the input voltage as the operating pressure increases. However, further increasing the operating pressure to 4 bar, the decrement magnitude is very limited. When the current density is 0.7A/cm2, the required input voltages are 1.451V/0.5bar, 1.357V/1bar, 1.320V/2bar, 1.311V/3bar, 1.307V/4bar, respectively. The results of the overpotential losses with an operating pressure of 0.5 and 4 bar are shown in Figures 9B,C. The concentration losses decrease significantly as the pressure rises due to a higher diffusion coefficient. Meanwhile, the activation losses are reduced as well. This is attributed to the improvement of the kinetics of the electrochemical reactions, especially for the hydrogen evolution reaction in the TPB region of the cathode.
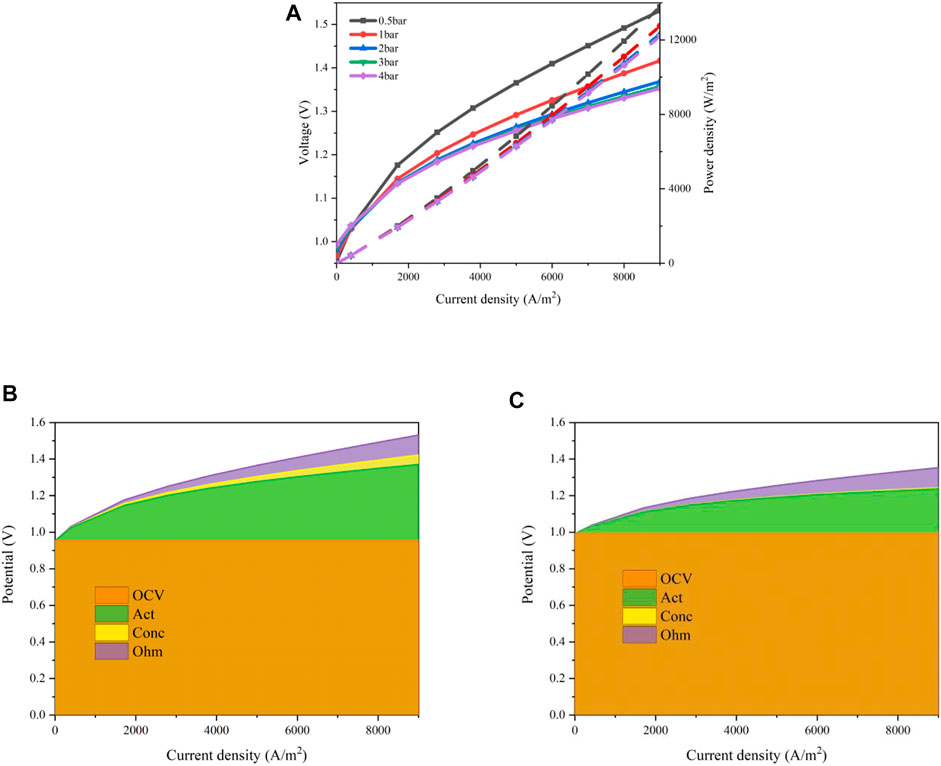
FIGURE 9. Performances of the designed MS-SOEC under various operating pressures: (A) polarization curves; (B) overpotential losses with an operating pressure of 0.5 bar; (C) overpotential losses with an operating pressure of 4 bar.
3.2.3 Steam concentration
The steam mole concentration supplied to the cathode has a positive relation with the steam partial pressure in the TPB. Therefore, the chemical reaction rate of the steam electrolysis will be influenced. Eq. 4 and Eqs 8 and 10 give the detailed functions. The results for the polarization curves when the steam mole concentration increases from 0.2 to 0.95 are shown in Figure 10A. The input voltage decreases gradually as the steam concentration rises. The values of the OCV are 0.998 V (pH2O = 0.4), 0.967 V (pH2O = 0.6), 0.930 V (pH2O = 0.8), and 0.871 V (pH2O = 0.95). When the current density is 0.7 A/cm2, these values increase evidently to 1.393, 1.338, 1.308, and 1.299V, respectively. If the steam concentration is too low such as 0.2, the supply rate of the steam is less than the consuming rate of the electrochemical reaction, leading to an upward warpage of the polarization curve. The overall activation and concentration losses are displayed in Figures 10B,C. These two losses reduce as the steam concentration rises. This is because a larger steam concentration will enhance the mass transport of steam through the porous cathode. Meanwhile, a larger steam concentration will accelerate the reaction. When the steam concentration is greater than 80%, the input voltage decreases only slightly if further increasing the steam concentration. To keep a high efficiency, the steam concentration should be greater than 0.8.
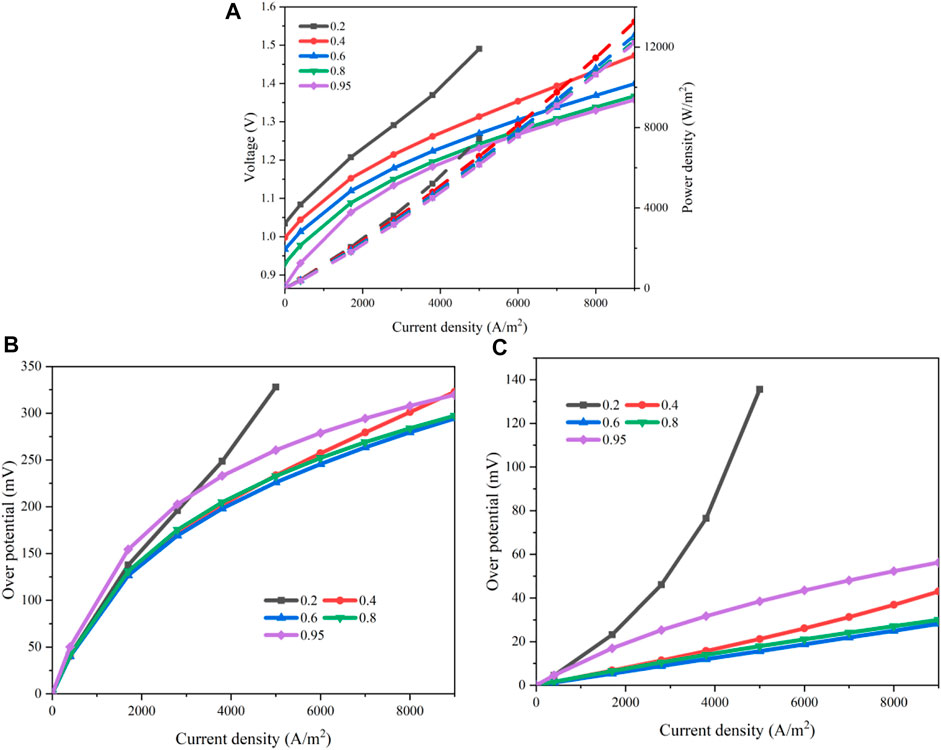
FIGURE 10. Effects of the steam concentration: (A) polarization curve; (B) activation overpotential; (C) concentration overpotential.
3.3 Oxygen partial pressure in the electrolyte
The electrolyte GDC is suitable for intermediate-temperature conditions (550–650°C). It has been successfully used in MS-SOFC systems. However, the electronic conductivity is serious under a reducing atmosphere due to the reduction of Ce4+ to Ce3+. A thin and dense barrier layer is employed to prevent the internal electronic short circuit. For such a design with multilayer electrolyte, a very high oxygen partial pressure may occur at the interfaces and inside the electrolyte (Zhang et al., 2020), which exceeds the mechanical limit of the material and causes delamination and degradation under the operation conditions with a high current density. The degradation of the electrolyte in an electrochemical device is important and must be considered seriously (Liao, 2020). Current investigations only considered the cases with two layers of electrolyte, for example, using YSZ as the main electrolyte and GDC as the barrier layer. It is necessary to give an evaluation of the oxygen partial pressure for the two designs in Figure 1 with three layers of electrolyte. In this study, the oxygen partial pressure issue is explored based on the equivalent circuit model.
When the operating temperature is 600°C, the oxygen partial pressures at the interfaces between two adjacent layers inside the designed multilayer electrolyte are determined along the thickness direction. Herein, Case 1 represents the new design as 10Sc1CeSZ|GDC|10Sc1CeSZ displayed in Figure 1A and Case 2 is the conventional design of Ceres Power as GDC|YSZ|GDC displayed in Figure 1B. The multilayer electrolytes for the Cases 1 and 2 are composed of three layers shown as Figures 1, 2. With regard to the oxygen ion transport path, each layer has an ohmic potential decrement and an oxygen chemical potential increment Ei(k). When the current density is 0.17 and 0.7 A/cm2, the results of these two different potentials are compared in Figure 11. The number of x-axes labels the layer of the electrolyte. Layer one denotes the left layer in the proximity of the cathode and Layer 3 is the one close to the anode. When the current density is 0.17A/cm2, the results of the ionic ohmic potential are compared between the Case 1 and Case 2 in Figure 11A. Figure 11B gives the results of the oxygen chemical potential. Meanwhile, Figures 11C,D are the results with a current of 0.7A/cm2.
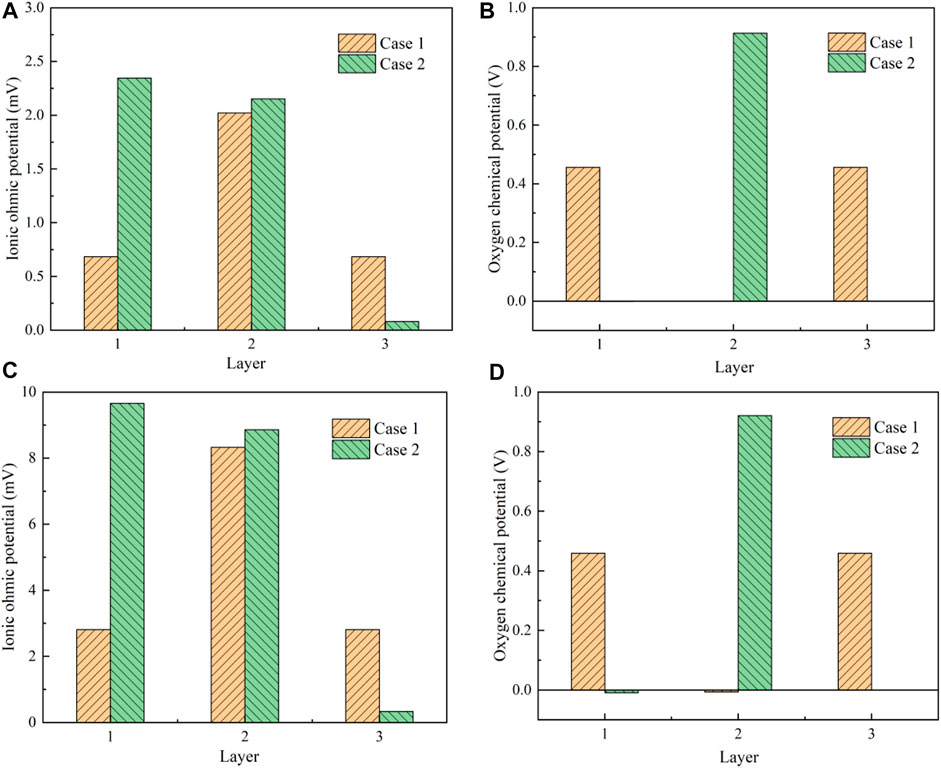
FIGURE 11. Results of the potentials inside the multilayer electrolytes: (A) oxygen ohmic potential under the current density of 0.17A/cm2; (B) oxygen chemical potential under the current density of 0.17A/cm2; (C) oxygen ohmic potential under the current density of 0.7A/cm2; (D) oxygen chemical potential under the current density of 0.7A/cm2.
When 10Sc1CeSZ is used as Case 1 shows, the ionic conductivity of 10Sc1CeSZ approximates to the value of GDC according to the data in Table 1. Meanwhile, the oxygen ohmic potential is also affected by the thickness of each layer. As a result, the ohmic potential of the GDC layer is evidently greater than that of 10Sc1CeSZ. When YSZ is used as the barrier layer in Case 2, because the GDC Layer one is much thicker than the other two layers, the ohmic potential of GDC is close to the YSZ Layer 2. On the other hand, the ohmic potential of each layer is much smaller than the associate chemical potential by almost 2 orders of magnitude. The oxygen chemical potentials of the 10Sc1CeSZ and YSZ are significantly greater than that of GDC layer. This is mainly because of the constraints of the electronic path. The difference of the electronic conductivity of the electrolytes has a great influence on the oxygen chemical potential distribution. With regard to the transport path of the electrons in Figure 2, the potential is mainly imposed on the YSZ layer and the 10Sc1CeSZ layers because GDC can be treated as a conductor compared with these two materials according to the data of electrical conductivity. Then, considering the oxygen ion transport path in Figure 2, this potential is the sum of the oxygen ohmic potential and the value of Ei(k). Because the Ei(k) is evidently greater than the ohmic potential shown as Figures 11A,B, the distribution of Ei(k) is almost the same as the potential in the electron transport path. Therefore, the oxygen chemical potential increment of GDC in these two cases are almost zero. Generally, as the current density increases, the ohmic potential of each layer increases apparently. The oxygen chemical potential is basically imposed on the YSZ layer for the Case 2. This is not helpful for the suppression of delamination. As a contrast, the overall chemical potential is evenly distributed between the two 10Sc1CeSZ layers for Case 1. If the oxygen chemical potential is too large, oxygen molecules may precipitate and enter into the nano voids that exist in the electrolyte. The gas pressure in the nano voids will continue to increase and exceed the mechanical limit of the electrolyte, causing the delamination. The results indicate that the new design using 10Sc1CeSZ as the barrier layer can alleviate the oxygen partial pressure issue of GDC significantly and the durability can be improved accordingly.
Figure 12 shows the results of the partial oxygen pressure and the corresponding potential at the interfaces of the multilayer electrolyte. The x-axis is the thickness direction of the electrolyte. The interface between the cathode and the multilayer electrolyte is denoted by 0 (corresponding to the point L in Figure 2) and the interface between the anode and the electrolyte is at 7 μm (corresponding to the point R in Figure 2). Points C and D are the two interfaces inside the multilayer electrolyte of Case 1 labelled as Figure 2. For Case 2, these two points are replaced with Points C′ and D’. The results of the partial pressure are shown in Figures 12A,B when the current densities are 0.17 and 0.7A/cm2. For Case 1 where 10Sc1CeSZ is deposited on both sides of the GDC layer, the values of the oxygen partial pressure on the two interfaces (corresponding to the points C and D in Figure 2) are 9.43 × 10⁻¹¹ and 1.11 × 10⁻¹⁰ bar, respectively. In contrast, when the barrier layer YSZ is used as Case 2 shown, the oxygen partial pressures at the two interfaces of GDC layers (corresponding to the points L and D′ in Figure 2) are 9.15 × 10⁻²¹ and 1.004 bar. If the oxygen partial pressure of GDC is lower than the order of 10−16 bar, decomposition of GDC may occur according to the thermodynamic equilibrium. It is evident that the new design can improve the oxygen partial pressure of the GDC layer close to the cathode and a too small partial pressure is avoided, just as Case 2 shows. Meanwhile, for Case 1, the oxygen partial pressure of the GDC layer adjacent to the 10Sc1CeSZ layer close to the anode (Point D) is also evidently lower than 1 bar, which is beneficial for the relief of delamination. However, if YSZ is used as the barrier layer, the oxygen partial pressure at the interface between YSZ and the thinner GDC layer (Point D’) is slightly greater than 1bar. During the transient working process, this oxygen partial pressure may exceed the mechanical limit and causes delamination. If the potential at the point L is set to 0, the potentials at the interfaces can be determined according to the mathematical model. The results are shown in Figures 12C,D. The profiles for both cases are very similar with that of the oxygen partial pressures. The potential variations on the GDC layers are very small because the electronic conductivity of GDC is significantly greater than that of 10Sc1CeSZ and YSZ.
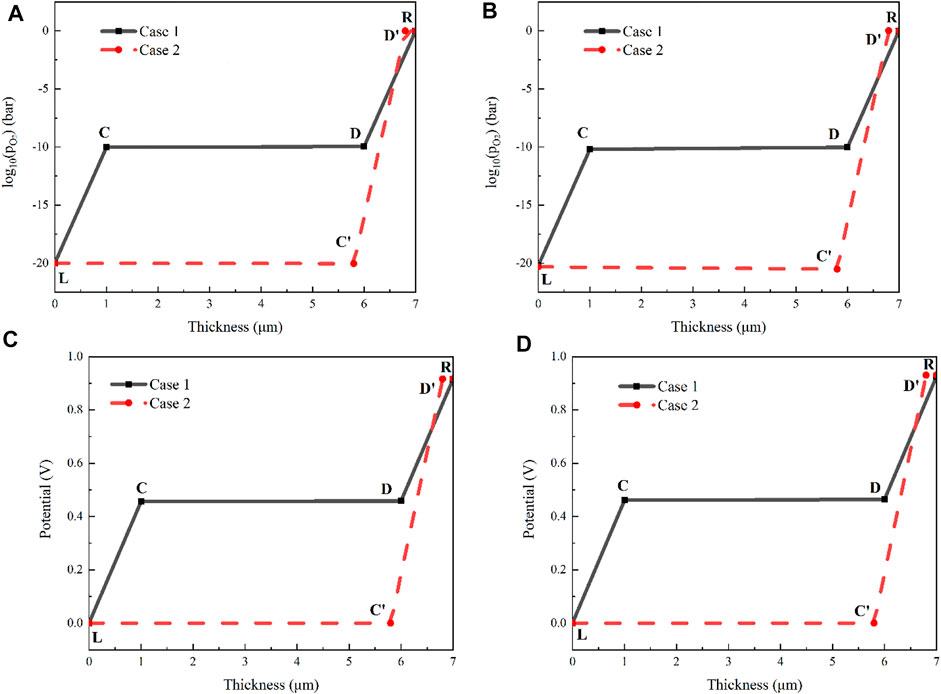
FIGURE 12. Comparison of the two multilayer electrolytes when the operating temperature is 600°C: (A) oxygen partial pressure under the current density of 0.17A/cm2; (B) oxygen partial pressure under the current density of 0.7A/cm2; (C) potential under the current density of 0.17A/cm2; (D) potential under the current density of 0.7A/cm2.
4 Conclusion
In this study, the performance of a metal-supported SOEC with a multilayer electrolyte design was estimated based on the established mathematical model. First, the effects of the porosity and tortuosity of the electrodes were analyzed. Subsequently, the influences of the operating temperature, pressure, and the steam concentration were determined. Finally, the oxygen partial pressure inside the multilayer electrolyte was discussed using an equivalent circuit method.
Increasing the operating temperature of the MS-SOEC can evidently improve the kinetics of electrochemical reactions in the electrodes and decrease the concentration and ohmic losses. For the designed MS-SOEC using the multilayer electrolyte 10Sc1CeSZ|GDC|10Sc1CeSZ, an acceptable performance can be achieved in the temperature range of 600–700°C. Further increasing the temperature can reduce the overpotentials whereas the sealing and corrosion of the metal support need to be evaluated. A higher operating pressure is helpful for the kinetics and mass transport in the electrodes. However, when the pressure is greater than 3 bar, the improvement is very small and such a high pressure may cause mechanical problems. Therefore, it is better to control the operating pressure lower than 3 bar. The steam concentration in the cathode also has a great effect on the performance. The activation loss of the cathode decreases as the steam concentration rises. A high steam concentration such as greater than 0.8 is recommended.
The porosity and tortuosity will affect the mass transport in the electrodes. The effective diffusion coefficients of the cathode and the anode increase with the increment of the porosity and the decrement of the tortuosity. However, a much higher porosity is not beneficial for the mechanical stability and the area of TPB may decrease. The tortuosity is mainly decided by the fabrication process of the electrodes. Recently, much low tortuosity may be obtained via inverse phase process or magnetic sputtering technology.
The oxygen partial pressure inside the electrolyte has a great effect on the durability of the MS-SOEC. Using the designed multilayer electrolyte 10Sc1CeSZ|GDC|10Sc1CeSZ, the internal distribution of the oxygen partial pressure can be improved compared with the conventional design GDC|YSZ|GDC. A very low value of the oxygen partial pressure of the GDC layer close to the cathode is avoided. Meanwhile, the oxygen partial pressure close to the anode decreases, which is beneficial for the suppression of delamination. Therefore, compared with the conventional design, the designed MS-SOEC can improve the durability significantly while a high performance is maintained. Although the results of this study show the feasibility of the three-layer electrolyte design, more investigations are required such as electrolyte densification, metal substrate corrosions, and thermal expansion consistency, and experimental results need to be demonstrated in the future.
Data availability statement
The original contributions presented in the study are included in the article/Supplementary Material, further inquiries can be directed to the corresponding author.
Author contributions
EW contributes to conceptualization, literature survey, paper drafting, and funding acquisition. MZ is mainly responsible for the modeling, programing, data curation, analysis, and writing paper. JM contributes to the paper modification, resources, modeling, and visualization. HW contributes to validation, project administration. MO contributes to supervision and resources. HH contributes to project administration and fund acquisition.
Funding
This research work was supported by the National Key Research and Development Program of China (Grant No. 2021YFB2500400).
Conflict of interest
The authors declare that the research was conducted in the absence of any commercial or financial relationships that could be construed as a potential conflict of interest.
Publisher’s note
All claims expressed in this article are solely those of the authors and do not necessarily represent those of their affiliated organizations, or those of the publisher, the editors and the reviewers. Any product that may be evaluated in this article, or claim that may be made by its manufacturer, is not guaranteed or endorsed by the publisher.
References
AlZahrani, A. A., and Dincer, I. (2022). Assessment of a thin-electrolyte solid oxide cell for hydrogen production. Energy 243, 123042. doi:10.1016/j.energy.2021.123042
Andreassi, L., Rubeo, G., Ubertini, S., Lunghi, P., and Bove, R. (2007). Experimental and numerical analysis of a radial flow solid oxide fuel cell. Int. J. Hydrogen Energy 32 (17), 4559–4574. doi:10.1016/j.ijhydene.2007.07.047
Artini, C. (2018). Rare-earth-doped ceria systems and their performance as solid electrolytes: A puzzling tangle of structural issues at the average and local scale. Inorg. Chem. 57, 13047–13062. doi:10.1021/acs.inorgchem.8b02131
Biswas, S., Kulkarni, A. P., Giddey, S., and Bhattacharya, S. (2020). A review on synthesis of methane as a pathway for renewable energy storage with a focus on solid oxide electrolytic cell-based processes. Front. Energy Res. 8, 11687–11694. doi:10.3389/fenrg.2020.570112
Chan, S. H., Khor, K. A., and Xia, Z. T. (2001). A complete polarization model of a solid oxide fuel cell and its sensitivity to the change of cell component thickness. J. Power Sources 93 (1-2), 130–140. doi:10.1016/s0378-7753(00)00556-5
Dejoie, C., Yu, Y., Bernardi, F., Tamura, N., Kunz, M., Marcus, M. A., et al. (2020). Potential control of oxygen non-stoichiometry in cerium oxide and phase transition away from equilibrium. ACS Appl. Mat. Interfaces 12, 31514–31521. doi:10.1021/acsami.0c08284
Ding, C. S., Lin, H. F., Sato, K., Amezawa, K., Kawada, T., Mizusaki, J., et al. (2010). Effect of thickness of Gd0.1Ce0.9O1.95 electrolyte films on electrical performance of anode-supported solid oxide fuel cells. J. Power Sources 195 (17), 5487–5492. doi:10.1016/j.jpowsour.2010.03.075
Greene, D. L., Ogden, J. M., and Lin, Z. (2020). Challenges in the designing, planning and deployment of hydrogen refueling infrastructure for fuel cell electric vehicles. eTransportation 6, 100086. doi:10.1016/j.etran.2020.100086
Hatagishi, K. T., and Arai, H. (1996). Power generation and steam electrolysis characteristics of an electrochemical cell with a zirconia- or ceria-based electrolyte. Solid State Ionics 86-88 (1), 1245–1249. doi:10.1016/0167-2738(96)00295-0
Intergovernmental Panel on Climate Change (2018). Special report - global warming of 1.5 oC. AvaliableAt: https://www.ipcc.ch/sr15.
Iora, P., and Chiesa, P. (2009). High efficiency process for the production of pure oxygen based on solid oxide fuel cell-solid oxide electrolyzer technology. J. Power Sources 190 (2), 408–416. doi:10.1016/j.jpowsour.2009.01.045
Kim, J. W. (1991). Polarization effects in intermediate temperature, anode‐supported solid oxide fuel cells. J. Electrochem. Soc. 146 (1), 69–78.
Kulikovsky, A. (2021). Performance of a pem fuel cell with oscillating air flow velocity: A modeling study based on cell impedance. eTransportation 7, 100104. doi:10.1016/j.etran.2021.100104
Laurencin, J., Kane, D., Delette, G., Deseure, J., and Lefebvre-Joud, F. (2011). Modelling of solid oxide steam electrolyser: Impact of the operating conditions on hydrogen production. J. Power Sources 196 (4), 2080–2093. doi:10.1016/j.jpowsour.2010.09.054
Leah, R., Bone, A., Selcuk, S., Lankin, M., Rahman, M., Clare, A., et al. (2021). Commercialization of the Ceres power SteelCell technology: Latest update. ECS Trans. 103, 679–684. doi:10.1149/10301.0679ecst
Leah, R. T., Brandon, N. P., and Aguiar, P. (2005). Modelling of cells, stacks and systems based around metal-supported planar IT-SOFC cells with CGO electrolytes operating at 500-600°C. J. Power Sources 145 (2), 336–352. doi:10.1016/j.jpowsour.2004.12.067
Lein, H. L., Wiik, K., and Grande, T. (2006). Thermal and chemical expansion of mixed conducting La0.5Sr0.5Fe1−xCoxO3−δ materials. SOLID STATE IONICS 177, 1795–1798. doi:10.1016/j.ssi.2006.02.033
Liao, C. (2020). Electrolytes and additives for batteries Part I: Fundamentals and insights on cathode degradation mechanisms. eTransportation 5, 100068. doi:10.1016/j.etran.2020.100068
Luo, D., Xu, Q., Qian, J., and Li, X. (2019). Interface‐engineered intermediate temperature solid oxide electrolysis cell. Energy Technol. 7, 1900704. doi:10.1002/ente.201900704
Mahmood, A., Bano, S., Yu, J. H., and Lee, K. (2015). High-performance solid oxide electrolysis cell based on ScSZ/GDC (scandia-stabilized zirconia/gadolinium-doped ceria) bi-layered electrolyte and LSCF (lanthanum strontium cobalt ferrite) oxygen electrode. Energy 90, 344–350. doi:10.1016/j.energy.2015.06.109
McKenna, B. J., Christiansen, N., Schauperl, R., Prenninger, P., Nielsen, J., Blennow, P., et al. (2013). Advances in metal supported cells in the METSOFC EU consortium. FUEL CELLS 13, 592–597. doi:10.1002/fuce.201200185
Milcarek, R. J., Wang, K., Falkenstein-Smith, R. L., and Ahn, J. (2016). Performance variation with SDC buffer layer thickness. Int. J. Hydrogen Energy 41 (22), 9500–9506. doi:10.1016/j.ijhydene.2016.04.113
Min, L., Shi, D., and Suo, H. (2009). A simple MOD method to grow a single buffer layer of Ce0.8Gd0.2O1.9 (CGO) for coated conductors. Phys. C Supercond. Its Appl. 469 (5-6), 230–233. doi:10.1016/j.physc.2009.01.017
Mogensen, M. B. (2020). Materials for reversible solid oxide cells. Curr. Opin. Electrochem. 21, 265–273. doi:10.1016/j.coelec.2020.03.014
Nechache, A., and Hody, S. (2021). Alternative and innovative solid oxide electrolysis cell materials: A short review. Renew. Sustain. Energy Rev. 149, 111322. doi:10.1016/j.rser.2021.111322
Nguyen, T. L., Kobayashi, K., and Honda, T. (2004). Preparation and evaluation of doped ceria interlayer on supported stabilized zirconia electrolyte SOFCs by wet ceramic processes. Solid State Ionics 174 (1-4), 163–174. doi:10.1016/j.ssi.2004.06.017
Ni, M., Leung, M., and Leung, D. (2007). Parametric study of solid oxide steam electrolyzer for hydrogen production. Int. J. Hydrogen Energy 32 (13), 2305–2313. doi:10.1016/j.ijhydene.2007.03.001
Nielsen, J., Persson, A. H., Muhl, T. T., and Brodersen, K. (2018). Towards high power density metal supported solid oxide fuel cell for mobile applications. J. Electrochem. Soc. 165 (2), 90–96. doi:10.1149/2.0741802jes
Park, B., Scipioni, R., Zhang, Q., Cox, D., Voorhees, P. W., and Barnett, S. A. (2020). Tuning electrochemical and transport processes to achieve extreme performance and efficiency in solid oxide cells. J. Mat. Chem. A 8, 11687–11694. doi:10.1039/d0ta04555a
Peng, H., Li, J., Thul, A., Deng, K., Ünlübayir, C., Löwenstein, L., et al. (2020). A scalable, causal, adaptive rule-based energy management for fuel cell hybrid railway vehicles learned from results of dynamic programming. eTransportation 4, 100057. doi:10.1016/j.etran.2020.100057
Pfeifer, A., Prebeg, P., and Duić, N. (2020). Challenges and opportunities of zero emission shipping in smart islands: A study of zero emission ferry lines. eTransportation 3, 100048. doi:10.1016/j.etran.2020.100048
Riegraf, M., Bombarda, I., Dömling, F., Liensdorf, T., Sitzmann, C., Langhof, N., et al. (2021). Enhancing the mechanical strength of electrolyte-supported solid oxide cells with thin and dense doped-ceria interlayers. ACS Appl. Mat. Interfaces 13, 49879–49889. doi:10.1021/acsami.1c13899
Sahibzada, M., Rudkin, R. A., and Steele, B. (1997). Evaluation of pen structures incorporating supported thick film Ce0.9Gd0.1O1.95 electrolytes. Proc. Vol. 1997-40, 244–253. doi:10.1149/199740.0244pv
Schefold, J., Brisse, A., Surrey, A., and Walter, C. (2020). 80,000 current on/off cycles in a one year long steam electrolysis test with a solid oxide cell. Int. J. Hydrogen Energy 45, 5143–5154. doi:10.1016/j.ijhydene.2019.05.124
Schiller, G., Ansar, A., and Patz, O. (2010). High temperature water electrolysis using metal supported solid oxide electrolyser cells (SOEC). Adv. Sci. Technol. 72, 135–143. doi:10.4028/www.scientific.net/ast.72.135
Shen, F., Wang, R., and Tucker, M. C. (2020). Long term durability test and post mortem for metal-supported solid oxide electrolysis cells. J. Power Sources 474, 228618. doi:10.1016/j.jpowsour.2020.228618
Shi, Y., Cai, N., and Chen, L. (2022). Numerical modeling of an anode-supported SOFC button cell considering anodic surface diffusion. J. Power Sources 164 (2), 639–648. doi:10.1016/j.jpowsour.2006.10.091
Shi, Y., Luo, Y., Cai, N., Qian, J., Wang, S., Li, W., et al. (2013). Experimental characterization and modeling of the electrochemical reduction of CO2 in solid oxide electrolysis cells. Electrochimica Acta 88, 644–653. doi:10.1016/j.electacta.2012.10.107
Subotić, V., Futamura, S., Harrington, G. F., Matsuda, J., Natsukoshi, K., and Sasaki, K. (2021). Towards understanding of oxygen electrode processes during solid oxide electrolysis operation to improve simultaneous fuel and oxygen generation. J. Power Sources 492, 229600.
Sumi, H., Suda, E., and Mori, M. (2017). Blocking layer for prevention of current leakage for reversible solid oxide fuel cells and electrolysis cells with ceria-based electrolyte. Int. J. Hydrogen Energy 42, 4449–4455. doi:10.1016/j.ijhydene.2016.09.176
Sun, X., Hendriksen, P. V., Mogensen, M. B., and Chen, M. (2019). Degradation in solid oxide electrolysis cells during long term testing. Fuel Cells 19, 740–747. doi:10.1002/fuce.201900081
Sunarso, J., Baumann, S., and Serra, J. M. (2008). Mixed ionic–electronic conducting (MIEC) ceramic-based membranes for oxygen separation. J. Membr. Sci. 320 (1-2), 13–41. doi:10.1016/j.memsci.2008.03.074
Tanaka, S., Nagumo, K., Yamamoto, M., Chiba, H., Yoshida, K., and Okano, R. (2020). Fuel cell system for Honda CLARITY fuel cell. eTransportation 3, 100046. doi:10.1016/j.etran.2020.100046
Tanaka, T., Inui, Y., Pongratz, G., Subotić, V., and Hochenauer, C. (2021). Numerical investigation on the performance and detection of an industrial-sized planar solid oxide fuel cell with fuel gas leakage. Appl. Energy 285, 116426. doi:10.1016/j.apenergy.2020.116426
Temluxame, P., Puengjinda, P., Peng-ont, S., Ngampuengpis, W., Sirimungkalakul, N., Jiwanuruk, T., et al. (2021). Comparison of ceria and zirconia based electrolytes for solid oxide electrolysis cells. Int. J. Hydrogen Energy 46, 24568–24580. doi:10.1016/j.ijhydene.2020.03.121
Todd, B., and Young, J. B. (2002). Thermodynamic and transport properties of gases for use in solid oxide fuel cell modelling. J. Power Sources 110 (1), 186–200. doi:10.1016/s0378-7753(02)00277-x
Uchida, H., Brito, M. E., and Nishino, H. (2021). Depth-direction analysis of nickel depletion in a Ni-gadolinia-doped ceria hydrogen electrode after steam electrolysis operation. J. Ceram. Soc. Jpn. 129 (2), 111–117. doi:10.2109/jcersj2.20189
Virkar, A. V., Chen, J., and Tanner, C. W. (2000). The role of electrode microstructure on activation and concentration polarizations in solid oxide fuel cells. Solid State Ionics 131 (1-2), 189–198. doi:10.1016/s0167-2738(00)00633-0
Virkar, A. V. (1991). Theoretical analysis of solid oxide fuel cells with two‐layer, composite electrolytes: Electrolyte stability. J. Electrochem. Soc. 138 (5), 1481–1487. doi:10.1149/1.2085811
Visvanichkul, R., Puengjinda, P., Jiwanuruk, T., Peng-Ont, S., Sirimungkalakul, N., Ngampuengpis, W., et al. (2021). Fabrication using sequence wet-chemical coating and electrochemical performance of Ni-Fe-foam-supported solid oxide electrolysis cell for hydrogen production from steam. Int. J. Hydrogen Energy 46, 4903–4916. doi:10.1016/j.ijhydene.2020.11.064
Wain-Martin, A., Morán-Ruiz, A., Laguna-Bercero, M. A., Campana, R., Larrañaga, A., Slater, P. R., et al. (2019). SOFC cathodic layers using wet powder spraying technique with self synthesized nanopowders. Int. J. hydrogen energy 44 (14), 7555–7563. doi:10.1016/j.ijhydene.2019.01.220
Wang, R., Dogdibegovic, E., Lau, G. Y., and Tucker, M. C. (2019). Metal‐supported solid oxide electrolysis cell with significantly enhanced catalysis. Energy Technol. 7, 1801154. doi:10.1002/ente.201801154
Wang, Y., Li, W., Ma, L., Li, W., and Liu, X. (2020). Degradation of solid oxide electrolysis cells: Phenomena, mechanisms, and emerging mitigation strategies-A review. J. Mater. Sci. Technol. 55, 35–55. doi:10.1016/j.jmst.2019.07.026
Wu, Z., Zhu, P., Yao, J., Tan, P., Xu, H., Chen, B., et al. (2020). Dynamic modeling and operation strategy of natural gas fueled SOFC-Engine hybrid power system with hydrogen addition by metal hydride for vehicle applications. eTransportation 5, 100074. doi:10.1016/j.etran.2020.100074
Wulf, C., Zapp, P., and Schreiber, A. (2020). Review of power-to-X demonstration projects in Europe. Front. Energy Res. 8, 191. doi:10.3389/fenrg.2020.00191
Xu, Y. (2012). Investigation of single SOEC with BSCF anode and SDC barrier layer. Int. J. Hydrogen Energy 37, 837–842. doi:10.1016/j.ijhydene.2011.04.049
Ye, L., and Xie, K. (2021). High-temperature electrocatalysis and key materials in solid oxide electrolysis cells. J. Energy Chem. 54, 736–745. doi:10.1016/j.jechem.2020.06.050
Zhang, Q., Liu, Q., Park, B., Barnett, S., and Voorhees, P. (2021). The oxygen partial pressure in solid oxide electrolysis cells with multilayer electrolytes. Acta Mater. 213, 116928. doi:10.1016/j.actamat.2021.116928
Zhang, Q., Park, B., Barnett, S., and Voorhees, P. (2020). On the role of the zirconia/ceria interface in the degradation of solid oxide electrolysis cells. Appl. Phys. Lett. 117, 123906. doi:10.1063/5.0016478
Zhang, W., Zheng, Y., Yu, B., Wang, J., and Chen, J. (2017). Electrochemical characterization and mechanism analysis of high temperature Co-electrolysis of CO2 and H2O in a solid oxide electrolysis cell. Int. J. Hydrogen Energy 42 (50), 29911–29920. doi:10.1016/j.ijhydene.2017.06.225
Keywords: solid oxide electrolysis cell, metal-supported, oxygen partial pressure, polarization curve, steam electrolysis, GDC, 10Sc1CeSZ
Citation: Zhang M, Wang E, Mao J, Wang H, Ouyang M and Hu H (2022) Performance analysis of a metal-supported intermediate-temperature solid oxide electrolysis cell. Front. Energy Res. 10:888787. doi: 10.3389/fenrg.2022.888787
Received: 03 March 2022; Accepted: 07 September 2022;
Published: 26 September 2022.
Edited by:
Athanasios I Papadopoulos, Centre for Research and Technology Hellas (CERTH), GreeceReviewed by:
Hao Zhang, The University of Edinburgh, United KingdomNaouma Bimpiri, Aristotle University of Thessaloniki, Greece
Copyright © 2022 Zhang, Wang, Mao, Wang, Ouyang and Hu. This is an open-access article distributed under the terms of the Creative Commons Attribution License (CC BY). The use, distribution or reproduction in other forums is permitted, provided the original author(s) and the copyright owner(s) are credited and that the original publication in this journal is cited, in accordance with accepted academic practice. No use, distribution or reproduction is permitted which does not comply with these terms.
*Correspondence: Enhua Wang, d2FuZ2VuaHVhQGJpdC5lZHUuY24=