 Quanqing Yu
 Jianming Li
 Zeyu Chen
 Michael Pecht3
- 1School of Automotive Engineering, Harbin Institute of Technology, Weihai, China
- 2School of Mechanical Engineering and Automation, Northeastern University, Shenyang, China
- 3Center for Advanced Life Cycle Engineering (CALCE), University of Maryland, College Park, MD, United States
The continuous occurrence of lithium-ion battery system fires in recent years has made battery system fault diagnosis a current research hotspot. For a series connected battery pack, the current of each cell is the same. Although there are differences in parameters such as internal ohmic resistance, the relative change of parameters between cells is small. Therefore, the correlation coefficient of voltage signals between different cells can detect the faulty cell. Inspired by this, this paper proposes an improved Euclidean distance method and a cosine similarity method for online diagnosis of multi-fault in series connected battery packs, and compares them with the correlation coefficient method. The voltage sensor positions are arranged according to the interleaved voltage measurement design. The multi-fault involved in this study, including connection faults, sensor faults, internal short-circuit faults and external short-circuit faults, will lead to abnormal sensor readings at different positions, which in turn will cause changes in correlation coefficient, Euclidean distance and cosine similarity to achieve fault detection. Fault experiments were conducted to verify the feasibility of the three methods in a series connected battery pack.
1 Introduction
As the global energy problem continues to deepen, the development of new energy vehicles has become both an international consensus and a Chinese strategy (Zhu et al., 2020). To promote the popularity of new energy vehicles, in recent years the Chinese government has formulated many relevant policies to support the rapid development of the new energy industry. Electric vehicles, as one of the main types of new energy vehicles, have been widely consumed because of their high energy utilization efficiency and minimal environmental pollution (Xiong et al., 2020; Franzò and Nasca, 2021). The battery system, a key part of electric vehicles, largely determines the drivability and the driving range on a single charge. Despite continuous advancements in battery manufacturing and packaging technology, battery cells and related accessories can still incur faults due to the aging process or abusive practices during operation (Wang et al., 2019). A high-quality battery management system (BMS) is critical to the life and safety of the battery system.
The functions of the BMS include precise estimation (Tian et al., 2019; Li et al., 2021; Zhou et al., 2021), charge and discharge control (Hossain Lipu et al., 2021), thermal management (Yang et al., 2022), battery safety protection, and fault diagnosis (Chen et al., 2021; Wang et al., 2021; Yu et al., 2021). To date, a significant amount of research has been done on battery system fault diagnosis and most methods can only diagnose simple and single faults. In fact, battery system faults include sensor faults, connection faults, faults of a single cell, and so on. (Kang et al., 2021).
Sensor faults are divided into three main categories: current sensor faults, voltage sensor faults, and temperature sensor faults (Tran and Fowler, 2019; Lee and Akatsu, 2021; Yu et al., 2022). Current sensor faults affect the accuracy of state of charge (SOC) estimation (Hu et al., 2020), and voltage sensor faults not only lead to a decrease in the accuracy of SOC estimation, but also lead to overcharge and over-discharge of the battery, resulting in serious safety hazards (Liu and He, 2017). Temperature sensor faults affect the time of early warning of battery thermal runaway (Tian et al., 2020). In view of the fact that the number of current sensors and temperature sensors in the actual battery system is very small, and a large number of voltage sensors are used to monitor the abnormal status of the battery system, the fault diagnosis of the voltage sensor is the top priority (Xiong et al., 2019). A connection fault is usually referred to as “large cell resistance” or “poor contact between adjacent cells” (Kang et al., 2020). A small increase in resistance between adjacent cells can lead to localized heating, which in turn can cause a series of safety problems in the battery system. To diagnose these faults, Ma et al. (2018) introduced a connection fault detection method for series-connected lithium-ion power cells. A cross-voltage test was used to distinguish between increased contact resistance and increased internal resistance faults. The faults of a single cell include overcharge (Hendricks et al., 2020; Diao et al., 2021), over-discharge, micro-short-circuit (Gao et al., 2019; Zhang et al., 2019), internal short-circuit (ISC) fault (Wang et al., 2016; Abaza et al., 2018), external short-circuit (ESC) fault (Kriston et al., 2017; Yang et al., 2018). Overcharge will lead to internal electrochemical reactions, loss of active material, and temperature increase, which might cause an explosion in the battery pack. Although over-discharge does not directly lead to thermal runaway, it can cause capacity loss and thermal stability changes and move the battery tolerance toward abuse conditions (Hong et al., 2017; Feng et al., 2018; Ren et al., 2019). In fact, when there is no voltage sensor fault, overcharge and over-discharge faults can be completely detected by the battery voltage sensor. Micro-short-circuit faults usually refer to ISC and ESC faults when the degree of fault is relatively minor (Pan et al., 2020). Therefore, the research on the faults of the battery cell mainly focuses on the ISC and ESC faults with a lesser degree of failure (Chen et al., 2018).
According to different principles, fault diagnosis methods are mainly divided into three categories: analytical model-based methods (Chen et al., 2016), data-driven methods (Yang et al., 2020), and signal statistics-based methods (Xia et al., 2017). The first two methods either rely on accurate models or on huge offline data and have poor generalization ability. The signal statistics-based methods mainly deal with the information between different cells, which are simple in calculation and sensitive to faults, and widely used in fault diagnosis of battery systems. For a series battery pack, the parameter difference between batteries is small. Therefore, the correlation coefficient between different battery voltage signals is also a relatively constant value in the absence of faults. When a fault occurs, the correlation coefficient between voltages changes significantly, which can be detect faults accordingly (Xia and Mi, 2016). However, most of studies use the correlation coefficient to detect voltage anomalies under ISC and ESC faults, and the applicability of this method under different fault degrees of various faults is not clear. Whether other methods in statistical theory are better than the correlation coefficient method in solving the multi-fault diagnosis of battery systems has not been explored.
In response to the issues raised above, this paper proposes an improved Euclidean distance method and a cosine similarity method for online diagnosis of multi-fault in series connected battery packs, and compares them with the correlation coefficient method. Experiments were conducted to simulate different degrees of the same type of fault to study its diagnostic performance. The main contributions of this paper can be summarized in the following three points. 1) When the Euclidean distance is used to determine the inconsistency of battery cells, calculations are required between any 2 cells. Therefore, the method is computationally complex and cannot be used to distinguish between types of faults. To solve this problem, this paper proposes a method of Euclidean distance similarity, calculating the similarity between the voltage values measured by adjacent numbered sensors, and introducing recursive moving windows and discrete square waves signals for improvement. The improved Euclidean distance similarity method can effectively detect and isolate four different types of faults. 2) From the perspective of relevance and similarity, three methods with the same diagnostic strategy are compared. This paper suggests a more effective practical application process for the BMS in order to select the appropriate diagnostic scheme. 3) Different types of faults are simulated through fault experiments, and then different degrees of the same faults are simulated by changing the magnitude of the resistance. Finally, this paper analyzes the diagnostic sensitivity of different faults and the effect of different resistance values on the same fault diagnosis, which provides a reference for battery system fault diagnosis.
The remainder of this paper is organized as follows. Section 2 presents the interleaved voltage measurement design and provides the identification and localization schemes for different faults. Section 3 introduces three different methods for detecting faults, namely the improved Euclidean distance similarity method, the correlation coefficient method, and the cosine similarity method. Section 4 introduces the experimental equipment and presents the experimental schematics. Section 5 provides the diagnostic results and compares the diagnostic performance of the three different methods. Section 6 summarizes this study’s findings.
2 Interleaved Voltage Measurement Design
In battery systems, there are many types of connection ways, and this study employs the interleaved voltage measurement design shown in Figure 1 to examine the series circuit (Kang et al., 2019). Vn represents the measurement value of voltage sensor n, and Rn-1,n represents the resistance between cell n-1 and cell n. Each measurement wire of the sensor is directly connected to the electrode of the cell so there is little contact resistance between the measurement wires and the corresponding electrode. The voltage of each cell is associated with two sensors; similarly, each resistance is associated with two sensors. A sensor fault affects only its own measurement value and not that of the other adjacent sensors.
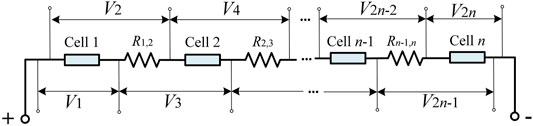
FIGURE 1. Interleaved voltage measurement design.
The design enables fault identification and localization by the serial number of the voltage sensor that appears abnormal. When cell n-1 is in a short circuit fault, the measured voltage V2n-3 and V2n-2 show abnormal changes at the same time. By observing the fault characteristics indicated by the two voltage sensors, the smaller serial number of sensors showing the abnormal changes is the odd number. Similarly, when the contact resistance Rn-1,n is in a fault condition (i.e., a connection fault between cell n-1 and cell n), the measured voltage V2n-2 and V2n-1 show abnormal changes at the same time. The fault characteristics are indicated by the two voltage sensors, with the smaller serial number of sensors showing the abnormal change being the even number. When the voltage sensor n is in a fault condition, the measured voltage Vn varies abnormally, while the rest of the measured voltage is normal. Conversely, the type and location of the fault can be inferred from the serial number of the abnormal voltage sensor to realize the identification and positioning function.
3 Fault Diagnostic Methods
From the previous analysis, it is clear that fault diagnosis requires the identification of the difference between abnormal and normal voltages. This difference can be expressed by correlation or similarity. The correlation coefficient can reflect the degree of linear correlation between two or more groups of variables. In addition to the correlation coefficient, there are statistical indicators such as distance, angle, etc. that can also reflect the similarity between different vectors. Therefore, in addition to a brief introduction to the correlation coefficient method, this section will also introduce the principles of fault diagnosis by the improved Euclidean distance similarity method and the cosine similarity method.
3.1 Correlation Coefficient Method
For different research objects, the correlation coefficient has different definitions, which was first proposed by statistician Karl Pearson and named the Pearson correlation coefficient. Kang et al. (2019) adopt it to detect the battery system fault. The expression of correlation coefficient is shown in Eq. (1).
where xi denotes the value of vector x at moment i, yi denotes the value of vector y at moment i, a denotes the recursive moving windows, and ci denotes the discrete square waves signals.
3.2 Improved Euclidean Distance Similarity
3.2.1 Euclidean Distance Similarity
The Euclidean distance between voltage curves can be used to quantitatively analyze the degree of inconsistency of different cells. In a series connected battery pack, all cells share the same current. If there is no fault, the voltages measured by different sensors have the same variation trend. When there is a fault, there must be an abnormal change in one or more voltages, resulting in inconsistent distances between voltage curves. However, one distance corresponds to two voltages, and it is impossible to determine directly which voltage is abnormal. For example, when V1 is normal and V2 is abnormal, the Euclidean distance between V1 and V2 changes. However, it is not possible to determine which one is abnormal based on only one calculation. Multiple Euclidean distances need to be calculated to determine the abnormal voltage. Therefore, the method using Euclidean distance is complex and has some limitations. Combined with the interleaved voltage measurement design, this paper proposes the Euclidean distance similarity (EDS) to reflect the similarity of all adjacent voltages. The expression of EDS is shown in Eq. (2).
where xi denotes the voltage value measured by sensor x at the moment i, and yi denotes the voltage value measured by sensor y at the same time. When the changes of x and y are always the same, the EDS (x, y) should be a constant value less than 1. When the changes of x and y are not the same, the EDS (x, y) changes. So the fault can be judged by observing whether the EDS (x, y) has changed.
For example, in the interleaved voltage measurement design, when cell n-1 is in a short circuit fault. Before the fault occurs, all voltages keep a similar trend and all EDS is closed to a constant value or slow change. When a fault occurs, V2n-3 and V2n-2 change differently from other voltages at that moment. Therefore, the values of EDS(V2n-4, V2n-3) and EDS(V2n-2, V2n-1) change more obviously at the moment of the fault. While EDS(V2n-3, V2n-2) and the rest of the EDS are still closed to the previous constant value or slow change. Based on the obvious changes of EDS(V2n-4, V2n-3) and EDS(V2n-2, V2n-1) at a certain moment, it can be determined that a short-circuit fault in cell n-1 has occurred. Similarly, when EDS(V2n-3, V2n-2) and EDS(V2n-1, V2n) have more obvious changes at a certain moment, it can be determined that a connection fault between cell n-1 and cell n has occurred. When EDS(Vn-1, Vn) and EDS(Vn, Vn+1) have obvious changes at a certain moment, it can be determined that voltage sensor n is in a fault condition.
3.2.2 Improved Euclidean Distance Similarity
Euclidean distance similarity can identify whether a battery has occurred faults; however, it still has some shortcomings. According to the expression of EDS, it can be seen that EDS (x, y) varies with |xi - yi|. When there is no fault, any two voltages x and y maintain a similar trend, and EDS (x, y) has almost no significant change. When a fault occurs, some of the voltage values will be abnormal and some will remain normal. For example, the voltage measurement xi appears abnormal, while the voltage measurement yi remains normal. So |xi - yi| occurs an obvious change, resulting in a random change in EDS (x, y). Since the changing pattern of EDS (x, y) is uncertain, it is impossible to set the threshold for fault detection, and the diagnostic strategy is not easy to make. So it needs improvement for the EDS. The improved Euclidean distance similarity (IEDS) is shown in Eq. (3).
where
3.2.3 Recursive Moving Windows
The amount of voltage data is often quite large because the battery pack may consist of hundreds or thousands of cells. In the calculation process, either the amount of data in the sample is too large or too small, both have a negative impact on fault detection. When the amount of data in the sample is too large, the sensitivity of fault detection decreases. Conversely, when the amount of data in the sample is too small, the measurement error will significantly affect the results. A desirable solution is to introduce a recursive moving window a for data processing. That is, set a suitable time interval and create a new calculation sample based on the data within each time interval and calculate only the IEDS of the data within the time interval. Assuming the recursive moving window is a, Eq. (3) can be improved to Eq. (4).
To decide the optimal moving window length, a large number of a were selected for the tests. If the moving window length is small, the diagnosis result is seriously affected by the measurement error. That is, a very small number of data errors can have a serious impact on the experimental results. If the window length is large, the sensitivity of the diagnosis method is low and the diagnosis is easily missed. According to the test results, when the window length is 30, it is less affected by the measurement error and the sensitivity is better. Finally, for the purposes of this study, the moving window length is 30.
3.2.4 Discrete Square Waves Signals
The cells on the same circuit share the same current input. When there is no fault, the IEDS of the adjacent voltage is very close to 1. However, in practice, there may have measurement errors in voltage values. When the battery pack is in dynamic working condition (i.e., there is a significant change in input or output), the voltage change trend plays a dominant role in the similarity calculation because there is a significant change in it, and the measurement error at this time is negligible. However, when the battery pack is in non-dynamic condition (i.e., the working condition of charging or discharging with constant current), the actual cell voltage tends to be a stable value or changes insignificantly. At this point, the measurement error plays a dominant role in the similarity calculation, and a small measurement error can make a large impact on the result. To solve this problem, the discrete square waves signal ci can be added to the voltage, and the square wave ci acts as a correction function for the voltage. When the battery current is constant, the voltage becomes a quasi-square wave curve rather than a stable number, resulting in a more pronounced trend in voltage. The square wave ci is shown in Eq. (5).
where c0 represents the amplitude of the discrete square wave signal and T0 represents the period of the discrete square wave signal. The purpose of adding ck is to better detect the difference between different voltages. If c0 is too large, the difference between different voltages will become insignificant, which leads to an insensitive diagnosis. If c0 is too small, it has almost no effect on the original voltage. When c0 is below 0.01, it has almost no effect on the original voltage, and c0 above 0.1 makes the difference in the original voltage insignificant. Therefore, c0 should be chosen between 0.01 and 0.1. T0 must be an integer multiple of a. After several sets of data tests, c0 is finally determined as 0.05, and T0 is determined as 60.
Thus, Eq. (4) can be improved to Eq. (6).
3.3 Cosine Similarity Method
The cosine similarity method is used to evaluate the similarity of two vectors by calculating the cosine of their angle. After introducing the same recursive moving window a and discrete square waves signal ci as the previous method. The cosine similarity between the two vectors X, Y is calculated as in Eq. (7).
The variation range of
Compared to the previous two methods, the value of cosine similarity RCS varies widely under different operating conditions and is more differentiated in isolating faults. When there is no fault, RCS is close to 0°. When a fault occurs, RCS rises significantly.
3.4 Fault Detection and Isolation
Different types of faults can be detected, located, and identified by combining the interleaved voltage measurement design with any one of the three methods in this section. The three methods are similar for fault detection and isolation. The value of R can be calculated for all adjacent voltages. The calculation formulas are different depending on the method used. In the correlation coefficient method, R is Rcc in Eq. (1). In the improved Euclidean distance similarity method, R is RIEDS in Eq. (6). In the cosine similarity method, R is RCS in Eq. (8).
The R values are divided into two groups. The sensor serial number in Rgroup1 starts with an odd number and is shown in Eq. (9). The sensor serial number in Rgroup2 starts with an even number and is shown in Eq. (10).
Take the improved Euclidean distance similarity method as an example to illustrate the fault detection strategy. When there is no fault, all RIEDS in Rgroup1 and Rgroup2 are within the threshold, which is extremely close to 1. When the RIEDS(V2n-3, V2n-2) and RIEDS(V2n-1, V2n) in Rgroup1 drop below the threshold, and the rest of the RIEDS are still close to 1. It can determine that there is a connection fault between cell n-1 and cell n. When RIEDS(V2n-4, V2n-3) and RIEDS(V2n-2, V2n-1) in Rgroup2 drop below the threshold, and the rest of the RIEDS are still close to 1. It can infer that cell n-1 is in a short circuit fault. When the RIEDS(Vn-1, Vn) and RIEDS(Vn, Vn+1) from Rgroup1 and Rgroup2, respectively, drop below the threshold, while the rest of the RIEDS is still close to 1. It can judge that sensor n is in a fault condition. The flow chart is shown in Figure 2.
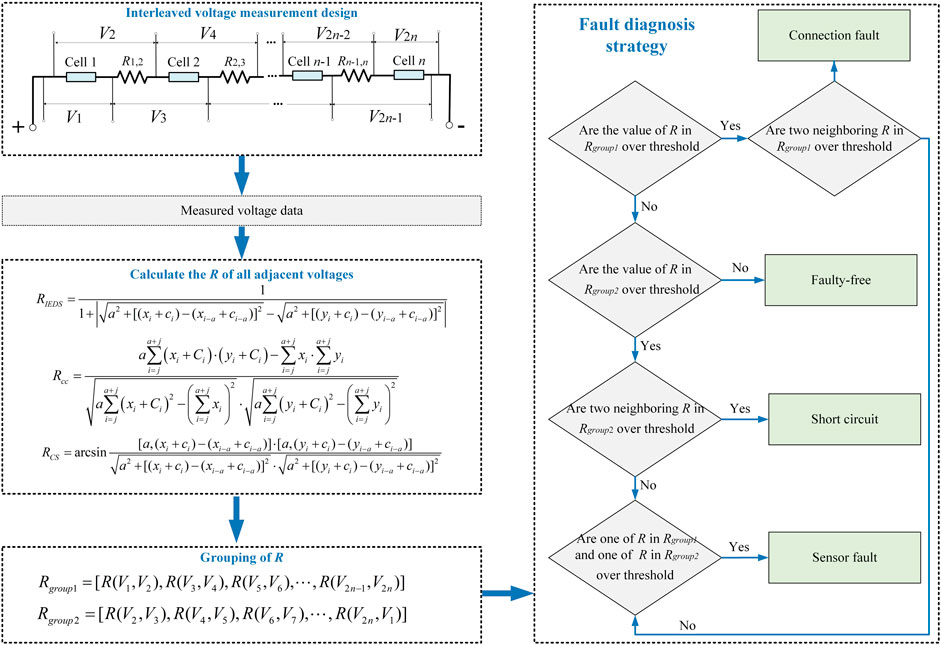
FIGURE 2. Flow chart of fault diagnosis.
When the correlation coefficient method is used, the flow chart is almost identical to the improved Euclidean distance similarity method. The difference between the two methods is that the formula for calculating R is different, and the threshold values are different. When using the cosine similarity method, the smaller angle between the two vectors, the better consistency of the voltage curves. So the diagnostic strategy of the cosine similarity method is opposite to the improved Euclidean distance similarity method. When there is no fault, the RCS of adjacent voltage is close to 0°. When the contact resistance Rn-1,n is in a fault condition, the two adjacent RCS in Rgroup1 raise above the threshold, and the rest of the RCS are still close to 0°. When cell n-1 is in a short circuit fault, the two adjacent RCS in Rgroup2 raise above the threshold, and the rest of the RCS is still close to 0°. When sensor n is in a fault, the RCS(Vn-1, Vn) and RCS(Vn, Vn+1) from Rgroup1 and Rgroup2, respectively, raise obviously. While the rest of the RCS is still close to 0°.
For three different methods, when cell n-1 is in a short circuit fault, either an ISC or ESC, the R(V2n-4, V2n-3) and R(V2n-2, V2n-1) in Rgroup2 change significantly. Since the magnitude of change is different, different thresholds are set for isolating ISC and ESC. Similarly, when a fault occurs in sensor n, either voltage freeze or random fluctuation, the R(Vn-1, Vn) and R(Vn, Vn+1) change obviously. Since the magnitude of the change is different, different thresholds are set for sensor fault isolation.
4 Experimental Equipment and Circuit
The fault voltage discussed in this paper are all within the normal operating range of the battery, which is usually ignored in practice. The experimental field device is shown in Figure 3. The experimental device was divided into three parts: 1) Main control part. 2) Arbin battery charge and discharge tester. 3) Load connection system. The main control part consists of power source, D2P controller, electronic load, mainframe monitor, and data acquisition system. Its function is to provide power source for the whole experiment, control the experiment, collect and record data. The Arbin battery charge and discharge tester is to control charge or discharge. Load connection system consists of three LR1865SZ cells with a rated capacity of 2.5 Ah connected in series, and the constant current state of the circuit is maintained by an electronic load. All cells were charged at 0.5C constant current to 50% SOC and rested for 1 hour before the fault experiment. The voltage measurement accuracy is 0.1%, the maximum range of each voltage sensor is 5 V, and the sampling frequency is set to 10 Hz.
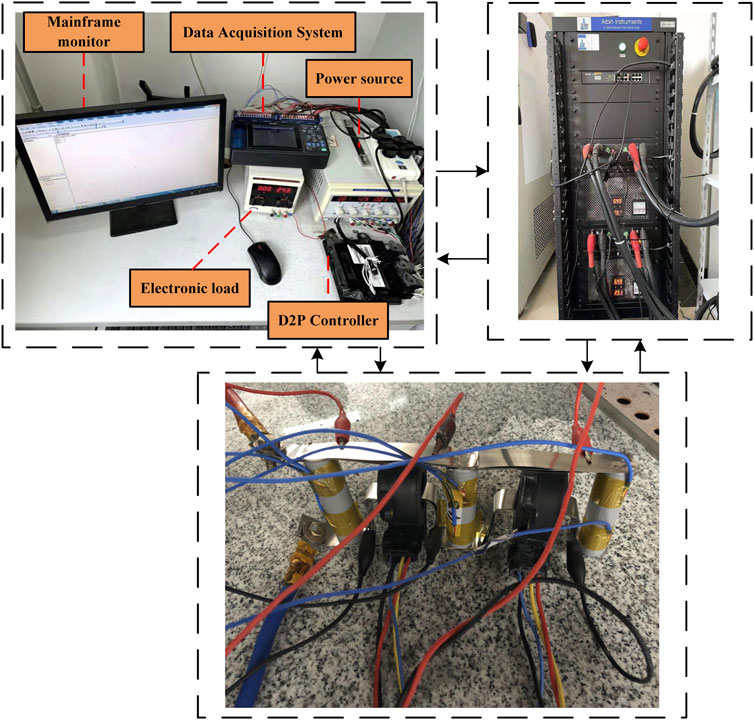
FIGURE 3. Experimental equipment diagram. (a) Main control part. (b) Arbin battery charge and discharge tester. (c) Load connection system.
The fault experimental schematics is shown in Figure 4.
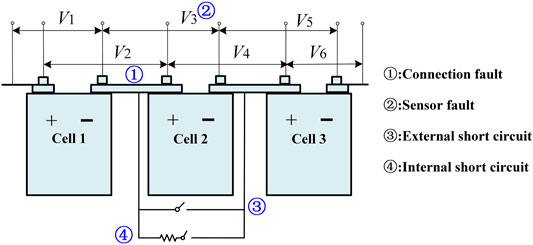
FIGURE 4. Schematics of multi-fault occurs in the series connected battery pack.
Different degrees of connection failure were simulated by connecting resistors of 200 and 400 mΩ in series between cell 1 and cell 2, respectively. For sensor faults, during 100 s–500 s of the discharge process of cell 2, the sensor reading of V3 remains unchanged to simulate the voltage sensor freezing fault, the sensor reading returns to normal at 500 s–700 s, and then a white noise with an amplitude of 0.1 V is injected from 700 s to 1,370 s to simulate random fluctuation fault. Different degrees of ESC faults are simulated by connecting a 0 mΩ and 50 mΩ resistor in parallel to cell 2, respectively. The ISC fault is simulated by connecting a larger resistance resistor in parallel to simulate the early stage of the ISC of the cell, and the resistance is set to 10 Ω and 20 Ω (Ouyang et al., 2015). The details of the fault are shown in Table 1.
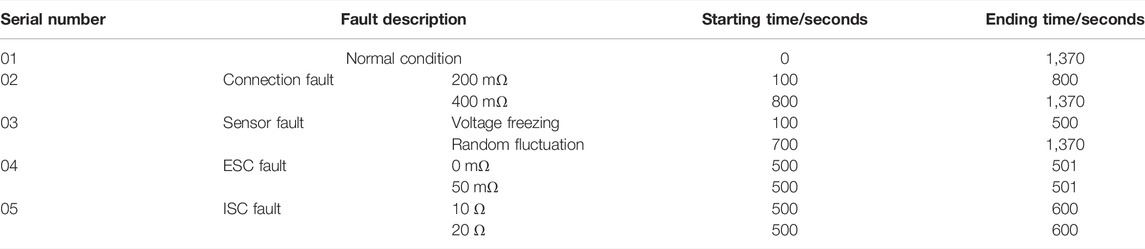
TABLE 1. Details of the equivalent fault experiment.
5 Results and Discussions
5.1 Comparison of EDS and IEDS
Figure 5 shows the evaluation results of EDS and IEDS under the normal condition. Figure 5A shows the voltage curves, which are almost parallel to each other in the absence of fault. Figure 5B shows the EDS between the adjacent voltages. The EDS between adjacent voltages is a series of different constant values. Figure 5C shows the IEDS between the adjacent voltages. The IEDS between adjacent voltages is always close to 1 without significant fluctuations.
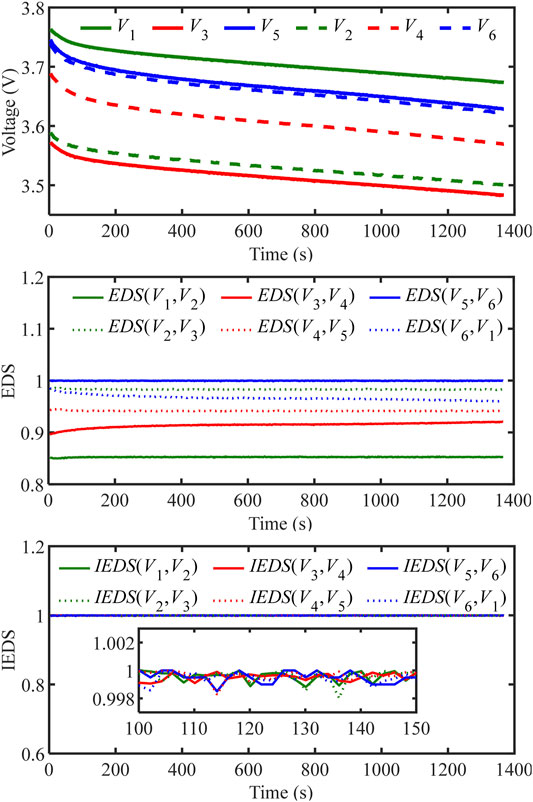
FIGURE 5. Evaluation results of EDS and IEDS under the normal condition.
Figure 6 shows the evaluation results of EDS and IEDS under ISC fault condition. Figure 6A shows the voltage curve. During 500–600 s, a resistor of 10 Ω is connected in parallel to cell 2 to simulate an ISC fault. The fault causes a drop in voltage V3 (red solid line) and V4 (red dashed line) from 500 s to 600 s. Figure 6B shows the EDS between adjacent voltages. The EDS(V2, V3) and EDS(V4, V5) show less significant changes at 500 s and 600 s. The EDS(V3, V4) remains almost constant since V3 and V4 have the same tendency to change, and the remaining EDS keeps a constant value or slow change. Figure 6C shows the IEDS between adjacent voltages. The IEDS(V2, V3) and IEDS(V4, V5) drop significantly at 500 s and 600 s. The IEDS(V3, V4) remains close to 1 since V3 and V4 have the same tendency to change, and the remaining IEDS is always close to 1 without significant fluctuations.
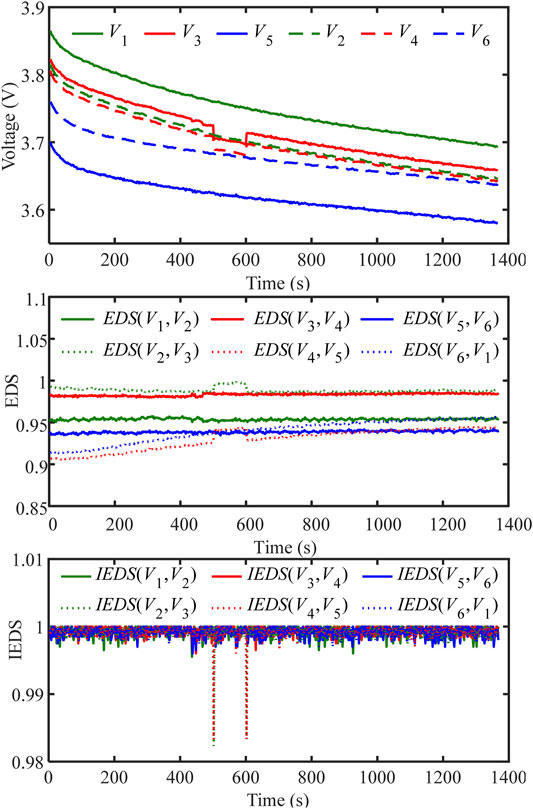
FIGURE 6. Evaluation results of EDS and IEDS under ISC fault.
From the diagnosis results of the normal situation and fault situation, it is evident that the Euclidean distance similarity before and after the improvement can both identify faults. For the EDS, all EDS keep a constant value or slow change when there is no fault. When a fault occurs, there exists EDS with a variation. This variation is mainly reflected in the different shapes of the curve changes, the number size degree of variation of EDS is less significant. So it is not easy to detect fault using EDS. For the IEDS, all IEDS are very close to 1 when there is no fault. When a fault occurs, there exists IEDS with a significant decrease. It is easy to detect fault by setting a certain threshold. In addition, for ISC/ESC with similar characteristics, it is obvious that EDS cannot isolate them. According to the degree of dropping, the IEDS can isolate ISC/ESC by two different thresholds. Figure 6C shows that the IEDS is able to achieve fault diagnosis, but it is prone to misdiagnosis due to too much data. This paper ultimately adopts RIEDS that introduces recursive moving windows and discrete square waves signals.
5.2 Normal Condition
Figure 7 shows the evaluation results in the normal condition. The voltage curves are shown in Figure 7A, and the trend of the voltage curves is always the same because there is no fault. Figure 7B shows the evaluation results of the RIEDS, and the values of RIEDS are all above 0.997, which is very close to 1. Figure 7C shows the evaluation results of the correlation coefficient method, and the values of the correlation coefficients are all above 0.999 extremely close to 1. Figure 7D shows the evaluation results of the cosine similarity method, and the cosine similarity is all within 0.4°, extremely close to 0°. By setting the threshold when a fault occurs subsequently, it is evident that the thresholds of the three methods in diagnosing the fault are highly distinguishable from the values in the normal state.
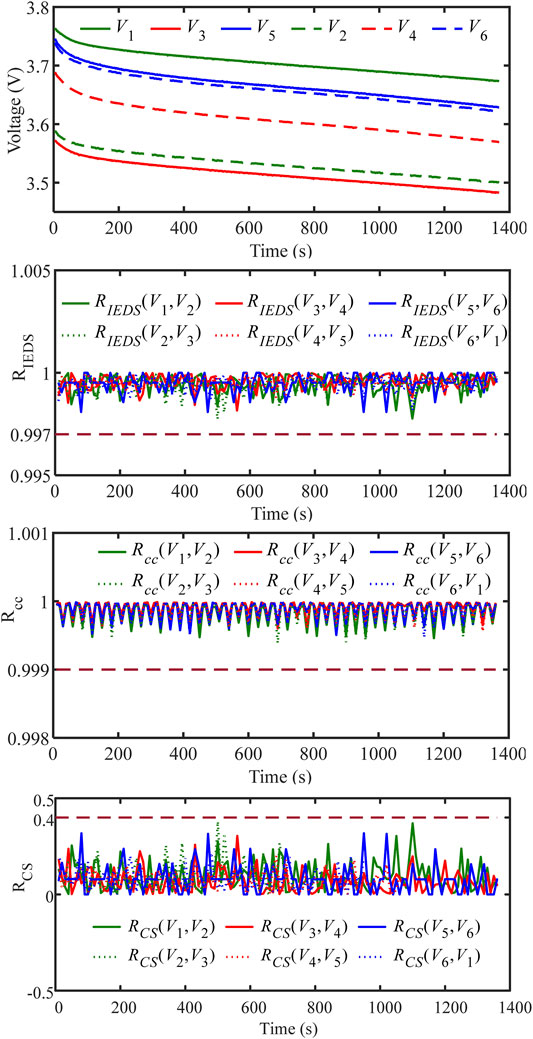
FIGURE 7. Normal condition evaluation results. (a) Voltage curve. Diagnosis by (b) RIEDS, (c) Rcc, (d) RCS.
5.3 Fault Conditions
5.3.1 Connection Fault
Figure 8 provides the evaluation results of the connection fault (i.e., the 02 case in Table 1). The voltage curves are shown in Figure 8A, where V2 (green dashed line) and V3 (red solid line) have a brief dropping tendency at both 100 s and 800 s because resistors are connected in series between cell 1 and cell 2 to simulate a connection fault. Figure 8B shows the evaluation results of the RIEDS, where most of the curves in the figure overlap and the RIEDS is extremely close to 1. However, the RIEDS(V1, V2) and RIEDS(V3, V4) of Rgroup1 drop below 0.92 at both 100 s and 800 s. Therefore, a connection fault can be identified by detecting that the two adjacent RIEDS in Rgroup1 drop below the threshold. Figure 8C shows the evaluation results of the Rcc, where most of the curves in the figure overlap and the Rcc is highly close to 1. However, the Rcc (V1, V2) and Rcc (V3, V4) of Rgroup1 drop below 0.95 at both 100 s and 800 s. Therefore, a connection fault can be identified by detecting that the two adjacent Rcc in Rgroup1 drop below the threshold. Figure 8D shows the evaluation results of the RCS, where most of the curves in the figure overlap and the RCS is very close to 0°. However, the RCS(V1, V2) and RCS(V3, V4) of Rgroup1 rise above 10° at both 100 s and 800 s. Therefore, a connection fault can be identified by detecting that the two adjacent RCS in Rgroup1 rise above the threshold.
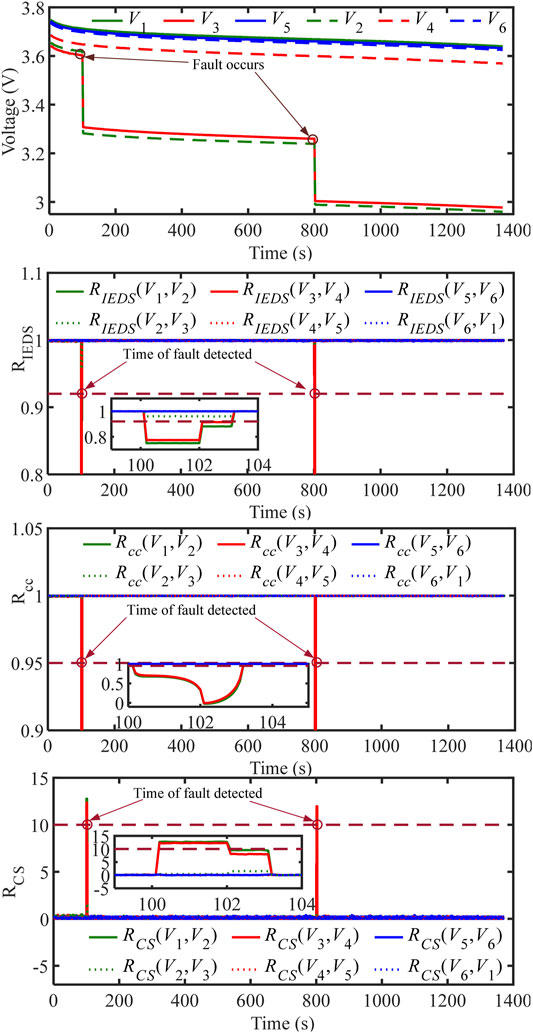
FIGURE 8. Connection fault evaluation results. (a) Voltage curve. Diagnosis by (b) RIEDS, (c) Rcc, (d) RCS.
5.3.2 Sensor Fault
Figure 9 provides the evaluation results of the sensor fault (i.e., the 03 case in Table 1). Figure 9A shows the voltage curves. In the case of constant discharge, it can be seen from Figure 9A that all voltages change slowly. V3 is frozen from 100 to 500s, and V3 remains the reading of 100s during this period. The other voltages differ little from the reading of V3, and all methods cannot detect this difference at 100s. If the current is non-constant and the reading of V3 is kept constant, the difference is easily detected because other voltages fluctuate wildly. The voltage stops freezing at 500s, and V3 returns to normal reading. At this moment, V3 changes from the reading of 100s to the reading of 500s, and the reading of V3 varies widely. Therefore, for the current is constant, the diagnosis of voltage freezing faults is achieved by detecting V3 from freezing to normal. Figure 9B shows the evaluation results of the RIEDS, most curves in the figure overlap and the RIEDS is close to 1. However, RIEDS(V2, V3) in Rgroup2 and RIEDS(V3, V4) in Rgroup1 clearly drop below the thresholds of 0.98 and 0.96 at 500 s and 700 s, respectively, by which the two different thresholds voltage freeze faults and random fluctuation faults are isolated. Therefore, a sensor fault can be detected when Rgroup1 and Rgroup2 both have RIEDS that drops below the threshold. The same sensor serial number in RIEDS is the sensor serial number with the fault. Figure 9C shows the evaluation results of the Rcc, where most of the curves in the figure overlap and the Rcc is extremely close to 1. However, Rcc (V2, V3) in Rgroup2 and Rcc (V3, V4) in Rgroup1 clearly drop below the thresholds of 0.85 and 0.8 at 500 s and 700 s, respectively. Voltage freeze and random fluctuation are isolated by this two different thresholds. Therefore, a sensor fault can be detected when Rgroup1 and Rgroup2 both have Rcc that drops below the threshold. The same sensor serial number is which sensor has a fault. Figure 9D shows the evaluation results of the RCS, where most of the curves in the figure overlap and the RCS is extremely close to 0°. However, the RCS(V2, V3) in Rgroup2 and the RCS(V3, V4) in Rgroup1 clearly rise above the thresholds of 4° and 10° at 500 s and 700 s, respectively. So this two different thresholds are selected for isolating voltage freeze and random fluctuation. Thus, a sensor fault is proved when both Rgroup1 and Rgroup2 have RCS that rises above the threshold. The same sensor serial number is the sensor serial number with the fault.
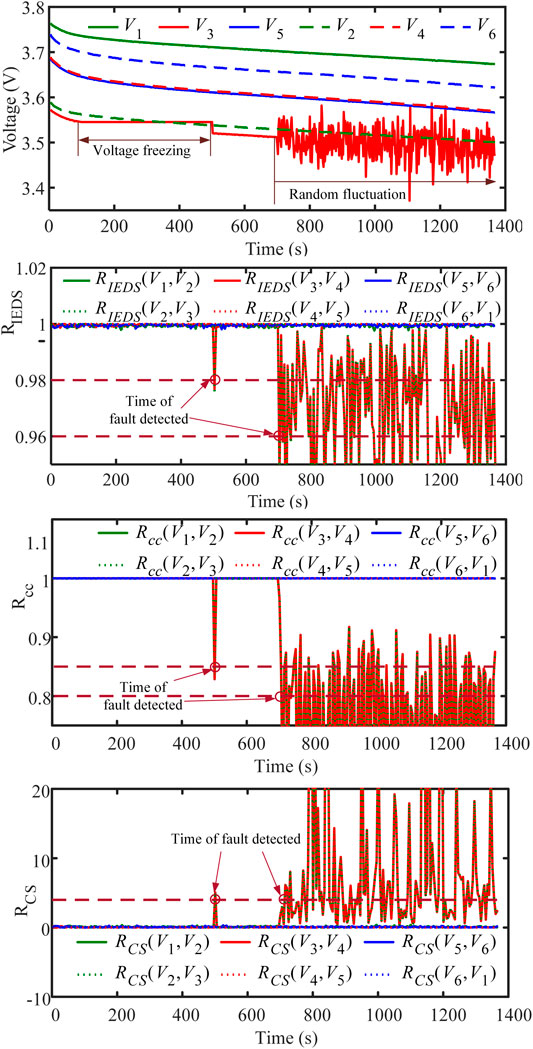
FIGURE 9. Voltage sensor fault evaluation results. (a) Voltage curve. Diagnosis by (b) RIEDS, (c) Rcc, (d) RCS.
5.3.3 External Short Circuit Fault
Figure 10 provides the evaluation results of the ESC fault (i.e., the 04 case in Table 1). The voltage curves are shown in Figure 10A, where a very small resistance (0 mΩ) is connected in parallel to cell 2 to simulate an ESC fault at 500 s. V3 (red solid line) and V4 (red dashed line) have a significantly decreasing trend at 500 s. Figure 10B shows the evaluation results of RIEDS, where most of the curves in the figure overlap and the RIEDS is extremely close to 1. However, RIEDS(V2, V3) and RIEDS(V4, V5) of Rgroup2 drop below 0.6 at 500 s. Therefore, an ESC fault can be identified by detecting that values of the two adjacent RIEDS in Rgroup2 drop the threshold. Figure 10C shows the evaluation results of the Rcc, where most of the curves in the figure overlap and the Rcc is strongly close to 1. However, the Rcc (V2, V3) and Rcc (V4, V5) in Rgroup2 drop below 0.8 at 500 s. Therefore, an ESC fault can be identified when two adjacent Rcc in Rgroup2 drop below the threshold. Figure 10D shows the evaluation results of the RCS, where most of the curves in the figure overlap and the RCS is close to 0°. However, RCS(V2, V3) and RCS(V4, V5) in Rgroup2 rise above 15° at 500 s. Therefore, by detecting that two adjacent RCS in Rgroup2 rise above the threshold, ESC fault can be identified.
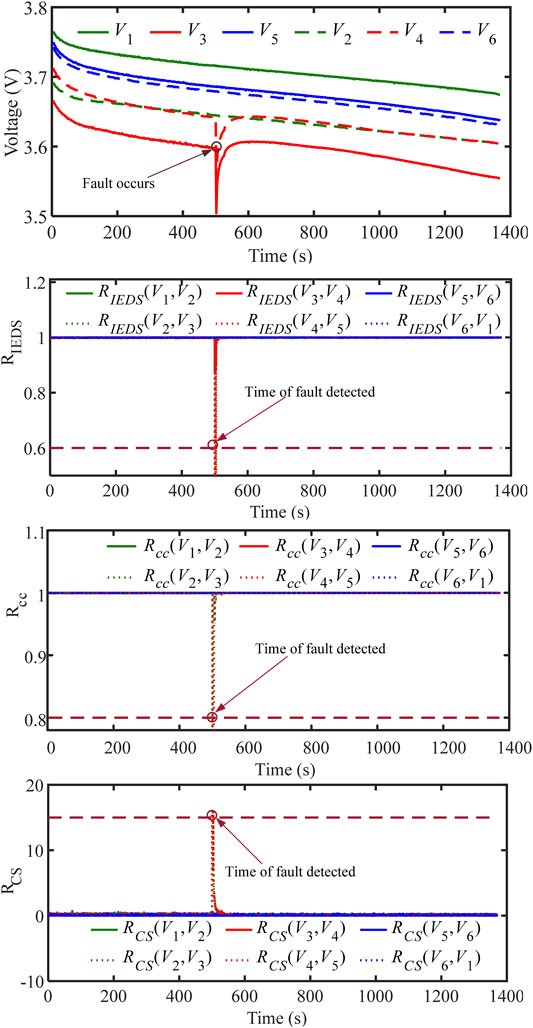
FIGURE 10. ESC fault evaluation results. (a) Voltage curve. Diagnosis by (b) RIEDS, (c) Rcc, (d) RCS.
5.3.4 Internal Short Circuit Fault
Figure 11 provides the evaluation results of the ISC fault (i.e., the 05 case in Table 1). Figure 11A shows the voltage curves, where an extremely large resistor (20 Ω) is connected in parallel to cell 2 to simulate an ISC fault at 500 s. V3 (red solid line) and V4 (red dashed line) have a significantly decreasing trend at 500 s. Figure 11B shows the evaluation results of the RIEDS, where most of the curves in the figure overlap and the RIEDS is extremely close to 1. However, RIEDS(V2, V3) and RIEDS(V4, V5) in Rgroup2 drop below 0.994 but above 0.6 at 500 s. Therefore, the ISC fault can be detected and isolated by judging that the two RIEDS in Rgroup2 are below the ISC threshold of 0.994 but above the ESC threshold of 0.6. Figure 11C shows the evaluation results of the Rcc, where most of the curves in the figure overlap and the Rcc is greatly close to 1. However, the Rcc (V2, V3) and Rcc (V4, V5) in Rgroup2 drop below 0.99 but above 0.8 at 500 s. Thus, the ISC fault can be detected and isolated by judging that the two adjacent Rcc in Rgroup2 are below the ISC threshold of 0.99 but above the ESC threshold of 0.8. Figure 11D shows the evaluation results of the RCS, where most of the curves in the figure overlap and the RCS is strongly close to 0°. However, RCS(V2, V3) and RCS(V4, V5) in Rgroup2 are both above 1° but below 15° at 500 s. Therefore, the ISC fault can be detected and isolated by judging that the two adjacent RCS in Rgroup2 are above the ISC threshold of 1° but below the ESC threshold of 15°.
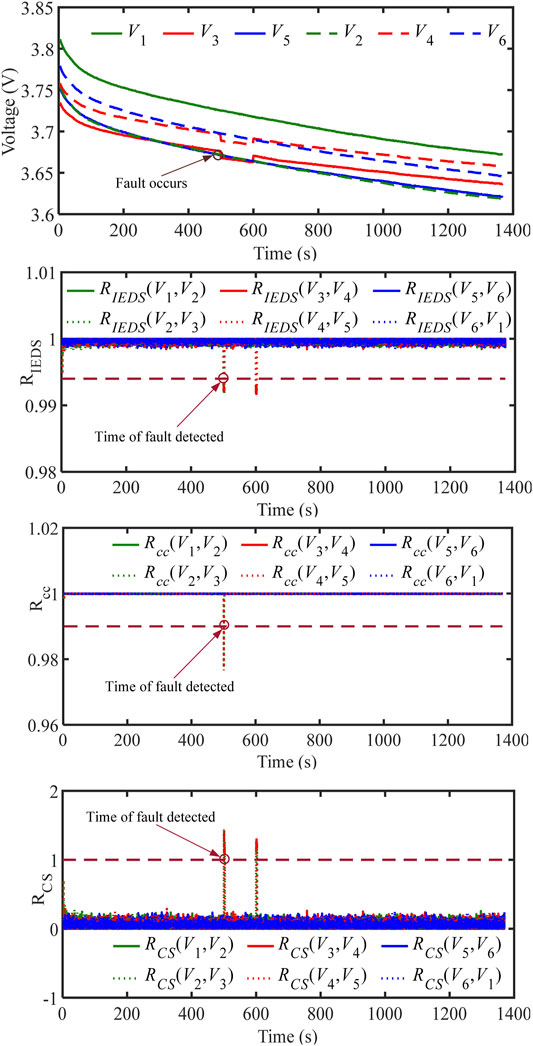
FIGURE 11. ISC fault evaluation results. (a) Voltage curve. Diagnosis by (b) RIEDS, (c) Rcc, (d) RCS.
5.4 Diagnostic Performance Analysis and Discussion
Table 2 provides the diagnosis time used by different methods. For the connection fault, sensor fault, and ESC fault, the shortest time is used for diagnosis by the correlation coefficient method, which indicates that the fault is more sensitive to correlation. For the ISC fault, which is not easy to detect initially, the cosine similarity method produces the shortest diagnosis time, which indicates that the ISC fault is more sensitive to similarity. According to the four faults diagnosis results, it is evident that all three methods can detect and isolate the fault in a short period of time. Each of the three methods has its own merits. The improved Euclidean distance similarity method is simple to calculate and more sensitive to changes in data. The correlation coefficient method has good robustness because the correlation coefficient is always close to 1 without much fluctuation in the absence of faults; this method also produces a fast response and short diagnosis time when faults occur. The cosine similarity method differs from the previous two methods in that the threshold differentiation is large. The cosine similarity is converted by angle, and the variation range is from 0° to 90°, which can better distinguish different faults.
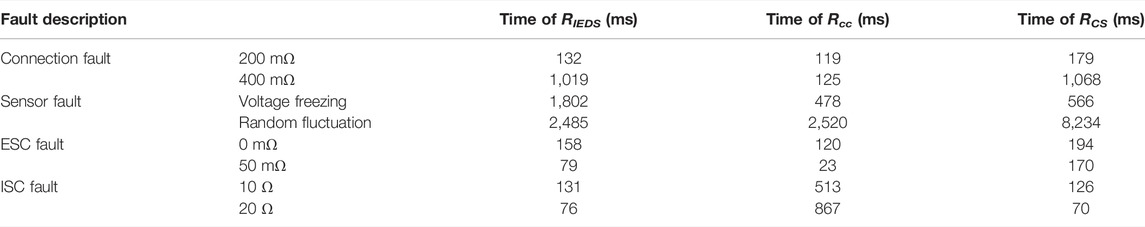
TABLE 2. Diagnostic performance results.
For different types of faults, there is a significant difference in the voltage signal. When a connection fault occurs between cell 1 and cell 2, V2 and V3 drop significantly. When sensor 3 is in a fault condition, a significant abnormality occurs in V3. When a short circuit occurs in cell 2, V3 and V4 drop significantly. However, the voltage V3 and V4 drop to a greater extent when it is ESC. Therefore, for different faults, the diagnosis results of the three methods also differ significantly.
(1) The improved Euclidean distance similarity method: When there is a connection fault, RIEDS(V1, V2) and RIEDS(V3, V4) drop below 0.92. When there is a sensor fault, RIEDS(V2, V3) and RIEDS(V3, V4) drop below the threshold. When there is an ESC fault, RIEDS(V2, V3) and RIEDS(V4, V5) drop below 0.6. When there is an ISC fault, RIEDS(V2, V3) and RIEDS(V4, V5) drop below 0.994 but above 0.6.
(2) The correlation coefficient method: When there is a connection fault, Rcc (V1, V2) and Rcc (V3, V4) drop below 0.95. When there is a sensor fault, Rcc (V2, V3) and Rcc (V3, V4) drop below the threshold. When there is an ESC fault, Rcc (V2, V3) and Rcc (V4, V5) drop below 0.8. When there is an ISC fault, Rcc (V2, V3) and Rcc (V4, V5) drop below 0.99 but above 0.8.
(3) The cosine similarity method: When there is a connection fault, RCS(V1, V2) and RCS (V3, V4) rise above 10°. When there is a sensor fault, RCS(V2, V3) and RCS(V3, V4) rise above the threshold. When there is an ESC fault, RCS(V2, V3) and RCS(V4, V5) rise above 15°. When there is an ISC fault, RCS(V2, V3) and RCS(V4, V5) rise above 1° but below 15°.
This experiment only use 4 cells to validate the three methods. For battery module or pack, which consists of hundreds or thousands cells, these methods are equally applicable. For example, when the battery pack consists of 100 cells in series, 200 sensors would be used based on the interleaved voltage measurement design shown in Figure 1.
When a connection fault occurs between cell 20 and cell 21, V40 and V41 show the same trend of abnormal change, and the rest of the voltages remain normal. According to the sensor serial number corresponding to the abnormal voltage, the fault type can be identified and the location of the fault can be located. For the improved Euclidean distance similarity method, the RIEDS(V39, V40) and RIEDS(V41, V42) of Rgroup1 drop below the threshold, RIEDS(V40, V41) and the rest RIEDS remain close to 1. Therefore, a connection fault can be identified by detecting that the two adjacent RIEDS in Rgroup1 drop below the threshold. For the correlation coefficient method, the Rcc (V39, V40) and Rcc (V41, V42) drop below the threshold, Rcc (V40, V41) and the rest Rcc remain close to 1. Therefore, a connection fault can be identified by detecting that the two adjacent Rcc in Rgroup1 drop below the threshold. For the cosine similarity method, the RCS(V39, V40) and RCS(V41, V42) rise above the threshold, RCS(V40, V41) and the rest RCS remain close to 0°. Therefore, a connection fault can be identified by detecting that the two adjacent RCS in Rgroup1 rise above the threshold.
When a short circuit fault occurs in cell 50, V99 and V100 show the same trend of abnormal change, and the rest of the voltages remain normal. According to the sensor serial number corresponding to the abnormal voltage, it can identify the fault type and locate the fault. For the improved Euclidean distance similarity method, the RIEDS(V98, V99) and RIEDS(V100, V101) drop below the threshold, RIEDS(V99, V100) and the rest RIEDS remain close to 1. Therefore, a short circuit fault can be identified by detecting that the two adjacent RIEDS in Rgroup2 drop below the threshold. For the correlation coefficient method, the Rcc (V98, V99) and Rcc (V100, V101) drop below the threshold, Rcc (V99, V100) and the rest Rcc remain close to 1. Therefore, a short circuit fault can be identified by detecting that the two adjacent Rcc in Rgroup2 drop below the threshold. For the cosine similarity method, the RCS(V98, V99) and RCS(V100, V101) rise to the threshold rise, RCS(V99, V100) and the rest RCS remain close to 0°. Therefore, a short circuit fault can be identified by detecting that the two adjacent RCS in Rgroup2 rise above the threshold. ISC and ESC are detected in the same way, but with different thresholds. Therefore, two kinds of short circuits are isolated by setting an additional threshold.
When the sensor measuring the voltage between the positive electrode of cell 35 and the positive electrode of cell 36 is in a fault. There is a significant abnormal change in V70, the rest of the voltages remain normal. For the improved Euclidean distance similarity method, the RIEDS(V69, V70) and RIEDS(V70, V71) drop below the threshold, and the rest RIEDS remain close to 1. Therefore, a sensor fault can be detected when Rgroup1 and Rgroup2 both have RIEDS that drops below the threshold. The common sensor serial number in RIEDS is the sensor serial number with the fault. For the correlation coefficient method, the Rcc (V69, V70) and Rcc (V70, V71) drop below the threshold, and the rest Rcc remain close to 1. Therefore, a sensor fault can be detected when Rgroup1 and Rgroup2 both have Rcc that drops below the threshold. The common sensor serial number in Rcc is the sensor serial number with the fault. For the cosine similarity method, the RCS(V69, V70) and RCS(V70, V71) rise above the threshold, and the rest RCS remain close to 0°. Therefore, a sensor fault can be detected when Rgroup1 and Rgroup2 both have RCS that rises above the threshold. The common sensor serial number in RCS is the sensor serial number with the fault.
To sum up, all three methods are applicable for other battery packs, which may consist of hundreds or thousands of cells.
6 Conclusion
For series-connected battery packs, to detect connection failures other than battery body failures, interleaved voltage sensor arrangements have become a trend. In addition to the correlation coefficient method of the voltage signals, this paper also proposes an improved Euclidean distance similarity and cosine similarity method for multi-fault diagnosis from the perspective of similarity. All three methods can quickly detect connection faults, sensor faults, and short-circuit faults of series-connected battery packs, but there are differences in sensitivity, robustness, and detection time to faults. The improved Euclidean distance similarity method is simple to calculate and more sensitive to changes in data. The correlation coefficient method has good robustness because the correlation coefficient is always close to 1 without much fluctuation in the absence of faults; this method also produces a fast response and short diagnosis time when faults occur. The cosine similarity method differs from the previous two methods in that the threshold differentiation is large. The cosine similarity is converted by angle, and the variation range is from 0° to 90°, which can better distinguish different faults. Future work will extend this paper’s methodology to the fault diagnosis of series-parallel battery packs and explore the multi-dimensional evolution mechanism of battery faults.
Data Availability Statement
The raw data supporting the conclusions of this article will be made available by the authors, without undue reservation.
Author Contributions
QY proposed the entire experimental scheme and revised the paper, JL proposed the fault diagnosis method and wrote the draft of the paper, ZC carried out specific experiments and revised the paper. MP made some suggestions for revisions to the draft of the paper.
Funding
This work was supported by the Shandong Provincial Natural Science Foundation (Project No. ZR2020ME209) and the National Natural Science Foundation of China (Grant No. 52177210 and 51977029).
Conflict of Interest
The authors declare that the research was conducted in the absence of any commercial or financial relationships that could be construed as a potential conflict of interest.
Publisher’s Note
All claims expressed in this article are solely those of the authors and do not necessarily represent those of their affiliated organizations, or those of the publisher, the editors and the reviewers. Any product that may be evaluated in this article, or claim that may be made by its manufacturer, is not guaranteed or endorsed by the publisher.
References
Abaza, A., Ferrari, S., Wong, H. K., Lyness, C., Moore, A., Weaving, J., et al. (2018). Experimental Study of Internal and External Short Circuits of Commercial Automotive Pouch Lithium-Ion Cells. J. Energy Storage 16, 211–217. doi:10.1016/j.est.2018.01.015
Chen, Z., Xiong, R., Lu, J., and Li, X. (2018). Temperature Rise Prediction of Lithium-Ion Battery Suffering External Short Circuit for All-Climate Electric Vehicles Application. Appl. Energy 213, 375–383. doi:10.1016/j.apenergy.2018.01.068
Chen, Z., Xiong, R., Tian, J., Shang, X., and Lu, J. (2016). Model-Based Fault Diagnosis Approach on External Short Circuit of Lithium-Ion Battery Used in Electric Vehicles. Appl. Energy 184, 365–374. doi:10.1016/j.apenergy.2016.10.026
Chen, Z., Zhang, B., Xiong, R., Shen, W., and Yu, Q. (2021). Electro-Thermal Coupling Model of Lithium-Ion Batteries under External Short Circuit. Appl. Energy 293, 116910. doi:10.1016/j.apenergy.2021.116910
Diao, W., Xu, B., and Pecht, M. (2021). Charging Induced Electrode Layer Fracturing of 18650 Lithium-Ion Batteries. J. Power Sources 484, 229260. doi:10.1016/j.jpowsour.2020.229260
Feng, X., Ouyang, M., Liu, X., Lu, L., Xia, Y., and He, X. (2018). Thermal Runaway Mechanism of Lithium Ion Battery for Electric Vehicles: A Review. Energy Storage Mater. 10, 246–267. doi:10.1016/j.ensm.2017.05.013
Franzò, S., and Nasca, A. (2021). The Environmental Impact of Electric Vehicles: A Novel Life Cycle-Based Evaluation Framework and its Applications to Multi-Country Scenarios. J. Clean. Prod. 315, 128005. doi:10.1016/j.jclepro.2021.128005
Gao, W., Zheng, Y., Ouyang, M., Li, J., Lai, X., and Hu, X. (2019). Micro-Short-Circuit Diagnosis for Series-Connected Lithium-Ion Battery Packs Using Mean-Difference Model. IEEE Trans. Ind. Electron. 66 (3), 2132–2142. doi:10.1109/TIE.2018.2838109
Hendricks, C. E., Mansour, A. N., Fuentevilla, D. A., Waller, G. H., Ko, J. K., and Pecht, M. G. (2020). Copper Dissolution in Overdischarged Lithium-Ion Cells: X-Ray Photoelectron Spectroscopy and X-Ray Absorption Fine Structure Analysis. J. Electrochem. Soc. 167 (9), 090501. doi:10.1149/1945-7111/ab697a
Hong, J., Wang, Z., and Liu, P. (2017). Big-Data-Based Thermal Runaway Prognosis of Battery Systems for Electric Vehicles. Energies 10 (7), 919. doi:10.3390/en10070919
Hossain Lipu, M. S., Hannan, M. A., Karim, T. F., Hussain, A., Saad, M. H. M., Ayob, A., et al. (2021). Intelligent Algorithms and Control Strategies for Battery Management System in Electric Vehicles: Progress, Challenges and Future Outlook. J. Clean. Prod. 292, 126044. doi:10.1016/j.jclepro.2021.126044
Hu, X., Jiang, H., Feng, F., and Liu, B. (2020). An Enhanced Multi-State Estimation Hierarchy for Advanced Lithium-Ion Battery Management. Appl. Energy 257, 114019. doi:10.1016/j.apenergy.2019.114019
Kang, Y., Duan, B., Zhou, Z., Shang, Y., and Zhang, C. (2019). A Multi-Fault Diagnostic Method Based on an Interleaved Voltage Measurement Topology for Series Connected Battery Packs. J. Power Sources 417, 132–144. doi:10.1016/j.jpowsour.2019.01.058
Kang, Y., Duan, B., Zhou, Z., Shang, Y., and Zhang, C. (2020). Online Multi-Fault Detection and Diagnosis for Battery Packs in Electric Vehicles. Appl. Energy 259, 114170. doi:10.1016/j.apenergy.2019.114170
Kang, Y., Yang, X., Zhou, Z., Duan, B., Liu, Q., Shang, Y., et al. (2021). A Comparative Study of Fault Diagnostic Methods for Lithium-Ion Batteries Based on a Standardized Fault Feature Comparison Method. J. Clean. Prod. 278, 123424. doi:10.1016/j.jclepro.2020.123424
Kriston, A., Pfrang, A., Döring, H., Fritsch, B., Ruiz, V., Adanouj, I., et al. (2017). External Short Circuit Performance of Graphite-LiNi1/3Co1/3Mn1/3O2 and Graphite-LiNi0.8Co0.15Al0.05O2 Cells at Different External Resistances. J. Power Sources 361, 170–181. doi:10.1016/j.jpowsour.2017.06.056
Lee, D., and Akatsu, K. (2021). The Study on Sensor Fault Detection and Algorithm Transition Using Adaptive Threshold in Position Self-Sensing Control for IPMSM. IEEE Trans. Ind. Electron. 68 (11), 10459–10466. doi:10.1109/TIE.2020.3031517
Li, R., Li, W., Zhang, H., Zhou, Y., and Tian, W. (2021). On-Line Estimation Method of Lithium-Ion Battery Health Status Based on PSO-SVM. Front. Energy Res. 9, 693249. doi:10.3389/fenrg.2021.693249
Liu, Z., and He, H. (2017). Sensor Fault Detection and Isolation for a Lithium-Ion Battery Pack in Electric Vehicles Using Adaptive Extended Kalman Filter. Appl. Energy 185, 2033–2044. doi:10.1016/j.apenergy.2015.10.168
Ma, M., Wang, Y., Duan, Q., Wu, T., Sun, J., and Wang, Q. (2018). Fault Detection of the Connection of Lithium-Ion Power Batteries in Series for Electric Vehicles Based on Statistical Analysis. Energy 164, 745–756. doi:10.1016/j.energy.2018.09.047
Ouyang, M., Zhang, M., Feng, X., Lu, L., Li, J., He, X., et al. (2015). Internal Short Circuit Detection for Battery Pack Using Equivalent Parameter and Consistency Method. J. Power Sources 294, 272–283. doi:10.1016/j.jpowsour.2015.06.087
Pan, Y., Feng, X., Zhang, M., Han, X., Lu, L., and Ouyang, M. (2020). Internal Short Circuit Detection for Lithium-Ion Battery Pack with Parallel-Series Hybrid Connections. J. Clean. Prod. 255, 120277. doi:10.1016/j.jclepro.2020.120277
Ren, D., Hsu, H., Li, R., Feng, X., Guo, D., Han, X., et al. (2019). A Comparative Investigation of Aging Effects on Thermal Runaway Behavior of Lithium-Ion Batteries. eTransportation 2, 100034. doi:10.1016/j.etran.2019.100034
Tian, J., Wang, Y., and Chen, Z. (2020). Sensor Fault Diagnosis for Lithium-Ion Battery Packs Based on Thermal and Electrical Models. Int. J. Electr. Power Energy Syst. 121, 106087. doi:10.1016/j.ijepes.2020.106087
Tian, J., Xiong, R., and Shen, W. (2019). A Review on State of Health Estimation for Lithium Ion Batteries in Photovoltaic Systems. eTransportation 2, 100028. doi:10.1016/j.etran.2019.100028
Tran, M.-K., and Fowler, M. (2019). Sensor Fault Detection and Isolation for Degrading Lithium-Ion Batteries in Electric Vehicles Using Parameter Estimation with Recursive Least Squares. Batteries 6, 1. doi:10.3390/batteries6010001
Wang, H., Simunovic, S., Maleki, H., Howard, J. N., and Hallmark, J. A. (2016). Internal Configuration of Prismatic Lithium-Ion Cells at the Onset of Mechanically Induced Short Circuit. J. Power Sources 306, 424–430. doi:10.1016/j.jpowsour.2015.12.026
Wang, J., Zhang, S., and Hu, X. (2021). A Fault Diagnosis Method for Lithium-Ion Battery Packs Using Improved RBF Neural Network. Front. Energy Res. 9, 702139. doi:10.3389/fenrg.2021.702139
Wang, Q., Mao, B., Stoliarov, S. I., and Sun, J. (2019). A Review of Lithium Ion Battery Failure Mechanisms and Fire Prevention Strategies. Prog. Energy Combust. Sci. 73, 95–131. doi:10.1016/j.pecs.2019.03.002
Xia, B., and Mi, C. (2016). A Fault-Tolerant Voltage Measurement Method for Series Connected Battery Packs. J. Power Sources 308, 83–96. doi:10.1016/j.jpowsour.2016.01.057
Xia, B., Shang, Y., Nguyen, T., and Mi, C. (2017). A Correlation Based Fault Detection Method for Short Circuits in Battery Packs. J. Power Sources 337, 1–10. doi:10.1016/j.jpowsour.2016.11.007
Xiong, R., Sun, W., Yu, Q., and Sun, F. (2020). Research Progress, Challenges and Prospects of Fault Diagnosis on Battery System of Electric Vehicles. Appl. Energy 279, 115855. doi:10.1016/j.apenergy.2020.115855
Xiong, R., Yu, Q., Shen, W., Lin, C., and Sun, F. (2019). A Sensor Fault Diagnosis Method for a Lithium-Ion Battery Pack in Electric Vehicles. IEEE Trans. Power Electron. Power Electr. 34 (10), 9709–9718. doi:10.1109/TPEL.2019.2893622
Yang, R., Li, K., Xie, Y., Li, W., Qian, Y., Zhang, Y., et al. (2022). Thermal Management of a 48 V Lithium-Ion Battery Pack by Semiconductor Refrigeration. Front. Energy Res. 9, 794438. doi:10.3389/fenrg.2021.794438
Yang, R., Xiong, R., He, H., and Chen, Z. (2018). A Fractional-Order Model-Based Battery External Short Circuit Fault Diagnosis Approach for All-Climate Electric Vehicles Application. J. Clean. Prod. 187, 950–959. doi:10.1016/j.jclepro.2018.03.259
Yang, R., Xiong, R., Ma, S., and Lin, X. (2020). Characterization of External Short Circuit Faults in Electric Vehicle Li-Ion Battery Packs and Prediction Using Artificial Neural Networks. Appl. Energy 260, 114253. doi:10.1016/j.apenergy.2019.114253
Yu, Q., Dai, L., Xiong, R., Chen, Z., Zhang, X., and Shen, W. (2022). Current Sensor Fault Diagnosis Method Based on an Improved Equivalent Circuit Battery Model. Appl. Energy 310, 118588. doi:10.1016/j.apenergy.2022.118588
Yu, Q., Wan, C., Li, J., Xiong, R., and Chen, Z. (2021). A Model-Based Sensor Fault Diagnosis Scheme for Batteries in Electric Vehicles. Energies 14 (4), 829. doi:10.3390/en14040829
Zhang, Z., Kong, X., Zheng, Y., Zhou, L., and Lai, X. (2019). Real-Time Diagnosis of Micro-Short Circuit for Li-Ion Batteries Utilizing Low-Pass Filters. Energy 166, 1013–1024. doi:10.1016/j.energy.2018.10.160
Zhou, N., Liang, H., Cui, J., Chen, Z., and Fang, Z. (2021). A Fusion-Based Method of State-Of-Charge Online Estimation for Lithium-Ion Batteries under Low Capacity Conditions. Front. Energy Res. 9, 790295. doi:10.3389/fenrg.2021.790295
Keywords: electric vehicles, battery management system, multi-fault diagnosis, interleaved voltage measurement design, similarity, correlation coefficient
Citation: Yu Q, Li J, Chen Z and Pecht M (2022) Multi-Fault Diagnosis of Lithium-Ion Battery Systems Based on Correlation Coefficient and Similarity Approaches. Front. Energy Res. 10:891637. doi: 10.3389/fenrg.2022.891637
Received: 08 March 2022; Accepted: 19 April 2022;
Published: 10 May 2022.
Edited by:
Xiangming He, Tsinghua University, ChinaReviewed by:
Yaxing Ren, University of Warwick, United KingdomYi Xie, Chongqing University, China
Yujie Wang, University of Science and Technology of China, China
Copyright © 2022 Yu, Li, Chen and Pecht. This is an open-access article distributed under the terms of the Creative Commons Attribution License (CC BY). The use, distribution or reproduction in other forums is permitted, provided the original author(s) and the copyright owner(s) are credited and that the original publication in this journal is cited, in accordance with accepted academic practice. No use, distribution or reproduction is permitted which does not comply with these terms.
*Correspondence: Zeyu Chen, Y2hlbnp5QG1haWwubmV1LmVkdS5jbg==