 Jinxing Xiao
 Ying Ye2
- 1State Grid Shanghai Municipal Electric Power Company, Shanghai, China
- 2State Grid Shanghai Jinshan Electric Power Supply Company, Shanghai, China
Affected by the light intensity and multiple adjacent stations, the output power of photovoltaic power stations presents the characteristics of randomness and correlation, which puts forward new requirements for the safe operation and planning evaluation of the distribution network. First, in order to accurately describe the randomness and fluctuation of photovoltaic output, a Gaussian mixture model based on an improved optimal particle swarm optimization algorithm is proposed, and the joint probability density function of multiple photovoltaic outputs is solved. Then, the power flow equation is linearized, the linear expressions of bus voltage and line power flow are derived, and the joint probability distributions of multi-node voltage and multi-line power flow are obtained, respectively. Based on this, the reliability index and voltage quality index in the presence of the distributed renewable energy were constructed. Finally, the novel power grid planning evaluation index is tested in a real system in China, the combined weight is determined by the analytic hierarchy process, and the comprehensive evaluation results are obtained. The simulation results prove the feasibility of the evaluation index system.
1 Introduction
1.1 Motivation
In recent years, China has provided policy support for the development and utilization of clean energy, which has promoted the development of renewable energy power generation (Zhang et al., 2022a; Zhang et al., 2022b; Song et al., 2022). The access to distributed photovoltaic energy in the distribution network brings the operation of the power system more uncertainty and puts forward higher requirements for distribution network planning (Zhang et al., 2019a). In order to optimize the operation of the distribution network, (Xiao et al. 2021) proposed a comprehensive control method for negative sequence current suppression and reactive power compensation. The optimal placement and sizing of distribution static compensator in radial distribution networks as multi-objective optimization with the objective of power loss reduction using whale optimization algorithm is discussed by (Noori et al. 2021). However, the compensation effects are rarely considered when evaluating distribution network planning options. In addition, the distribution network planning evaluation system based on a deterministic model and deterministic power flow will be difficult to be effectively applied to an active power distribution network (Meera and Hemamalini, 2021).
1.2 Literature Survey
At present, a relatively standardized comprehensive evaluation system for distribution network planning (Song and Zhu, 2021; Dong et al., 2022) has been formed, covering flexibility, coordination, economy, and power supply reliability. In order to consider the characteristics of renewable energy, (Zeng et al. 2016) considered the environmental protection effects brought by a large number of distributed generators connected to the distribution network, and the index evaluation system of the new energy distribution network considering environmental protection and the comprehensive evaluation model of environmental benefits of intelligent distribution network were established, respectively. Based on the big data analysis method, (Visser et al. 2022) realized the comprehensive evaluation of the distribution network including “performance” and “benefit.” On this basis, (Li et al. 2018) constructed a four-tier index system including user energy efficiency and environmental pollution.
However, the existing research has not considered the volatility and intermittence brought by photovoltaic access to the power grid. Different from the traditional distribution network, for the fluctuation of the output power of distributed photovoltaic power stations and the correlation of the output of multiple photovoltaic electric fields (Murata et al., 2009), it is necessary to consider the power flow limit and voltage limit of the system caused by the aforementioned characteristics in the evaluation of distribution network (Fermín et al., 2022).
At present, the description of the fluctuation of photovoltaic output is usually based on the probability density function method (Liu et al., 2016; Zhang et al., 2019b; Chen et al., 2020). (Yang et al. 2017) and (Xiang et al. 2019) show the robust optimization model that effectively reflects the probability distribution characteristics of new energy. (Wang et al. 2022) proposed a spectrum analysis method based on an autoregressive model to analyze the fluctuation characteristics of photovoltaic output. (Yu et al. 2019) showed that the random characteristics of the actual output of photovoltaic power station approximately obey the beta distribution. (Wu et al. 2015) used the exponential distribution to simulate the variation characteristics of photovoltaic power and evaluate the short-term power fluctuation amplitude.
In general, the Pearson correlation coefficient method (Jia et al., 2021) and the copular function fitting method (Rajabalizadeh and Tafreshi, 2020) are extensively used to describe the output correlation of photovoltaic power stations. The Pearson correlation coefficient method can only characterize simple linear correlation (Singh et al., 2010). Compared with that, copular function has higher flexibility, but it is more complex to find the optimal parameters of copular function with actual data (Jin et al., 2021).
Existing methods can be categorized into two groups: 1) the refinement modeling of random characteristics for the output power of photovoltaic power station; 2) the refinement modeling of correlation characteristics for the output power of photovoltaic power station. However, it is hard to simultaneously depict them. Gaussian mixture model can effectively simulate the random characteristics of photovoltaic output and can describe the correlation of output power of multiple photovoltaic power stations based on their joint distribution (Jiang et al., 2015). In addition, the voltage and power flow limits will endanger the safe operation of the power grid. Therefore, when establishing the distribution network planning evaluation system of distributed photovoltaic access, it is necessary to consider the over-limit risk of voltage and power flow at the same time.
1.3 Contributions
To address these important issues, this study proposes a comprehensive evaluation index system for distribution networks for distributed photovoltaic access. Relative to the state-of-the-art, the contributions of this study are threefold:
1) In the modeling of the randomness and correlation of output power of multiple photovoltaic power stations, the GMM based on the improved particle swarm optimization algorithm is proposed.
2) For the solution methodology, the joint probability density function and joint distribution function of multi-node voltage and multi-line power flow are solved based on the linearized power flow equation. By doing so, the novel distribution network evaluation indexes such as voltage out-of-limit index are defined based on the probability density function.
3) After the three novel indexes, such as voltage out-of-limit risk indicators, voltage deviation indicators, and power flow cross-section out-of-limit risk indicators are incorporated into the distribution network planning evaluation system, the comprehensive evaluation index system of the distribution network for distributed photovoltaic access has been formed.
1.4 Organization
The first section of the article is the introduction. Section 2 provides the uncertainty model considering the randomness and correlation of photovoltaic power stations; Section 3 discusses the analytical probabilistic power flow analysis method based on a linearized power flow equation. In Section 4, the evaluation system of distribution network planning considering power flow uncertainty are shown. Simulation analysis is presented in Section 5. The conclusion and limitations are provided at the end of this article.
2 The Uncertainty Model Considering the Randomness and Correlation of Output of Photovoltaic Power Station
Distributed photovoltaic access to the distribution network makes the node voltage and line power flow fluctuate. The traditional deterministic model is hard to describe the fluctuation characteristics of renewable energy in detail. Therefore, considering the randomness and correlation of photovoltaic power station output, this section first establishes an uncertainty model for distributed photovoltaic access.
2.1 Gaussian Mixture Model
Gaussian mixture model (GMM) can accurately model non-Gaussian random variables and can approximate any probability density distribution with the help of a linear combination of a certain amount of Gaussian density function (Angelim and Affonso, 2020), shown as follows:
where X is the input variable of the expression and represents the output power vector of the photovoltaic power station;
In parameter estimation, the samples
Then, iterative optimization is carried out with the maximum likelihood function as the optimization objective, and the optimization result parameters are the parameters that GMM needs to be estimated.
2.2 Parameter Solution of the Gaussian Mixture Model Based on Improved Particle Swarm Optimization Algorithm
In the traditional GMM parameter solving process, the expectation maximization (EM) algorithm is extensively used. Considering that the accuracy of the algorithm depends on the selection of the initial value, the improper initial value may lead to the local optimal solution during the iterative optimization, which will have a negative impact on the next settlement results. In contrast, the improved optimal particle swarm optimization algorithm can greatly reduce the influence of initial value and realize the balance of global optimization and local optimization ability, so it is easier to obtain the global optimal solution (Peng et al., 2017). Therefore, this section adopts the improved particle swarm optimization algorithm.
1) First, the particle swarm
2) Then, the position and velocity of particles are updated in each iteration, as shown in Eqs. 5, 6.the following equations:
where c1 and c2 represent the acceleration constants. Generally taken as
where λstart and λend represent the initial weight and final weight, respectively, k represents the current number of iterations, and Tmax represents the maximum number of iterations.
3) Calculate the updated particle according to the set objective function Formula 4, update and record the current optimal value and the global optimal value of the particle.
4) Check whether the upper limit of cycle times is reached or whether the difference between algebras meets the error constraints. If so, the calculation ends and the result is output, otherwise, go to step 2 to continue the calculation.
3 Analytical Probabilistic Power Flow Analysis Method Based on the Linearized Power Flow Equation
After Gaussian mixture model modeling, the output power of the photovoltaic power station follows the Gaussian distribution. For the occasions that need to repeat large-scale power flow calculations, such as distribution network reliability assessment and distribution network probabilistic power flow, the use of a linearized power flow model can improve the calculation efficiency, and there is no convergence problem.
3.1 Linear Power Flow Model of Distribution Network
The structural configuration of the traditional distribution network is that there is only one generator as the swing bus, and the rest are all PQ nodes, excluding PV nodes. The research on the linearized power flow equation of the distribution network has been relatively mature. However, since the distribution network is connected to the distributed photovoltaic power station, sometimes it needs to be processed as a PV node in the power flow calculation, and the ZIP load is getting more and more attention in the analysis of the distribution network. Thus, it is necessary to establish a more applicable power flow calculation method for the distribution network.
In this section, the DG access node is regarded as a PV node, the load is set as the ZIP model, the node injection power equation is used as the original power flow equation, the power flow equation is linearized, and the linear power flow equation between node voltage amplitude and line power and injection power is derived. The final linearized power flow equation is as follows:
where V and S are the output variables and represent the node voltage amplitude and branch power flow, respectively. X is the input variable and represents the photovoltaic active output. A1, A2, B1, and B2 are linearization expression coefficients. In order to simplify the expression, all linearized expressions are uniformly expressed as shown in Eq. 9 the following equation:
where W is the output variable, representing the node voltage amplitude and branch power; X is the input variable and represents the active output of new energy. B and C are the coefficients of linearization expression.
3.2 Description Diagram of Node Voltage and Section Power Flow Probability Distribution
If the random variable obeys Gaussian distribution, it still obeys Gaussian distribution after linear transformation. Therefore, the output power X of a photovoltaic power station is modeled based on multivariable Gaussian distribution Nm (x) first, and after linear transformation in Eq. 9, the node voltage and line power flow also obey Gaussian distribution. Here, the node voltage is selected for derivation. The amplitude of the node voltage follows Gaussian distribution, in which the expectation vector is Aμm + B1, the covariance matrix is AΣmAT, so the joint probability density function (PDF) of node voltage can be expressed as
where K represents the number of nodes. By multiple integrations of Eq. 10, the joint cumulative distribution function (CDF) of node voltage V can be obtained, as shown in the following equation: Eq. 11,
When photovoltaic power X is modeled by GMM with multiple weights and variables, the joint CDF of node voltage can be expressed as
Accordingly, the joint probability density function of node voltage V can be obtained by differentiating Eq. 12.
Eqs 12, 13 are the node voltage joint CDF and joint PDF when the photovoltaic output power is modeled by GMM.
4 Evaluation System of Distribution Network Planning Considering Power Flow Uncertainty
According to the analysis in Section 3, the joint probability distribution density function of multi-node voltage and multi-section power flow is obtained to effectively describe the uncertainty of power flow. Then, combined with the severity function description and the active distribution network planning evaluation method based on probabilistic power flow analysis, three evaluation indexes are added in this section to describe the voltage and power flow fluctuations caused by photovoltaic access.
4.1 New Evaluation Index of Distribution Network Planning Considering Distributed Photovoltaic Access
Under the influence of light intensity, the output power of the photovoltaic power station meets a certain probability distribution, which will lead to fluctuations in the voltage of key nodes in the power grid and the transmission power of key power flow section. Distributed photovoltaic grid connection may also cause the bus voltage of the power grid to deviate to varying degrees at different times. The degree of system voltage offset is an important factor in evaluating voltage quality. Excessive voltage offset may lead to “voltage collapse” and eventually large-scale power outage (Zhang et al., 2021). In addition, because the random fluctuation of line power flow is not considered, the distribution network planning evaluation based on traditional power flow will not accurately measure the risk. Therefore, in order to form a distribution network planning evaluation system that is suitable for distributed photovoltaic access, the aforementioned factors are added here, and the following evaluation indexes are defined:
1) The risk index of voltage over-limit Risk (V). In order to measure the voltage quality of the distribution network at the key bus under the condition of random fluctuating power output, based on the voltage joint cumulative distribution function obtained in Section 3, the voltage out-of-limit risk index is defined as follows:
where F(V) represents the joint probability density function of multi-node voltage, Sevhv (Vmax) represents the severity function of voltage over-limit, which is defined as follows:
where Vmax = max{V1,V2,…Vk}, when calculating the severity of the voltage of k nodes crossing the limit at the same time, select the node voltage with the largest deviation from the rated voltage to replace it with the severity function.
2) The index of voltage deviation BVDI. The calculation formula of voltage deviation index is as follows:
where Ui represents the voltage observation value of the ith time, which is obtained by sampling calculation;
3) The risk index of power flow over-limit Risk (P). By analogy with the voltage out-of-limit risk index, based on the joint cumulative distribution function obtained in Section 3, the voltage out-of-limit risk index is defined as follows:
where F(P) represents the joint probability density function of line power flow and
where max{P-Pn} is the maximum deviation between the line power flow and the rated transmission power. When the power flow of all lines is not greater than the rated transmission power P ≤ Pn, the severity function value is 0, otherwise, the maximum value of the power flow deviation is taken.
4.2 Comprehensive Evaluation Index System of Distribution Network Planning Considering Distributed Photovoltaic Access
The voltage out-of-limit risk index, voltage deviation index, and line overload risk index are incorporated into the existing comprehensive evaluation index system of distribution network planning, that is, considering reliability, economy, safety, and adaptability at the same time, a three-tier distribution network index evaluation system considering distributed photovoltaic access is formed, as shown in Figure 1.
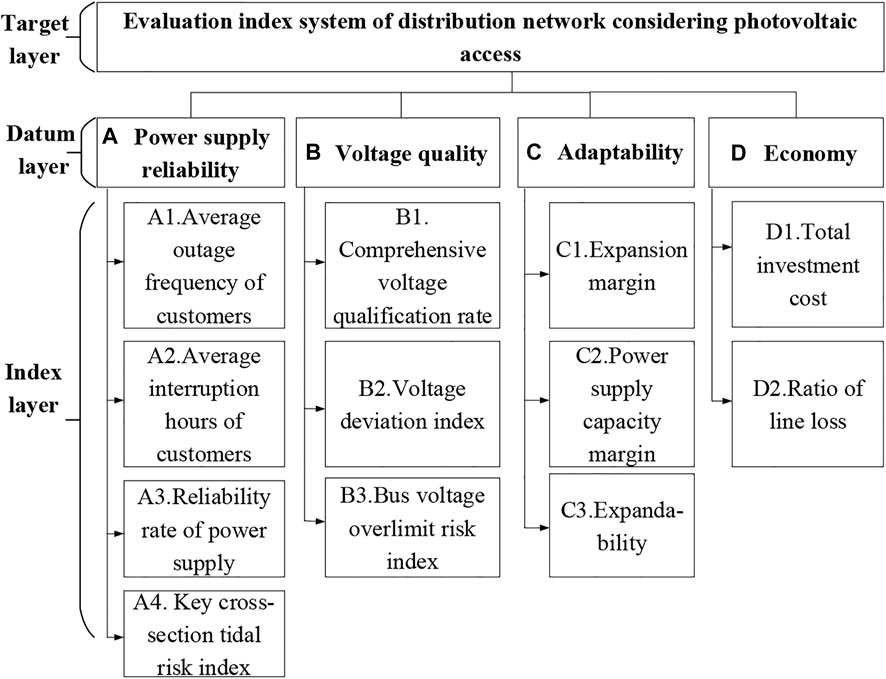
FIGURE 1. Index evaluation system of distributed photovoltaic power generation access to the distribution network.
In addition to the three indicators defined in Section 4.1, the definitions of relevant traditional indicators in the figure are shown in the study by (Guo et al. 2021), and the weight of indicators shown in Figure 1 is calculated by the analytic hierarchy process.
1) Establish the importance matrix of the benchmark layer and the index layer under each benchmark layer. When constructing the importance matrix, the relative importance of the elements of each layer is quantified by numbers 1∼9, and finally the importance matrix
2) Calculate the weight coefficient of all attributes in the criterion layer to the importance matrix M in the target layer based on the arithmetic average method. Similarly, the importance matrix of A, B, C, and D are calculated. Then multiply the weight of each element of the index layer by the weight of the corresponding reference layer, and the combined weights W are obtained.
3) Calculate the comprehensive evaluation value of the distribution network. Based on the combined weights and index initial score S, the comprehensive score TS of distribution network planning is calculated as follows:
where Sj represents the score of the jth index of the index layer, Wj represents the comprehensive weight of the jth subordinate index of the index layer, and λ represents the number of elements contained in the index layer of the index system.
4.3 Flow Chart of Comprehensive Evaluation of Active Distribution Network Planning Based on Probabilistic Power Flow Analysis
In summary, this section forms the following flow chart of comprehensive evaluation score of active distribution network planning based on probabilistic power flow analysis, as shown in Figure 2.
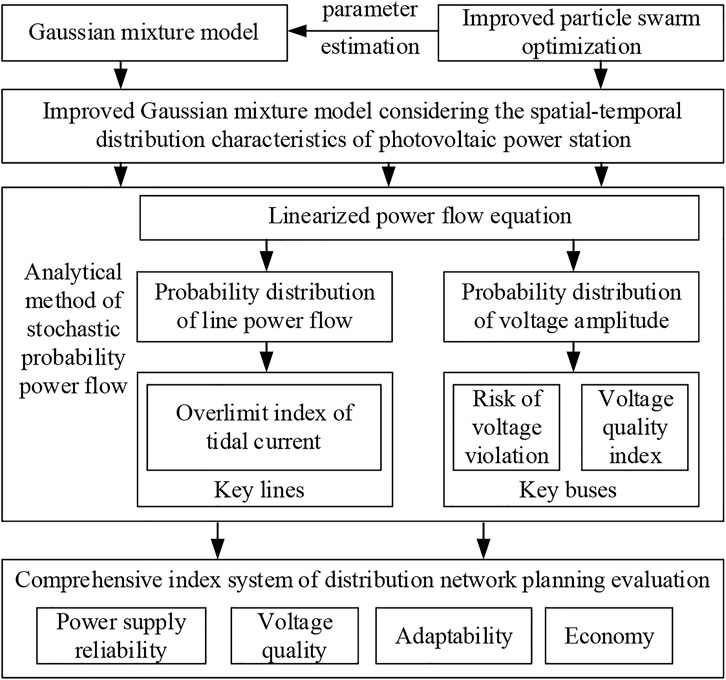
FIGURE 2. Flow chart of the comprehensive evaluation of the distribution network.
5 Simulation Analysis
5.1 Simulation System
In order to verify the rationality of the active distribution network planning evaluation method based on probabilistic power flow analysis proposed in this study, two areas, M and N, of an urban distribution network in China are used as simulation examples in this section. The distribution network in this area is connected with a large number of distributed photovoltaics. The system structure diagram is shown in Figure 3, and the dotted line in the figure indicates that it is not directly connected.
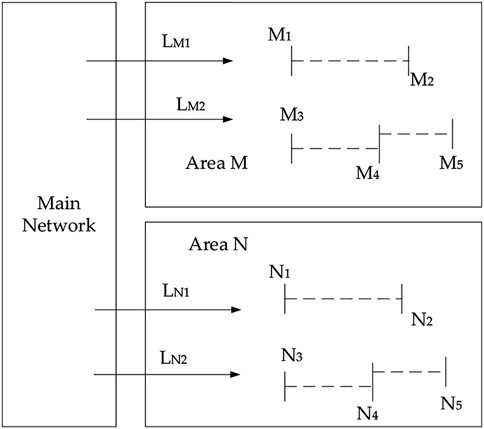
FIGURE 3. Distribution network system diagram of an urban area.
5.2 Simulation Analysis
5.2.1 Probabilistic Power Flow Analysis
According to the flow chart shown in Figure 2, the output power data of the photovoltaic power station was obtained first, which comes from the real data collected in areas M and N. According to the parameter determination steps of the Gaussian mixture model based on the improved particle swarm optimization algorithm shown in Section 2.2, let the number of sub-components of the Gaussian mixture model be two, and the solution of the weight of the probability density function of photovoltaic output in area M are
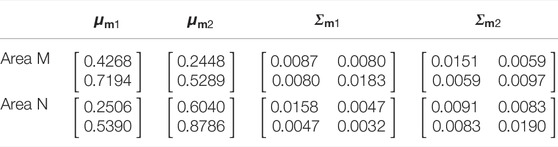
TABLE 1. Gaussian mixture model parameter results.
Calculate the node voltage probability density distribution function according to Eqs 11–13. The Monte Carlo algorithm (MCS) has high calculation accuracy, but it is limited by the calculation speed, which is used to compare the advantages and disadvantages of different methods. This section obtains the probability power flow distribution of node voltage and line flow in the system based on the EM algorithm and the method proposed in this study and compares them with the MCS algorithm to illustrate their accuracy. First, the probability distribution calculation of node voltage is used to verify the accuracy of the proposed improved algorithm. In this section, node M1 in area M is selected as the observation point to obtain the corresponding voltage probability density distribution. The results are shown in Figure 4.
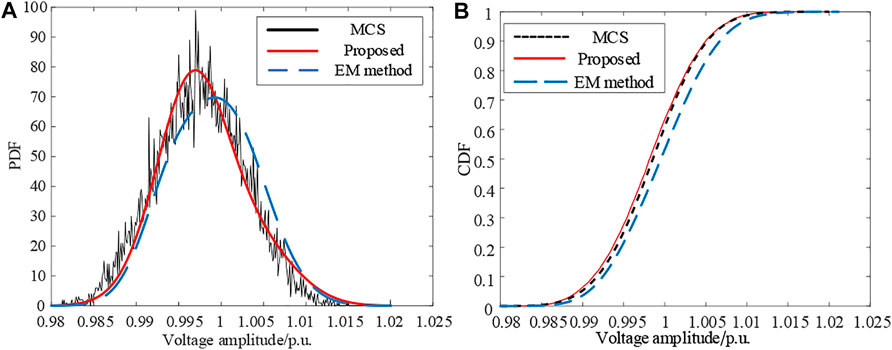
FIGURE 4. The voltage amplitude probability distribution of bus M1. (A) The voltage amplitude probability density function of bus M1. (B) The cumulative distribution function of voltage amplitude at bus M1.
According to Figure 4, the black line is obtained by MCS. The red line is obtained by the proposed improved optimal particle swarm optimization algorithm. The blue line is obtained by the traditional EM method. It can be obviously observed from Figure 4 that the proposed method is more consistent with MCS compared with the traditional EM method. The average root mean square error and maximum absolute error (Yang et al., 2017) when calculating the probability distribution of voltage amplitude of bus 5 in Figure 4 based on the EM algorithm are 0.044 and 0.305, respectively, while the two error indices are reduced to 0.000295 and 0.0472, respectively, based on the method proposed in this study, which verifies the superiority of the method proposed in this study in improving the modeling accuracy of GMM. From Figure 4A, the PDF is maximum in the interval 0.995-1, which represents that the node voltage has the highest probability of belonging to this interval. From Figure 4B, the randomness of photovoltaic output makes the node voltage fluctuate between 0.98 and 1.02. In other words, the probability that the voltage amplitude is less than 1.02 is 1, and the voltage amplitude does not exceed its limit. In terms of calculation time, the analytical method proposed in this study takes 0.053 s and the MCS method takes 24.43 s, which proves that the calculation efficiency of this method is better than that of MCS.
Based on the more accurate GMM proposed in this study, it has higher accuracy in describing the randomness of photovoltaic output, so that a more accurate node voltage out-of-limit index can be established, and finally, a more accurate voltage quality evaluation index of active distribution network planning can be obtained.
The joint probability density of line power flow can be used to describe the probability that multiple random variables are in the same state. Here, it is used to evaluate the probability that two or more line of power flows cross the limit at the same time.
According to Figure 5, the yellow area represents the area with the largest probability density of power flow combination of the two lines, and the blue area represents the part with the smallest probability density. Take Figure 5A as an example, that is, in the measured output power time interval of a photovoltaic power station, the active power flow on lines LM1 and LM2 in area M is mostly concentrated in the yellow area. Due to the limitation of dimension, it is difficult to show the joint power flow probability density distribution of three or more lines in the form of a diagram.
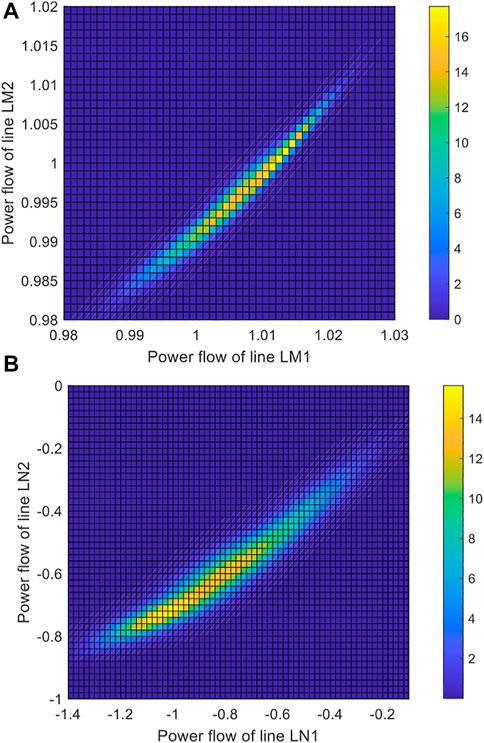
FIGURE 5. Joint probability density distribution of power flow of regional important lines. (A) The joint probability density of the line LM1 and the line LM2 in area M. (B) The joint probability density of the line LN1 and the line LN2 in area N.
5.2.2 Comprehensive Evaluation Index
According to Figure 5, the joint probability density distribution of power flow in multiple lines of areas M and N can be obtained. In order to verify the proposed evaluation method for distribution network planning and the randomness and correlation of photovoltaic output, according to the Gaussian mixture model of the output power of photovoltaic power plants in M area and N area established in Table 1, the joint probability density function of the voltage at the nodes N1–N5 and nodes M1–M5 is calculated respectively. Combined with the definition of severity function in Eq 15, 18, we calculated the novel index of distribution network planning evaluation according to Eq 14, 16, 17, and the results are shown in Table 2 below.
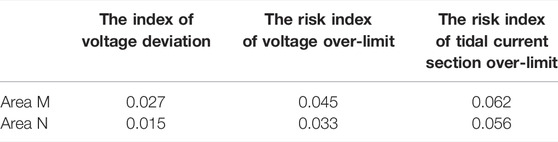
TABLE 2. Evaluation index results of distribution network for photovoltaic access.
The three indicators in Table 2 are equivalently transformed according to the percentage system, and the rest of the indicators in the indicator system in Figure 1 are scored by experts. Taking the sum of the index scores of the two areas as the benchmark, the percentage system scores are converted to obtain the relative scores of all the indicators. The results are shown in Table 3.
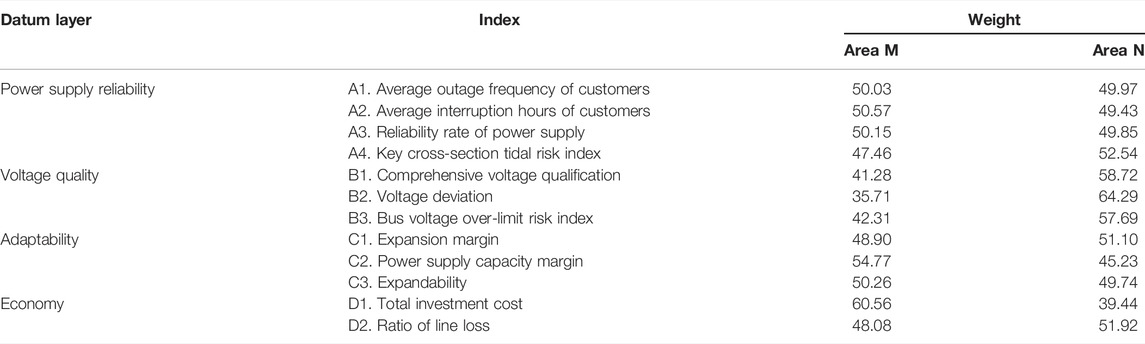
TABLE 3. Relative scores of all indicators.
According to the distribution network index evaluation system shown in Figure 1, the weight of the reference layer, the weight of the index layer, and the comprehensive weight of the two areas are calculated respectively based on the analytic hierarchy process. The results are shown in Table 4.
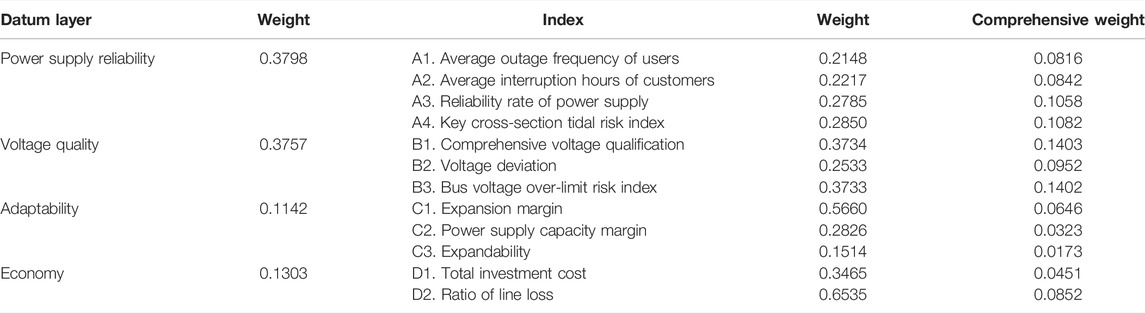
TABLE 4. Calculation results of benchmark layer weight, index layer weight, and comprehensive weight.
The final comprehensive evaluation score of the two regional distribution networks is calculated based on Eq. 19, as shown in Table 5 below.
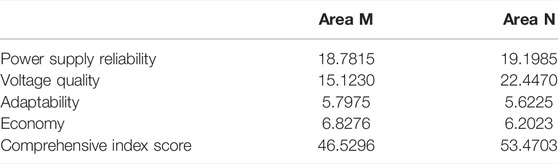
TABLE 5. Comprehensive score of the two phases of the project.
According to the Table 5, compared with the distribution network in the area M, the energy storage unit is equipped in the area N distribution network, which alleviates the impact of the fluctuation of the output of the photovoltaic power station on the power grid to a certain extent and improves the power supply quality and safety. The comprehensive score of the indicators is increased, and the planning and construction of the distribution network are better.
In order to further verify the rationality of the proposed comprehensive index system of distribution network, the present method is used as the control group, which does not contain the new power grid planning evaluation index constructed in this study. According to the calculation process of the analytic hierarchy process in Section 3.2, the scores of comprehensive indicators of power grid planning by the present method are calculated, and the results are shown in Table 6.
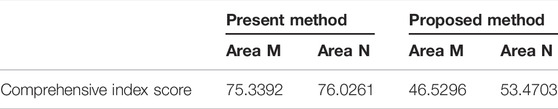
TABLE 6. Comprehensive score of power grid planning based on different index systems.
According to Table 6, based on the present method, the comprehensive index scores of the two areas are 75.3392 and 76.0126, respectively. Since the adverse effects such as volatility and randomness caused by photovoltaics are not considered, the results obtained are higher than in this study. At the same time, the difference between the comprehensive scores of the two areas calculated based on the present method is 0.6869, and the difference between the comprehensive scores of the two areas calculated by the proposed method in this study is 6.9407. That is to say, the proposed comprehensive evaluation index system can describe the compensation effect of the energy storage, which provides an effective reference for the distribution network planning and construction. Therefore, the proposed method is more adaptable for the evaluation of the new distribution network with photovoltaic access.
6 Conclusion
Focus on the phenomenon of node voltage fluctuation and lines power flow fluctuation caused by distributed photovoltaic access, this study establishes a comprehensive evaluation system of distribution network considering distributed photovoltaic access, which mainly has the following innovations:
1) The Gaussian mixture model based on an improved particle swarm optimization algorithm can effectively describe the fluctuation and the correlation of active power output of photovoltaic power plants.
2) Considering the access characteristics of distributed generation, based on the linearized power flow equation, the joint probability density function of multi-node voltage and multi-line power flow can be obtained.
3) Based on the joint probability density function of multi-node voltage, the comprehensive evaluation index system of a distribution network for distributed photovoltaic accessing is defined. The distribution network evaluation system is improved, which can provide a theoretical reference for the planning, design, and optimal operation of a distribution network with a high proportion of new energy access in the future.
Data Availability Statement
The original contributions presented in the study are included in the article/Supplementary Material; further inquiries can be directed to the corresponding author.
Author Contributions
JX and YY each wrote a section of the manuscript. FW, JS, and FG contributed to data curation, analysis, and visualization. JX contributed to manuscript revision. All authors approved the submitted version.
Funding
The authors declare that this study received funding from Science and Technology Project of State Grid Shanghai Electric Power Company, grant number 520932200087. The funder had the following involvement in the study: Conceptualization, JX; methodology, JX; software, YY; validation, YY; formal analysis, FW; investigation, FW; resources, JS; data curation, YY; writing—original draft preparation, JX; writing—review and editing, JX; visualization, JX; supervision, JX; project administration, JS; funding acquisition, FG.
Conflict of Interest
JX was employed by the State Grid Shanghai Electric Supply Company. YY, FW, JS, and FG were employed by the State Grid Shanghai Jinshan Electric Supply Company.
Publisher’s Note
All claims expressed in this article are solely those of the authors and do not necessarily represent those of their affiliated organizations, or those of the publisher, the editors, and the reviewers. Any product that may be evaluated in this article, or claim that may be made by its manufacturer, is not guaranteed or endorsed by the publisher.
References
Angelim, J. H., and Affonso, C. d. M. (2020). Probabilistic Assessment of Voltage Quality on Solar-Powered Electric Vehicle Charging Station. Electr. Power Syst. Res. 189, 106655. doi:10.1016/j.epsr.2020.106655
Chen, Y., Zhang, Z., Chen, H., and Zheng, H. (2020). Robust UC Model Based on Multi‐band Uncertainty Set Considering the Temporal Correlation of Wind/load Prediction Errors. IET Gener. Transm. & Distrib. 14, 180–190. doi:10.1049/iet-gtd.2019.1439
Dong, F., Hou, Y., Li, W., and Wang, Y. (2022). Intelligent Decision-Making of Distribution Network Planning Scheme with Distributed Wind Power Generations. Int. J. Electr. Power & Energy Syst. 136, 107673. doi:10.1016/j.ijepes.2021.107673
Fermín, R., Ainhoa, G., and Juan, C. (2022). Using Deep Learning and Meteorological Parameters to Forecast the Photovoltaic Generators Intra-hour Output Power Interval for Smart Grid Control. Energy 239, 122116. doi:10.1016/j.energy.2021.122116
Guo, L., Du, Y., and Yang, X. (2021). Research on Influence Factors and Evaluation Model of Distribution Network Green Index Based on Urban Energy Internet. 2021 China International Conference on Electricity Distribution. Shanghai, China: CICED, 7–9.
Jia, P., Zhang, H., Liu, X., and Gong, X. (2021). Short-term Photovoltaic Power Forecasting Based on VMD and ISSA-GRU. IEEE Access 9, 105939–105950. doi:10.1109/access.2021.3099169
Jiang, S., Ji, Z., and Wang, Y. (2015). A Novel Gravitational Acceleration Enhanced Particle Swarm Optimization Algorithm for Wind-Thermal Economic Emission Dispatch Problem Considering Wind Power Availability. Int. J. Electr. Power & Energy Syst. 73, 1035–1050. doi:10.1016/j.ijepes.2015.06.014
Jin, H., Shi, L., Chen, X., Qian, B., Yang, B., and Jin, H. (2021). Probabilistic Wind Power Forecasting Using Selective Ensemble of Finite Mixture Gaussian Process Regression Models. Renew. Energy 174, 1–18. doi:10.1016/j.renene.2021.04.028
Li, J., Xu, Z., Zhao, J., and Wan, C. (2018). A Coordinated Dispatch Model for Distribution Network Considering PV Ramp. IEEE Trans. Power Syst. 33, 1107–1109. doi:10.1109/tpwrs.2017.2735901
Liu, S., Liu, P. X., and Wang, X. (2016). Stochastic Small-Signal Stability Analysis of Grid-Connected Photovoltaic Systems. IEEE Trans. Ind. Electron. 63, 1027–1038. doi:10.1109/tie.2015.2481359
Meera, P. S., and Hemamalini, S. (2021). Integrated Resource Planning for a Meshed Distribution Network under Uncertainty. Electr. Power Syst. Res. 195, 107127. doi:10.1016/j.epsr.2021.107127
Murata, A., Yamaguchi, H., and Otani, K. (2009). A Method of Estimating the Output Fluctuation of Many Photovoltaic Power Generation Systems Dispersed in a Wide Area. Elect. Eng. Jpn. 166, 9–19. doi:10.1002/eej.20723
Noori, A., Zhang, Y., Nouri, N., and Hajivand, M. (2021). Multi-Objective Optimal Placement and Sizing of Distribution Static Compensator in Radial Distribution Networks with Variable Residential, Commercial and Industrial Demands Considering Reliability. IEEE Access 9, 46911–46926. doi:10.1109/access.2021.3065883
Peng, Z., Lin, Q., and Zhao, W. (2017). Research on Evaluation Index System and Scoring Method of Distribution Network Planning. Electr. Power Energy 38, 6–12. doi:10.19783/j.cnki.pspc.200803
Rajabalizadeh, S., and Tafreshi, S. M. M. (2020). A Practicable Copula-Based Approach for Power Forecasting of Small-Scale Photovoltaic Systems. IEEE Syst. J. 14, 4911–4918. doi:10.1109/jsyst.2019.2961661
Singh, R., Pal, B. C., and Jabr, R. A. (2010). Statistical Representation of Distribution System Loads Using Gaussian Mixture Model. IEEE Trans. Power Syst. 25, 29–37. doi:10.1109/tpwrs.2009.2030271
Song, D., Pei, H., Liu, Y., Wei, H., Yang, S., and Hu, S. (2022). Review on Legislative System of Photovoltaic Industry Development in China. Energies 15, 306. doi:10.3390/en15010306
Song, W., and Zhu, J. (2021). A Goal-reference-point Decision-Making Method Based on Normal Cloud Model and its Application in Distribution Network Planning Evaluation. Inf. Sci. 577, 883–898. doi:10.1016/j.ins.2021.08.064
Visser, L. R., Schuurmans, E. M. B., AlSkaif, T. A., Fidder, H. A., van Voorden, A. M., and van Sark, W. G. J. H. M. (2022). Regulation Strategies for Mitigating Voltage Fluctuations Induced by Photovoltaic Solar Systems in an Urban Low Voltage Grid. Int. J. Electr. Power & Energy Syst. 137, 107695. doi:10.1016/j.ijepes.2021.107695
Wang, X., Sun, Y., Luo, D., and Peng, J. (2022). Comparative Study of Machine Learning Approaches for Predicting Short-Term Photovoltaic Power Output Based on Weather Type Classification. Energy 240, 122733. doi:10.1016/j.energy.2021.122733
Wu, W., Wang, K., Han, B., Li, G., Jiang, X., and Crow, M. L. (2015). A Versatile Probability Model of Photovoltaic Generation Using Pair Copula Construction. IEEE Trans. Sustain. Energy 6, 1337–1345. doi:10.1109/tste.2015.2434934
Xiang, Y., Wang, T., and Wang, Z. (2019). Improved Gaussian Mixture Model Based Probabilistic Power Flow of Wind Integrated Power System. Atlanta: IEEE Power & Energy Society General Meeting PESGM.
Xiao, D., Chen, M., and Chen, Y. (2021). Negative Sequence Current and Reactive Power Comprehensive Compensation for Freight Railway Considering the Impact of DFIGs. Cpss Tpea 6, 235–241. doi:10.24295/cpsstpea.2021.00022
Yang, X., Xu, M., Xu, S., and Han, X. (2017). Day-ahead Forecasting of Photovoltaic Output Power with Similar Cloud Space Fusion Based on Incomplete Historical Data Mining. Appl. Energy 206, 683–696. doi:10.1016/j.apenergy.2017.08.222
Yu, J., Benesty, J., and Huang, G. (2019). Daily Activity Feature Selection in Smart Homes Based on Pearson Correlation Coefficient. Int. J. Electr. Power & Energy Syst. 116. doi:10.1007/s11063-019-10185-8
Zeng, B., Li, Y., and Liu, Z. (2016). Comprehensive Evaluation Method of Environmental Benefits of Smart Distribution Network Based on Balanced Principal Component Analysis. Power Syst. Technol. 40, 396–404. doi:10.13335/j.1000-3673.pst.2016.02.010
Zhang, J., Li, X., and Pan, L. (2022). Policy Effect on Clean Coal-Fired Power Development in China. Energies 15, 897. doi:10.3390/en15030897
Zhang, K., Zhu, R., and Song, R. (2021). A Mesh Analysis Model and the Coherent Evaluation Index System for Urban Distribution Network Planning. 2021 3rd Asia Energy and Electrical Engineering Symposium. Chengdu, China: AEEES, 26–29.
Zhang, W., Chiu, Y.-B., and Hsiao, C. Y.-L. (2022). Effects of Country Risks and Government Subsidies on Renewable Energy Firms' Performance: Evidence from China. Renew. Sustain. Energy Rev. 158, 112164. doi:10.1016/j.rser.2022.112164
Zhang, Z., Chen, Y., Liu, X., and Wang, W. (2019). Two-stage Robust Security-Constrained Unit Commitment Model Considering Time Autocorrelation of Wind/load Prediction Error and Outage Contingency Probability of Units. IEEE ACCESS 7, 25398–25408. doi:10.1109/access.2019.2900254
Keywords: particle swarm algorithm, Gaussian mixture model, voltage distribution index, analytic hierarchy process, comprehensive evaluation index system
Citation: Xiao J, Ye Y, Wang F, Shen J and Gao F (2022) Comprehensive Evaluation Index System of Distribution Network for Distributed Photovoltaic Access. Front. Energy Res. 10:892579. doi: 10.3389/fenrg.2022.892579
Received: 10 March 2022; Accepted: 13 June 2022;
Published: 12 August 2022.
Edited by:
Haris M. Khalid, Higher Colleges of Technology, United Arab EmiratesReviewed by:
Yanbo Chen, North China Electric Power University, ChinaMinh Quan Duong, The University of Danang, Vietnam
Copyright © 2022 Xiao, Ye, Wang, Shen and Gao. This is an open-access article distributed under the terms of the Creative Commons Attribution License (CC BY). The use, distribution or reproduction in other forums is permitted, provided the original author(s) and the copyright owner(s) are credited and that the original publication in this journal is cited, in accordance with accepted academic practice. No use, distribution or reproduction is permitted which does not comply with these terms.
*Correspondence: Jinxing Xiao, eGlhb2ppbnhpbmcyMjMzQDE2My5jb20=