 Marthe Fogstad Dynge
 Ugur Halden
 Gro Klæboe
 Umit Cali
- Department of Electric Power Engineering, Norwegian University of Science and Technology, Trondheim, Norway
Support schemes like the Feed-in-Tariff (FiT) have for many years been an important driver for the deployment of distributed energy resources, and the transition from consumerism to prosumerism. This democratization and decarbonization of the energy system has led to both challenges and opportunities for the system operators, paving the way for emerging concepts like local energy markets. The FiT approach has often been assumed as the lower economic bound for a prosumer’s willingness to participate in such markets but is now being phased out in several countries. In this paper, a new pricing mechanism based on the Levelized Cost of Electricity is proposed, with the intention of securing profitability for the prosumers, as well as creating a transparent and fair price for all market participants. The mechanism is designed to function on a Distributed Ledger Technology-based platform and is further set up from a holistic perspective, defining the market framework as interactions in a Cyber-Physical-Social-System. Schemes based on both fixed and variable contracts with the wholesale supplier are analyzed and compared with both the conventional FiT and to its proposed replacement options. The results show a cost reduction for the consumers and a slight loss in revenue for the prosumers compared to the FiT scheme. Comparing it to the actual suggested replacements to the FiT, however, it is clear that the pricing mechanism proposed in this study provides a substantial increase of benefits for both prosumers and consumers.
1 Introduction
Along with the pressing need to mitigate climate change, the world’s energy sector is undergoing a remarkable transition. To fulfill the goal of decarbonization, as well as reaching the United Nations Sustainable Development Goal (UN SDG) #7 (access to affordable, reliable, sustainable, and modern energy for all), renewable energy sources are rapidly entering the system. The affordability of small-scale, Decentralized Energy Resourcess (DERs) is thus increasing correspondingly. With the simultaneous maturing of Information and Communication Technologies, such as Distributed Ledger Technology (DLT), previously passive consumers are able to take a more active role in the energy system, transitioning to being prosumers. This can further accelerate the enrollment of renewable energy and unlock flexibility in the distribution system for future grid planning and operation. However, the introduction of prosumers into the distribution system may lead to challenges in terms of operational stability and security, as well as social and legislative issues. To both enhance the benefits of the democratization of the energy system and to control the challenges, Local Energy Markets (LEMs) have emerged as a promising concept (Bjarghov et al., 2021; Tushar et al., 2021).
One of the key determinants of a prosumer’s willingness to participate in a LEM is the community trading price (Hahnel et al., 2020). Multiple studies have proposed different strategies for both bidding processes and the actual price setting, all including different aspects to be considered in a fair market price. In general, one can categorize the different schemes proposed in the literature into auction-based (Ghorani et al., 2018; Lin et al., 2019; Wang et al., 2020; Vieira and Zhang, 2021), optimization-based (Morstyn and McCulloch, 2019; Paudel and Gooi, 2019; Lezama et al., 2020; Morstyn et al., 2020; Ullah et al., 2020), game theory-based (Jiang et al., 2020; Fernandez et al., 2021) and cost-sharing (Long et al., 2018; Cali and Cakir, 2019; Grzanic et al., 2021) methods.
Auction-based methods rely on the active participation of each market participant by placing bids and offers to the market platform. Dynamic price adjustments are analyzed in Wang et al. (2020) and show advantages in terms of higher social welfare and reduced environmental impacts compared to other bidding strategies. Two auction mechanisms, Discriminatory and Uniform k-mean, are analyzed in Lin et al. (2019), as well as the impact of different bidding strategies. The analysis suggests that the discriminatory approach outperforms the uniform mechanism in terms of market participation, but is more sensitive to market conditions and can lead to more fluctuating trading prices. Employing a game-theoretic bidding strategy where the participants compete to bid for the best price obtains a near-optimal economic efficiency according to this analysis.
Although game-theoretic approaches have gained popularity in the literature, market participants are still required to take an active role in price-setting games. A common approach in modeling the LEM interactions are Stackelberg games, where the prosumers act as leaders and the consumers act as followers, as done in Jiang et al. (2020) and Fernandez et al. (2021). A similar game is analyzed in Anoh et al. (2020), showing higher social welfare among the market participants compared to direct Peer-to-Peer (P2P) trading. A socially optimal solution, which is also Pareto optimal, is obtained through a cake-cutting game in Tushar et al. (2017), with discriminate pricing. However, both auction-based and game theoretic market structures are high-demanding strategies in terms of participation and may seem intimidating to some agents. This can in turn discourage the establishment of LEMs.
Other pricing mechanisms use different optimization techniques to set the LEM prices implicitly, through dual prices of an optimal power flow model (Morstyn et al., 2020) or a general market clearing problem (Ullah et al., 2020). Others propose more direct price-setting optimization algorithms, like consensus-based Alternating Method of Multipliers (ADMM) (Paudel and Gooi, 2019). In Morstyn and McCulloch (2019), the LEM price is calculated based on a multi-class energy clearing problem, solved through the ADMM approach, considering the different preferences of the market participants.
In most cost-sharing methods, the community costs are distributed ex-post, and the final price is set based on different balancing criteria. The prosumers are thus considered as price-takers and cannot actively influence the LEM price. In Cali and Cakir (2019), a Supply-Demand Ratio (SDR) is calculated based on the energy balance within the community at each time step. The local trading price is linearly set between an upper and lower bound, based on this ratio. Two incentive extensions to this method are also proposed. A similar method combined with a compensation rate is analyzed by Long et al. (2018) and prosumers’ preferred level of participation is taken into account in the approach proposed by Liu et al. (2017). The SDR approach is compared with the Bill Sharing Scheme and the Mid-Market Rate in Grzanic et al. (2021), showing the disadvantages of the existing cost-sharing schemes, while proposing an improved, two-stage SDR mechanism. The same three methods are compared in Zhou et al. (2018), illustrating an outperformance of the SDR method compared to the other two in terms of the overall performance.
In this paper, the SDR pricing mechanism is further explored. With the Feed-in-Tariff (FiT) schemes being phased out in, e.g., Germany, a new limit on the minimum trading price based on the DERs’ Levelized Cost of Electricity (LCOE) is proposed to ensure both prosumer and consumer profitability. The usage of LCOE as a pricing instrument for LEMs is limited within the current literature. In Vieira and Zhang (2021), it is used together with the national grid price to form a truncated normal distribution as a basis for two different auction mechanisms. It is also used as a minimum trading price for a price matching algorithm in An et al. (2020). However, further research is required and thus the contributions of this paper are as follows:
• Rethinking the existing convention of the FiT as the lower bound of prosumers’ willingness to participate in LEMs, an LCOE-based mechanism is proposed to sustain the viability of the prosumers’ investments in production capacity.
• A fair and transparent pricing mechanism for LEMs is proposed, distributing the costs and benefits of the local energy trading based on each market participant’s contribution to the supply-demand balance.
• The impacts of the proposed LEM pricing mechanism are investigated using a techno-economic analysis from both prosumers’ and consumers’ points of view.
• Conceptualization of a potential DLT-based local energy trading platform that can use the proposed LEM pricing mechanism as an integral part.
2 Distributed Ledger Technology in Local Energy Markets
DLT can be defined as a distributed digital consensus and record-keeping system whose main purpose is to eliminate unnecessary third parties and build trust in a generally untrustful environment such as the internet. The main working principle of DLT is to allow the transactions (either of data or actual payments) to be logged, distributed and saved immutably in private, public, or hybrid networks depending on the architecture of the system. Meanwhile, for validation and authentication of these transactions, various consensus systems are utilized, with the Proof-of-Work (PoW) and Proof-of-Stake (PoS) being the most dominant ones (Andoni et al., 2019). There are various use cases within the applications of DLT in the energy sector. However, to keep this section concise, only peer-to-peer energy trading, electric vehicle charging, and payment settlement parts will be explained further as the core use cases of LEMs.
As the number of smart meters, DER, and various two-way communication equipment entering the power system keep increasing, a paradigm shift in the energy sector is inevitable. To enable this transition towards energy democratization, DLT can be utilized to remove the need for Trusted Third Parties (TTP), provide privacy towards market participants, and speed up the transaction validation times. This has further opened the possibility to form peer-to-peer markets, where smaller agents can trade energy directly between each other (Andoni et al., 2019). Several projects, albeit in the pilot phase, have developed working trading platforms with DLT and various tokens to enable this kind of direct trading (Khorasany et al., 2021)1. However, most existing projects suffer from scalability issues both in terms of DLT and physical infrastructure integration. Thus, more research needs to be performed for utilization in real-world applications.
Due to the ongoing electrification of transport and the increasing popularity of electric vehicles, the electricity and transport sectors are becoming more entangled. However, for widespread adaptation and utilization, significant barriers still exist such as unavailability or scarcity of public charging infrastructures. Additionally, the management of high-resolution data and complex transactions that need to happen and be validated as quickly as possible poses another barrier. DLT-enabled LEM networks can be utilized in this step as a charging regulator, which can perform the required power and token transactions in a fast, secure, and private way2,3.
In decentralized systems such as LEMs, ensuring a guarantee of trust between participating agents without a Trusted Third Parties (TTP) is a challenge. However, the utilization of DLT and smart contracts can be a valuable enabler for mitigating such obstacles. On top of providing trust between participants, smart contracts can be used for determining the price of the traded electricity, fulfilling agreements, and for immutable data recording. Thus, providing trust in an inherently trustless environment. Additionally, DLT and smart contracts can reduce the overhead costs of LEMs by reducing the need for excessive and expensive cyber-security measures, hence enabling very small-scale LEMs to be realized across communities.
3 Methodology
The modern energy system can be classified as a combination of cyber, physical, and social subsystems, creating a cyber-physical-social-system (CPSS), as described in Cali and Cakir (2021). The overall market framework of this paper can be explained through the interaction between these layers, illustrated in Figure 1.
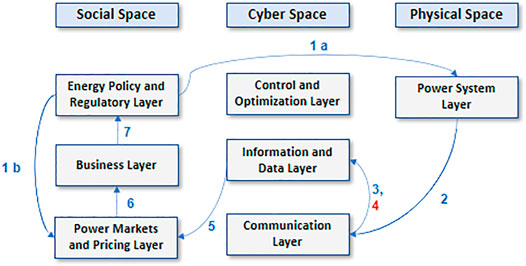
FIGURE 1. Energy CPSS Interactions of the system.
The main underlying assumption of the LEM is that necessary energy policies and regulations are in place. In that case, private households are not only allowed but encouraged through legal provisions to form transactive energy markets with their neighbors. The policies and regulations will thus influence the deployment of new physical components of the power system, such as DLT-enabled electric meters, that will be operated in the LEM and support the proposed approach (Process (1a)). They will also affect how the LEM is structured and how the local energy price will be set and communicated with the LEM participants (Process (1b)). The interaction between the CPSS layers in the operational phase is designed as follows.
Process (2). The LEM aggregator facilitates the routing of energy to satisfy the needs and preferences of the market participants, without violating the physical boundaries of the system. Smart meters provide information about generation and consumption for each market participant and communicate this information to the LEM platform.
Process(3). The information from the neighborhood smart meters is collected and processed by the LEM platform.
Process (4). DLT is used to ensure trust is built between transacting parties, generate immutable track recording, and secure sharing of information and transactions on the market platform. The fourth process of the framework is marked red to symbolize that it is not implemented in this paper’s analysis but is assumed to be in place for the real-life implementation of the LEM platform where DLT can be deployed.
Process (5). The processed data regarding the market participants’ generation and consumption profiles are retrieved by the market mechanism. The LEM price for each timestamp is then obtained. Pricing information is then sent back to the DLT network. Since this information is sensitive and not expected to overload the DLT network, such data can be stored in an on-chain database.
Process (6). Based on the pricing results, techno-economic analyses are made to investigate the economic conditions of the neighborhood, as well as the individual gains or losses as a result of participating in the LEM.
Process (7). The experience from the techno-economic evaluation may form new suggestions for policy and regulation improvements.
3.1 Replacing the Feed-in-Tariffs
Government-funded FiT schemes have for decades ensured renewable energy producers, from utility-scale to small households, a steady pay-back for their energy surplus fed back to the grid. In Germany alone, the generous scheme has contributed to the increasing share of renewable power production, from 3.5% in 1990 to 40.9% in 20214. However, as the 20-years guarantee for the pioneer installations is reaching its end, the German policymakers are intending to phase out the FiTs5. The business model replacing this scheme will be formed by 2027, and a more market-driven structure is expected. New larger scale installations have for recent years switched to auctions, where the price is set by the bidders and the maximum volume built is determined by the government. Although installations below 750 kW are still excepted from participating in the auction processes, it is expected that the remuneration price offered to prosumers, if any, for their feed-in power will stabilize around the same level as the auction prices.
3.2 Levelized Cost of Electricity
To provide incentives for both consumers and prosumers to participate in a LEM, a general assumption is that the consumer should pay a lower price for electricity than from the wholesale market, and the prosumer should get a higher price than from any other undertaker. Thus, a stable LEM could only exist if the LEM price, pt, stays within the limits of the highest price a prosumer can get, pL, and the lowest price a consumer can get, pU, outside the LEM:
Based on the current policies in most electricity markets, pL can generally be defined as the FiT. However, as Germany and other countries are phasing out the FiT scheme, another more long-term lower limit must be developed.
With no specific schemes for the retail market to procure excess energy from the neighborhood, another priority for the prosumers will be to recover their investment costs for energy resources. Thus, the LCOE is considered to be a logical new lower boundary for the LEM price as it reflects the average cost of producing power from the Photovoltaic (PV) system over its lifetime.
The main components of the LCOE are the fixed and variable costs related to investing in a PV system, divided by the total amount of electricity produced over the system’s lifetime, as represented in Eq. 2. I0 denotes the initial investment expenditures, An is the fixed and variable costs for the year n and Mn,el is the total electricity generated by the system in year n. R represents the weighted average cost of capital. The Capital Expenditures (CAPEX) related to the initial investment costs of the system is defined by Eq. 3.
Here, CE denotes the equipment costs per kWp, CDl and CIl are the direct and indirect labor costs, whereas Cp represents the project permission costs and CO the overhead costs such as project administration. PVcap is the installed PV capacity.
The variable costs are represented by the Operational Expenditures (OPEX). These are costs related to the annual operation and maintenance throughout the lifetime of the system. In general, the OPEX account for a much smaller percentage than the CAPEX (Vartiainen et al., 2020). The LCOE value is naturally individual for each of the LEM prosumers. The LCOE value referred to further in this study is thus assumed to be the average across the market participants, for simplicity.
3.3 Supply-Demand Ratio
The proposed pricing mechanism in the following sections is a modification and improvement of the method introduced by Cali and Cakir (2019). The overall concept is to let the ratio between supply and demand in the LEM determine the local trading price, and thus distribute the costs in accordance with each market participant’s contribution to the LEM.
The total surplus in the neighborhood, and thus the amount available for local trade, is calculated based on each market participant’s net surplus after ensuring its self-consumption. Hence, the surplus is defined as the difference between the amount generated by agent i in timestep t, git, and the load of the same agent in said timestep lit, as described in (4).
The net demand of the neighborhood is similarly defined in (5) as the net demand of agent i in timestep t after consuming its self-generated power.
The SDR further used as a base for the local energy trading price is then defined in (6) as the ratio between the total surplus and demand in the neighborhood.
3.4 Pricing Scheme
The overall pricing mechanism proposed in this study is described by the flowchart in Figure 2. The grey boxes represent the steps involved in the core concept, meaning that they are involved regardless of the different variations later described. The green and blue boxes represent the scenario-dependent components, related to the scenarios described in Section 4. In addition to this, two variations within the “Local Energy Pricing” box are proposed in this study and will be further explained in the following subsections.

FIGURE 2. Flowchart of overall pricing mechanism.
3.4.1 Fixed Upper and Lower Price Thresholds
In markets where prosumers are offered a fixed price for their surplus and most consumers are assigned to fixed-price contracts, a stable LEM situation can be obtained if
Under this criterion, there will be incentives for both consumers and prosumers to participate in the LEM as well as investing in new generation capacity.
When there is no surplus in the market, hence rt = 0, all remaining demand must be covered by purchasing from the wholesale market. Thus, the LEM price equals its upper limit, pt = pU, the wholesale energy price.
With 0 < rt < 1, the demand in the neighborhood can be partially covered by local surplus. When there is a limited surplus, the LEM price tends towards the upper limit pU.
On the other end, when the local surplus almost covers the entire demand, the LEM price orients towards the lower selling limit. By the balancing criterion in (7), this should equal the LCOE when rt < 1.
On sunny days with low demand, situations can occur where the surplus exceeds the demand in the neighborhood, hence rt > = 1. In these cases, the abundant power will be sold to the utility and the net consumers in the neighborhood can procure power locally for the same price. Thus, the LEM price equals pt = pL.
The final LEM price could thus be defined by a convex combination of the LCOE and pU as long as the market is not fully saturated, as well as collapsing to pL when the LEM is saturated.
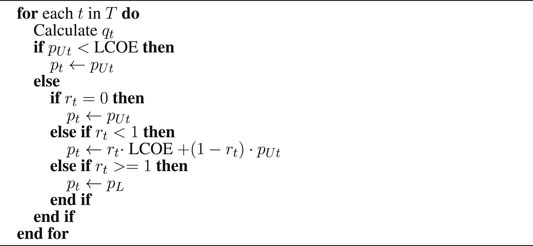
3.5 Dynamic Upper and Fixed Lower Price Thresholds
In some areas, it is more common for end-users to choose variable pricing contracts. This variable price can be based on the wholesale electricity market price, where the consumer pays a markup to buy power from the grid from a supplier. Similarly, the wholesaler deducts a margin from the spot price to make a margin on the marketing of local production. We can then define a time-variable upper threshold for the LEM as follows:
where μcons is the mark-up of the wholesaler and αt is the time-dependent wholesale electricity price. The lower threshold, pL is fixed and is here defined as the price a prosumer would get if selling its surplus to the utility.
With dynamic pricing thresholds and as DERs struggles to reach total grid parity in many countries, situations may occur where pUt < LCOE. Provided that pUt > 0, the prosumer would still prefer to sell for this price within the LEM, as it would be more profitable than curtailing without any storage options. If pUt < 0, it is assumed that the prosumers can curtail their excess production, rather than paying the utility. While LCOE
Algorithm 1. Algorithm for LEM pricing scheme with dynamic thresholds.
3.6 Cost-Benefit Analysis
To evaluate the advantages of the proposed pricing mechanisms, a cost-benefit analysis of both the total market costs and the individual benefits was conducted. As with the LEM price itself, the costs are distributed differently depending on the SDR, rt. When 0 < rt ≤ 1, all surplus energy is traded within the LEM, and the consumers cover the remaining demand by procuring from the utility. Hence, the total neighborhood cost for each time step is defined as
Here, Pt is defined as the set of prosumers in timestep t in the LEM, whereas Ct is the set of consumers in timestep t. If the LEM is saturated, i.e., rt > 1, all electricity demand in the neighborhood would be covered by locally traded energy, sold by the local trading price, pt.
This total cost is distributed among the market participants based on their share of the total energy requirement in the neighborhood.
Applying the definition of rt and ct, this can be reformulated to
Both the total cost ct and the individual cost cit are defined as pure procurement costs and do not account for the prosumers’ revenue for selling their surplus. This revenue is distributed post-trade depending on each prosumer’s contribution to the supply-demand balance in the LEM at each time step and the LEM trading price at that hour. When rt > 0, all surplus is sold through the LEM for the local price.
The individual prosumer’s revenue is distributed post-trade depending on its contribution to the total surplus in the LEM, in the same manner as the procurement costs.
By using the definition of both rt and yt, (17) can be reformulated to
The net cost of the prosumers is subsequently defined as
4 Local Electricity Market Structure and Analyzed Scenarios
To analyze the effects of the pricing strategies proposed in this paper, a virtual LEM platform was designed. The market consists of 10 participants, randomly assigned the role of prosumers and consumers. The structure and distribution of PVs are illustrated in Figure 3. As illustrated in Figure 3, both energy and data are exchanged both internally in the LEM and with entities outside. When the LEM is saturated, prosumers can sell their excess surplus to the utility through the LEM platform. From a longer-term perspective, policymakers evolve their policies regarding LEMs through data collected from the LEM platform.
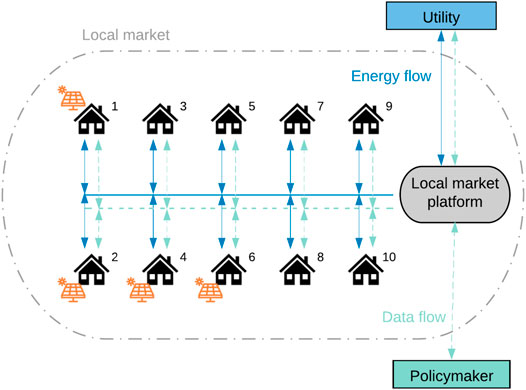
FIGURE 3. Illustration of the analyzed local market.
For this particular case study, artificial load profiles with hourly granularity for each of the market participants were generated with the open-source Artificial Load Profile Generator developed by (Hoogsteen, 2017). PV production time-series were retrieved through the open-source tool Renewables Ninja (Pfenninger and Staffell, 2016), which generates profiles for a given geographical area based on the meteorological database NASA MERRA-2 (Rienecker et al., 2011). The coordinates of Freiburg im Breisgau were used to estimate the yearly PV production series of a neighborhood in Southern Germany.
Pricing strategies for end-users assigned to fixed price and dynamic price contracts are analyzed in this study. In this case, the fixed utility price is set to 30.46 €/MWh, according to German levels of 2019 (BDEW, 2022). The LEM price thresholds in the dynamic case are based on the wholesale electricity market price, in this case, set to the spot price of Germany in 2019 (Fraunhofer ISE, 2022b). The supplier markup for consumers, μcons, is set to equal 10% of the spot price.
The novel proposal of this study is the usage of LCOE in the LEM price setting. However, for benchmarking purposes, scenarios with the FiT in the place of the LCOE value for both pricing mechanisms are analyzed. The FiT value is set to 6 €/MWh following German rates (Morris, 2019) in 2019. The LCOE is set to equal 8 €/MWh, as calculated for German PV systems subject to a 4% interest rate in (Halden et al., 2021). This is in accordance with the range between 6 and 11 €/MWh found by Fraunhofer ISE (Kost et al., 2021) for small PV rooftops systems in Germany in 2021. In the cases where LCOE is used, pL is defined as the average auction value that is offered outside the LEM and is set to equal 5 €/MWh (Morris, 2019). Following the flowchart in Figure 2, Scenario 1 refers to the cases where the FiT is used, for both fixed and dynamic pricing thresholds. Scenario 2 refers to the usage of LCOE.
5 Results
To capture seasonal variations in the SDR profile, hourly simulations for an entire year were executed for all cases. To illustrate how the SDR varies over time, the hourly values for March are shown in Figure 4. It is clear that the rt > 1 condition occurs quite frequently, indicating a slight overscaling of the number of prosumers in the neighborhood.
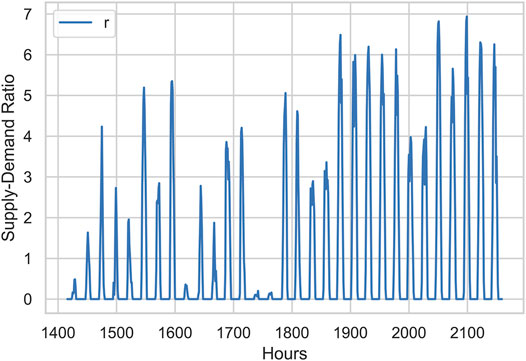
FIGURE 4. SDR, rt, in March.
As the scenarios with fixed and dynamic LEM pricing thresholds are not directly comparable, they will be presented in separate sections.
5.1 Fixed Pricing Thresholds
Firstly, the scenarios with fixed pricing thresholds are analyzed. The resulting LEM prices for each hour of the simulated year are sorted in descending order and plotted for the two different scenarios to form a duration curve in Figure 5. Based on the curve’s characteristics, it is clear that the LEM is operative for almost half of the year. As the LCOE is slightly higher than the FiT, the LEM price is marginally higher while rt < 1. When the market is saturated, the LEM price collapses to either equal the FiT or the auction price, and thus the prices in the LCOE-based scenario are lower. The declining curve between the upper and lower bound is quite steep, indicating that the market is mostly saturated when it is active, in accordance with the SDR levels in the sample period in March in Figure 4.
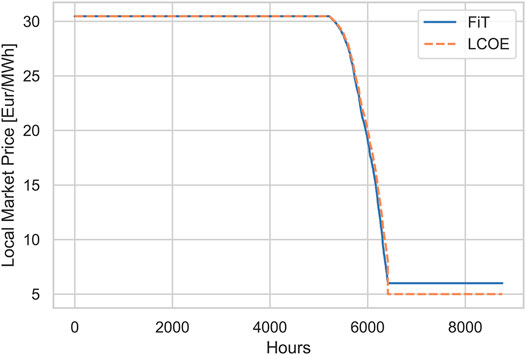
FIGURE 5. Duration curves of the local energy market prices for the scenarios with fixed utility price.
Zooming in on the chosen day in March, one can further observe the daily differences between the two pricing schemes, respectively named “FiT Fixed” and “LCOE Fixed” in Figure 6. The fluctuations between the upper and lower bound in the middle of the day when the LEM is operative are showcased. Even though the price never reaches the lower bound for any of the scenarios for this day, it is still evident that the scheme using the LCOE as the lower bound pushes the LEM prices down compared to the FiT scheme.
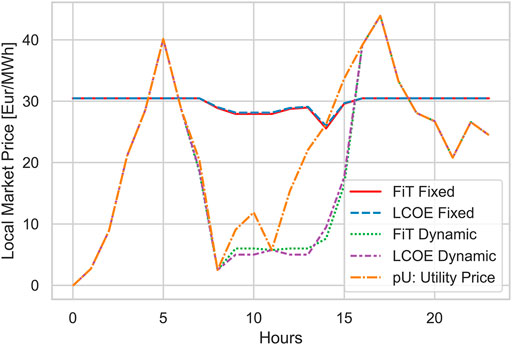
FIGURE 6. Comparison of LEM price for a day in March obtained for all the simulated scenarios.
The daily average LEM prices are shown for each month for the case using the FiT and fixed pricing thresholds in Figure 7A. The center of gravity of the violins in the plots indicates the frequency of the daily average value for each month, and the white dot represents the monthly average price. As the only DER within the LEM is rooftop solar, one can observe that the average prices are lower during summer, due to the amount of surplus in the neighborhood and thus when the rt > 1 condition is occurring. However, the monthly average is lower than the utility price even in the winter months. This means that there is an activity in the LEM all year, despite the season-dependent generation capacity. Examining the average prices of the LCOE scenario, illustrated in Figure 7B, the LEM prices are shifted downward, reaching a daily average of around 18 €/MWh in mid-summer, whereas, the FiT scenario delivers higher minimum LEM prices of around 19 €/MWh during summer. The violins are also more stretched in the LCOE scenario, with the highest average at the same value as for the FiT scenario for almost all months, mainly due to the same SDR effects. It also indicates that the LEM prices become more volatile using LCOE.
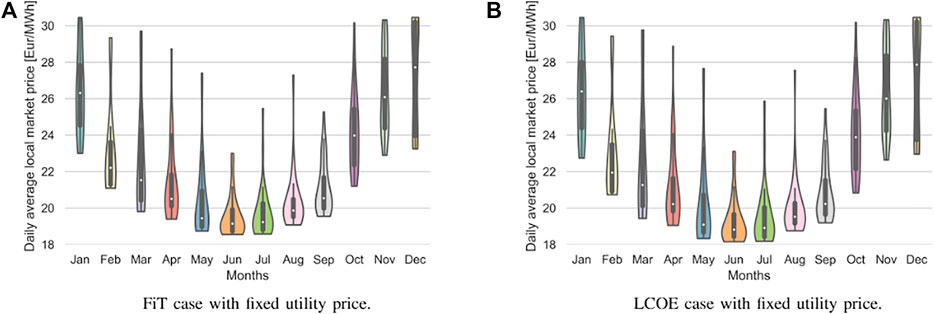
FIGURE 7. Comparison of the daily average LEM prices for each month for the (A) FiT scenario and (B) LCOE scenario with fixed utility price.
5.2 Dynamic Pricing Thresholds
The duration curve for the LEM price with dynamic pricing thresholds is depicted in Figure 8. Similar to the scenarios with fixed pricing thresholds, the LCOE scenario generates slightly lower local prices while the LEM is active. With the volatile wholesale prices, the LEM now experiences negative prices. As stated in Section 3.5, these prices only indicate the buying price from the wholesale market, as the prosumers curtail their excess production in these hours.
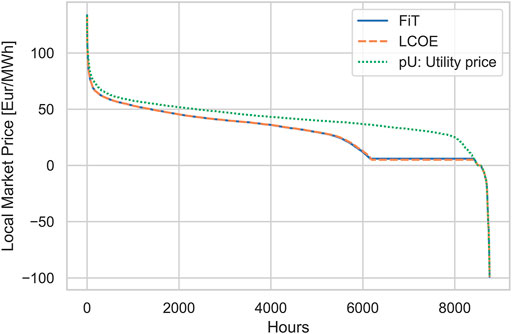
FIGURE 8. Duration curves of the LEM prices for the scenarios with dynamic pricing thresholds.
Figure 6 shows a snapshot of the LEM variations of a day in March with the two scenarios with dynamic pricing thresholds, represented by “FiT Dynamic” and “LCOE Dynamic”, compared to the supplier price pUt. Both scenarios generate lower prices than the supplier can offer when the LEM is active. Even though the prices in both scenarios converge to approximately the same level, it is clear that the LCOE scenario mostly obtains the lowest prices. As the auction price, pL, is lower than the FiT value the prices are lower in the LCOE scenario when the market is saturated. When 0 < rt < 1, between timestep 13 and 15 in Figure 6, the prices of the LCOE scenario reaches a slightly higher value than in the FiT scenario, as LCOE
The combined effect of LCOE and pL can be further confirmed by studying Figure 9, where one can still observe slightly lower values for the LCOE scenario compared to the FiT scenario for all months of the year. Because of the volatile utility price, 4 days of the year even experience negative daily average prices in both scenarios.
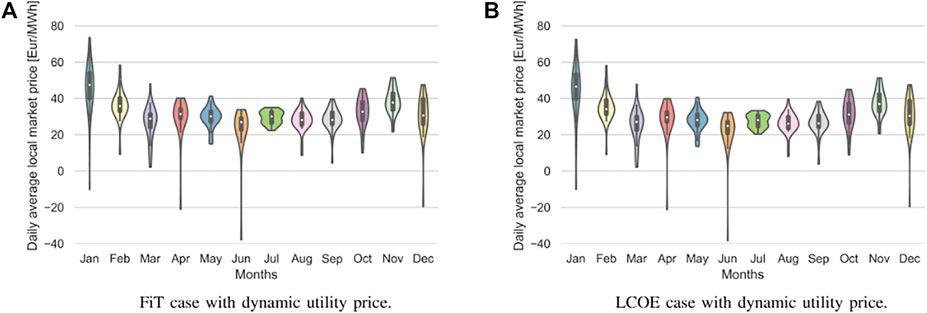
FIGURE 9. Comparison of the daily average LEM prices for each month for the (A) FiT scenario and (B) LCOE scenario with dynamic utility price.
5.3 Cost-Benefit Analysis
To estimate the full impact of the proposed pricing schemes on both prosumers and consumers participating in the LEM, a cost-benefit analysis was conducted. The individual net costs of each of the market participants for each of the analyzed scenarios are illustrated in Figure 10. Now, the scenarios of the case study are also compared to their respective base scenarios. These are cases where there are no LEM in place. Hence, the prosumers are only able to sell their surplus to the price offered by the retailer; the FiT, or the auction price, and the consumers must cover their demand through the utility. Thus, for both the fixed and dynamic pricing cases, the net cost of the consumers equals the cost of procuring all energy for the utility price and is the same for both the FiT and the auction alternative. As the auction price is lower than the FiT, the net costs of the prosumers are higher for the “Base Auction” scenario than for the “Base FiT” for both the fixed and dynamic cases.
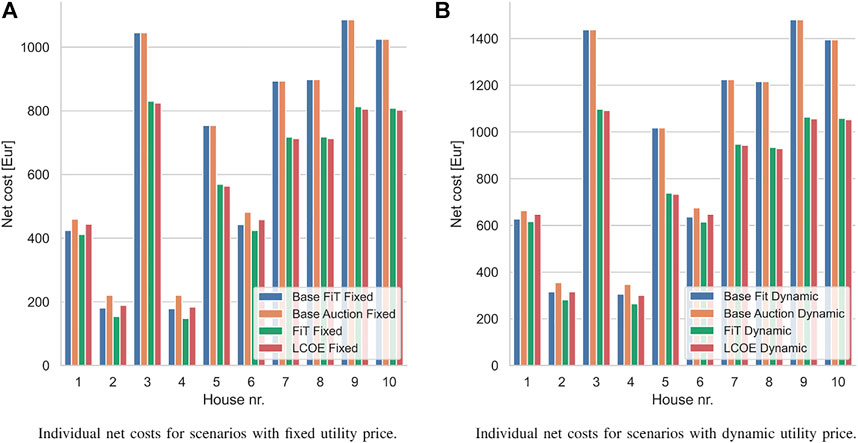
FIGURE 10. Net costs of all market participants for (A) scenarios with fixed utility price and (B) scenario with dynamic utility price.
Looking at the LEM scenarios, one can observe that the net costs are higher with the LCOE scenarios for all prosumers (house nr. 1, 2, 4, and 6), but lower for all consumers. This is true for both the fixed and dynamic pricing threshold alternatives. Here, it should be noted that the correlation between the pL and LCOE value, and the utility prices, will depend on the energy mix of the larger electricity market. Although solar power is yet to become a dominant source in the German energy mix, with a share of 8.6% in 2019 (Fraunhofer ISE, 2022a), one can expect that it will become increasingly influential on the electricity price in the future. It can thus be reasoned that if the PV generation is high within the LEM, it will also be high in the wholesale electricity market. Then, a correlation between the LEM prices and the utility price is created, such that the utility price will be lower when rt is high. In this study, historical data for Germany for both pricing and production was used, and the correlation between the two is implicitly considered.
The overall costs and revenues for the entire neighborhood subject to fixed pricing thresholds are listed in Table 1. Extracting the costs of the consumers, a slight cost reduction is observed, with 0.8% lower costs than with the FiT scheme. It is also clear that the lower local prices obtained through the LCOE scenario are less beneficial for the prosumers, with a revenue reduction of 13%. However, comparing the LCOE scheme with the alternative base scenario, where prosumers only get paid the auction value for their surplus, the prosumers’ revenue is increased by 14%. With an additional 22% reduction in consumer costs, it is clear that using the proposed LCOE pricing scheme through a LEM setup is much more beneficial for both prosumers and consumers than the originally proposed replacement of the FiT scheme. Lastly, looking at the neighborhood as a whole, the aggregated net costs with fixed pricing are summarized in the last row of Table 1. With the decrease in prosumer revenue in the LCOE scenario, the total net cost is 1.8% higher than with the FiT scenario, correlating with the individual values in Figure 10. Compared to the base scenario with auctions, the total net cost of the neighborhood is reduced by 20%.
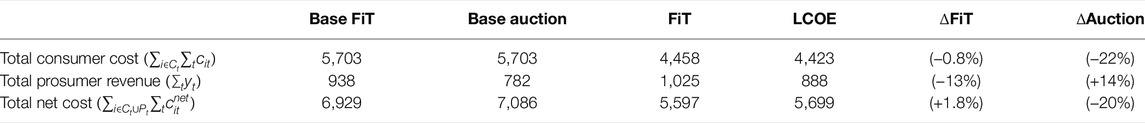
TABLE 1. Total procurement costs with fixed pricing thresholds, in €.
For the scheme with a dynamic upper pricing threshold, the same effect can be observed for both consumers and prosumers, as demonstrated in Table 2. The differences between the LEM scenarios are almost the same as for the fixed pricing threshold cases. The benefits are, however, even more, substantial for the LCOE scheme compared to the base auction scenario. It is important to emphasize that the FiT scenarios in this study are not an alternative as this scheme is being phased out, and is solely used to benchmark the new, proposed pricing mechanism. As auctions are one of the solutions being suggested as a replacement of the FiT scheme by German policymakers, the comparison to this scenario is much more relevant. Similar results can also be observed when compared to other alternatives to the FiT, like the Smart Export Guarantees (SEGs) introduced in the United Kingdom. Where the FiTs were paid out by the government, the SEGs are tariffs offered by electricity suppliers for excess power fed by DER owners into the grid 6. The tariff is guaranteed to be above zero but is currently placed between 3 and 5 €/kWh, depending on the supplier. With a similar LCOE level as Germany (Halden et al., 2021), one could expect the same or even higher benefits for the LEM participants using the LCOE scheme, as compared to the German auction scenario.
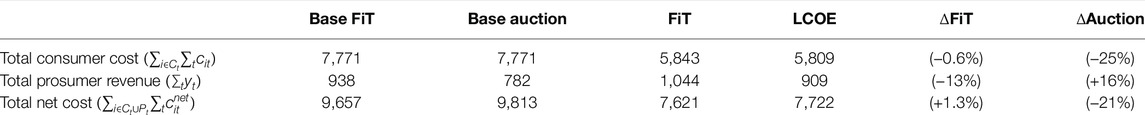
TABLE 2. Total procurement costs with dynamic pricing thresholds, in €.
5.4 Sensitivity Analysis
To analyze the actual impact of the SDR on the LEM price, a sensitivity analysis was conducted by varying the amount of surplus in the neighborhood. Additional simulations were thus performed, increasing the number of prosumers for each time.
House 3 retains the role of a pure consumer for all simulations. Its net costs, depending on the number of prosumers in the neighborhood, are plotted in Figure 11. The alternatives of procuring everything for both the fixed and dynamic utility prices are also plotted for comparison. In general, the consumer costs decrease as more surplus becomes available in the LEM. For both schemes based on fixed and dynamic pricing thresholds, the LCOE scenario generates the lowest net costs for the consumers, independent of the market saturation. The difference between the LCOE and FiT scenario increase along with the increasing surplus.
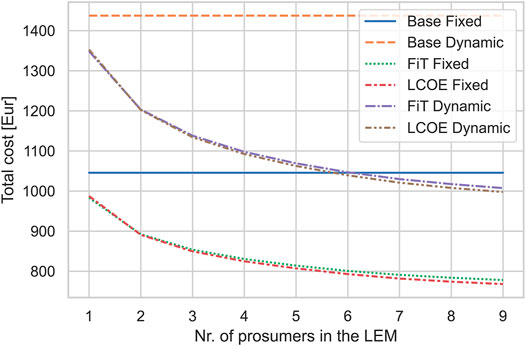
FIGURE 11. Annual cost for Consumer 3, depending on number of prosumers in the neighborhood.
House 1 acts as a prosumer in all simulated cases with increasing numbers of prosumers in the LEM. Its total revenue is depicted in Figure 12. As the electricity consumption of the neighborhood remains the same for all cases, one would expect that each prosumer’s revenue would decrease when more surplus becomes available in the market. Accordingly, it is clear from Figure 12, that the prosumer revenue in all the LEM cases converges towards the base scenarios where all surplus is sold for the price offered by the utility. With six or more prosumers in this particular neighborhood, the market reaches its saturation point; in other words, rt > 1 frequently with more than three prosumers. This means that the demand of the neighborhood is covered, and the prosumers often sell the remaining surplus to the utility. As both the FiT and pL value used in this study is lower than the LCOE, the viability of the prosumers’ DER investments is then hard to maintain. Thus, the incentives of becoming a prosumer under these LEM conditions are diminishing. With the additional decreasing cost for the consumers, however, one can also assume that it becomes more attractive to join the LEM as a consumer, stabilizing the supply-demand balance in the neighborhood.
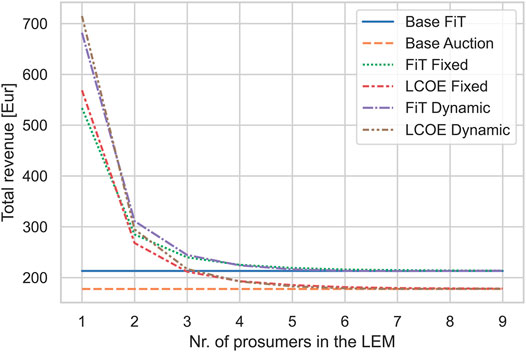
FIGURE 12. Annual revenue for Prosumer 1, depending on the number of prosumers in the neighborhood.
In Germany, it is estimated that a regular household owning a PV system, consumes 20%–40% of their self-generated electricity (Wirth, 2021). In all simulated scenarios, around 52% of the PV power was sold to the utility, regardless of the LEM pricing scheme. This indicates that with a LEM in place, more locally generated electricity remains within the neighborhood. Thus, in terms of increasing self-consumption and activating the LEM, prosumers would benefit from installing batteries. This could also postpone the saturation point observed in Figure 12, as the surplus available in the LEM can be more evenly distributed across the day. Then, the attractiveness of investing in DER equipment with several prosumers already in the market is restored. As the pricing scheme replacing the FiT is yet to be determined it is also worth noting that the price offered by the utility to buy surplus from the prosumers can be affected by the availability of storage. With a high amount of unpredictable PV power being delivered from the LEM, the utility may end up having to settle a lot in the balancing and intraday market, and may thus be less willing to offer a good price for the surplus. Predictability and flexibility can then be of higher value.
6 Conclusion
To promote LEMs as an attractive option to take an active role in the energy system for end-users, a transparent and fair pricing mechanism for locally traded energy must be established. With the phase-out of the FiT and similar support schemes, other methods to ensure the profitability of participating in local flexibility activities must be redesigned. The average LCOE value of the LEM is proposed in this paper, showing promising results in terms of cost reductions for the consumers in the market. Comparing the new LCOE convention with the existing FiT scheme, the prosumers’ revenue is decreased. However, comparing it to the auction alternative, both consumers and prosumers experience substantially higher benefits. This finding can also be utilized by policymakers to incentivize the decarbonization, decentralization, and democratization through LEMs in areas with a high penetration level of DERs, and thus further contribute to UN SDG #7. Hence, the proposed pricing mechanism requires sophistication, with track recording of parameters like the SDR, rt, dynamically, while also ensuring information security for the participating agents. DLT is thus highlighted as one of the most promising digitalization technologies to provide a functional solution to realize such next-generation energy policy and LEM mechanisms. Still, the proposed pricing scheme is easy to grasp for its users, and will likely be perceived as fair by the market participants, as the costs and benefits are distributed according to actual contribution to the market. Further improvements of the method should involve the inclusion of energy storage technology and how it influences both the LCOE value and the strategic behavior of the market agents. Implementation of machine learning techniques for prediction of the dynamic pricing bounds should then be considered.
Data Availability Statement
The original contributions presented in the study are included in the article/supplementary materials, further inquiries can be directed to the corresponding author.
Author Contributions
MD contributed toward conceptualization, methodology, software, data curation, and writing—original draft. UH contributed toward writing—original draft. GK contributed toward methodology and writing—original draft. UC contributed toward supervision, conceptualization, methodology and writing—original draft.
Conflict of Interest
The authors declare that the research was conducted in the absence of any commercial or financial relationships that could be construed as a potential conflict of interest.
The reviewer FC declared a shared affiliation with the author(s) to the handling editor at the time of review.
Publisher’s Note
All claims expressed in this article are solely those of the authors and do not necessarily represent those of their affiliated organizations, or those of the publisher, the editors and the reviewers. Any product that may be evaluated in this article, or claim that may be made by its manufacturer, is not guaranteed or endorsed by the publisher.
Footnotes
1IEEE Spectrum (2018). Startup Profile: ME SOLshare’s “Swarm Electrification” Powers Villages in Bangladesh. https://spectrum.ieee.org/startup-profile-me-solshares-swarm-electrification-powers-villages-in-bangladesh [Accessed 13 February 2022].
2WePower (2022). WePower: Secure energy buyers faster and cheaper. https://wepower.com/project-owners.html [Accessed 13 February 2022].
3Besnainou, J (2018). Autonomous datasets and v2x transactions: Blockchain in mobility pilots getting traction. https://www.cleantech.com/autonomous-datasets-and-v2x-transactions-blockchain-in-mobility-pilots-getting-traction/[Accessed 13 February 2022].
4AGEB - AG Energiebilanzen e.V. (2021). Electricity generation by energy sources (electricity mix) from 1990 to 2021 (in TWh) Germany as a whole (in German). https://ag-energiebilanzen.de/wp-content/uploads/2021/02/Strommix-Dezember2021.pdf [Accessed 8 March 2022].
5Appunn, K. and Wehrmann, B (2019). Germany 2021: when fixed feed-in tariffs end, how will renewables fare? - Energy Post. https://energypost.eu/germany-2021-when-fixed-feed-in-tariffs-end-how-will-renewables-fare/[Accessed 7 February 2022].
6Office of Gas and Electricity Markets (Ofgem) (2022). Smart Export Guarantee (SEG). https://www.ofgem.gov.uk/environmental-and-social-schemes/smart-export-guarantee-seg [Accessed 26 April 2022].
References
An, J., Lee, M., Yeom, S., and Hong, T. (2020). Determining the Peer-To-Peer Electricity Trading Price and Strategy for Energy Prosumers and Consumers within a Microgrid. Appl. Energy 261, 114335. doi:10.1016/J.APENERGY.2019.114335
Andoni, M., Robu, V., Flynn, D., Abram, S., Geach, D., Jenkins, D., et al. (2019). Blockchain Technology in the Energy Sector: A Systematic Review of Challenges and Opportunities. Renew. Sustain. Energy Rev. 100, 143–174. doi:10.1016/J.RSER.2018.10.014
Anoh, K., Maharjan, S., Ikpehai, A., Zhang, Y., and Adebisi, B. (2020). Energy Peer-To-Peer Trading in Virtual Microgrids in Smart Grids: A Game-Theoretic Approach. IEEE Trans. Smart Grid 11, 1264–1275. doi:10.1109/TSG.2019.2934830
BDEW (2022). BDEW-strompreisanalyse Januar 2022. [Dataset]. Available at: https://www.bdew.de/service/daten-und-grafiken/bdew-strompreisanalyse/(Date Accessed 2 25, 2022).
Bjarghov, S., Loschenbrand, M., Ibn Saif, A. U., Alonso Pedrero, R., Pfeiffer, C., Khadem, S. K., et al. (2021). Developments and Challenges in Local Electricity Markets: A Comprehensive Review. IEEE Access 9, 58910–58943. doi:10.1109/ACCESS.2021.3071830
Cali, U., and Cakir, O. (2019). Energy Policy Instruments for Distributed Ledger Technology Empowered Peer-To-Peer Local Energy Markets. IEEE Access 7, 82888–82900. doi:10.1109/ACCESS.2019.2923906
Cali, U., and Cakir, O. (2021). Novel Donation Sharing Mechanisms under Smart Energy Cyber-Physical-Social System and DLT to Contend the Energy Poverty Problem. IEEE Access 9, 127037–127053. doi:10.1109/ACCESS.2021.3106833
Fernandez, E., Hossain, M. J., Mahmud, K., Nizami, M. S. H., and Kashif, M. (2021). A Bi-level Optimization-Based Community Energy Management System for Optimal Energy Sharing and Trading Among Peers. J. Clean. Prod. 279, 123254. doi:10.1016/J.JCLEPRO.2020.123254
Fraunhofer ISE (2022a). Renewable Shares - Energy-Charts. [Dataset] (Date Accessed 2 7, 2022). Available at: https://energy-charts.info/charts/renewable\_share/chart.htm?l=en&c=DE&share=solar\_share&interval=year.
Fraunhofer ISE (2022b). Spot Market Prices - Energy-Charts. [Dataset] (Date Accessed 2 7, 2022). https://energy-charts.info/charts/price\_spot\_market/chart.htm?l=en&c=DE&year=2019&stacking=stacked\_absolute\_area&interval=year&legendItems=000001.
Ghorani, R., Fotuhi-Firuzabad, M., and Moeini-Aghtaie, M. (2018). Optimal Bidding Strategy of Transactive Agents in Local Energy Markets. IEEE Trans. Smart Grid 10, 5152–5162. doi:10.1109/TSG.2018.2878024
Grzanic, M., Morales, J. M., Pineda, S., and Capuder, T. (2021). Electricity Cost-Sharing in Energy Communities under Dynamic Pricing and Uncertainty. IEEE Access 9, 30225–30241. doi:10.1109/ACCESS.2021.3059476
Hahnel, U. J., Herberz, M., Pena-Bello, A., Parra, D., and Brosch, T. (2020). Becoming Prosumer: Revealing Trading Preferences and Decision-Making Strategies in Peer-To-Peer Energy Communities. Energy Policy 137, 111098. doi:10.1016/j.enpol.2019.111098
Halden, U., Cali, U., Dynge, M. F., Stekli, J., and Bai, L. (2021). DLT-based Equity Crowdfunding on the Techno-Economic Feasibility of Solar Energy Investments. Sol. Energy 227, 137–150. doi:10.1016/J.SOLENER.2021.08.067
Hoogsteen, G. (2017). A Cyber-Physical Systems Perspective on Decentralized Energy Management. Enschede, Netherlands: University of Twente. Ph.D. thesis. doi:10.3990/1.9789036544320
Jiang, Y., Zhou, K., Lu, X., and Yang, S. (2020). Electricity Trading Pricing Among Prosumers with Game Theory-Based Model in Energy Blockchain Environment. Appl. Energy 271, 115239. doi:10.1016/J.APENERGY.2020.115239
Khorasany, M., Dorri, A., Razzaghi, R., and Jurdak, R. (2021). Lightweight Blockchain Framework for Location-Aware Peer-To-Peer Energy Trading. Int. J. Electr. Power Energy Syst. 127, 106610. doi:10.1016/j.ijepes.2020.106610
Kost, C., Shammugam, S., Fluri, V., Peper, D., Memar, A. D., and Schlegl, T. (2021). Levelized Cost of Electricity - Renewable Energy Technologies. Freiburg, Germany: Fraunhofer Institute for Solar Energy Systems ISE.
Lezama, F., Faia, R., Soares, J., Faria, P., and Vale, Z. (2020). “Learning Bidding Strategies in Local Electricity Markets Using Ant Colony Optimization,” in 2020 IEEE Congress on Evolutionary Computation, CEC 2020 - Conference Proceedings, Glasgow, UK, July 19–24, 2020. doi:10.1109/CEC48606.2020.9185520
Lin, J., Pipattanasomporn, M., and Rahman, S. (2019). Comparative Analysis of Auction Mechanisms and Bidding Strategies for P2P Solar Transactive Energy Markets. Appl. Energy 255, 113687. doi:10.1016/j.apenergy.2019.113687
Liu, N., Yu, X., Wang, C., Li, C., Ma, L., and Lei, J. (2017). Energy-Sharing Model with Price-Based Demand Response for Microgrids of Peer-To-Peer Prosumers. IEEE Trans. Power Syst. 32, 3569–3583. doi:10.1109/tpwrs.2017.2649558
Long, C., Wu, J., Zhou, Y., and Jenkins, N. (2018). Peer-to-peer Energy Sharing through a Two-Stage Aggregated Battery Control in a Community Microgrid. Appl. Energy 226, 261–276. doi:10.1016/J.APENERGY.2018.05.097
Morris, C. (2019). Community Energy in germany - More than Just Climate Change Mitigation. Berlin, Germany: Renewable Energy Agency.
Morstyn, T., and McCulloch, M. D. (2019). Multiclass Energy Management for Peer-To-Peer Energy Trading Driven by Prosumer Preferences. IEEE Trans. Power Syst. 34, 4005–4014. doi:10.1109/TPWRS.2018.2834472
Morstyn, T., Teytelboym, A., Hepburn, C., and McCulloch, M. D. (2020). Integrating P2P Energy Trading with Probabilistic Distribution Locational Marginal Pricing. IEEE Trans. Smart Grid 11, 3095–3106. doi:10.1109/TSG.2019.2963238
Paudel, A., and Gooi, H. B. (2019). “Pricing in Peer-To-Peer Energy Trading Using Distributed Optimization Approach,” in IEEE Power and Energy Society General Meeting, Atlanta, GA, 2019-August, 8–12. doi:10.1109/PESGM40551.2019.8973868
Pfenninger, S., and Staffell, I. (2016). Long-term Patterns of European PV Output Using 30 Years of Validated Hourly Reanalysis and Satellite Data. Energy 114, 1251–1265. doi:10.1016/J.ENERGY.2016.08.060
Rienecker, M. M., Suarez, M. J., Gelaro, R., Todling, R., Bacmeister, J., Liu, E., et al. (2011). MERRA: NASA’s Modern-Era Retrospective Analysis for Research and Applications. J. Clim. 24, 3624–3648. doi:10.1175/JCLI-D-11-00015.1
Tushar, W., Yuen, C., Smith, D. B., and Poor, H. V. (2017). Price Discrimination for Energy Trading in Smart Grid: A Game Theoretic Approach. IEEE Trans. Smart Grid 8, 1790–1801. doi:10.1109/TSG.2015.2508443
Tushar, W., Yuen, C., Saha, T. K., Morstyn, T., Chapman, A. C., Alam, M. J. E., et al. (2021). Peer-to-peer Energy Systems for Connected Communities: A Review of Recent Advances and Emerging Challenges. Appl. Energy 282, 116131. doi:10.1016/J.APENERGY.2020.116131
Ullah, M. H., Alseyat, A., and Park, J. D. (2020). “Distributed Dynamic Pricing in Peer-To-Peer Transactive Energy Systems in Smart Grid,” in IEEE Power and Energy Society General Meeting, Montreal, QC, 2020-August, 1–5. doi:10.1109/PESGM41954.2020.9282113
Vartiainen, E., Masson, G., Breyer, C., Moser, D., and Román Medina, E. (2020). Impact of Weighted Average Cost of Capital, Capital Expenditure, and Other Parameters on Future Utility-Scale PV Levelised Cost of Electricity. Prog. Photovoltaics Res. Appl. 28, 439–453. doi:10.1002/pip.3189
Vieira, G., and Zhang, J. (2021). Peer-to-peer Energy Trading in a Microgrid Leveraged by Smart Contracts. Renew. Sustain. Energy Rev. 143, 110900. doi:10.1016/J.RSER.2021.110900
Wang, Z., Yu, X., Mu, Y., and Jia, H. (2020). A Distributed Peer-To-Peer Energy Transaction Method for Diversified Prosumers in Urban Community Microgrid System. Appl. Energy 260, 114327. doi:10.1016/j.apenergy.2019.114327
Wirth, H. (2021). Recent Facts about Photovoltaics in Germany Version of May 15, 2021. Freiburg, Germany: Fraunhofer ISE.
Keywords: cyber-physical-social-systems, distributed ledger technology, electricity pricing, levelized cost of electricity, local energy markets
Citation: Dynge MF, Halden U, Klæboe G and Cali U (2022) LCOE-Based Pricing for DLT-Enabled Local Energy Trading Platforms. Front. Energy Res. 10:901009. doi: 10.3389/fenrg.2022.901009
Received: 21 March 2022; Accepted: 30 May 2022;
Published: 11 July 2022.
Edited by:
Nasibeh Zohrabi, Penn State University, United StatesReviewed by:
Valentin Robu, Centrum Wiskunde & Informatica, NetherlandsFerhat Ozgur Catak, Norwegian University of Science and Technology, Norway
Mostafa Zaman, Virginia Commonwealth University, United States
Copyright © 2022 Dynge, Halden, Klæboe and Cali. This is an open-access article distributed under the terms of the Creative Commons Attribution License (CC BY). The use, distribution or reproduction in other forums is permitted, provided the original author(s) and the copyright owner(s) are credited and that the original publication in this journal is cited, in accordance with accepted academic practice. No use, distribution or reproduction is permitted which does not comply with these terms.
*Correspondence: Marthe Fogstad Dynge, bWFydGhlLmYuZHluZ2VAbnRudS5ubw==