 Li Tong
 Jinhui Zhou
- Electric Power Research Institute of State Grid Zhejiang Electric Power Co., Hangzhou, China
In order to improve the operational safety and market operation efficiency of the prosumer energy community, to achieve comprehensive monitoring of abnormalities, fault alarms, and intelligent control and maintenance, to reduce the risk of information security, and to address the many types of operational testing and metering equipment in the prosumer community, the duplication of functions and hardware composition was performed, resulting in the waste of resources of monitoring and metering equipment. In the meantime, we proposed an intelligent perception device-based IoT platform architecture for power distribution communities by integrating the software and hardware of the original operation monitoring and metering equipment of the prosumer-integrated communities. The intelligent perception device for community IoT sensing was first introduced, and then, the operation monitoring and metering equipment in the distribution station area was integrated and optimized to enhance the panoramic state sensing capability of the intelligent terminal; the expansion application direction of data-driven distribution IoT was proposed from the typical application scenario of the terminal.
1 Introduction
In the context of the era of energy structure change, low-carbon transformation of electricity, and the sweeping digital wave (Bedi et al., 2018), the distribution network will enter a new development stage of integrated energy multi-energy complementarity (Bera et al., 2015) and deep information-physical integration (Zhao et al., 2020). The explosive growth of power information requires a more lightweight data management framework (Moness and Moustafa, 2016); the rapid expansion of emerging businesses requires a more open application structure (Huang et al., 2021), and the real-time complementarity of spatial-temporal energy requires decentralized coordination means (Chan et al., 2017). All the aforementioned applications rely on the completeness of panoramic data sensing capability (Primadianto and Lu, 2017).
Due to the rapid expansion of prosumer clusters, the planning and operation issues of prosumer energy systems have been increasingly raised (Huang et al., 2019). In view of the urgent demand for energy infrastructure and energy management in the producer–consumer energy community and in order to make full use of the capabilities of the producer-consumer, this study proposes an IoT platform architecture scheme based on smart fusion terminals for producer–consumer status data monitoring, energy management, and control (Pineda and Morales, 2019).
The cloud center is responsible for data mining and advanced business processing, and the edge computing terminal is responsible for data collection and local processing to meet the real-time requirements of business, and the cloud-edge collaboration mechanism provides an effective solution for in-depth analysis of power big data (Ciavarella et al., 2016). The low-voltage distribution community actively carries out applications such as station operation status monitoring, camping and distribution data interaction, and new energy coordination and control through station area intelligent perception devices based on real-time status data collection to achieve observable and controllable operation status of the low-voltage distribution network, which provides strong support for lean control of the distribution network (Wen et al., 2019).
2 Intelligent Perception Device
The intelligent perception device is a secondary device integrating electricity consumption information collection, equipment operation status monitoring, intelligent control, and communication, which meets the requirements of basic operation information monitoring and analysis, power quality monitoring, station area demand-side management, low-voltage distribution network operation and maintenance control, information model standardization, multi-master station terminal cooperative control, information security, and operation and maintenance of low-voltage station areas. The intelligent distribution station area is based on the intelligent perception device as the core, supporting intelligent low-voltage equipment in order to support the new energy cooperative control business requirements of low-voltage distribution (Gunduz and Jayaweera, 2018).
The intelligent perception device needs to be designed with the following functions:
1) It should meet the concentrator metering accuracy and security requirements.
2) It should realize the management and operation and maintenance of distribution transformers, especially including electrical monitoring and data statistical analysis of distribution transformers, and provide data for the distribution automation system to realize transformer management and operation and maintenance.
3) Implementation of station area status information monitoring: status detection of station area main equipment such as distribution transformers and intelligent distribution units, equipment fault prediction, and intelligent station area operation and maintenance.
4) Monitoring and fault judgment of low-voltage lines in the station area: electrical measurement of low-voltage lines in the station area; low-voltage line topology management; voltage line loss analysis; low-voltage line fault judgment and fault self-healing to improve power supply reliability; and technical support for low-voltage line fault detection, fault operation, and maintenance.
The intelligent perception device is designed to consist of three basic functional units, namely, a metering unit, a management unit, and an extension module (Meier et al., 2017), and different extension hardware units are configured according to the different needs of the actual application scenarios to combine to form the specific hardware units of the terminal to meet the needs of the application scenarios and then fuse the APP with corresponding functions to jointly realize the operation monitoring and metering functions required by the application scenarios (Zhang and Yağan, 2020).
As shown in Figure 1, the modular intelligent perception device is mainly composed of three basic functional units, namely, the metrology unit, management unit, and extension module.
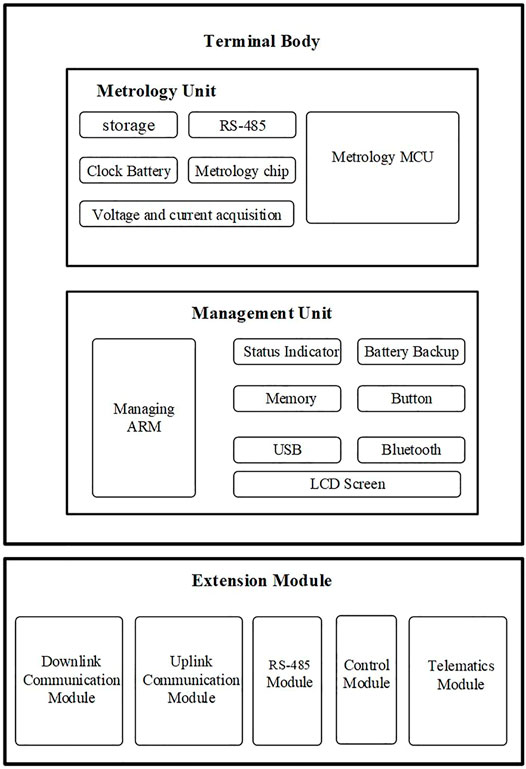
FIGURE 1. Hardware structure of an intelligent perception device.
In the intelligent perception device, the metrology unit and the management unit are integrated on the same circuit board, which together constitute the core body of the hardware part of the terminal, but they are divided into different areas to ensure mutual independence in hardware composition between them. Meanwhile, between the metrology unit and the management unit, strict data interaction and clock synchronization can be achieved through a dual-channel hardware interface and a flexible and highly flexible software protocol. The expansion module, on the other hand, is installed in the modular intelligent perception device shell in the form of an expansion slot but is installed separately from the circuit boards of the metrology unit and the management unit; in specific applications, downlink communication modules, uplink communication modules, control modules, RS-485 modules, and telematics modules can be inserted into the expansion slot, according to the actual application scenarios of the terminal, to meet the functional requirements of terminal communication, load control, distribution indoor environmental status monitoring, and equipment switching status acquisition, etc. This enables the intelligent perception device to be configured more flexibly and thus expands the applicability or universality of the terminal.
3 IoT Platform Architecture for Low-Voltage Distribution Stations
3.1 Analysis of the Current Situation of Smart Terminal Data Collection
The overall topology of the LV distribution IoT is shown in Figure 2, where RF indicates radio frequency, RS-485 is the communication interface, and M-BUS is the bus communication. The 10 kV busbar is stepped down through the transformer in the station area and passes through frame circuit breaker—LV busbar—cable branch box—meter box—customer meters in turn, to the low-voltage customer load. The branch box terminal and table box terminal collect the switching status and AC sampling information of the plastic case circuit breaker in the box, respectively, and each terminal realizes automatic identification of low-voltage topology by pulse current injection. The table box terminal can monitor user outage information in real time and upload it to the main station of the distribution cloud. By establishing the communication mechanism between I-type concentrator and fusion terminal, the data such as voltage, current data, daily freeze, and meter file are realized in situ, and the broadband power line carrier (High Power Line Carrier, HPLC) smart meter outage information is uploaded to the main station of the power distribution cloud without delay.
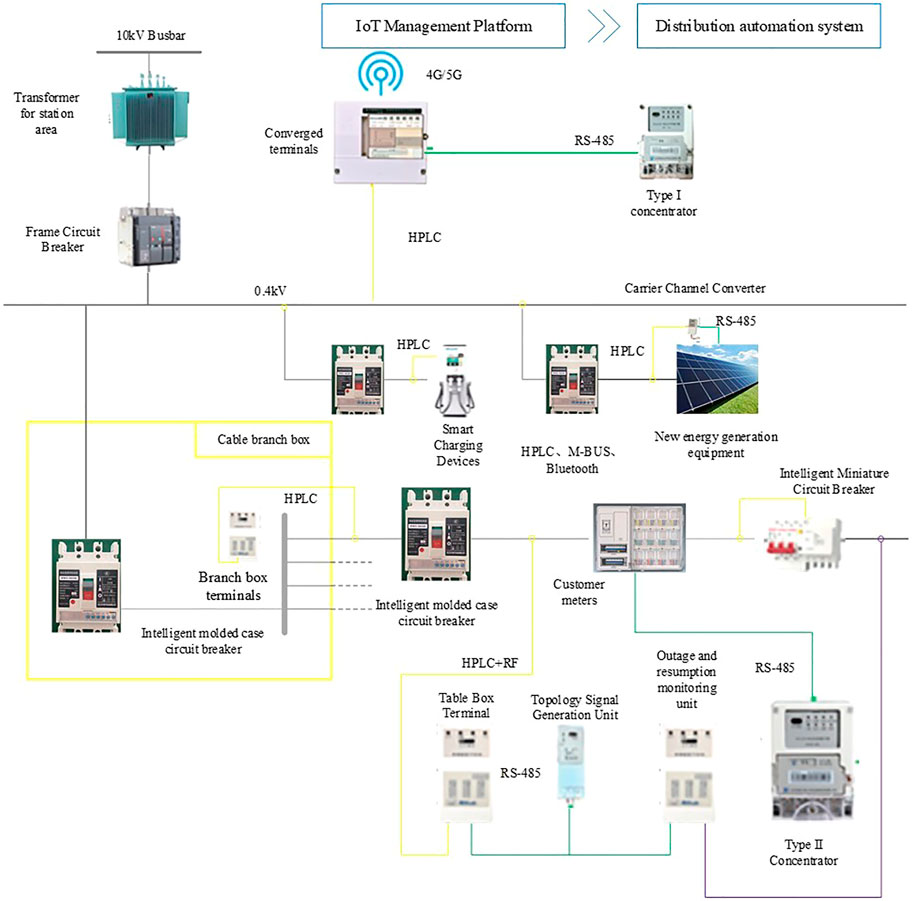
FIGURE 2. Overall topology of the low-voltage station.
As the edge computing node of LV distribution IoT, the fusion terminal is the carrier and key link of “self-organization of data at the edge end and self-cooperation of business at the edge cloud” (Zhu et al., 2017), which realizes the decoupling of hardware platform and software function of the intelligent terminal in the station area. On the bottom, edge computing nodes and end devices achieve edge-side collaboration through data exchange, support end-to-edge plug-and-play access and achieve full data collection, full awareness, and full control (Kalyanaraman, 2016); on the top, edge computing nodes and cloud master stations interact in real time to achieve edge-cloud collaboration, support edge-to-cloud self-registration and new application (application, APP) virtual terminal access to the cloud, and reduce the pressure of cloud data processing. It also reduces the pressure of data processing in the cloud and achieve station autonomy (Gu et al., 2017).
The fusion terminal generally uses two communication methods: RS-485 serial port and HPLC broadband carrier, for the lower layer devices, and the upper layer interacts with the cloud master through a 4G communication module for data interaction. The fusion terminal acquisition APP collects data from lower layer multifunctional meters, electronic-molded case circuit breakers, residual current protectors, concentrators, end terminals, smart capacitors, surge protectors, etc. The list of fusion terminal acquisition APP is shown in Table 1.
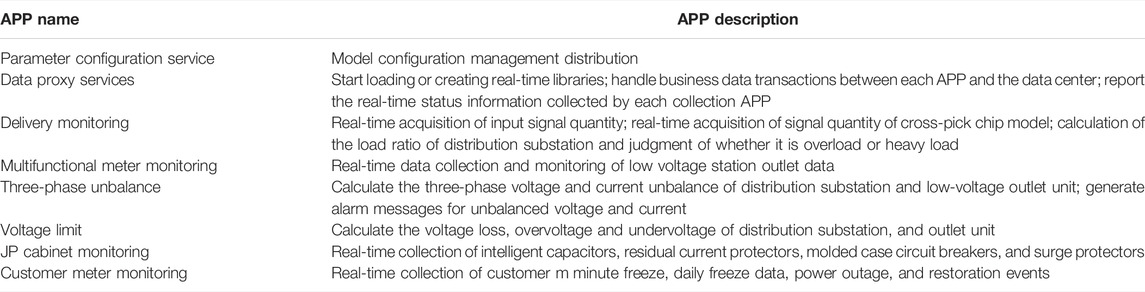
TABLE 1. Fusion terminal APP.
There are two pilot schemes for marketing side energy meter data uploading to the main station of the distribution cloud. Scheme 1: type I concentrator + end sense module + Type II concentrator +485 energy meter; scheme 2: Type I concentrator + HPLC smart energy meter. The two schemes are shown in Figure 3 and Figure 4, respectively.
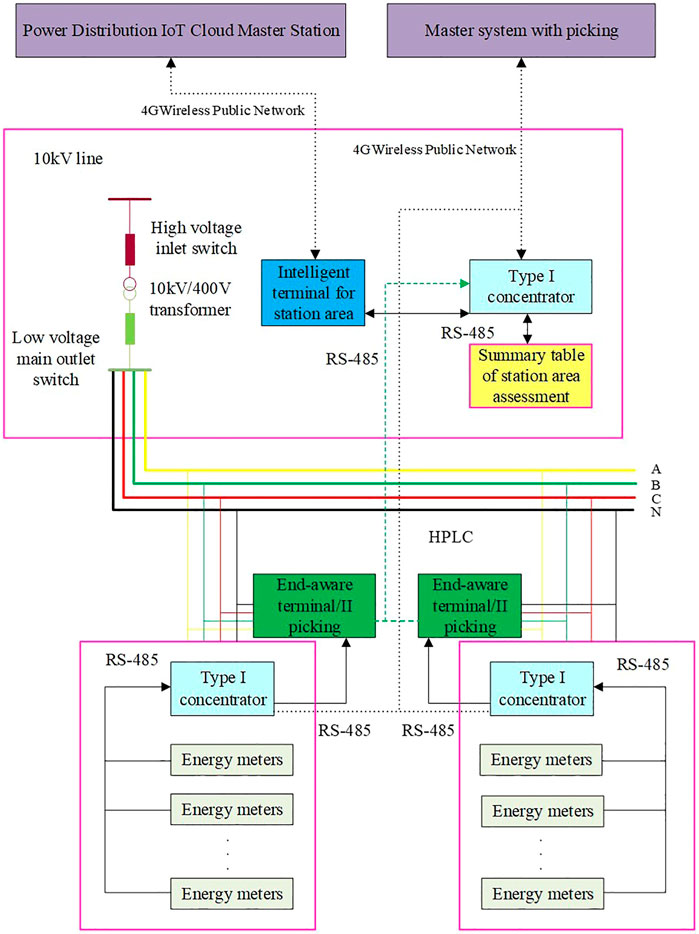
FIGURE 3. Scheme 1 interaction architecture.
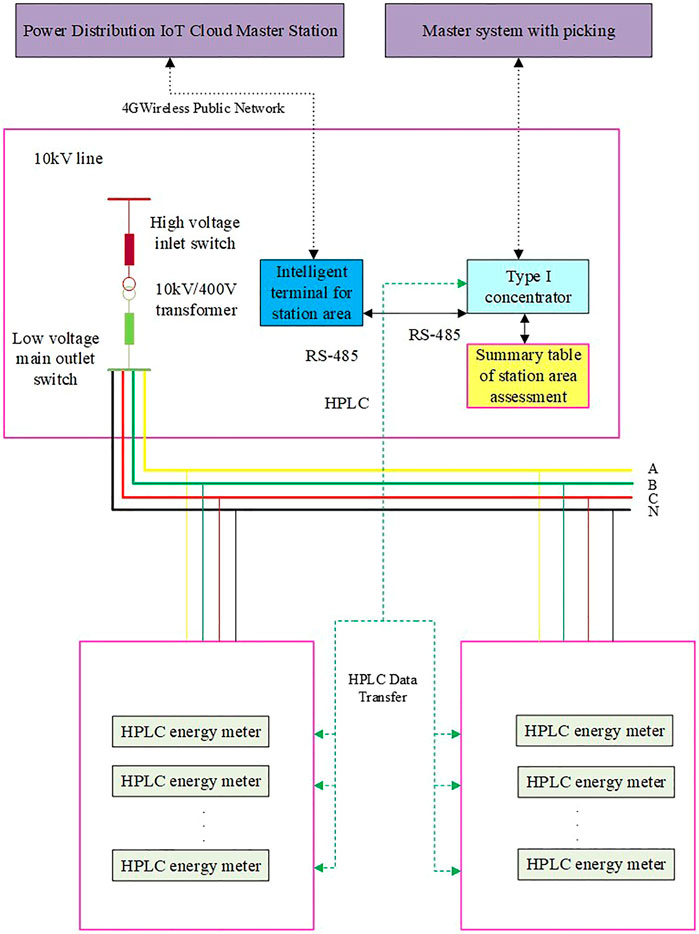
FIGURE 4. Scheme 2 interaction architecture.
Option 1: the end sensing unit should be installed at type II concentrator, meter data should be read, and the collected data should be transmitted to type I concentrator via a broadband carrier (HPLC), while type I concentrator uploads electricity and other data directly to the main picking station through the 4GVPN private network and interacts with the fusion terminal through RS-485. The fusion terminal uploads the data to the main station of the power distribution cloud through the 4GVPN network.
Option 2: The type I concentrator and the carrier meter should use the HPLC communication method to communicate, and the data interaction should follow the object-oriented DL/T698.45 protocol or DL/T645-2007 protocol. The fusion terminal communicates with the fusion terminal via RS-485. The fusion terminal uploads the data to the main station of the distribution network cloud through the 4G VPN network.
In view of the current status of data collection and data interaction in the low-voltage station area, considering the current technology application and construction cost, the dual-mode communication network of “HPLC power carrier + micro-power wireless” is built to standardize the standardized physical connection of distribution equipment, reduce the redundancy of collection devices, improve the sensitivity of data transmission in the low-voltage station area, and further improve the regional source, network, and load information perception of low-voltage side equipment status, customer load, distributed energy, etc. Using the value of data fusion, the cloud master station is built into a decision support center for low-voltage energy Internet operation in Shandong. The optimized low-voltage station topology architecture is shown in Figure 5. According to this technical scheme, plastic case circuit breakers, residual current protectors, and other low-voltage intelligent circuit breakers are used, and there is no need to install corresponding line current transformers and corresponding collection sub-terminals. Their operation information can be directly sent to the fusion terminal through the embedded communication module, and the stop and resume information of HPLC meters on the customer side can be sent to the fusion terminal in real time through the I-type concentrator.
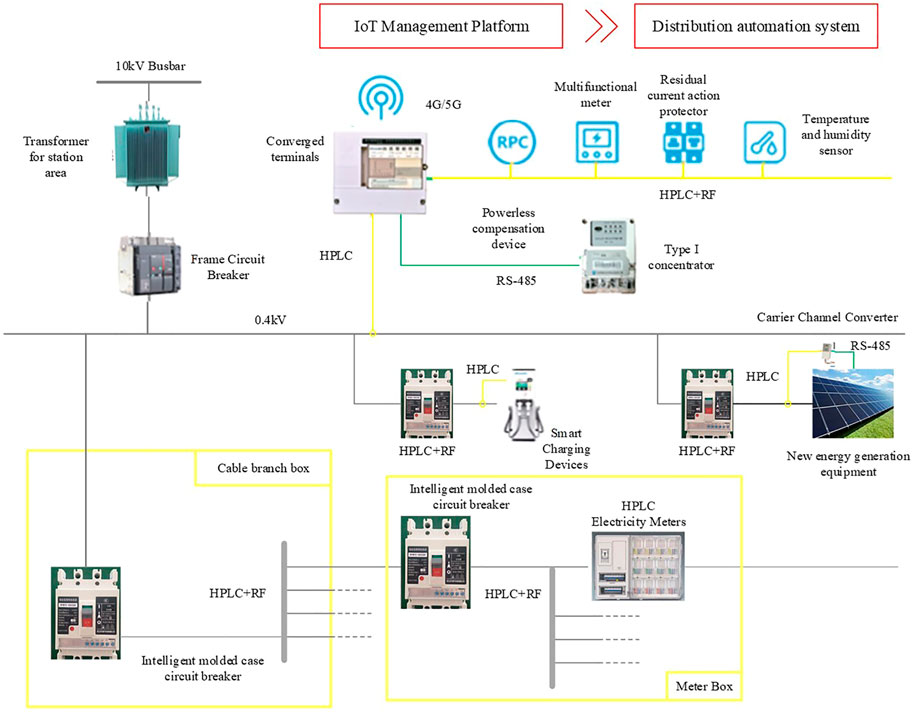
FIGURE 5. Optimized low-voltage station topology.
4 Typical Scenario Application of Data-Driven Distribution IoT
4.1 Typical Application
Following the architecture of the distribution community IoT platform, the construction of distribution IoT application scenarios based on station area intelligent perception devices is carried out, guided by the application requirements in the distribution of electricity. From the perspective of professional application of distribution network equipment, the data application of the station area intelligent perception device is divided into three categories according to scenarios: lean operation and inspection of distribution network equipment, quality service for marketing customers, and new energy consumption and new load management.
1) Lean operation and inspection of distribution network equipment improves the station area operation monitoring capability
In addition to the traditional monitoring on the station side, it also extends to the low-voltage line side and customer side, accessing about 200 devices in total. On the basis of the extended scope, the data collection frequency has been comprehensively improved, and low-voltage alarm information can be obtained in seconds in key areas and within 1–5 min in other areas, and the collection cycle of normal data is compressed to within 15 min.
2) Marketing high-quality customer service improves business response capability
At the cloud master station level, compared to the traditional master station function update that brings system downtime and a lot of site preparation, the cloud-based migrated microservice system only needs to upgrade the corresponding module without affecting other business functions, and the system upgrade frequency is shortened from monthly or annual to daily or weekly; at the edge node level, the station area intelligent perception device provides real-time computing, storage, and communication mechanisms at the site level, and the application encapsulates a large number of basic functions. The edge APP also further reduces the difficulty of developing and deploying business functions and improves the efficiency of implementation and application, and the terminal function upgrade is also changed from on-site module plugging and unplugging to remote zero-contact APP download mode, and the software update time can be shortened to 1 min.
3) New energy consumption and new load management to improve source-grid-load-storage coordination
Through the station area intelligent perception device to monitor the status of PV grid connection points, track and study the characteristics of distributed power supply, analyze and evaluate the impact of low-voltage distributed PV power supply grid connection on low-voltage distribution lines, optimize distributed energy layout, and improve the distribution network’s ability to accept distributed power supply. In addition, it can also promote the orderly charging of electric vehicles and the optimization of charging pile deployment. Based on the time-sharing tariff, user application charging mode, and predicted load curve, a variety of optimal charging strategies are generated to guide users to choose the appropriate charging mode, to maximize charging benefits, and achieve the requirements of grid peak and valley elimination.
4.2 Extended Application
4.2.1 Internal Industrial Economic Chain of the Power Grid Industry
For the internal industries of the power grid industry, the large-scale application of intelligent sensing of distribution networks and the Internet of Things network provides a large data resource library for building an ecological chain of the power industry. The development trend of transparent and digital operations of low-voltage distribution networks promotes traditional equipment. The innovation of intelligent perception and on-site decision-making of electric power equipment, combined with accurate prediction of load in the station area based on feature recognition, provide a data foundation for meeting customers’ personalized, diversified, and intelligent service needs, grid structure, current situation of facilities and equipment, and power consumption scale. The in-depth integration of data such as distributed power generation and distributed power supply provide decision support for scientific planning and precise investment of the distribution network (Ceylan et al., 2020).
Through the Internet of Things transformation and construction of lines and pipelines, the intelligent perception and decision-making capabilities of traditional power equipment will be improved, the labor intensity of production personnel and the cost of equipment installation, operation, and maintenance will be reduced, the intelligent level of equipment manufacturing and the automation level of power distribution, operation, and inspection will be promoted, and a new type of power system will be established. The industrial ecological chain of transformation, upgrading, and intelligent integration of primary power distribution equipment.
Based on terminal equipment such as new smart meters with non-intrusive power load identification, low-voltage user load identification information is obtained and sent to the cloud master station. Based on the user’s various load access periods, average power consumption, and time-of-use electricity price policy, the cloud master station will push the user’s electricity behavior adjustment and electricity saving suggestions to the user in the form of text messages, ensuring personalized and comprehensive services and demand for intelligent services. Scientific planning and precise investment of the distribution network. The edge-to-edge holographic sensing data should be utilized, regional grid structure, current facilities and equipment, weak links in distribution network, power consumption scale, load distribution, and other situations should be combined, and flexible and economical distribution network planning and investment plans in the cloud should be intelligently formulated to achieve scientific planning and precise investment in distribution networks.
4.2.2 Support Economic Development and Social Services
For economic development and social services, the construction of the physical grid of the distribution network and the construction of the Internet of Things network provide a physical platform and an information channel for the construction of a regional energy Internet that integrates electricity, gas, heat, and cold comprehensive energy (Du et al., 2020). The social service capability and the unique spatiotemporal perception attribute of the social electricity consumption data on the distribution network provide decision support for judging economic operation trends, formulating pollution prevention and control plans, analyzing the effectiveness of strategies to improve people’s livelihoods, and preventing and controlling power financial risks energy platform construction and comprehensive service expansion. In the process of planning, design, construction, and operation of various energy supply systems such as power supply, gas supply, cooling supply, and heating supply, relying on the platform and channel of the ubiquitous power Internet of things on the equipment side and the distribution side, all kinds of energy organically coordinate and optimize the distribution, transformation, storage, consumption and other links; realize load forecasting; equipment management; information management; power distribution operation and maintenance; and demand response to provide effective decision-making support services to meet the diversification of energy supply and service diversification. Diversified customer needs for energy use and the operation mode and technology are required to maximize the utilization of energy resources.
Value sharing of power distribution data should be determined. Based on big data collection, processing, analysis, visualization, and other technologies in enterprises, it deeply mines the value of data, such as social electricity consumption, and provides rich data support for economic analysis, energy conservation and environmental protection, protection of people’s livelihoods, and financial investment (Zeraati et al., 2018). The first is to study and judge the trend of economic operation; make full use of the value of data; analyze the economic development trend from multiple perspectives such as industry, industry, and large-scale users; optimize the regional industrial structure; and promote the healthy development of the regional economy according to local conditions. The second is to assist in the formulation of pollution prevention and control plans and analyze the improvement index of heavy pollution elements in the production of enterprises based on the change in electricity consumption of key pollution prevention and control enterprises so as to help the new trend of green development in all walks of life. The third is to support the improvement of people’s livelihood efficiency analysis, track the changes in electricity consumption of small and medium-sized enterprises, the vacancy rate of residential areas, the benefit of electricity from machine wells, coal-to-electricity poverty alleviation, photovoltaic income, and other people’s livelihood data, and analyze the transformation of new and old kinetic energy, poverty alleviation effectiveness, rural revitalization, and other strategies. Provide computing data support for government departments. The fourth is to prevent and control financial investment risks. According to the data of enterprises’ electricity consumption fluctuations, electricity consumption trends, electricity consumption differences, and industry electricity consumption comparison analysis, we analyzed the credit level of enterprises and provided financial investment services, energy insurance services, credit services, etc. Financial services such as services provide data support.
5 Conclusion
This study proposes IoT platform architecture for power distribution communities based on intelligent perception devices. First, the concept and functional units of intelligent perception devices are introduced. Second, the operation monitoring and metering equipment in the distribution station area are integrated and optimized to improve the panoramic state perception capability of intelligent terminals. Finally, starting from the typical application scenarios of terminals, the intelligent perception devices in station areas are developed based on the construction of power distribution IoT application scenarios.
Data Availability Statement
The raw data supporting the conclusion of this article will be made available by the authors, without undue reservation.
Author Contributions
The individual contributions of the authors are as follows: article frame and supervision, JZ; methodology and editing, LT; data curation, JL. All authors have read and agreed to the published version of the manuscript.
Funding
This study received funding from The Science and Technology Project of State Grid Zhejiang Electric Power Co., Ltd. (5211DS200084). The funder was not involved in the study design, collection, analysis, interpretation of data, the writing of this manuscript, or the decision to submit it for publication.
Conflict of Interest
Authors LT, JZ, and JL are employed by the Electric Power Research Institute of State Grid Zhejiang Electric Power Co., Ltd.
Publisher’s Note
All claims expressed in this article are solely those of the authors and do not necessarily represent those of their affiliated organizations, or those of the publisher, the editors, and the reviewers. Any product that may be evaluated in this article, or claim that may be made by its manufacturer, is not guaranteed or endorsed by the publisher.
References
Bedi, G., Venayagamoorthy, G. K., Singh, R., Brooks, R. R., and Wang, K.-C. (2018). Review of Internet of Things (IoT) in Electric Power and Energy Systems. IEEE Internet Things J. 5 (2), 847–870. doi:10.1109/JIOT.2018.2802704
Bera, S., Misra, S., and Rodrigues, J. J. P. C. (2015). Cloud Computing Applications for Smart Grid: A Survey. IEEE Trans. Parallel Distrib. Syst. 26 (5), 1477–1494. doi:10.1109/TPDS.2014.2321378
Ceylan, O., Taşkin, G., and Paudyal, S. (2020). “A Comparative Study of Surrogate Based Learning Methods in Solving Power Flow Problem,” in : 2020 IEEE Power & Energy Society General Meeting (PESGM)), 1–5. doi:10.1109/pesgm41954.2020.9281640
Chan, S. H., Wang, X., and Elgendy, O. A. (2017). Plug-and-Play ADMM for Image Restoration: Fixed-Point Convergence and Applications. IEEE Trans. Comput. Imaging 3 (1), 84–98. doi:10.1109/TCI.2016.2629286
Ciavarella, S., Joo, J.-Y., and Silvestri, S. (2016). Managing Contingencies in Smart Grids via the Internet of Things. IEEE Trans. Smart Grid 7 (4), 2134–2141. doi:10.1109/TSG.2016.2529579
Du, Y., Wang, Y., and Xu, Y. (2020). “Convexity Analysis and Linear Approximation of Voltage Magnitude - Power Injection Mapping for Distribution Systems with Unknown Parameters,” in 2020 IEEE Sustainable Power and Energy Conference (iSPEC). doi:10.1109/ispec50848.2020.9350986
Gu, L., Zeng, D., Guo, S., Barnawi, A., and Xiang, Y. (2017). Cost Efficient Resource Management in Fog Computing Supported Medical Cyber-Physical System. IEEE Trans. Emerg. Top. Comput. 5 (1), 108–119. doi:10.1109/TETC.2015.2508382
Gunduz, H., and Jayaweera, D. (2018). Reliability Assessment of a Power System with Cyber-Physical Interactive Operation of Photovoltaic Systems. Int. J. Electr. Power & Energy Syst. 101, 371–384. doi:10.1016/j.ijepes.2018.04.001
Huang, G., Wang, J., Chen, C., and Guo, C. (2019). Cyber-Constrained Optimal Power Flow Model for Smart Grid Resilience Enhancement. IEEE Trans. Smart Grid 10 (5), 5547–5555. doi:10.1109/TSG.2018.2885025
Huang, S., Wu, Q., Liao, W., Wu, G., Li, X., and Wei, J. (2021). Adaptive Droop-Based Hierarchical Optimal Voltage Control Scheme for VSC-HVdc Connected Offshore Wind Farm. IEEE Trans. Ind. Inf. 17 (12), 8165–8176. doi:10.1109/TII.2021.3065375
Kalyanaraman, S. (2016). Back to the Future: Lessons for Internet of Energy Networks. IEEE Internet Comput. 20 (1), 60–65. doi:10.1109/MIC.2016.19
Moness, M., and Moustafa, A. M. (2016). A Survey of Cyber-Physical Advances and Challenges of Wind Energy Conversion Systems: Prospects for Internet of Energy. IEEE Internet Things J. 3 (2), 134–145. doi:10.1109/JIOT.2015.2478381
Pineda, S., and Morales, J. M. (2019). Solving Linear Bilevel Problems Using Big-Ms: Not All that Glitters Is Gold. IEEE Trans. Power Syst. 34 (3), 2469–2471. doi:10.1109/TPWRS.2019.2892607
Primadianto, A., and Lu, C.-N. (2017). A Review on Distribution System State Estimation. IEEE Trans. Power Syst. 32 (5), 3875–3883. doi:10.1109/TPWRS.2016.2632156
von Meier, A., Stewart, E., McEachern, A., Andersen, M., and Mehrmanesh, L. (2017). Precision Micro-synchrophasors for Distribution Systems: A Summary of Applications. IEEE Trans. Smart Grid 8 (6), 2926–2936. doi:10.1109/TSG.2017.2720543
Wen, L., Gao, L., and Li, X. (2019). A New Deep Transfer Learning Based on Sparse Auto-Encoder for Fault Diagnosis. IEEE Trans. Syst. Man. Cybern. Syst. 49 (1), 136–144. doi:10.1109/TSMC.2017.2754287
Zeraati, M., Aref, Z., and Latify, M. A. (2018). Vulnerability Analysis of Power Systems under Physical Deliberate Attacks Considering Geographic-Cyber Interdependence of the Power System and Communication Network. IEEE Syst. J. 12 (4), 3181–3190. doi:10.1109/JSYST.2017.2761844
Zhang, Y., and Yagan, O. (2020). Robustness of Interdependent Cyber-Physical Systems against Cascading Failures. IEEE Trans. Autom. Contr. 65 (2), 711–726. doi:10.1109/TAC.2019.2918120
Zhao, J., Li, L., Xu, Z., Wang, X., Wang, H., and Shao, X. (2020). Full-Scale Distribution System Topology Identification Using Markov Random Field. IEEE Trans. Smart Grid 11 (6), 4714–4726. doi:10.1109/TSG.2020.2995164
Keywords: fusion terminal, distribution IoT, energy management, distributed generation, prosumer
Citation: Tong L, Zhou J and Li J (2022) IoT-Based Low-Voltage Power Distribution System Management and Control Platform. Front. Energy Res. 10:902715. doi: 10.3389/fenrg.2022.902715
Received: 23 March 2022; Accepted: 27 April 2022;
Published: 17 June 2022.
Edited by:
Bin Zhou, Hunan University, ChinaCopyright © 2022 Tong, Zhou and Li. This is an open-access article distributed under the terms of the Creative Commons Attribution License (CC BY). The use, distribution or reproduction in other forums is permitted, provided the original author(s) and the copyright owner(s) are credited and that the original publication in this journal is cited, in accordance with accepted academic practice. No use, distribution or reproduction is permitted which does not comply with these terms.
*Correspondence: Jinhui Zhou, MTAwMjEwODAzM0BxcS5jb20=