 Xiaomeng Dong
 Haoxian Chen1
 Yang Yu
 Xi Huang
- 1Institute for Advanced Study in Nuclear Energy & Safety, College of Physics and Optoelectronic Engineering, Shenzhen University, Shenzhen, China
- 2Nuclear Power Institute of China, Chengdu, China
In the subcooled boiling flow under low-pressure conditions, bubble characteristic diameter is of great influence on the surface heat transfer coefficient. However, large errors are still found in calculations using traditional mechanistic models or empirical correlations, especially for wide experimental condition. In this paper, we propose a widely applicable data-driven model using artificial neural networks (ANN) to predict the bubble maximum diameter and investigate the effect of experimental conditions. After a series of analyses on structural parameters and input parameters, the ANN model is established and validated based on six available experimental databases. The result shows that the relative error is around 14%. Uncertainty analysis is carried out for the four experimental conditions and two structural conditions. The results show the measuring accuracy of pressure is one of the most sensitive parameters on the prediction of bubble maximum diameter in the subcooled boiling flow under 1.0 MPa, especially for the bubble sizes larger than 0.5 mm. According to the results of uncertainty analysis, a new correlation is proposed for coefficients C and φ, which are used to express the effect of pressure and fluid dynamic. The new correlation works well for all the experimental databases, and the error for bubble datasets of large size is also modified. Furthermore, another independent validation with a low relative error to 14% is provided to prove the accuracy of the new correlation.
1 Introduction
In a typical pressurized water reactor, saturation of boiling phenomenon is not allowed for its impairment to the fuel element. However, subcooled boiling flow may potentially occur in some special positions, such as the outlet of the fuel assembly or corners beside the spacer grid. The phase change could bring about a large increase in heat transfer efficiency of the heated surface. In complicated experiments involving a reactor core, the heat flux of the cladding surface is difficult to control precisely. Boiling crises determined by critical heat flux (CHF) may occur under some accident conditions. The CHF is a complicated two-phase flow phenomenon, characterized by a heat transfer mechanism change that rapidly decreases the efficiency of the heat transfer performance and increases the temperature of the heater surface. The high temperature could melt the fuel cladding and significantly damage the reactor core.
In general, the gas phase is always present in the form of bubbles during the subcooled boiling process. It features a series of action according to the effects of heat and fluid dynamics, such as generation, growth, sliding, and lift-off. In the subcooled boiling flow, the coefficient of the convective heat transfer is influenced by the characteristic parameters and dynamic behaviors of bubbles, their size and shape in particular. To describe the heat exchange and the heat flux partition on the heated surface in a theoretical view, the Rensselaer Polytechnic Institute (RPI) model (Kurul and Podowski, 1991) is widely used in the simulation of subcooled boiling flow. In this mechanistic model, the characteristic bubble diameter is considered one of the most important parameters, and it should be calculated accurately.
In the subcooled boiling flow, the characteristic bubble size has three main features, the maximum, departure, and lift-off diameter, which is shown in Figure 1. The maximum bubble diameter describes the limited size of growth for bubbles adjacent to the heated surface, while the other two parameters refer to the patterns of movement of the bubbles during the growth process.
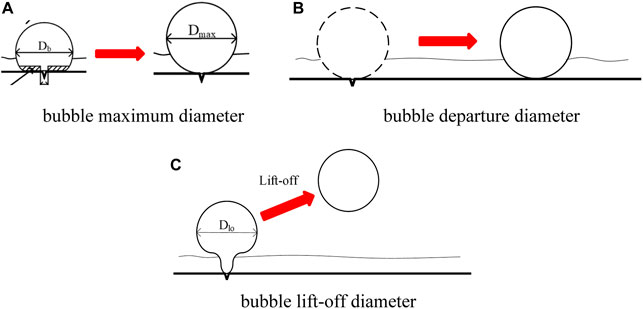
FIGURE 1. The sketch map of bubble characteristic size. (A) Bubble maximum diameter, (B) bubble departure diameter, (C) bubble lift-off diameter.
There are few differences among these three parameters. However, the maximum bubble diameter and lift-off diameter are usually considered to be the same for the low and medium pressure conditions. Furthermore, the three bubble sizes show less of a difference for the non-slip bubble in low pressure and velocity (Hoang et al., 2016; Yoo et al., 2018). In calculations using computational fluid dynamics (CFD) method, all of these three characteristic sizes can be used in the calculation of the void fraction, heat and mass transfer, wall temperature, and quenching process of the different conditions (Tu and Yeoh, 2002; Krepper et al., 2013; Cheung et al., 2014; Gu et al., 2017).
Many approaches have been developed to calculate the bubble diameter, and these can be divided into three classifications, namely, empirical correlation, heat balance model, and force analysis model. Empirical correlations are proposed using the fitting of experimental databases. These usually contain several non-dimensional numbers, gradients, and ratios. Continuous multiplication and polynomial structure are a common functional form in the correlations, such as the model proposed by Prodanovic et al. (2002) and Brooks and Hibiki (2015). Certainly, these models show good performance for their own database. As the data expand and reach a larger scope, not all of the models could give the accurate results. Murallidharan et al. (2018) developed a bubble growth model that includes infinite bubble growth, wall effect multiplier, and bulk effect multiplier. Most of the coefficients in this model are fitted into polynomial structures. Although the model shows a good applicability over a wide range of conditions, it lacks any convenience of application and suitability for new experimental databases.
Apart from the empirical correlation, force balance and heat balance theories are used to calculate the characteristics bubble sizes from a theoretical view. According to the basic principle, the force balance model (Klausner et al., 1993; Situ et al., 2005; Yeoh et al., 2008) is suitable for calculating the departure and lift-off diameters of the bubbles, and the heat balance model (Ünal, 1976) is used to calculate the maximum diameter of the bubble. As can be seen from the application (Dong and Zhang, 2021) of these two models, the relative errors of the wide experimental databases reach around 40%. In reality, not all of the experiments provide local wall superheating as a result of immature measurement. The Chen correlation is always used for the calculation of wall superheat, especially in the heat balance model (Hoang et al., 2016; Dong and Zhang, 2021). This is the most accurate model for wall superheating, and its relative error is around 20%, which is a large proportion of the total error in the maximum bubble diameter.
Three submodules beyond wall superheating reflect the influence of pressure, velocity, and local subcooling. The former two are empirical correlations, while a partially mechanistic model is provided for the effects of local subcooling (Ünal, 1976). Because they were proposed in Ünal’s original heat balance model, almost no modification has been made for over 40 years. Dong and Zhang (2021) used Reynolds numbers instead of velocity values, which decreases the relative error by about 5–10%. After the investigation of several experimental databases, a more accurate model should be proposed to describe the effects of pressure on the characteristic bubble sizes in the future.
Thanks to the successful application of data mining techniques, data-driven theory has been used in many areas of industrial knowledge, such as fluid dynamics and intelligent manufacturing. In the fluid dynamics and thermodynamics, many data-driven models have been used to identify of flow regimes (Salgado et al., 2010; Affonso et al., 2020; Aarabi Jeshvaghani et al., 2021) and predict boiling crises (Greenwood et al., 2017; Yan et al., 2021) using artificial neural networks (ANN). All the results show good performance in a wide experimental condition. The relative error of CHF is around 20% which is better than that of empirical correlation or mechanistic models. Jung et al. (2020) investigated the bubble size distribution in turbulent air-water bubbly flows by using multi-layer ANNs. Compared to the 20% error of traditional theoretical models, the results of the use of ANNs show average relative error of 4.98% for the given experimental datasets.
This study discusses the application of ANNs for the calculation of maximum bubble diameter. We also try to investigate the influence of several experimental conditions based on the trained ANN model. The conclusions of uncertainty analysis are helpful to correct the correlation of coefficients to reflect the effects of pressure and mass flux in a more accurate way.
2 Mechanistic and Artificial Neural Networks Models of Bubble Maximum Diameter
2.1 Mechanistic Models
Although there are differences among the proposed heat balance models, the key theoretical points are shared; these describe an equivalence between absorbed and released heat bubbles. As Figure 2 shows, the bubble is regarded as an approximate sphere, while the growth process is determined by the heat from thin liquid film
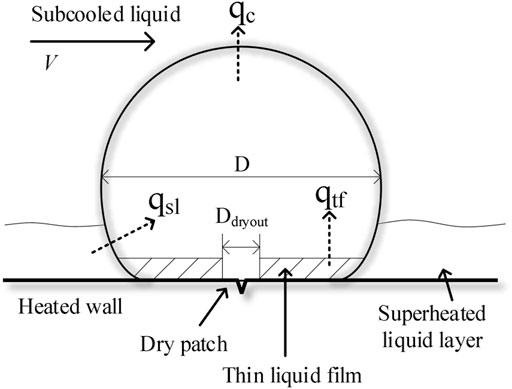
FIGURE 2. Heat flux partition for a growing bubble in the subcooled boiling flow.
According to heat balance theory, the mechanistic model can be developed as Equation 1.
The heat flux components used in Equation 1 are described in detail (Levenspiel, 1959; Zuber, 1961; Sernas and Hooper, 1969) and are given as follows.
The model of
where
Dong and Zhang (2021) provided a new model (Equation 7) for parameter
The surface area ratio of each heat flux is also of great importance for the heat balance model. The surface area
In Equation 8, L, m, and n refer to the fractions of surface area for thin liquid film, superheated liquid layer, and condensation. Under the assumption that the dry patch shrinks and disappears when the diameter of the bubble reaches the maximum value, the sum of L, m and n should be equal to 1.
By substituting Eqs. 2–5, 7, and 8 into Equation 1, we obtain the basic equation for bubble diameter, as follows:
Using Ünal’s method and the Taylor series (Ünal, 1976), the approximate solution of bubble maximum diameter can be written as follows:
where f is a coefficient of the characteristic temperature used to reflect an inhomogeneous of superheated liquid layer.
2.2 Artificial Neural Networks
In addition to the mechanistic model, an ANN model is proposed to predict the maximum diameter of a bubble using the BP (Back-Propagation) algorithm. The ANN model is a two-layer feed-forward network with sigmoid hidden neurons and linear output neurons. All of the calculations are carried out on the MATLAB platform.
As we can see from Figure 3, the ANN model consists of one input layer, one or more hidden layers and one output layer. Several parameters are chosen as input elements after analysis of the experimental conditions. These elements should reflect the effects of experimental conditions, such as pressure, mass flow, hydraulic diameter, heat flux, local subcooling, and the physical thermal properties of a heated surface.
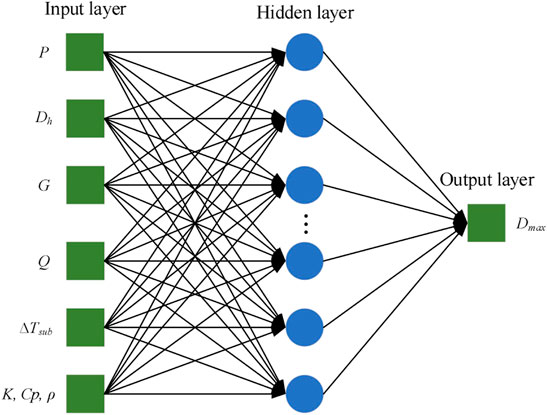
FIGURE 3. Schematic diagram of the ANN model.
For each neuron, an activation function is necessary to transforms the input value to the next hidden layer or the output layer. Commonly used activation functions include sigmoid/logistic, tansig, ReLU, and ELU. The main purpose of the activation function is to increase the non-linear ability of the ANN model.
The training algorithm is another important element of an ANN model. It is used to train the network and form a fixed model. However, it is very difficult to know which training algorithm will be most suitable for a given problem. This depends on many factors, including the complexity of the problem, the number of data points in the training set, and the number of weights and biases in the network. Different training algorithms should be compared to gain a good accuracy in the calculation.
The last key parameter is the coefficient of determination R, which represents the fitting degree between the experimental value and the calculated value. It varies from 0 to 1, with larger values being better. The function is expressed as follows:
where n is the quantity of dataset,
3 Experimental Databases
As Table 1 shows, six experimental databases are used for the validation of ANN model. All of the experimental conditions are kept at low pressure and low velocity. The number of data points sum to 366, which is sufficient to execute an ANN.
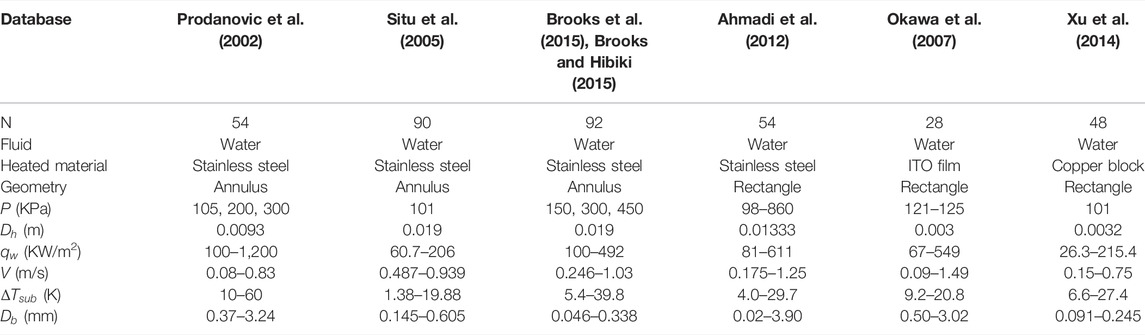
TABLE 1. Experimental databases for the validation.
The experimental data published by Situ et al. (2005), Brooks et al. (2015) Brooks and Hibiki (2015), Ahmadi et al. (2012), Okawa et al. (2007) and Xu et al. (2014) include bubble lift-off diameters. These datasets of the experiment are measured using a high-speed video camera. In the original heat balance theory, Ünal assumed that the bubbles would not leave the heated surface when they reached their maximum diameter. In this paper, bubble lift-off diameter is regarded as same as maximum bubble diameter.
Analyzing the original heat balance theory and using Equation 3, we can identify a power relation between the maximum bubble maximum diameter and the other four important parameters of the mechanistic model. The thermal properties of heated surface are not used as an impact parameter for the limited data of surface material. As can be seen in Equation 5, the direct influence of pressure P is worked through the parameter C. After integration, the order x of P should be in the range (-0.5, 0]. Considering that the vapor density is sensitive to the variation of pressure in the subcooled boiling flow, we also check the power relationship of
In the original research, φ is only considered to be a function of velocity itself. However, we find that an equation incorporating the Reynolds number is more accurate for calculating the maximum diameter of the bubble in the former investigation (Dong and Zhang, 2021). The hydraulic diameter in the Reynolds number can reflect the effect of the channel dimension on bubble growth, which is more suitable for use in the calculation than velocity is.
4 Validation and Discussion
In general, the key parameters of the ANN model include the number of neurons, number of hidden layers, activation function, and training algorithm. After a sensitivity analysis, we choose to use two hidden layers with eight neurons as the basic structure. The related R value can be increased to 0.9916, which is sufficiently accurate for the necessary calculations. In addition, the activation function and the training algorithm are also determined after comparing the accuracy of multiple combinations. The results show that the combination of logsig and tansig activation functions with the trainbr training algorithm gave the best performance, with a relative error of 13.50%. The trainbr algorithm, using Bayesian regularization back propagation, is a network training function that updates the weight and bias values according to Levenberg-Marquardt optimization. Trainbr can train any network, so long as its weight, net input, and transfer functions have derivative functions. It can minimize a linear combination of squared errors and weights and modify the linear combination so that at the end of training. the resulting network has good generalization qualities, even for different, small, or noisy datasets. Drawing on the above structure of the ANN model, more than 150 iterations of training are carried out for this prediction of maximum bubble diameter. The coefficient of determination R for nearly all the training sets is higher than 0.9, and 82% are higher than 0.95. This shows that the ANN model has a high confidence level, which increases the credibility of the calculated results.
4.1 Input Parameters in the Artificial Neural Networks Model
Appropriate input parameters are necessary structural elements in the ANN model. The parameters cannot be chosen arbitrarily and should reflect the effects of experimental conditions. For the prediction of maximum bubble maximum diameter in the subcooled boiling flow, experimental conditions, which include pressure, mass flow, hydraulic diameter, heat flux, local subcooling, and the physical and thermal properties of a heated surface should be paid more attention. Several dimensional parameters are chosen to test the relevance with bubble maximum diameter. The results are shown in Table 2. Multiple R and F refer to the significance level of relevance. It is concluded that dimensional dynamic viscosity
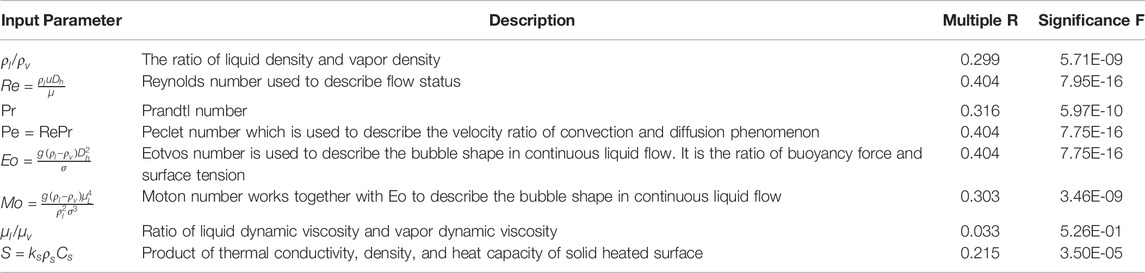
TABLE 2. Relevance analysis of potential input parameters.
4.2 Validation of Artificial Neural Networks Model
After determining the structural elements of ANN model, experimental databases are used to train the ANN model. For all 366 sets of bubble maximum diameter, 70% of databases are randomly selected as training data, and 15% are used as the test and validation respectively. The results are shown in Table 3 and Figure 4; the average error of all the experimental databases is 13.54% which is much lower than for other mechanistic models. Furthermore, the ANN model increases the accuracy of calculations of large bubbles from Prodanovic’s database.
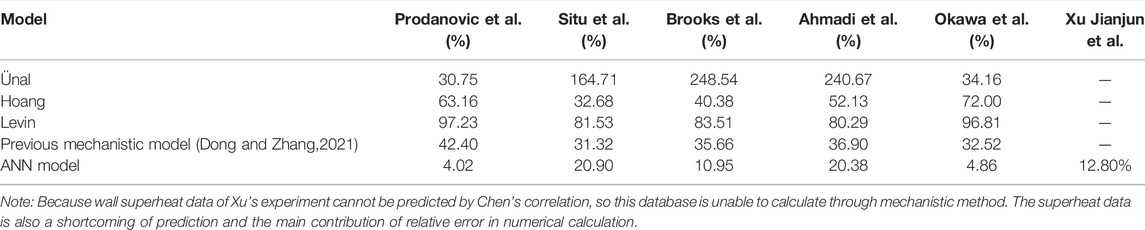
TABLE 3. Arithmetic-mean errors of different models for the databases.
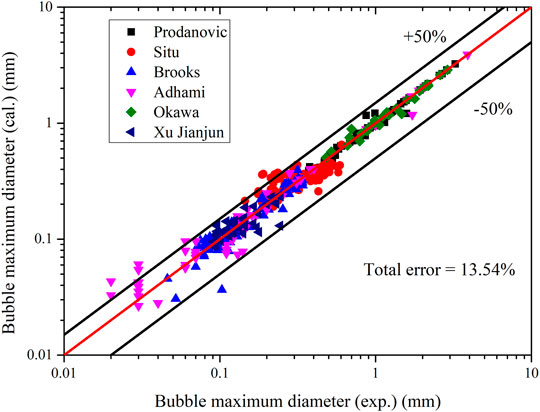
FIGURE 4. Bubble maximum diameter predicted by the ANN model.
However, due to the inner black box features of ANNs, the trained ANN model can only be used for prediction, with the experimental conditions covered by the trained database. Once one of the experimental parameters exceeds the range used by training, the calculated maximum bubble diameter could show a partial large relative error.
4.3 Uncertainty Analysis of Experimental Conditions
Considering installation error and measurement error, the uncertainty analysis of the experimental conditions is carried out in this section. The errors include the measurement accuracy of measuring instruments and the uncertainty of measuring position, while the other environmental influences are not considered. The errors of experimental conditions and their influence to input parameters are shown in Table 4. Because the maximum coarseness of the common pressure gauge reaches level 4, the relative error is 4%, so the measurement error for pressure is set to ±5% in this paper. Pressure fluctuation would change the density, Prandtl number, and surface tension. Dimensional density, Pe, and Eo are affected. In general, the average heat flux of the experiment is calculated based on the heating power and the scale of heated surface. The local heat flux of subcooled flow boiling can be measured with a non-contacting heat flow meter. Taking the measuring accuracy of the equipment into account, the average relative error of heat flux is set to ±5%. The flowmeter has a better accuracy the other instruments of measurement, that is, no more than 2% for various types. In addition, there is no position error in the measurement of mass flux. On the contrary, the main contribution of measurement error for local subcooling is the position error. In the heat balance theory, the local subcooling is used for the calculation of bubble condensation. It is therefore important to measure the subcooled temperature of the position that the bubble generates through non-contacting measurement instruments. Considering the potential position error of this parameter, the measuring error of local subcooling is set to ±3%. Apart from these four parameters, the hydraulic diameter and thermal properties of heated surface are also given ±3% as a measurement error in this sensitivity analysis. However, the trend of data deviation induced by these two reasons should be the same for everything in the same experimental facility.
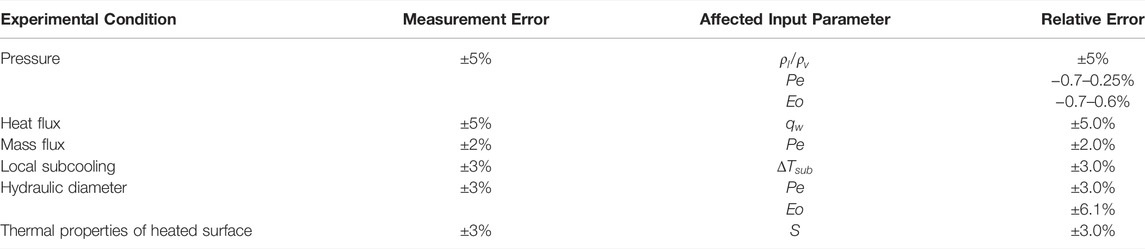
TABLE 4. The potential measuring error for different experimental conditions.
From the given measurement error and position error, new values of experimental conditions are chosen according to a uniform distribution in the value range. Then the input parameters are calculated and are used to form a series of new matrix. The maximum bubble diameters shown in Figure 5 are calculated by the trained ANN model based on the new databases of input parameters. As can be seen from the first four figures in Figure 6, only the fluctuations of pressure in four experimental conditions show appreciable effect on the bubble maximum diameter. The relative error of the total data set is enlarged from 13.54% to 19.04% when the pressure varies in a ±5% range. Therefore, pressure is considered to be the most sensitive parameter in the experimental conditions. This conclusion is consistent with the power relationship shown in Equation 10. It is also concluded that the ANN model has a good accuracy and robustness when facing the measurement error of experimental conditions. From the last two figures in Figure 6, the two experimental conditions related to experimental facility produce a large effect on the results, especially the hydraulic diameter. Furthermore, these two parameters remain the same through each experiment. Thus, it is necessary to determine the parameters related to the experimental section in a more accurate way before the experiment starts.
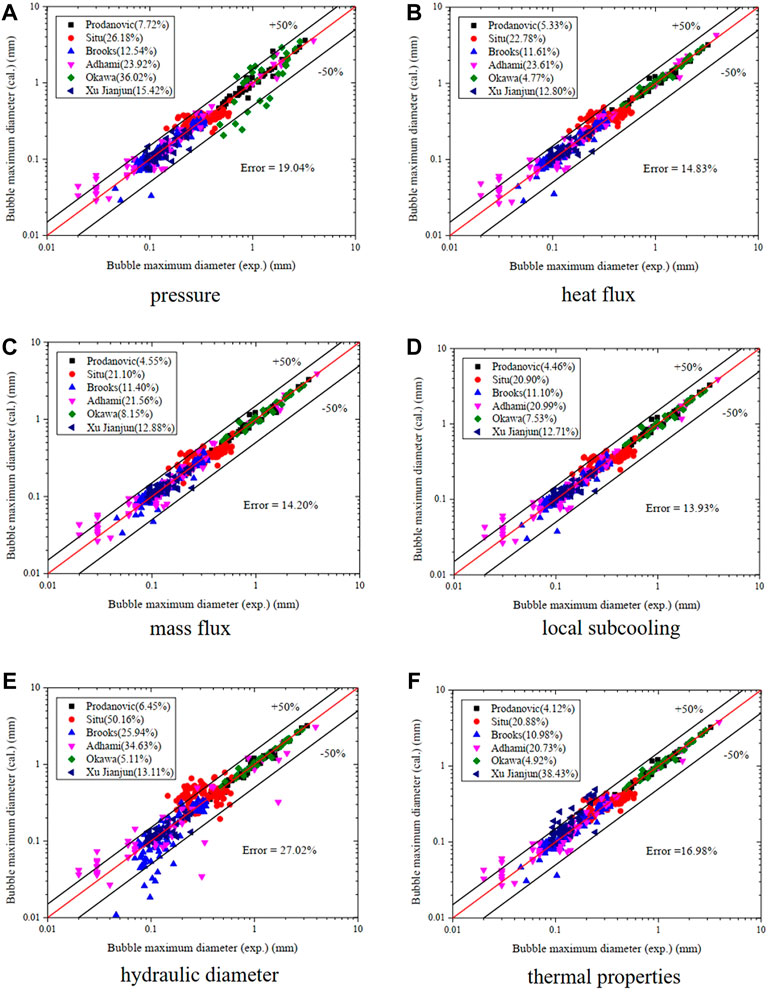
FIGURE 5. Results of the ANN model under the fluctuations of experimental conditions. (A) Pressure, (B) heat flux, (C) mass flux, (D) local subcooling, (E) hydraulic diameter, (F) thermal properties.
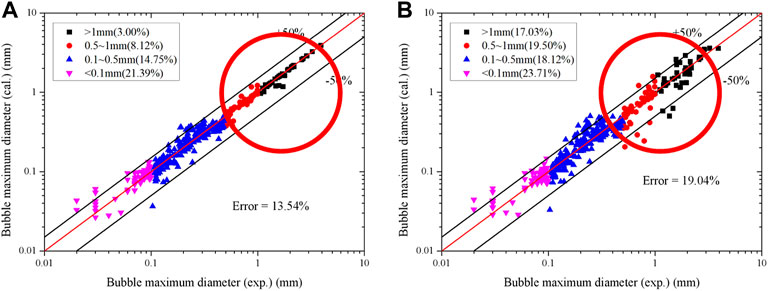
FIGURE 6. The distributions of bubble maximum diameter for different ranges of size. (A) Excluding the measurement error of P, (B) including the measurement error of P.
In the further analysis of pressure, the results are divided into four zones, according to the size of bubble maximum diameter. As can be seen in Figure 6, pressure has a larger influence on the zone where the bubble maximum diameter larger than 0.5 mm. The relative error increases about 12% while that of the other two zones varies only little. From a physical view, the larger bubble a larger amount of vapor inside. The fluctuation of pressure would influence larger bubble more through changing the vapor density. To increase the accuracy of the prediction, the correlation with pressure should be observed in both the experiments and in the mechanistic theoretical analysis.
4.4 New Correlation of Coefficients C and
The experimental condition pressure shows great sensitivity to the maximum bubble diameter, and its measurement should be prioritized. In the mechanistic model, we should also check the direct description of pressure, which is parameter C, used on the condensation part. In Ünal’s original paper, the correlation (5) of C proposed by Ünal is fitted from no more than 30 experimental datasets, as well as parameter
Parameter C is only related to pressure, and parameter
The results shown in Figure 7 are compared between the new correlation and original model (Dong and Zhang, 2021). The new correlation shows better performance for the bubble larger than 1 mm, in which the relative error is decreased from 51.39% to 33.19%. Other ranges of bubble size can also reach the same level or have greater accuracy.
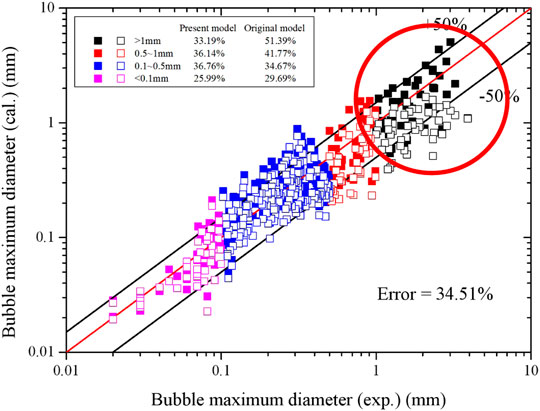
FIGURE 7. Comparison of new correlation and original model for different bubble sizes.
Beyond the experimental data above, another calculation based on Kaiho et al.’s experiment (Kaiho et al., 2017) is carried out for an independent validation of the improved mechanistic model. The pressure range is 107–143 kPa, nearly atmospheric condition. The heat flux of the heated surface is around 175–617 kW/m2 while the mass flux is 159–700 kg/m2s. The subcooling of water is 10–30 K. The experimental results from Kaiho’s research include the arithmetic mean value and the volume average value of maximum bubble diameter. In this validation, average volume is chosen as the experimental data, which is closer to the assumptions of heat balance theory. The calculated results are shown in Figure 8. The total relative error is 14.43%, which shows good performance for the present model.
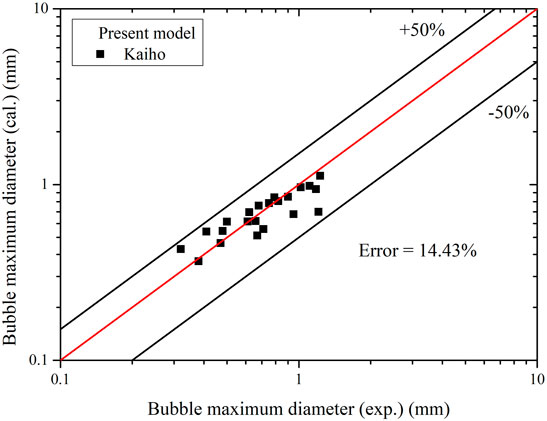
FIGURE 8. Independent validation of present model for Kaiho’s experiment.
5 Conclusion
Using ANNs, a data-driven model is proposed for the evaluation of bubble maximum diameter in subcooled boiling flow. After a basic sensitivity analysis is done on neuron number, two hidden layers with eight neurons each are used to develop the data-driven model. In addition, the activation function and training algorithm are screened out for the ANN model. Through the training using several experimental databases, the data-driven model shows good performance, with a relative error of around 14%. Sensitivity analysis is also proposed for the four experimental conditions and two structural conditions. The results identify the accuracy and robustness of the ANN model. It is also concluded that the measuring accuracy of pressure is of the most sensitivity on the bubble maximum diameter in the subcooled boiling flow under low-pressure conditions, especially for bubble sizes larger than 0.5 mm. A regression analysis of parameters C and
Data Availability Statement
The original contributions presented in the study are included in the article/supplementary material, and further inquiries can be directed to the corresponding author.
Author Contributions
XD proposed the research algorithm for the data-driven model and wrote the original draft. HC used MATLAB to implement the research method. CL discussed the accuracy and its modification of ANN model. MY helped develop the structural analysis of ANN model. YY collected and analyzed the experimental databases. XH helped develop the modification of mechanistic model and the additional validation.
Funding
This research was funded by the Guang Dong Basic and Applied Basic Research Foundation (No. 2021A1515110922). Thanks to Shenzhen University and Nuclear Power Institute of China for the support.
Conflict of Interest
The authors declare that the research was conducted in the absence of any commercial or financial relationships that could be construed as a potential conflict of interest.
The reviewer ZL declared a shared affiliation with the author(s) YY to the handling editor at the time of review.
Publisher’s Note
All claims expressed in this article are solely those of the authors and do not necessarily represent those of their affiliated organizations, or those of the publisher, the editors and the reviewers. Any product that may be evaluated in this article, or claim that may be made by its manufacturer, is not guaranteed or endorsed by the publisher.
References
Aarabi Jeshvaghani, P., Khorsandi, M., and Feghhi, S. A. H. (2021). Flow-Rate Prediction Independent of the Regime in a Dynamic Two-Phase Flow System Using a Simple Pulse Height Spectrum of a Detector and Artificial Neural Networks. Nucl. Instrum. Meth. A 1017, 165794. doi:10.1016/j.nima.2021.165794
Affonso, R. R. W., Dam, R. S. F., Salgado, W. L., Silva, A. X. d., and Salgado, C. M. (2020). Flow Regime and Volume Fraction Identification Using Nuclear Techniques, Artificial Neural Networks and Computational Fluid Dynamics. Appl. Radiat. Isot. 159, 109103. doi:10.1016/j.apradiso.2020.109103
Ahmadi, R., Ueno, T., and Okawa, T. (2012). Bubble Dynamics at Boiling Incipience in Subcooled Upward Flow Boiling. Int. J. Heat. Mass Transf. 55, 488–497. doi:10.1016/j.ijheatmasstransfer.2011.09.050
Brooks, C. S., and Hibiki, T. (2015). Wall Nucleation Modeling in Subcooled Boiling Flow. Int. J. Heat. Mass Transf. 86, 183–196. doi:10.1016/j.ijheatmasstransfer.2015.03.005
Brooks, C. S., Silin, N., Hibiki, T., and Ishii, M. (2015). Experimental Investigation Ofwall Nucleation Characteristics in Flow Boiling. J. Heat. Transf. 137, 1–9. doi:10.1115/1.4029593
Cheung, S. C. P., Vahaji, S., Yeoh, G. H., and Tu, J. Y. (2014). Modeling Subcooled Flow Boiling in Vertical Channels at Low Pressures - Part 1: Assessment of Empirical Correlations. Int. J. Heat. Mass Transf. 75, 736–753. doi:10.1016/j.ijheatmasstransfer.2014.03.016
Dong, X., and Zhang, Z. (2021). Mechanism Study of Bubble Maximum Diameter in the Subcooled Boiling Flow for Low-Pressure Condition. Int. J. Heat. Mass Transf. 164, 120585. doi:10.1016/j.ijheatmasstransfer.2020.120585
Greenwood, M. S., Duarte, J. P., and Corradini, M. (2017). Presentation and Comparison of Experimental Critical Heat Flux Data at Conditions Prototypical of Light Water Small Modular Reactors. Nucl. Eng. Des. 317, 220–231. doi:10.1016/j.nucengdes.2016.12.030
Gu, J., Wang, Q., Wu, Y., Lyu, J., Li, S., and Yao, W. (2017). Modeling of Subcooled Boiling by Extending the RPI Wall Boiling Model to Ultra-High Pressure Conditions. Appl. Therm. Eng. 124, 571–584. doi:10.1016/j.applthermaleng.2017.06.017
Hoang, N. H., Chu, I.-C., Euh, D.-J., and Song, C.-H. (2016). A Mechanistic Model for Predicting the Maximum Diameter of Vapor Bubbles in a Subcooled Boiling Flow. Int. J. Heat. Mass Transf. 94, 174–179. doi:10.1016/j.ijheatmasstransfer.2015.11.051
Jung, H., Yoon, S., Kim, Y., Lee, J. H., Park, H., Kim, D., et al. (2020). Development and Evaluation of Data-Driven Modeling for Bubble Size in Turbulent Air-Water Bubbly Flows Using Artificial Multi-Layer Neural Networks. Chem. Eng. Sci. 213, 115357. doi:10.1016/j.ces.2019.115357
Kaiho, K., Okawa, T., and Enoki, K. (2017). Measurement of the Maximum Bubble Size Distribution in Water Subcooled Flow Boiling at Low Pressure. Int. J. Heat. Mass Transf. 108, 2365–2380. doi:10.1016/j.ijheatmasstransfer.2017.01.027
Klausner, J. F., Mei, R., Bernhard, D. M., and Zeng, L. Z. (1993). Vapor Bubble Departure in Forced Convection Boiling. Int. J. Heat. Mass Transf. 36 (3), 651–662. doi:10.1016/0017-9310(93)80041-r
Krepper, E., Rzehak, R., Lifante, C., and Frank, T. (2013). CFD for Subcooled Flow Boiling: Coupling Wall Boiling and Population Balance Models. Nucl. Eng. Des. 255, 330–346. doi:10.1016/j.nucengdes.2012.11.010
Kurul, N., and Podowski, M. Z. (1991). “On the Modeling of Multidimensional Effects in Boiling Channels,” in Proceedings of the 27th National Heat Transfer Conference, Minneapolis, USA 1991, 28–31.
Levenspiel, O. (1959). Collapse of Steam Bubbles in Water. Ind. Eng. Chem. 51, 787–790. doi:10.1021/ie50594a045
Murallidharan, J. S., Prasad, B. V. S. S. S., and Patnaik, B. S. V. (2018). A Universal Wall-Bubble Growth Model for Water in Component-Scale High-Pressure Boiling Systems. Int. J. Heat. Mass Transf. 122, 161–181. doi:10.1016/j.ijheatmasstransfer.2018.01.070
Okawa, T., Kubota, H., and Ishida, T. (2007). Simultaneous Measurement of Void Fraction and Fundamental Bubble Parameters in Subcooled Flow Boiling. Nucl. Eng. Des. 237, 1016–1024. doi:10.1016/j.nucengdes.2006.12.010
Prodanovic, V., Fraser, D., and Salcudean, M. (2002). Bubble Behavior in Subcooled Flow Boiling of Water at Low Pressures and Low Flow Rates. Int. J. Multiph. Flow. 28, 1–19. doi:10.1016/s0301-9322(01)00058-1
Salgado, C. M., Pereira, C. M. N. A., Schirru, R., and Brandão, L. E. B. (2010). Flow Regime Identification and Volume Fraction Prediction in Multiphase Flows by Means of Gamma-Ray Attenuation and Artificial Neural Networks. Prog. Nucl. Energ 52 (6), 555–562. doi:10.1016/j.pnucene.2010.02.001
Sernas, V., and Hooper, F. C. (1969). The Initial Vapor Bubble Growth on a Heated Wall during Nucleate Boiling. Int. J. Heat. Mass Transf. 12 (12), 1627–1639. doi:10.1016/0017-9310(69)90097-0
Situ, R., Hibiki, T., and Ishii, M. M. (2005). Bubble Lift-Off Size in Forced Convective Subcooled Boiling Flow. Int. J. Heat. Mass Transf. 48 (25–26), 5536–5548. doi:10.1016/j.ijheatmasstransfer.2005.06.031
Tu, J. Y., and Yeoh, G. H. (2002). On Numerical Modelling of Low-Pressure Subcooled Boiling Flows. Int. J. Heat. Mass Transf. 45 (6), 1197–1209. doi:10.1016/s0017-9310(01)00230-7
Ünal, H. C. (1976). Maximum Bubble Diameter, Maximum Bubble-Growth Time and Bubble-Growth Rate during the Subcooled Nucleate Flow Boiling of Water up to 17.7 MN/m2. Int. J. Heat. Mass Transf. 19, 643–649. doi:10.1016/0017-9310(76)90047-8
Xu, J., Chen, B., and Xie, T. (2014). Experimental and Theoretical Analysis of Bubble Departure Behavior in Narrow Rectangular Channel. Prog. Nucl. Energ 77, 1–10. doi:10.1016/j.pnucene.2014.06.002
Yan, M., Ma, Z., Pan, L., Liu, W., He, Q., Zhang, R., et al. (2021). An Evaluation of Critical Heat Flux Prediction Methods for the Upward Flow in a Vertical Narrow Rectangular Channel. Prog. Nucl. Energ 140, 103901. doi:10.1016/j.pnucene.2021.103901
Yeoh, G. H., Cheung, S. C. P., Tu, J. Y., and Ho, M. K. M. (2008). Fundamental Consideration of Wall Heat Partition of Vertical Subcooled Boiling Flows. Int. J. Heat. Mass Transf. 51, 3840–3853. doi:10.1016/j.ijheatmasstransfer.2007.11.047
Yoo, J., Estrada-Perez, C. E., and Hassan, Y. A. (2018). Development of a Mechanistic Model for Sliding Bubbles Growth Prediction in Subcooled Boiling Flow. Appl. Therm. Eng. 138, 657–667. doi:10.1016/j.applthermaleng.2018.04.096
Keywords: bubble maximum diameter, data-driven model, subcooled boiling flow, artificial neural networks, sensitivity analysis
Citation: Dong X, Chen H, Li C, Yang M, Yu Y and Huang X (2022) An Evaluation of the Data-Driven Model for Bubble Maximum Diameter in Subcooled Boiling Flow Using Artificial Neural Networks. Front. Energy Res. 10:903464. doi: 10.3389/fenrg.2022.903464
Received: 24 March 2022; Accepted: 06 June 2022;
Published: 15 August 2022.
Edited by:
Jun Wang, University of Wisconsin-Madison, United StatesReviewed by:
Luteng Zhang, Chongqing University, ChinaZhongchun Li, Nuclear Power Institute of China (NPIC), China
Dongxu Ji, The Chinese University of Hong Kong, China
Copyright © 2022 Dong, Chen, Li, Yang, Yu and Huang. This is an open-access article distributed under the terms of the Creative Commons Attribution License (CC BY). The use, distribution or reproduction in other forums is permitted, provided the original author(s) and the copyright owner(s) are credited and that the original publication in this journal is cited, in accordance with accepted academic practice. No use, distribution or reproduction is permitted which does not comply with these terms.
*Correspondence: Xiaomeng Dong, ZG9uZ194aWFvbWVuZ0B5ZWFoLm5ldA==; Yang Yu, eXV6aGFveWFuZzE5ODdAc2luYS5jb20=