 Yiyao Wang
- School of Hongshen Honors (Electrical and Electronics Engineering), Chongqing University, Chongqing, China
This article aims to reach a global level by selecting a Harr-like function with the participation of bubbles and light and shadow on a digital display, improving the fitness function of the genetic algorithm and the crossover change function. The classifier support vector machine parameters were optimized by an improved genetic algorithm. Finally, compared to other identification algorithms, basic component analysis reduces the number of characters through support vector machines and recognizes the target character. The results of the experiment showed that eight sets of experiments were performed on each character. Experiments have shown that character recognition is best achieved using Harr-like software and then SVM classification based on improved gene algorithms. For small samples, the sorting speed is also fast, which can meet the time requirement. In addition, the historical state data of the transformer are analyzed, which is consistent with the manual monitoring results, but the time is shorter; machine vision has been shown to be effective in monitoring the condition of substation equipment.
Introduction
The smart substation is an important operation unit to promote the construction of smart grid. In order to effectively avoid the occurrence of power equipment aging, insulation damage, and other faults and prevent power failure, it is usually necessary to monitor power equipment in the intelligent substation. There are two main methods of substation inspection and electronic monitoring. At present, human patrol inspection is the main detection method used by the State Grid, but this method is mainly aimed at the traditional substation (Jeong et al., 2020). With the application and development of an intelligent substation, it can be constructed in a harsh natural environment. However, manual inspection is difficult to complete the inspection in this environment, and this method does not have real-time performance. It can only be overhauled in a fixed season, which has great limitations. With the development of information technology, electronic monitoring technology has gradually become the mainstream (Cerba et al., 2020; Qian et al., 2021).
Literature Review
At present, the existing safety distance monitoring measures include staff inspection, installation of monitoring cameras, ultrasonic sensor monitoring, and infrared sensor monitoring. The staff inspection method is inefficient, greatly affected by the external environment, and requires a lot of manpower, which is destined to be replaced by more intelligent and efficient automation equipment. Ultrasonic sensor-monitoring mode and infrared sensor-monitoring mode are greatly affected by the environment and have low accuracy (Zhou et al., 2020). The intuitive and accurate way is based on machine vision. Using the traditional monocular camera for monitoring, we can also get whether the distance between personnel and substation equipment is less than the safe distance by processing the monitoring video, but there are two problems: 1) there must be references such as marking lines; 2) the setting of safety distance of substation equipment is related to the voltage level. The pictures or videos taken by a monocular camera only have two-dimensional information, so it is difficult to obtain the spatial information of personnel and substation equipment. The ranging also stays in comparison with the reference object on the two-dimensional plane, resulting in the greatly reduced accuracy of this method. With the introduction of binocular vision, the three-dimensional information of personnel and substation equipment can be obtained, and the world coordinates of any object within the field of vision can be obtained, so as to realize positioning, ranging, and so on (Al- Dulaimi et al., 2019). The binocular camera is used to monitor the site. When there are staff or outsiders or objects close to substation equipment, it can detect and track its movement, real-time position, and calculate the distance between it and the substation equipment. As shown in Figure 1, if it is going to be in a dangerous distance, it can give an alarm in time to warn the potential safety hazards, which is also conducive to the real-time monitoring and timely response measures of the substation equipment management personnel. The real-time monitoring and alarm function of substation equipment is realized quickly and stably, which increases the safety factor of the site and saves a lot of human resources.
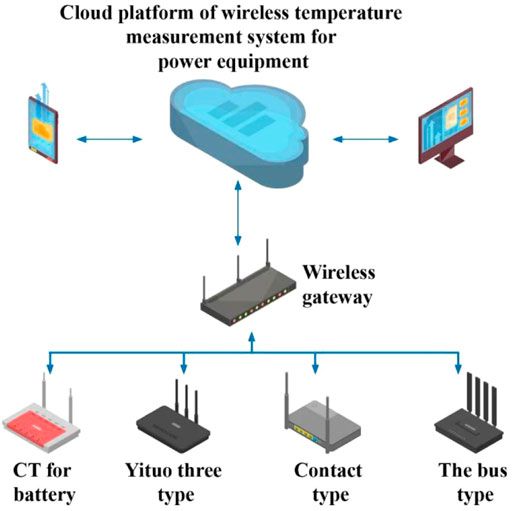
FIGURE 1. Substation equipment status detection in the cloud environment.
Elewe and Zaboon (2020) pioneered the research of stereo vision by using computer vision to analyze the scenes in three-dimensional view. In the 1980s, through the research on the basic theory of stereo vision, Marr developed a complete system framework based on stereo vision, which was applied to binocular matching, and produced an image with depth information through two-dimensional plans, which laid the theoretical foundation of binocular stereo vision technology. Under the systematic framework developed by Gao et al. (2021) with the cross-application of various disciplines and technologies, binocular stereo vision technology has made great progress, including major breakthroughs in camera calibration, feature detection, and stereo matching. The traditional calibration method is to establish the mathematical model of the camera and obtain the internal and external parameters of the camera according to the mapping relationship between the calibration object and the known corresponding points of the image. For example, Yan et al. (2020) proposed a two-step calibration method based on a 3D stereo target. The algorithm has high accuracy, but the manufacturing requirements of the 3D target are high and the cost is high; Tsai’s two-step calibration method, which is based on radial constraints, has high precision, strong universality, and simple operation, but there is error accumulation; Moravec operator, Harris operator, SUSAN operator, and other algorithms are internal parameter self-calibration methods based on vanishing points. These algorithms are widely used, and the premise is to extract feature points. The plane calibration method based on the chessboard proposed by Song et al. (2020) has the advantages of simple operation, easy implementation, high precision, and wide application. The self-calibration method moves the camera without the help of the calibration template and realizes the calibration according to the transformation relationship between the surrounding environment and the image. For example, Zhang et al. (2021a) proved that there are quadratic nonlinear constraints in the form of a Kruppa equation between every two images, so that the camera parameters can be obtained by solving the Kruppa equation group. The camera calibration method based on active vision was proposed by Wang et al. (2022); although the method of active vision does not need to use calibration objects, it has high requirements for the camera workbench and low practicability. An et al. (2021) detected the shadow of moving targets by combining local class and color features. This method is mainly used to process remote-sensing images. Liu et al. (2020) proposed a multi-scale matching algorithm, which uses different Laplacian zero crossings and gradients to match feature points. The algorithm has high operation efficiency and good robustness, but it can only get a sparse parallax map, and it also needs to obtain image depth information through interpolation estimation; Zhang et al. (2021b) estimated the image parallax according to the global energy function, obtained its minimum value, and obtained the optimal parallax. The algorithm has high matching accuracy and dense parallax, but the matching speed is slow. Li et al. (2021) proposed a bilateral filter matching algorithm based on adaptive weight, which can better retain the edge depth information, but the execution speed is relatively slow.
Based on the current research, this article proposes a machine vision-oriented transformer substation equipment condition monitoring method. Due to the interference of the bubble and light shadow phenomenon in the protective film of the digital display instrument panel, this article selects the Harr-like feature as a character feature and improves the fitness function and cross-mutation function of the genetic algorithm to increase the global optimization. The improved genetic algorithm is used to optimize the parameters of the classifier support vector machine. Finally, the dimension is reduced by principal component analysis, and the character target is recognized by a support vector machine, which is compared with other recognition algorithms.
Substation Equipment Condition Monitoring Algorithm Based on Machine Vision
The key link in the process of monitoring the operation state of the substation is the automatic identification of the operation state. In recent years, the theories of image processing, pattern recognition, and artificial intelligence have developed vigorously and are widely used in building monitoring and management, electronic equipment testing, automobile instrument testing, and other industries. The use of machine vision technology will be able to partially or completely replace the purpose of human eye object recognition, which greatly reduces the demand for labor in factories, so as to reduce the cost of enterprises and effectively enhance the competitiveness of enterprises. Machine vision technology can complete accurate and efficient detection without any subjective factors, which can completely change the traditional industrial detection. The operation status monitoring of substations will adopt effective and feasible methods to focus on solving the more complex but urgent detection items such as digital display instrument and digital character recognition for different detection items. At the same time, the image-processing algorithm used is integrated to realize the comprehensive monitoring of the running state.
Character Segmentation Method Based on Vertical Projection
In order to realize the recognition of the digital display instrument dial, it is necessary to segment a single digital character in the dial image. The common methods of character segmentation include Hough transform, Dun difference accumulation, and vertical or horizontal projection. Due to the obvious character spacing of the digital display instrument detected in this article, the contrast between the target image and the background is large and the environmental change is small; the vertical projection method can be used to segment the dial characters. First, the dial is binarized, then the image is projected vertically, and a single character is intercepted according to the character distance.
The process of realizing vertical projection character segmentation is as follows:
1) Scan the pixel points on the image that has been binarized line by line and store the white point position, then the character is between the first and last white points. 2) Project the image vertically. 3) The threshold is selected for separation according to the vertical projection histogram. 4) After obtaining a single character image, repeat step (1), and segment the character area according to the position of the head and tail white dots, so as to make the segmentation more accurate (Yu et al., 2020).
Figure 2 shows the histogram of sample vertical projection.
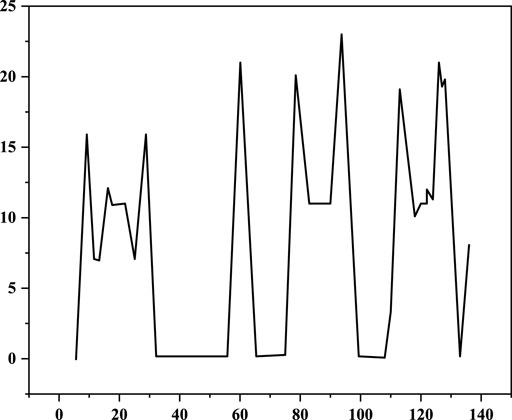
FIGURE 2. Its vertical projection.
Common Character Recognition Methods
The digital image of the digital display instrument is composed of four vertical digital segments and three horizontal digital segments. The shapes of the horizontal and vertical digital segments are similar and can be recognized through seven digital segments. Recognition is carried out after digital segmentation. The advantage of this method is that it does not need to normalize the character image. The identification steps are:
(1) Use two horizontal lines to divide the characters into three parts (Ross et al., 2020).
(2) Scan the three parts of the image from top to bottom. The digital segment display is recorded as 1, and the non-display is recorded as 0.
(3) Use a vertical line to divide the character into two parts.
(4) Scan the two parts of the image from left to right. The digital segment display is recorded as 1, and the non-display is recorded as 0.
(5) Bring the statistical characteristics of each digital segment into the digital characteristic table of the digital display instrument to recognize the current character. The digital characteristics of the digital display instrument are shown in Table 1.
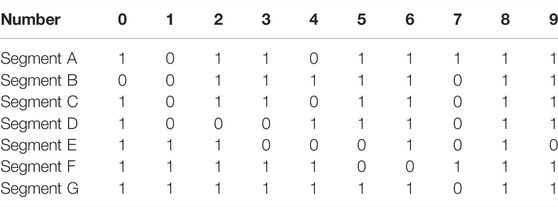
TABLE 1. Digital characteristics of the digital display instrument.
The algorithm flow of threading character recognition is shown in Figure 3.
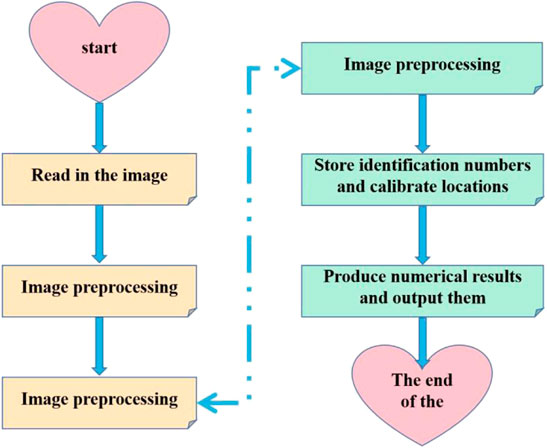
FIGURE 3. Character recognition algorithm flow.
Using the threading method, to recognize logarithmic explicit instrument characters is fast and effective. However, in practice, there are protective film bubbles on the dial of the digital display instrument, and the phenomenon of light and shadow will also interfere with it, resulting that the recognition accuracy of this method is not ideal (Lopatin and Kopey, 2019).
Calculation of Integral Image and Harr-Like Feature
The main idea of a unified image is to store in memory the sum of the gray values of the pixels in the rectangular area created by the image as a new array element from the origin of the coordinates to each pixel. If you want to calculate the sum of the pixels in a given area, you can directly index the elements in the array without recalculating the sum of the pixels in that area, which speeds up the calculation. The method of drawing an integrated graph is shown in Figure 4.
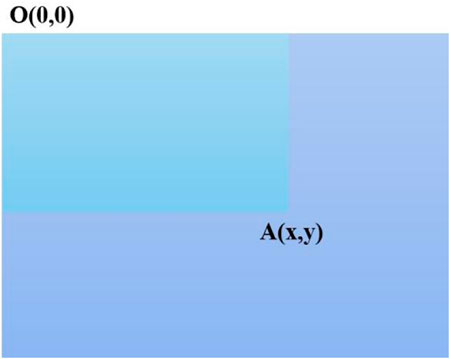
FIGURE 4. Integral diagram representation method.
The value of point A (x, y) in the integral diagram is the sum of the gray values of all pixels at the upper left of the point, and its definition expression is shown in Eq. 1:
where integral (x, y) represents the value of point A (x, y) at the midpoint (x, y) of the integral diagram and
Eq. 2 can recursively represent any point (x, y) in the integral image:
where s (x, y) is the cumulative sum of rows, and the expression is:
When calculating the integral image value of the image, first initialize s (0, −1) = 0,
In order to meet the calculation of new features, the concept of a rotated summed area table is shown in Figure 5.
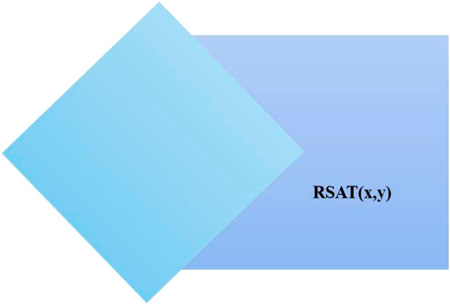
FIGURE 5. Representation method of the rotation integral diagram.
Take the point (x, y) as the center, and draw a straight line at 45° downward and a branch line at 45° upward (Nan et al., 2019). The sum of pixel gray values in the area surrounded by the straight line and the image is recorded as RSAT (x, y). The expression is:
The formula is obtained by iterating the image from left to right and from top to bottom for the first time:
The second iteration is from right to left and from bottom to top:
where
According to the vertical integral graph and rotation integral graph, all features in the Harr-like feature library can be calculated. The vertical rectangle r (x, y, w, h, and 0) can be calculated by Eq. 7:
After calculating the sum of pixel gray values of each rectangle, each rectangular feature can be calculated through several separate rectangles (Suo and Han, 2021).
Nonlinear Classification Problems and Kernel Functions
Generally, the image recognition problems are not linearly separable in the space, so we need to use a nonlinear classifier to achieve the purpose of classification. Support vector machine uses kernel function technology to transform nonlinear problems into linear problems. Its working principle is as follows:
For the linearly inseparable data in the space, the mapping function
Defining w as the normal vector of the optimal hyperplane of feature space F, then
where
When the kernel function is used, the original optimization problem can be written as:
The decision function can be written as:
The complexity of the kernel function is only related to the number of support vectors but is independent of the dimension of the feature space.
The idea of the kernel function in the support vector machine is to calculate and replace the point product calculation of the transformation space with a function in the original low-dimensional space, which finally reduces the computational complexity and avoids the disaster of dimension. The kernel function satisfies the Mercer theorem, which is usually regarded as the condition for finding and constructing the kernel function, so the kernel function can be obtained directly without knowing the specific form of the mapping function. Common kernel functions include:
1) Polynomial kernel function:
2) Gaussian radial kernel basis function:
3) Sigmoid kernel function:
Principal Component Analysis Dimension Reduction and Improved Genetic Algorithm Support Vector Machine Character Classification
In the process of digital display instrument recognition, character features need to be extracted first. Due to its high data dimension and high timeliness, the data should be simplified and dimensionless without losing most of the information. Principal component analysis (PCA) is commonly used in data dimensionality reduction. Its process is to select the principal component after KL change of the original data.
If x is an n-dimensional vector, then sample
where N represents the total number of samples and
Let
Let the rank of the matrix
Let
Transform the n-dimensional random variable x:
The n-dimensional variable y,
In the PCA calculation, a new matrix
According to the theory of linear algebra, it can be proved that
where the eigenvalue diagonal matrix of
Matrix
Main Contents of Substation Condition Monitoring
As an important part of the power system, the safe and stable operation of the substation is of great significance. The condition monitoring of the substation mainly involves transformers, mutual inductors, capacitors, lightning arresters, circuit breakers, disconnectors, post insulators, GIS equipment, and other equipment. The research of thisarticle is mainly based on a transformer. The transformer is the main part and functional part of substation equipment, and an important node in the chain of power production–transmission–supply–distribution. Therefore, it has an important influence on the stable operation of the power system and substation., which directly affects the stable operation of the entire power system. Realizing the continuous monitoring of the operation status of the transformer in the substation, it can timely detect the operation fault or hidden danger of the transformer in the substation in the power system and ensure the function and stability of the transformer through automatic repair or some other protection measures, thereby realizing the guarantee for the stable operation of the power system. The theory and method of condition monitoring proposed in this article mainly take the transformer as the research object.
Experimental Results and Analysis
This group of test programs is written to test the character recognition algorithms of various digital tools using Visual c ++ 6.0 software on the Windows platform. The supported vector machine part belongs to LibSVM. This software is a simple, fast, and effective open-source software package for vector machines developed and designed by Professor Lin Zhiren of Taiwan National University. The support vector machine selects the Gaussian radial base function as the core function, and the parameters are obtained by empirical methods, genetic algorithms, and improved genetic algorithms. Empirically, C = 1,000 and
The recognition results of the threading method, template matching method, and different parameter support vector machine method are tested, respectively. When using a support vector machine to recognize characters, extract features, and use principal component analysis to reduce the dimension of data, the contribution rate of the principal component is greater than 90% (Xu et al., 2021). The parameters of one character image are optimized by genetic algorithm, and the fitness curve is shown in Figure 6.
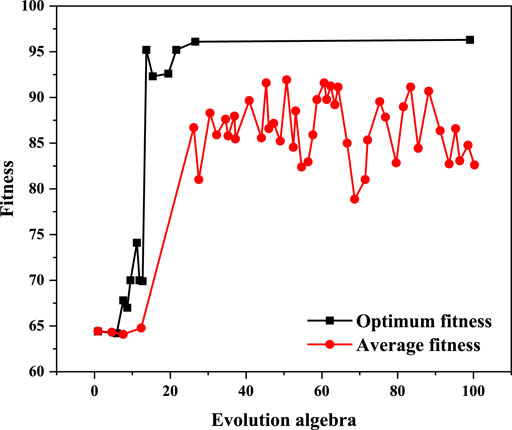
FIGURE 6. Fitness curve of genetic algorithm. The optimal parameters of the support vector machine are C = 13.7926 and
The fitness curve of the improved genetic algorithm is shown in Figure 7.
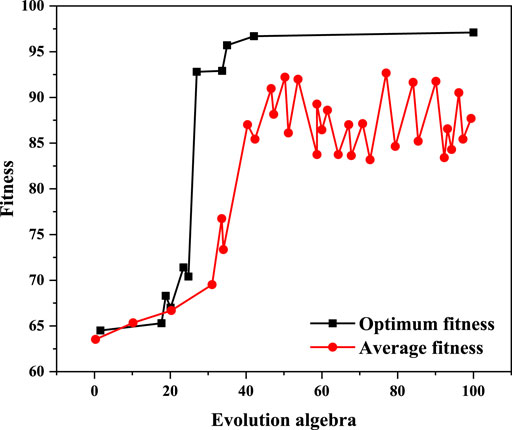
FIGURE 7. Fitness curve of improved genetic algorithm.
The population selected in the initial stage of parameter optimization using genetic algorithm is random, so the results of parameter optimization each time with the same training data are not consistent. In total, five groups of experiments are carried out on the data, and the optimization results of genetic algorithm parameters are shown in Figure 8.
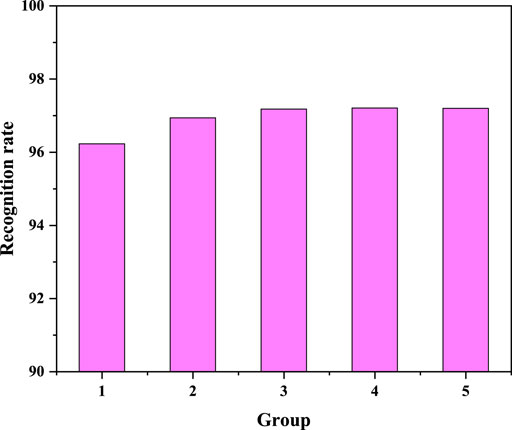
FIGURE 8. Optimization results of genetic algorithm parameters.
The parameter optimization results of improved genetic algorithm are shown in Figure 9.
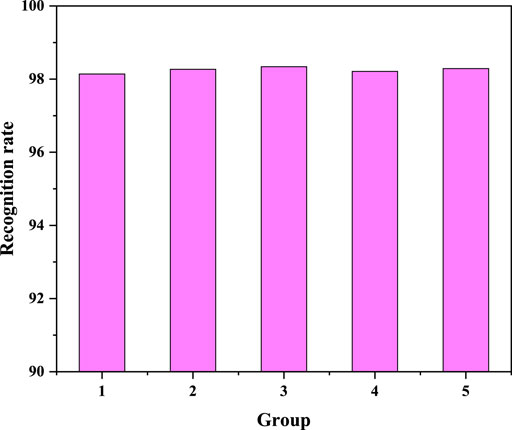
FIGURE 9. Parameter optimization results of improved genetic algorithm.
In total, eight groups of experiments on each character are conducted, respectively, and the results are averaged to obtain the recognition rate, as shown in Figure 10.
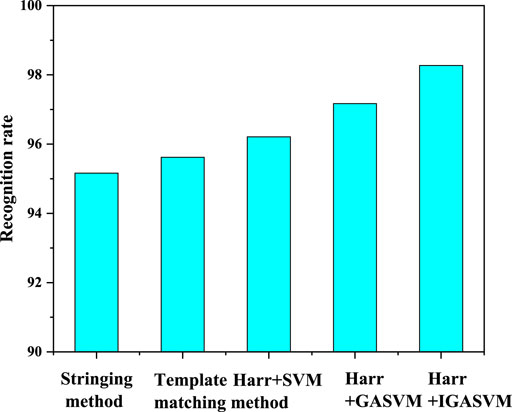
FIGURE 10. Experimental results.
Through the experimental results, it can be seen that using Harr-like function to extract character features and then support vector machine classification based on improved genetic algorithm has a good recognition rate.
To further test the operational efficiency of the proposed method, the runtime of the improved genetic algorithm proposed in the parallel computing mode of the Hadoop cluster MapReduce was compared with the runtime of the traditional algorithm on the same machine-distributed inquiry system. At the beginning of the experiment, data were searched on different sizes of data under two conditions, and the associated recovery time was calculated. To prevent unforeseen events due to unforeseen circumstances, take the average of the five results of the calculation. The final test results are shown in Figure 11. Figure 11 shows that when the data sample size is small, the algorithmic data retrieval speed in the stand-alone system is faster, while when the data sample size reaches about 320,000, the two speeds are close; when the data sample size exceeds 320,000, the recovery speed of the algorithm in the Hadoop cluster is much faster than that of the stand-alone system. This suggests that the method proposed in this document is well-computed to save large amounts of data under machine vision and can significantly save computational time. Since the data size for monitoring the operation of smart substation power equipment is much larger than the sample data size described in this article, the proposed method in Chinese would be more advantageous for engineering applications. In addition, in order to verify the effectiveness of this research method, the historical state data of a substation transformer in recent 1 year are analyzed. The results showed that the analyzed abnormal data are consistent with the abnormal state inspection of the manual transformer in actual work, and the accuracy is very high, but the data analysis time is very short, which can greatly improve the efficiency of substation condition monitoring.
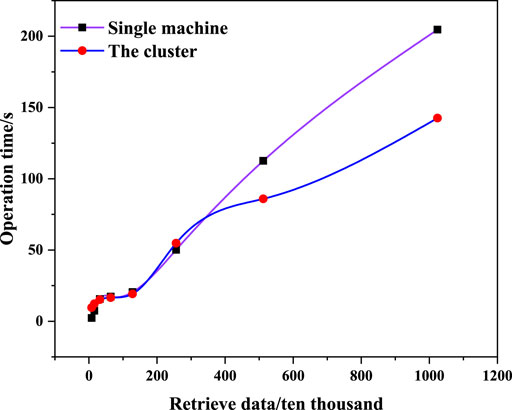
FIGURE 11. Comparison of operation time.
Conclusion
First, the method of character segmentation is introduced, then the threading recognition method and template matching method of character recognition are introduced, and the classification method used in this article is introduced. Then, this chapter describes the principle and related knowledge of Harr-like features and support vector machine in detail and discusses the influence of different optimization algorithms on the determination of support vector machine parameters. At the same time, the implementation steps of character recognition based on an improved genetic algorithm support vector machine are analyzed and designed. Finally, the feasibility of character classification using an improved genetic algorithm support vector machine is verified by experiments, and the historical state data of a transformer are analyzed and compared with manual monitoring, to verify the practicability of this research method. The experimental results show that the proposed machine vision intelligent substation power equipment condition monitoring method can effectively realize the condition monitoring of power equipment, has accurate fault diagnosis accuracy, and has high operation efficiency. The research results of this article have good engineering practicability, and its application in intelligent substation monitoring systems will help to promote the construction of smart grid.
Data Availability Statement
The original contributions presented in the study are included in the article/Supplementary Material; further inquiries can be directed to the corresponding author.
Author Contributions
YW participated in all topic selection planning, writing, communication, and other work of the manuscript.
Conflict of Interest
The author declares that the research was conducted in the absence of any commercial or financial relationships that could be construed as a potential conflict of interest.
Publisher’s Note
All claims expressed in this article are solely those of the authors and do not necessarily represent those of their affiliated organizations, or those of the publisher, the editors, and the reviewers. Any product that may be evaluated in this article, or claim that may be made by its manufacturer, is not guaranteed or endorsed by the publisher.
References
Al-Dulaimi, J., Cosmas, J., and Abbod, M. (2019). Smart Health and Safety Equipment Monitoring System for Distributed Workplaces. Computers 8 (4), 82. doi:10.3390/computers8040082
An, Z., Bai, D., Huang, Y., Ning, W., Deng, Y., Gan, N., et al. (2021). Building Elevator Safety Monitoring System Based on the Bim Technology. J. Phys. Conf. Ser. 1939 (1), 012026. doi:10.1088/1742-6596/1939/1/012026
Cerba, S., Luley, J., Vrban, B., Osusky, F., and Necas, V. (2020). Unmanned Radiation-Monitoring System. IEEE Trans. Nucl. Sci. 67 (4), 636–643. doi:10.1109/tns.2020.2970782
Elewe, A. M., and Zaboon, W. A. (2020). Real Time Rfid-Based Equipment for Monitoring Environmental Railway Systems. Int. J. Industrial Eng. Res. Dev. 11 (1), 8–15. doi:10.34218/Ijierd.11.1.2020.002
Gao, F., Tan, S., Shi, H., and Mu, Z. (2021). A Status-Relevant Blocks Fusion Approach for Operational Status Monitoring. Eng. Appl. Artif. Intell. 106 (23), 104455. doi:10.1016/j.engappai.2021.104455
Jeong, S., An, Y.-Y., Kang, H., Shim, T., and Kim, S.-H. (2020). An Iot Standards-Based Electrical Equipment Status Monitoring System Supporting Modbus/ocf Bridging. Kiee 69 (1), 217–224. doi:10.5370/kiee.2020.69.1.217
Li, D., Liu, P., Huang, G., Ma, Y., Xie, Z., Li, Y., et al. (2021). Design and Application of Intelligent Equipment Management Platform. J. Phys. Conf. Ser. 1983 (18pp), 012098. doi:10.1088/1742-6596/1983/1/012098
Liu, Y., Yang, S., Guan, W., Han, Z., and Qian, Y. (2020). Design of Ar Inspection System for Protection Equipment of Intelligent Substation. E3S Web Conf. 185 (9), 01036. doi:10.1051/e3sconf/202018501036
Lopatin, V., and Kopey, B. (2019). Experience of Safety Monitoring Equipment Application in the Production Processes of Coal Mines in ukraine. New Trends Prod. Eng. 2 (1), 424–431. doi:10.2478/ntpe-2019-0045
Lu, G., and Sun, Z. (2021). Automation Technology in Equipment Installation Technology and Quality Management. J. Phys. Conf. Ser. 1744 (27pp), 022116. doi:10.1088/1742-6596/1744/2/022116
Nan, L. D., Rui, H., Qiang, L., Ning, Z. N., Rui, G., and Yi, L. (2019). Research on Fuzzy Enhancement Algorithms for Infrared Image Recognition Quality of Power Internet of Things Equipment Based on Membership Function. J. Vis. Commun. Image Represent. 62 (JUL), 359–367. doi:10.1016/j.jvcir.2019.06.009
Qian, Y., Zhou, S., Hu, J., Zhu, G., and Hu., Y. (2021). Study on the Development of I&c Equipment Performance Monitoring Program for Nuclear Power Plants. IOP Conf. Ser. Mat. Sci. Eng. 1043 (3), 032009. doi:10.1088/1757-899x/1043/3/032009
Ross, J. C., Saidu, Y., Nzuobontane, D., Voukings, M. Z., and Embrey, S. R. (2020). Application of the Remaining Vaccine Vial Monitor Life Calculation to Field Temperature Monitoring Data to Improve Visibility into Cold Chain Equipment Performance. Vaccine 38 (48), 7683–7687. doi:10.1016/j.vaccine.2020.09.078
Song, C., Zhao, Y., Xue, K. K., and Li, Y. (2020). Failure Rate Model of Electric Equipment Based on Meteorological Environment. J. Phys. Conf. Ser. 1626 (17pp), 012054. doi:10.1088/1742-6596/1626/1/012054
Suo, X., and Han, X. (2021). Research on the Design of Intelligent Data Acquisition Platform for Wireless Monitoring of Rotating Machinery Based on Arm. J. Phys. Conf. Ser. 1992 (25pp), 022051. doi:10.1088/1742-6596/1992/2/022051
Wang, J., Liu, Z., Yang, J., and Zhang, Z. (2022). Research on Novel Optical Fiber Sensor Network Monitoring System for Electrical Equipment. Soft Comput. 26 (8), 3957–3968. doi:10.1007/s00500-021-06464-z
Xu, M., Guo, Y., Zhang, D., Cao, R., Shen, Y., and Han, S. (2021). Research on High Voltage Online Monitoring System for Dielectric Loss of Capacitive Equipment in Substation. IOP Conf. Ser. Earth Environ. Sci. 769 (46pp), 042025. doi:10.1088/1755-1315/769/4/042025
Yan, H., Zhao, Y., Yang, R., and Li, T. (2020). Monitoring Operational Status of Electromechanical Systems Using Audiovisual Information Fusion. J. Braz. Soc. Mech. Sci. Eng. 42 (8), 1–13. doi:10.1007/s40430-020-02522-z
Yu, F., Sun, M., Zhuang, W., and Wang., Y. (2020). Research on Integrated Operation and Maintenance Acquisition and Monitoring Technology for New Generation Dispatching Control System. IOP Conf. Ser. Earth Environ. Sci. 467 (18pp), 012036. doi:10.1088/1755-1315/467/1/012036
Zhang, C., Li, J., Wang, H., and Li, S. (2019). Applications of Big Data in Equipment Health Status Prediction and Spare Parts Replenishment. Zhongguo Jixie Gongcheng/China Mech. Eng. 30 (2), 183. doi:10.3969/j.issn.1004-132X.2019.02.008
Zhang, H., Ge, D., Yang, N., Jia, P., Li, L., and Yang, Y. (2021). Study on Internet of Things Architecture of Substation Online Monitoring Equipment. MATEC Web Conf. 336 (5), 05024. doi:10.1051/matecconf/202133605024
Zhang, K., Tan, L., Chen, S., Xu, M., and Zhang, D. (2021). Research on Intelligent Operation and Maintenance Technology of Primary Equipment in Substation. IOP Conf. Ser. Earth Environ. Sci. 769 (47pp), 042045. doi:10.1088/1755-1315/769/4/042045
Keywords: machine vision, substation, equipment status, Harr-like feature, genetic algorithm, power security, transformer
Citation: Wang Y (2022) Condition Monitoring of Substation Equipment Based on Machine Vision. Front. Energy Res. 10:908999. doi: 10.3389/fenrg.2022.908999
Received: 31 March 2022; Accepted: 21 April 2022;
Published: 27 May 2022.
Edited by:
Fadi Al-Turjman, Near East University, CyprusReviewed by:
Fan Xiao, Henan Polytechnic Institute, ChinaQingzeng Xu, Tianjin University of Science and Technology, China
Copyright © 2022 Wang. This is an open-access article distributed under the terms of the Creative Commons Attribution License (CC BY). The use, distribution or reproduction in other forums is permitted, provided the original author(s) and the copyright owner(s) are credited and that the original publication in this journal is cited, in accordance with accepted academic practice. No use, distribution or reproduction is permitted which does not comply with these terms.
*Correspondence: Yiyao Wang, MjAxOTM5NzRAY3F1LmVkdS5jbg==