 Yuxuan Deng
 Jing Xu
- Bailie School of Petroleum Engineering, Lanzhou City University, Lanzhou, China
The pumped storage unit has a hump area and S characteristics during operation. The operating conditions of the unit are complex, and it is necessary to switch between working conditions. The unit frequently crosses the hump area and the S characteristic area, thus hindering the unit to connect to the grid. Severe vibration affects the safe and stable operation of a power station. With the joint efforts of the industry, the impact of the hump and S-shaped problems on project commissioning has been fundamentally resolved, but the mechanism of inducing hump and S-shaped problems has not yet been well established. Therefore, in this study, the particle image velocity measurement method based on a full-characteristic test was adopted. According to the operating characteristics of the unit, 32 operating points with four guide-vane opening degrees were selected to test the flow pattern in the vaneless space. After subtracting the average flow velocity, the vortex image of the leafless area was obtained, which provided a reference for the design of the runner of the water pump turbine.
Introduction
Currently, pumped storage power stations are globally used as energy storage devices with huge capacities. As of 2020, the total installed capacity of China’s pumped-storage power plants was 40 million kilowatts. A pump turbine is the core component of a pumped storage power station, and its operational stability directly affects the benefit of the power station and the stability of the power grid; thus, it has high research significance.
In the pump mode of a Francis pump turbine, the hump characteristic is a typical feature that may affect the starting stability of the pump mode of the unit (Lu, 2018). Several studies have been conducted on the causes of hump area formation. Gülich (2008) proposed that a sudden change in the flow regime caused the appearance of a hump. The flow regime changes in the hump area have also been studied extensively. Braun et al. (Braun 2009; Eisele et al., 1998; Pacot 2014; Zuo and Liu, 2017; Yin 2011) proposed that the separation of the rotating flow and the pre-swirl of the runner’s outflow are the causes of the hump phenomenon. Furthermore, Ciocan et al. (Ciocan and Kueny, 2006; Ubaldi and Zunino, 1990) pointed out that the transfer of the separation zone causes the hump phenomenon. Braun et al. (Braun et al., 2005; Wang 2009; Yao 2015) also proposed that the flow separation at the runner outlet and the flow loss caused by the backflow phenomenon causes the hump phenomenon. Li et al. (2015). (Guedes et al., 2002) proposed that the separation vortex of the guide vane area plays an important role in the formation of hump characteristics. The change in the flow pattern inside the unit is critical in the formation of the hump area; therefore, it is important to visualize the flow pattern inside the unit.
The vortex motion inside the turbine induces pressure pulsations, such as vortex rope of drafttube (Ji et al., 2022) and channel vortices. The Large eddy simulation is also increasingly being used in the calculation of vortex motion inside turbines (Hu and Zhang, 2020). For internal turbine flow, entropy production theory becomes a new analytical tool. By means of entropy production analysis, the vortex characteristics of the hump and S characteristic area of the pump turbine are correlated with the energy loss phenomenon (Li et al., 2017; Chen 2018). Therefore it is important to study the swirl flow inside the turbine.
Under the working conditions of the Francis pump turbine, the S characteristic is also a phenomenon that hinders the safe and stable operation of the unit. It is affected by the vortex generated by the flow separation development at the inlet of the runner (Li et al., 2013). To verify this assertion, the flow pattern in the vaneless space must be observed.
Particle image velocimetry (PIV), as a transient, multi-point, non-contact hydrodynamic velocity measurement method, has been widely used in researching the internal flow of fluid machinery in recent years. Compared with other non-contact measurement means (such as LDV, ultrasonic measurement, etc.), PIV has the advantages of high accuracy, large imaging area, easy installation, and strong anti-interference ability (Li et al., 2021a)
Yan et al., (2019) used the PIV test method to study the flow pattern inside the runner of a Francis pump turbine, and determined the influence of the impingement angle of the runner blade and the GVO on the flow pattern. Tang et al. (2020), Xu et al. (2021) used the PIV test method to study the inter-blade vortex of a Francis turbine and obtained the initiation and development of the inter-blade vortex. The author also used the PIV test method to test the pump turbine under four-quadrant working conditions. The flow pattern in the vaneless space of the pump turbine was observed, and the vortex change and development laws were obtained (Tang 2020). Liu et al., 2021 studied the vortex structure of the vaneless space of two different runners in–the turbine multiple working conditions under different working conditions through the PIV test. Moreover, they studied the working characteristics of the unit under unstable conditions.
With the rapid development of computer technology, CFD (Computational fluid dynamics) technology has become an important method to study fluid (Li et al., 2021b; Li et al., 2021c). In this study, we employed numerical calculation and PIV test method study the vaneless space of a Francis pump-turbine under pump and turbine modes. The generation and evolution processes of the vortex structure in the vaneless space under different operating conditions were conducted to study the effect of the vortex structure in the vaneless space in the hump zone and the S characteristic zone.
Computational Fluid Dynamics Simulation
The typical parameters of the model pump turbine are listed in Table 1. The model diagram of the pump turbine is shown in Figure 1.
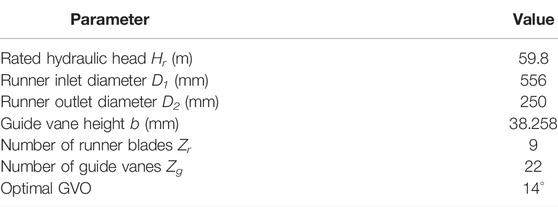
TABLE 1. Table of basic geometric parameters of model.
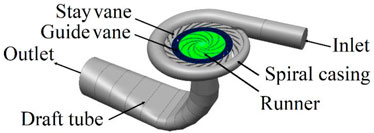
FIGURE 1. Model pump turbine.
Using ICEM and Turbogrid, the model pump turbine is divided into hexahedral mesh. At the same time, Since the number of grids affects the calculation results, the grid independence is verified (Li et al., 2021a). When the number of grids reached 4.9 million, the efficiency and head fluctuation were less than 0.05%, which met the accuracy required by the numerical simulation. The grid diagram and grid independence diagram are shown in Figure 2 (Since this article focuses on the flow characteristics of the vaneless space, only the grid of the runner and the guide vane area is shown). The number of grids in each part is shown in Table 2.
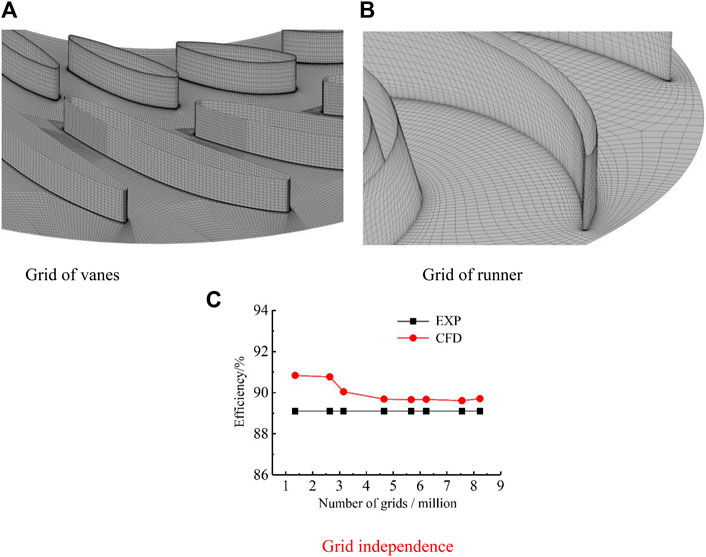
FIGURE 2. Grids and grid independence. (A) Grid of vanes (B) Grid of runner (C) Grid independence.
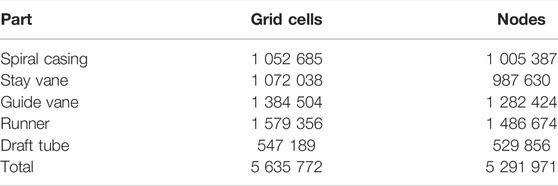
TABLE 2. Number of grids and nodes.
SST k-ω turbulence model (Menter, 1992; Menter 1994; Menter 1997; Deng et al., 2022) is used in CFD simulation. The SST k-ω model can accurately predict the onset of flow and flow separation at negative pressure gradients, and the SST k-ω model is widely used in the calculation of S-characteristic area and hump area (Xia et al., 2019). In the CFD simulation, only the pump turbine with Optimal GVO is calculated. The operating point parameters are shown in Table 3. (Positive and negative flow rates indicate the direction of flow, with positive values in the table when the water flows in the direction of the pump and negative values in the table when the water flows in the direction of the turbine) In the pump condition, the opening inlet and the flow outlet are adopted; in the hydraulic turbine condition, the flow inlet and the opening outlet are adopted.
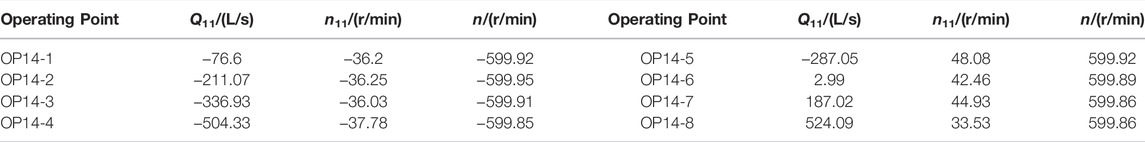
TABLE 3. Table of operating point in CFD Simulation. (A positive value represents the direction of the turbine, and a negative value represents the direction of the pump).
The unit flow and unit speed are defined as follows:
where n11 is the unit speed (rpm), Q11 is the unit flow (L/s), n is the speed (rev/min), Q is the flow (L/s), H is the working head (m), and D2 is the nominal diameter of the runner (m).
This is shown in Figure 3, OP14-1 has the best flow pattern, and only one guide vane channel has a vortex. As the unit flow rate (absolute value) decreases, vortices begin to appear in the runner area and continue to increase. At OP14-4, the flow pattern was the worst.In the turbine mode, the flow pattern is the best when OP14-5, and the flow line in the flow channel is smooth at this time, and there is no vortex at all. As the unit flow rate decreases, vortices begin to appear in the guide vane area and runner area, and the number of vortices increases as the unit flow rate decreases.
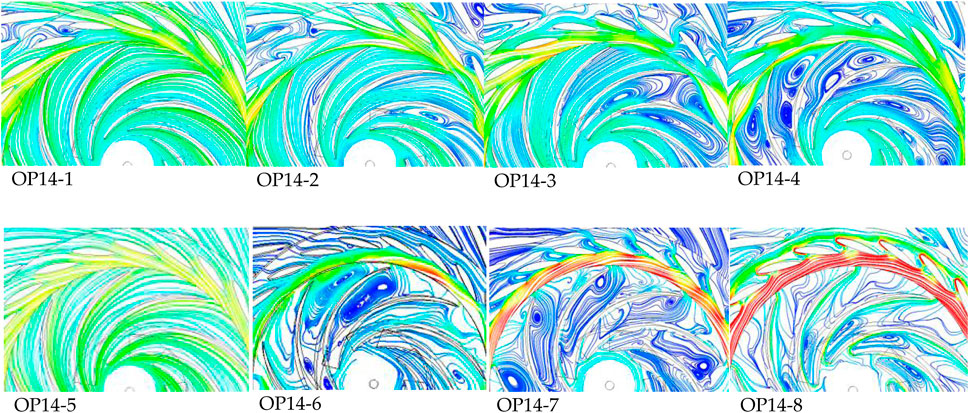
FIGURE 3. Streamlines of runner and vanes at Span = 0.50.
Although we have obtained the flow characteristics of the flow field inside the unit through CFD simulation, it is very difficult to obtain the flow characteristics of the vaneless space through CFD simulation. Therefore, it is very important to obtain the flow field in the vaneless space through experimental methods.
Methods
PIV Technology Principle
Particle image velocimetry is a method that uses multiple shots to record the position of particles in the flow field and analyze the captured images to measure the flow velocity. Tracer particles were added to the flow field, and then irradiated by high-frequency pulsed lasers. Using the light reflectivity and followability of the tracer particles to visualize the transient changes in the flow field, the velocity measurement principle is shown in Figure 4A.
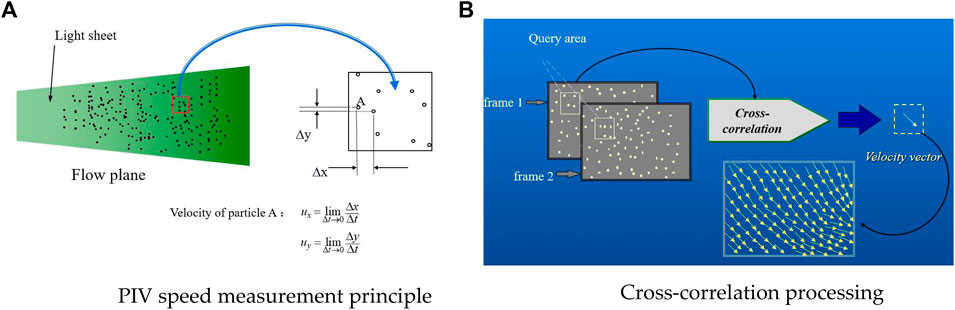
FIGURE 4. PIV principle. (A) PIV speed measurement principle (B) Cross-correlation processing.
In the figure,
PIV System and Model Pump Turbine Parameters
The PIV test system is composed of tracer particles, pulsed laser and sheet light source lens group, CCD camera, synchronizer, and special workstation. The main technical indicators of the PIV test system are listed in Table 4. The parameters of the model pump turbine used in the test are consistent with the CFD model.
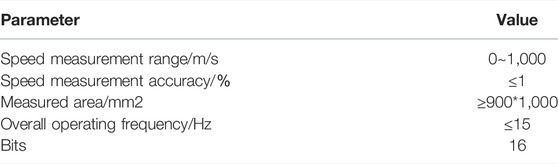
TABLE 4. Technical index of PIV test system.
PIV Test System Transparency Solution
To realize the shooting of the flow pattern in the vaneless space of the model pump turbine, the spiral casing and top cover of the vaneless space of the model pump turbine were opened to set up transparent windows. The window material used was plexiglass (polymethyl methacrylate). A physical picture of the observation window of the spiral casing opening and the top cover of the vaneless space is shown in Figure 5. Meanwhile, to realize the shooting of the vaneless space, some stay vanes and guide vanes were transparently processed. A picture of the transparent vane is shown in Figure 6. A schematic of the laser incident light path and test location are shown in Figure 7.
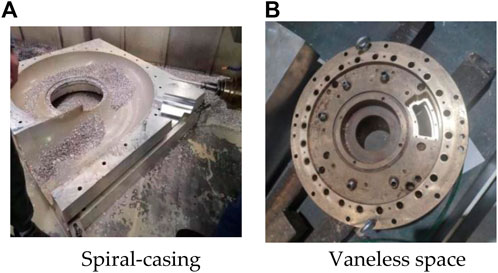
FIGURE 5. Observation window. (A) Spiral-casing (B) Vaneless space.
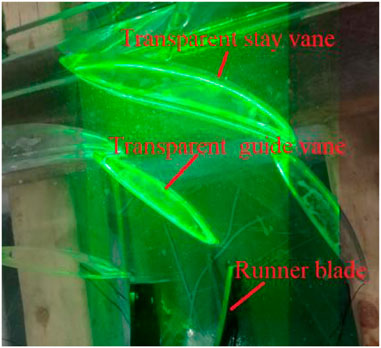
FIGURE 6. Transparent stay vane and guide vane.
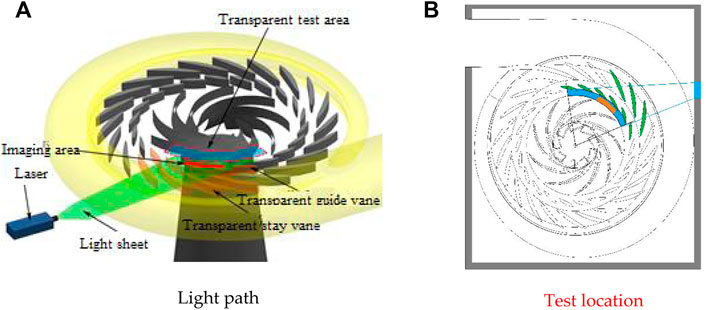
FIGURE 7. Diagram of laser incident light path. (A) Polyamide resin (B) Silica.
Tracer Particle Selection
Tracer particles are the key test material in the PIV test, and their performance can have a greater impact on the test effect. The tracking particles must meet the requirements of followability and reflectivity. Followability reflects the error of the velocity of the particles and the fluid medium, while the reflectivity has a greater impact on the camera imaging and calculations in the post-processing software. The influence of the particle size, density, and optical properties of the tracer particles on the test should be considered during the preliminary preparation of the test. In the PIV test of this subject, three types of tracer particles were compared through comparative tests, namely polyamide resin particles, silica, and hollow glass beads, as shown in Figure 8.
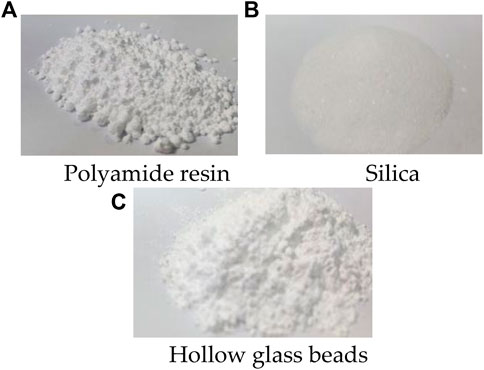
FIGURE 8. Tracer particles. (A) Polyamide resin (B) Silica (C) Hollow glass beads.
By integrating the test of light reflectivity and followability (Mainly the imaging effect and the deviation from the theoretical flow velocity were velocimetrically measured in a circular tube test to compare the followability.), the tracer particles used in the PIV test observation in this vaneless space are hollow glass beads. The hollow glass beads have a diameter between 10 and 14 μm, and the density (1.0081 g/cm3) is close to that of water. The performance of the tracer particles in the PIV vaneless space test is shown in Figure 9.
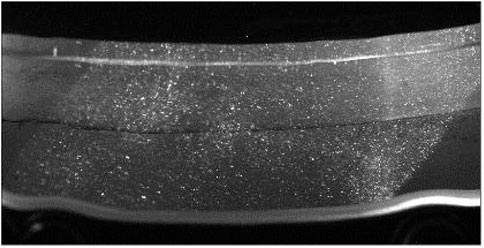
FIGURE 9. Display effect of hollow glass beads.
Test Bench
The structural system of the test bench includes a high-pressure water tank, a model water pump turbine test section (including a dynamometer), a low-pressure water tank, and a vacuum pump system, which is a closed-loop test system. The system was supplied by two 24SA-10 single-stage double-suction centrifugal water pumps. The pumps were connected to two 850 kW bidirectionally rotating DC motors. The DC motors were powered by two sets of fully digital DC speed-regulating devices. The pump unit can realize stable operation within a range of 400~1,000 r/min. The maximum lift of the single pump was 85 m. The maximum flow rate was 1.0 m³/s, and the maximum speed was 1,000 r/min. The maximum water head of the test bench was 170 m, and the speed stabilization accuracy was 0.1%. The diameter of the high-pressure pipeline of the system was 500 mm, and that of the low-pressure pipeline was 700 mm. A bidirectional electromagnetic flowmeter was used for flow calibration. The diameter of the high-pressure water tank and the low-pressure water tank of the test bench was 2.4 m. These large containers stabilize the water flow before and after the model unit, and the water flows through the electromagnetic flowmeter. A schematic diagram of the hydraulic test bench is shown in Figure 10. The parameters of the test bench are listed in Table 5.
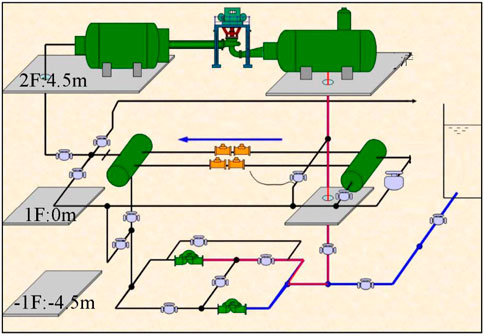
FIGURE 10. Hydraulic machinery general test bench system.
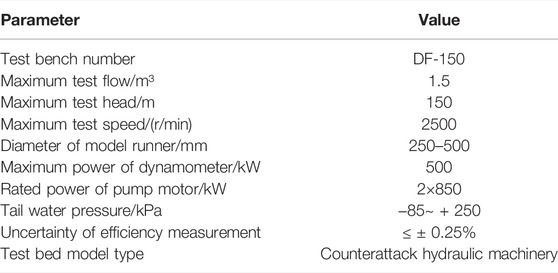
TABLE 5. Table of test bed parameters.
Experiment Procedure
1.Turn on the power and debug the test bench and PIV system.
2.Add tracer particles individually to the draft tube until the display effect meets the requirements.
3.Run the pump turbine according to the test conditions, and then take pictures after the standby group runs stably.
4.After the test is completed in all working conditions, shut down the system, and transfer the original images taken by the CCD camera to the computer for data processing.
A total of 32 operating points under four GVO of 6°, 14°, 18°, and 20° were tested for PIV.
Results and Analysis
Pump Mode
In the pump mode, a total of 16 operating points was selected for testing, and the test working condition points are listed in Table 6.
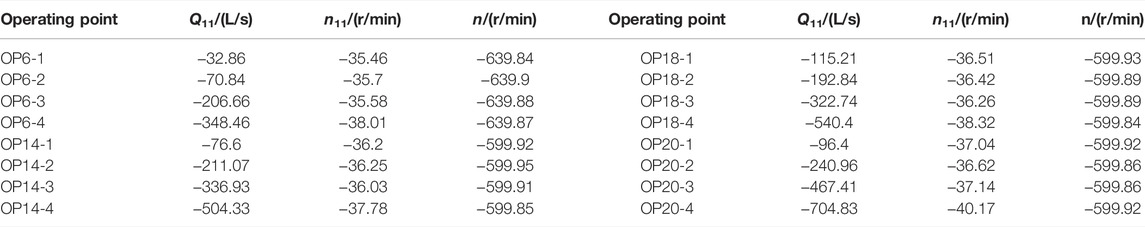
TABLE 6. Table of operating point in pump mode. (A negative value indicates that the running direction of the unit in the test is the pump direction).
Flow coefficient φ and head coefficient ψ are defined as follows:
where Q is the flow rate, u is the average velocity of the exit section, H is the head, and g is the gravitational acceleration.
The flow pattern in the vaneless space at each operating point is displayed on the flow–pressure coefficient curve of each GVO, as shown in Figure 11 (The test curve is drawn through the full-characteristic test, and the test points are only part of the full-characteristic operating conditions).
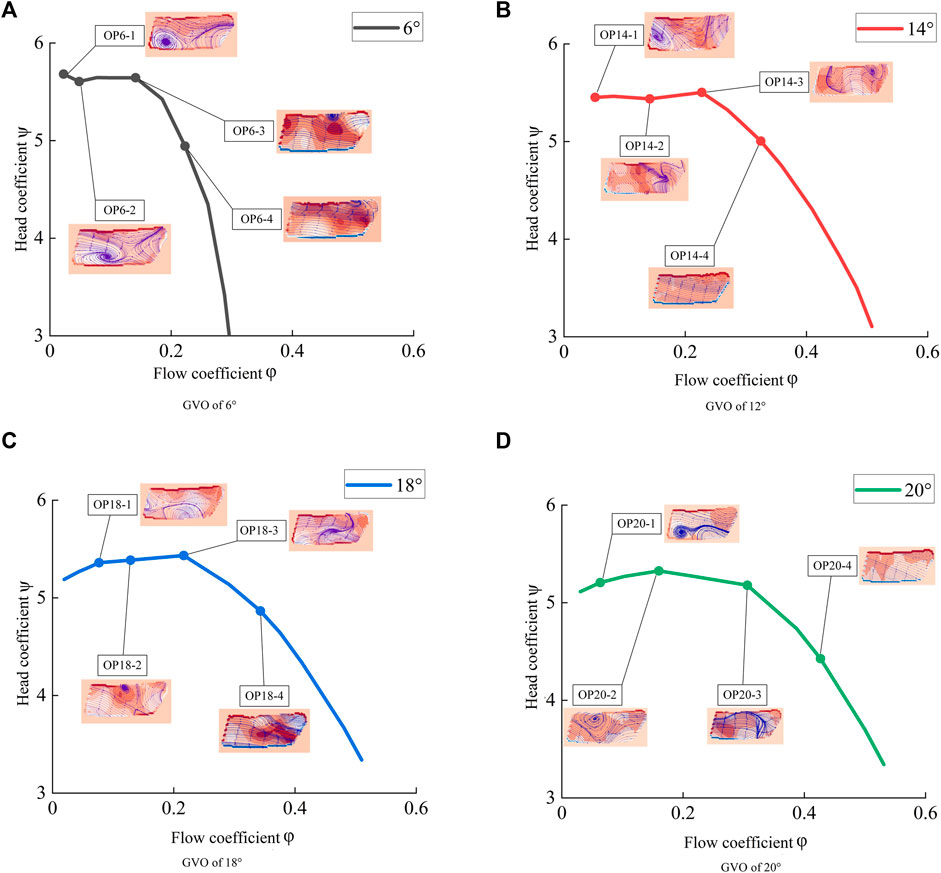
FIGURE 11. Test results are on the hump curve. (A) GVO of 6° (B) GVO of 12° (C) GVO of 18° (D) GVO of 20°.
In the figure, a negative value of vorticity indicates counterclockwise rotation, while a positive value indicates clockwise rotation. In Figure 8, as the flow coefficient decreases, the flow state gradually deteriorates. At OP6-3, OP14-3, OP18-3, and OP20-2, the main points of the hump and vortices began to appear. With a decrease in the discharge coefficient, the vortex begins to develop fully, and the existence of the vortex reduces the water flow in the guide vane area. With a further decrease in the discharge coefficient, the vortex begins to separate and develop fully, and the hump phenomenon gradually disappears at this time. Water can smoothly pass through the guide vane area, and the pumping capacity is restored. The stall vortex in the vaneless space is an important cause of the hump phenomenon. The vortex structure in the vaneless space under the pump mode is a counterclockwise rotating flow separation phenomenon that starts to occur at the entrance of the rotating wheel flow channel, and the separated flow spreads in the vaneless space and forms a vortex. The vortex structure moves in the vaneless space with water flow in the guide vane area. During the movement, the vortex structure changes the flow field around it, and the streamlines are twisted to form a new vortex structure. At this time, a part of the vortex structure showed a clockwise rotation trend. The blocking effect of these vortices on the water flow hinders water from passing through the guide vane channel, causing a large hydraulic loss. The increase in hydraulic loss causes the effective head of the pump turbine to deviate further from the Euler head, leading to the emergence of the hump phenomenon.
Turbine Mode
In the turbine mode, a total of 16 operating points were selected for testing, and the test working condition points are listed in Table 7. The flow pattern in the vaneless space at each operating point is shown in the S characteristic curve of each GVO, as shown in Figure 9 (The test curve is drawn through the full-characteristic test, and the test points are only part of the operating conditions).
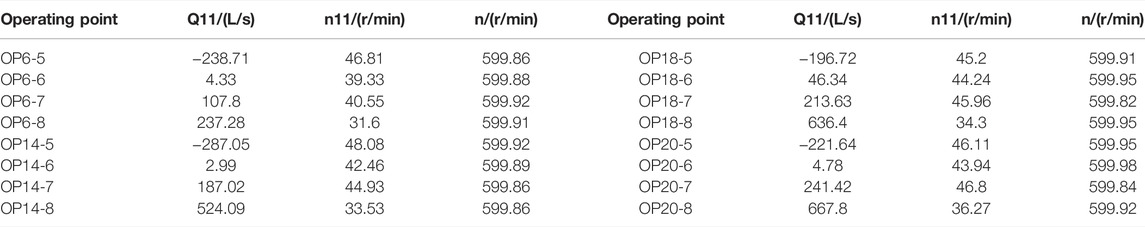
TABLE 7. Table of operating point in turbine mode. (A positive value represents the direction of the turbine, and a negative value represents the direction of the pump).
In Figure 12, as the unit flow decreases, the flow regime in the vaneless space gradually deteriorates. In high-efficiency zones OP6-5, OP14-5, OP18-5, and OP20-5 of the turbine mode, it can be observed that the internal flow of the vaneless space is even, and the water flow cannot be effectively hindered from entering the interior of the runner. When the unit flow is reduced, the pump turbine deviates from the optimal operating point, and at this time, a flow vortex occurs at the inlet of the runner blade. When entering the no-load condition, a large number of vortices begin to appear in the vaneless space, and the vortices at this time are generated from the de-flow of the fixed guide vane and the wake of the guide vane. Meanwhile, it was observed that vortices with different rotation directions appeared in the leafless area of OP14-6, which may be derived from the Karman vortices generated by the guide vanes. As the unit flow continues to decrease, when entering a small flow condition, the extremely low flow distorts the internal streamline of the vaneless space, generating large-scale vortices, which almost block the vaneless space. In the working condition of the reverse-pump mode, the vortex scale in the vaneless space is large, and a free vortex rotating clockwise appears. In most working conditions, there is a double vortex structure in the visible area, which is derived from the backflow of the pressure surface of the runner blade. The existence of the vortex hinders the normal movement of the water flow in the vaneless space and produces a backflow toward the inlet of the runner. After the recirculation vortex flows out of the runner channel, it moves along the guide vane area of the vaneless space. Because each runner channel has a recirculation vortex, a continuous vortex distribution appears in the vaneless space. The local low pressure caused by these continuous high-speed vortices causes high-frequency characteristics of the pressure pulsation in the vaneless space. Similar to the pump mode, the rotation direction of the vortex rotates clockwise in the turbine mode.
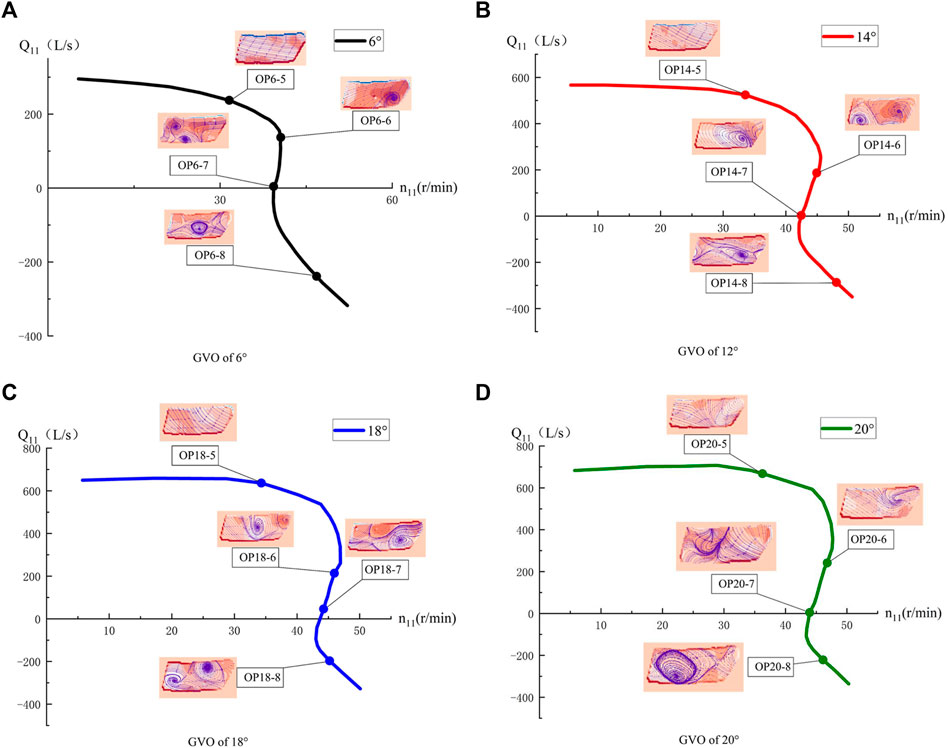
FIGURE 12. Test results are on the S curve. (A) GVO of 6° (B) GVO of 12° (C) GVO of 18° (D) GVO of 20°.
The vortex motion in the S-characteristic zone is an important factor in the unstable operation of the unit. These swirls originate from the strong FSI effects and the violent changes in the speed triangle at the exit of the runner. The strong pressure pulsation phenomenon induced by vortex motion can seriously affect the operational safety of the unit, so the vortex structure in the vane free zone due to different runner configurations can be compared by means of PIV tests to optimize the runner design.
Conclusion
The PIV test of the vaneless space was conducted on the model pump turbine under four GVOs of the pump and turbine modes, and the following conclusions were drawn:
1.In the stable operation section of the pump-turbine mode, the water flow in the vaneless space is smooth, and vortices begin to appear after entering the hump zone. The vortices show the characteristics of separation and development as the discharge coefficient decreases.
2.In the pump-turbine mode, the vortices in the vaneless space mostly exist in the form of clockwise rotation, and only a small part of the vortices rotate counterclockwise owing to the influence of the water flow. The size of the vortex in the vaneless space of the hump area is related to the GVO, and the vortex scale is larger when the GVO is small. The hydraulic loss caused by the vortex in the vaneless space is an important cause of the hump phenomenon of the pump turbine.
3.The pump turbine flows steadily in the vaneless space of the high-efficiency zone of the turbine. After the unit flow decreases and enters the low-load zone, large-scale vortices begin to appear. The vortex size gradually increased with a decrease in the unit flow until the vaneless space was blocked. The vortices in the hydraulic turbine operating conditions mostly rotate in a clockwise direction. The continuous distribution of vortices in the vaneless space affects the pressure pulsation in the vaneless space under turbine conditions.
4 The vortex motion in the S-characteristic zone is an important factor in the unstable operation of the unit. These swirls originate from the strong FSI effects and the violent changes in the speed triangle at the exit of the runner.
The limitation of the PIV test for the vaneless space in this paper is due to the fact that we used a 2D PIV device, which is defective for the accurate description of the 3D flow, and we will use a more advanced 3D PIV device to test the vaneless space flow in the next step of our work.
Data Availability Statement
The raw data supporting the conclusion of this article will be made available by the authors, without undue reservation.
Author Contributions
The YD wrote and improved the paper; JX provided guidance and advice on writing the paper; YL provided guidance on the analysis of the study, YZ provided guidance on the test apparatus, and CK provided guidance on the tests.
Funding
Doctoral Research Foundation of Lanzhou City University (LZCU-BS2019-07), Open Fund of Key Laboratory of Fluid Machinery, Ministry of Education (LTDL 2020-005).
Conflict of Interest
The authors declare that the research was conducted in the absence of any commercial or financial relationships that could be construed as a potential conflict of interest.
Publisher’s Note
All claims expressed in this article are solely those of the authors and do not necessarily represent those of their affiliated organizations, or those of the publisher, the editors and the reviewers. Any product that may be evaluated in this article, or claim that may be made by its manufacturer, is not guaranteed or endorsed by the publisher.
References
Braun, O., Kueny, J., and Avellan, F. (2005). “Numerical Analysis of Flow Phenomena Related to the Unstable Energy-Discharge Characteristic of a Pump-Turbine in Pump Mode[C],” in ASME 2005 Fluids Engineering Division Summer Meeting (American Society of Mechanical Engineers (ASME)). 2005.
Braun, O. (2009). Part Load Flow in Radial Centrifugal Pumps. Zurich: École Polytechnique Fédérale de Lausanne. 2009. doi:10.5075/epfl-thesis-4422
Chen, Q. (2018). Entropy Production Rate Analysis in S Zone for a Pump-Turbine. Beijing: Tsinghua University. PhD Thesis.
Ciocan, G., and Kueny, J. (2006). “Experimental Analysis of Rotor Stator Interaction in a Pump-Turbine[C],” in Proc. XXIII IAHR Symposium on Hydraulic Machinery and Systems Yokohama, Japan.
Deng, W., Xu, L., Li, Z., Tang, W., Wang, X., Shang, L., et al. (2022). Stability Analysis of Vaneless Space in High-Head Pump-Turbine under Turbine Mode: Computational Fluid Dynamics Simulation and Particle Imaging Velocimetry Measurement. Machines 10, 143. doi:10.3390/machines10020143
Eisele, K., Muggli, F., Zhang, Z., Casey, M., and Sallaberger, M. (1998). “Experimental and Numerical Studies of Flow Instabilities in Pump -turbine Stages[C],” in XIX IAHR Symposium Singapore. 1998.
Guedes, A., Kueny, J., and Ciocan, G. (2002). “Unsteady Rotor-Stator Analysis of Hydraulic Pump-Turbine: CFD and Experimental Approach[C],” in 21st IAHR Symposium (Switzerland: Lausaunne). 2002.
Hu, X., and Zhang, L. (2020). F Numerical Simulation of Unsteady Flow for a Pump-Turbine in Transition Cases with Large-Eddy Simulation. J. Hydraulic Eng. 49 (04), 492–500. doi:10.13243/j.cnki.slxb.20170340
Ji, L., Xu, L., and Peng, Y. (2022). Experimental and Numerical Simulation Study on the Flow Characteristics of the Draft Tube in Francis Turbine. Machines 10 (4). 2022. doi:10.3390/machines10040230
Li, D., Wang, H., and Xiang, G. (2015). Unsteady Simulation and Analysis for Hump Characteristics of a Pump Turbine Model. Renew. Energy 77, 32–42. doi:10.1016/j.renene.2014.12.004
Li, D., Wang, H., Qin, Y., Han, L., Wei, X., and Qin, D. (2017). Entropy Production Analysis of Hysteresis Characteristic of a Pump-Turbine Model. Energy Convers. Manag. 149, 175–191. doi:10.1016/j.enconman.2017.07.024
Li, R., Liu, D., and Dong, Z. (2013). Numerical Simulation Analysis of the Whole Flow Passage of Pump Turbine in S-Shaped Area. J. Drainage Irrigation Mach. Eng. 31 (05), 401–405. (in Chinese). doi:10.3969/j.issn.1674-8530.2013.05.007
Li, W., Li, Z., and Qin, Z. (2021c). Influence of the Solution pH on the Design of a Hydro-Mechanical Magneto-Hydraulic Sealing Device[J]. Eng. Fail. Anal. 135, 106091. doi:10.1016/j.engfailanal.2022.106091
Li, W., Zhenggui, L., Wanquan, D., Lei, J., Yilong, Q., and Huiyu, C. (2021a). Particle Image Velocimetry Flowmeter for Natural Gas Applications. Flow Meas. Instrum. 82, 102072. doi:10.1016/j.flowmeasinst.2021.102072
Li, Z., Li, W., Li, W., Wang, Q., Xiang, R., Cheng, J., et al. (2021b). Effects of Medium Fluid Cavitation on Fluctuation Characteristics of Magnetic Fluid Seal Interface in Agricultural Centrifugal Pump. Int. J. Agric. Biol. Eng. 14 (6), 85–92. doi:10.25165/j.ijabe.20211406.6718
Liu, D., Ma, L., and Li, N. (2021). Experimental Research on Flow Field of High Head Pump Turbine Based on PIV Test. IOP Conf. Ser. Earth Environ. Sci. 627, 012016. doi:10.1088/1755-1315/627/1/012016
Lu, G. (2018). Investigations on the Influence of the Flow Separation in Guide Vane Channels on the Positive Slope on the Pump Performance Curve in a Pump-Turbine. Beijing: Tsinghua university. 2018. (in Chinese).
Menter, F. (1992). Improved Two-Equation K-W Turbulence Models for Aerodynamic Flows. NASA Ames, CA: NASA Technical Memorandum TM 103975. 1992.
Menter, F. R. (1997). Eddy Viscosity Transport Equations and Their Relation to the K-ε Model. J. Fluid Eng. 119, 876–884. doi:10.1115/1.2819511
Menter, F. R. (1994). Two-equation Eddy-Viscosity Turbulence Models for Engineering Applications. AIAA J. 32 (8), 1598–1605. doi:10.2514/3.12149
Pacot, O. (2014). Large Scale Computation of the Rotating Stall in a Pump -turbine Using an Overset Finite Element Large Eddy Simulation Numerical Code [D]. Zurich: École Polytechnique Fédérale de Lausanne. 2014.
Tang, Z., Liu, X., and Wang, X. (2020). PIV Test Study on the Vaneless Space of Pump Turbine in Four Quadrants Working Condition. Water Resour. Power 38 (07), 154–156. (in Chinese).
Tang, Z. (2020). Experimental and Numerical Study on Channel Vortex of Francis Turbine. Chengdu: Xihua university. 2020. (in Chinese). doi:10.27411/d.cnki.gscgc.2020.000213
Ubaldi, M., and Zunino, P. (1990). “Experimental Investigation of the Stalled Flow in a Centrifugal Pump-Turbine with Varied Diffuser[C],” in ASME 1990 International Gas Turbine and Aeroengine Congress and Exposition (American Society of Mechanical Engineers (ASME)), V001T01A069. 1990.
Wang, H. (2009). Numerical Simulation and Experimental Research on the Hump Region of Francis Pump Turbine. Wuhan: Huazhong University of Science and Technology. 2009. (in Chinese).
Xia, L.-S., Cheng, Y.-G., Yang, J.-D., and Cai, F. (2019). Evolution of Flow Structures and Pressure Fluctuations in the S-Shaped Region of a Pump-Turbine. J. Hydraulic Res. 57 (1), 107–121. doi:10.1080/00221686.2018.1459893
Xu, L., Jin, X., Li, Z., Deng, W., Liu, D., and Liu, X. (2021). Particle Image Velocimetry Test for the Inter-blade Vortex in a Francis Turbine. Processes 9, 1968. doi:10.3390/pr9111968
Yan, R., Bi, Y., and Wu, R. (2019). Study on Flow Characteristics in the Runner of Francis Pump-Turbine Based on Piv Technology. Chin. J. Hydrodynamics 34 (06), 720–725. (in Chinese). doi:10.16076/j.cnki.cjhd.2019.06.003
Yao, Y. (2015). Numerical Study on the Flow Mechanism of the Hump Characteristics of Pump Turbines under Pump Mode. Beijing: Tsinghua university. (in Chinese).
Yin, L. (2011). Prediction of Pressure Fluctuations of Pump -turbine under Ff-Design Condition in Pump Mode. J. Eng. Thermophys. 32 (7), 1141–1144.
Keywords: pump turbine, pump mode, turbine mode, particle imaging velocimetry, fluid
Citation: Deng Y, Xu J, Li Y, Zhang Y and Kuang C (2022) Experimental and Computational Fluid Dynamics Study of the Flow Field of a Model Pump Turbine. Front. Energy Res. 10:911874. doi: 10.3389/fenrg.2022.911874
Received: 03 April 2022; Accepted: 14 June 2022;
Published: 01 July 2022.
Edited by:
Daqing Zhou, Hohai University, ChinaCopyright © 2022 Deng, Xu, Li, Zhang and Kuang. This is an open-access article distributed under the terms of the Creative Commons Attribution License (CC BY). The use, distribution or reproduction in other forums is permitted, provided the original author(s) and the copyright owner(s) are credited and that the original publication in this journal is cited, in accordance with accepted academic practice. No use, distribution or reproduction is permitted which does not comply with these terms.
*Correspondence: Yuxuan Deng, bHpjc2Rlbmd5eEAxNjMuY29t