 Fatemeh Jozi
 Ali Abdali
 Kazem Mazlumi
 Seyed Hadi Hosseini
- Department of Electrical Engineering, Faculty of Engineering, University of Zanjan, Zanjan, Iran
The use of large-scale electric vehicles (EVs), along with technological advances in battery energy storage systems (BESS), offers numerous technical and economic benefits to the smart distribution system. Parking lots not only provide EV owners with the opportunity to charge their BESS but also contribute power to the grid via vehicle-to-grid (V2G) technology, which significantly improves the reliability of distribution systems. In addition, parking lots equipped with V2G capability can participate in the electricity market as a producer. In this study, the reliability of a smart radial distribution system in the presence of EVs is investigated. It should always be borne in mind that parking lots can improve system reliability if the charging and discharging strategies are optimally and correctly scheduled. On the contrary, the parking lot participates in sending power to the grid in a situation where the profit is appropriate. Accordingly, in this study, first, five optimal strategies for scheduling the process of EV charging and discharging in a parking lot equipped with V2G capability are proposed to maximize parking profits. The proposed strategies include constraints on the amount of power exchange between the parking lot and the distribution system and the random and stochastic nature of quantities, such as when EVs enter and exit the parking lot and their BESS charge amounts when entering the parking lot. The results demonstrate that using the proposed optimal charging and discharging strategies scheduling increases the parking profit by 31% and also improves the reliability of the understudy distribution system by 9%.
1 Introduction
1.1 Background and Motivations
Due to the huge increment in energy demand and greenhouse gas emissions, intensive energy production systems have changed and entail fundamental actions to confront the world’s electricity demand increment (Abdali et al., 2017; Abdali et al., 2020; Meenual and Usapein, 2021; Pinto et al., 2021). The essential reduction in fossil fuels and environmental pollutants has led to considering electric vehicles (EVs) as a viable alternative to combustion vehicles (Faia et al., 2021; Fang et al., 2021). Vehicle-to-grid (V2G) technology, which can only be implemented via EV, is the vehicle’s ability to allow power flow to the distribution network. EVs can store energy and supply it to the grid, and, if needed, they can participate in power injection into the grid and act as a distributed storage set and as emergency generators on the distribution side (Wang et al., 2018; Jozi et al., 2022). These features provide support services, including spinning reserve and voltage and frequency control. These factors improve the efficiency and reliability of the system. Furthermore, vehicles can participate in electricity markets and provide many economic benefits to their owners and the grid (Gou et al., 2021).
With the expansion of the application of EVs, the parking lots of EVs have been considered in the distribution system (Sattarpour and Farsadi, 2017; Akhavan-Rezai et al., 2018; Hadian et al., 2020). It should be noted that the benefits of V2G depend on how the charging and discharging of EVs are performed (Xu and Chung, 2016; Gou et al., 2021). If the charging process is not controlled, charging times will interfere with the load peak of the system, and the distribution network will encounter problems such as overloading, excessive loss of power, and violation of voltage limitations (Alahyari et al., 2014; Hua et al., 2014; Sabillon Antunez et al., 2016).
With the advent of V2G technology, EVs can participate in electricity markets. Accordingly, many studies have been conducted on the scheduling of the power supply required by EVs and how they participate in the electricity markets. These studies aim to reduce the cost of charging and increase the received revenue for the sale of energy to the grid. In addition to the economic benefits, V2G technology has enabled EVs to reduce interrupt loads by sending power to the network during an outage; therefore, various studies have been conducted to evaluate the reliability of the distribution system in the presence of V2G.
1.2 Literature Review
Sabillon Antunez et al. (2016) proposed a second-order mixed-integer linear programming (MILP) method for the charging process scheduling of EVs in unbalanced electrical distribution systems. The purpose of this scheduling is to minimize the cost of energy provided by substations and DGs. In this method, the EV exit time is determined by its user. If this does not happen, it is assumed that the EV will remain connected to the grid for a certain period of time. Sufyan et al. (2020) investigated the impact of EV charging process scheduling with V2G technology to maximize profits for EV owners and minimize system costs. However, in these scenarios, the amount of energy exchange between the EVs and the network is minimal, making the EV owners’ profits small and the system costs very high.
Nizami et al. (2021) proposed a scheduled management structure for EVs in a low voltage residential network to support the power network against overloading and voltage sag. However, charging and discharging strategies must meet the economic benefits of parking owners to convince parking lots to participate in energy exchange with the distribution network.
Unforeseen errors can disrupt the performance of the power grid and consumers. Khan et al. (2021) presented second-order mixed-integer nonlinear programming (MINLP) to maximize the reliability of the distribution system and minimize losses and the distribution system voltage regulation using PSO optimization. It should always be noted that charging and discharging strategies will be successful in increasing the reliability of the distribution system if they convince parking lot owners by increasing the parking profit.
Shafiq et al. (2020) evaluated the reliability of the power system by considering the forced outage rates (FORs) of generators, transmission lines, and transformers. This study presented a probabilistic method for load modeling and EVs with different penetration levels. The results show that controlled charging strategies improve reliability and increase the loss of load probability (LOLP) with increasing load. Guner and Ozdemir (2020) studied the effects of the EV parking lots on the reliability of the distribution system. Accordingly, it is assumed that the parking lots will be used as a backup provider for the network in cases of non-supply or failure of feeder components. In this study, EVs are used on average 5–7 times a year as backup resources for the network, and it is not possible to use EVs daily and continuously as a power supply unit. In addition, the desire of EV owners to provide support services to the distribution system is not considered.
1.3 Contributions
As mentioned, V2G technology improves the reliability of the distribution system, but it should always be borne in mind that parking lots can improve system reliability if charging and discharging strategies are properly designed. In contrast, the parking lot contributes to the transmission of power to the grid where the received profit is appropriate; therefore, in the first stage, the charging and discharging strategy should be designed to convince the parking lot to contribute to improving the reliability of the distribution system with suitable parking lot profit.
This study has investigated the reliability of a smart radial distribution network in the presence of EVs. Based on this, first, five strategies are proposed to schedule the charging and discharging process of EVs in a V2G equipped parking lot, aiming at maximizing the profit of parking. Restrictions on the amount of power exchange between the parking lot and the distribution network are studied. Moreover, the random and unpredictable nature of the quantities, such as the time of arrival and departure of the EVs to the parking lot and their state of charge (SoC), while arriving at the parking lot in the proposed strategies, have been considered. Therefore, charging and discharging strategies are designed independent of the duration of EVs’ presence in the parking lot and considering the limitations of power exchange with the distribution system. In addition, the improvement of the reliability of the distribution system and the economic benefits of V2G are examined simultaneously.
Hence, the major contributions and novelties of this study are summarized as follows.
• Reliability improvement of the smart distribution grid via optimal strategies for charging and discharging process scheduling.
• Designing comprehensive charging and discharging strategies with the aim of increasing parking profits in order to increase the participation of EVs in the V2G process and, ultimately, the reliability improvement of the smart distribution system.
• Independence of designed strategies from the number and duration of studied time periods.
• Considering the stochastic and unpredictable nature of EV entry and exit times and their energy level when entering the parking lot in the process of designing strategies.
• Considering the limitations on the amount of power sent from the smart distribution system to the parking lot and vice versa in the process of designing strategies.
1.4 Paper Organizations
The rest of the article is organized as follows: Section 2 presents the functions of the parking profit; Section 3 presents the charging-discharging strategies to increase the parking cost according to the grid constraints; Section 4 analyzes parking profit and distribution network reliability indexes in each of the strategies; and finally, Section 5 provides the conclusions.
2 Parking Lot Profit Function and Requirements
The reliability of the distribution network depends on the energy exchanged between the parking lot and the distribution network. The energy exchanged depends on the fact that the parking considers the processor or strategy for charging and discharging. Definitely, the owner of the parking lot will choose a strategy that will generate more profits by charging and discharging. In the first stage, in order to determine the parking profit in each of the strategies, it is necessary to introduce a function to calculate the parking profit.
2.1 Parking Lot Profit Function
The parking profit with the maximum capacity of Nev EV (Nev represents the number of EVs), which has been operated in the period R = [0-T], is calculated according to Eq. 1. The time interval R is divided into Nts time intervals of 1 hour:
In Eq. 1, Btotal equals total parking revenue and Ctotal equals total parking costs:
In the above equation, Bgdch denotes the total parking profit received from the grid for the sale of energy to the grid, Bpark represents the total parking fee from the owners of the EV for parking the EV in the parking lot, Bech is the total received cost by a parking lot from EV owners for the increase in vehicle battery when leaving the parking lot (perceived cost for selling energy to EV owner), Cgch denotes the total parking cost paid to the grid for purchasing energy from the grid, Cedch is the total parking cost paid to EV owners for decreasing EV battery charge while departing the parking lot (cost of purchasing energy from EV), Cmcs denotes the total parking fee to EV owners for failing to provide minimum capacity specified for (if agreed), and Csh is the total parking fee paid to the owners of EV for the share of the EV owner in the profit of the V2G (if there is an agreement). The following presents the computational equations of the components of the parking profit function:
Bgdch,i is the receipt of the parking lot for the sale of energy to the grid from the battery discharging of the EV No. i and Ri is the time step when the EV No. i is present in the parking lot.
pdch(t) is the actual power that the parking lot sends to the grid from the battery discharging point of the EV No. i at time t, and pricedch,t is equal to the selling price of energy at time t.
EV owners have to pay a cost to the parking owner depending on how long the EV has been in the parking lot. Due to the difference in the time of each EVs’ presence in the parking lot, this cost will be different for each EV. This cost can be calculated using the following equation:
Bpark,i is equal to the cost that EV No. i pays for parking EV. Eq. 7 shows how to calculate the parking cost per EV:
According to Jozi et al. (2022), the duration of the presence of EVs in the parking lot is a random and stochastic quantity with an unbalanced distribution. In Eq. 7, dpark,i is equal to the duration of the presence of EV No. i in the parking lot. Eq. 7 states that if the presence duration of the EVi in the parking lot is less than d0, it must pay a fixed cost per hour in accordance with a factor. However, if the presence duration of the EVi in the parking lot exceeds t0, it will have to pay a variable cost per hour of parking in addition to the previous cost. This variable cost is determined by a factor b. The values of the constant coefficients a, b, and d0 are selected by the parking lot.
In addition to selling energy to the grid, parking lots can make money by charging the EV battery and selling energy to the EV owner. Therefore, if the amount of SoC of the EV battery has increased compared to its condition when entering the parking lot, the EV owner must pay a cost according to the amount of SoC increment to the parking lot. Eqs 8, 9 show how this cost is calculated:
In Equations 8, 9, Cech,i is equal to the cost that EV No. i pays for parking its SoC increment. SoCin and SoCout indicate the battery charging status of EV No. i when entering and exiting the parking lot, respectively. r1 is also the energy sales tariff to the EV owner.
If the EV owner provides the parking lot with information about how long the EV has been in the parking lot, the parking lot will be able to make more detailed scheduling. However, if the EV owner acts contrary to their information, the parking schedule will be disrupted and the parking lot will suffer financial losses. In order to avoid the financial loss of the parking lot, if any agreement, the EV must pay a cost for the parking violation. Obviously, the amount of payment for each EV varies according to the amount of the violation, and the total parking cost will be calculated from the following equation:
Bpen,i is equal to the receipt of parking received for EV No. i violation. The required equations to calculate the amount of Bpen,i will vary depending on the parking agreement and the owner of the EVi. Therefore, how to calculate Bpen,i will be explained in Section 3.5.2.
G2V capability allows the parking lot to receive the battery charging energy of existing EVs from the grid. Equations 11, 12 show how to calculate the cost of parking paid to the grid for energy purchases:
In Equations 11, 12, Cgch,i is the parking cost for purchasing energy from the grid from EV No. i battery charging. pch(t) is the actual power that the parking lot receives from the grid for charging EV No. i at time t, and pricech,t is equal to the purchase price of energy from the grid at time t.
Sometimes the SoC of the EV battery not only does not increase when leaving but also decreases relative to the amount when entering the parking lot. In other words, the battery energy is discharged. In this case, the parking lot is obliged to pay a cost to the EV owner according to the amount of SoC reduction:
Cedch,i is equal to the cost that the parking lot pays to the owner for reducing the SoC of the EV No. i battery. r2 is also the energy purchase tariff from the EV owner.
The parking lot is required to charge the EV batteries to the specified minimum capacity. If the SoC of the battery of EV No. i is less than the specified minimum capacity at the time of exiting, the parking lot must pay a cost to the owner of EV No. i, if any agreement:
Cmcs,i is equal to the cost that the parking lot pays to the owner of EV No. i for not providing the specified minimum capacity. SoCmcs,i also indicates the minimum capacity specified for SoCi.
Continuous charging and discharging affect the battery life of EVs. To compensate for this damage, if the parking lot benefits from the participation of EV No. i in the V2G process, it can provide a part of the profit from EV No. i to the owner under a specific agreement:
Csh,i is equal to the cost that the parking lot pays to the owner for the benefit of EV No. i. The contribution of EVs to the profit is determined by a coefficient of K.
2.2 Study Period
Considering the behavioral patterns of EVs, the period when the EV is parked and can be charged often begins in the last hours of the day and lasts until the next day. Therefore, the full EV charging period will be separated by two calendar days (Xu and Chung, 2014).
2.3 EV Behavior
EV behavior has three main characteristics: the time of entering the parking lot, the time of leaving it, and the amount of initial energy when entering the parking lot. The time EV enters and leaves the parking lot is random and unpredictable. Therefore, in each time step t, using stochastic methods, the EVs entering the parking lot and the cars leaving the parking lot are determined in time step t.
2.4 Allowable Charging and Discharging Time Step Determination
Due to the change in grid consumption over the course of a day, energy prices also change as a function of consumption at each hour of the day. Therefore, pricech,t and pricedch,t will take different values at each time step t. Obviously, as pricech,t decreases and pricedch,t increases, the parking profit will increase. Consequently, the first step in scheduling the charging and discharging process in a parking lot is to determine the allowable charging and discharging time step.
In the allowable charging and discharging time step determination in a parking lot, it is necessary to pay attention to the following.
2.4.1 Received Parking Profit
Purchasing energy from the grid in the time steps when the energy price is lower and selling it to the grid in the time steps when the energy price is higher will increase the parking profit. Therefore, in the [0-T] interval, the allowable charging and discharging time steps must be determined in such a way that the pricedch always has a higher value than the pricech.
The median index is calculated for energy price data over the course of a day. Because the median index divides the data into two groups with the same number of data, if the median index for energy prices in a day is equal to M.I, in 12 time steps, the energy price will be more than M.I, and in the other 12 time steps, the energy price will be less than M.I.
2.4.2 The Main Task of the Parking lot
The main task of the parking lot is to charge the EVs and increase their SoC level when leaving the parking lot. Therefore, the number of allowable charging time steps must be more than the number of allowable discharging time steps. Therefore, the value of M.I is increased to a minimum amount, which leads to an increase in the number of allowable charging time steps relative to the number of allowable discharging time steps.
Thus, Rch is the allowable time steps for charging and Rdch is the allowable time steps for discharging. According to Eqs 20, 21, Rch consists of n discrete time steps for the charging process and Rdch consists of m discrete time steps for the discharging process:
In Eq. 19, nj is equal to the jth allowable charging discrete time step, and in Eq. 20, mk is equal to the kth allowable discharging discrete time step.
Each of the allowable charging and discharging discrete time steps consists of continuous-time steps. According to Equations 21, 22, nj consists of x allowable charging continuous time steps and mk consists of y allowable discharging continuous time steps:
In Equation 21, tnj,1 represents the beginning of the nj time step and tnj,x represents the end of the nj time step. In Eq. 22, tmk,1 represents the beginning of the mk time step and tmk,y represents the end of the mk time step.
2.5 Parking Limitation on Power Exchange
The amount of power exchanged between the grid and the parking lot at each time step does not depend only on the number of EVs in the parking lot and their SoC. Parking also has limitations, and it is not possible to exchange more power than the allowed for parking. Accordingly, the maximum number of EVs that the parking lot can charge or discharge at any time is determined according to Eqs 23, 24:
Mch(t) is equal to the maximum number of EVs that the parking lot can charge in time step t and Mdch(t) is equal to the maximum number of EVs that the parking lot can discharge in time step t. Pchmax(t) is equal to the maximum power that the parking lot can receive from the grid at time step t and Pdchmax(t) is equal to the maximum power that the parking lot can send to the grid at time step t.
2.6 Interactions of EV Owner and Parking Lot
In general, three types of interaction can be considered between the EV owner and the parking lot:
• Interaction 1: the EV owner does not allow the parking lot to charge and discharge the EV and will only pay for the EV parking in the parking lot. Therefore, there is no need to design a charging and discharging strategy in this interaction.
• Interaction 2: the EV owner allows the parking lot to charge and discharge the EV, and if the EV is not charged to the minimum required capacity when leaving the parking lot, the parking lot will be subject to a penalty to the EV owner. In this interaction, no information is available about how long the EV has been in the parking lot. In such a situation, the parking lot must adopt a suitable strategy for charging and discharging process scheduling of EVs to increase its profit.
• Interaction 3: the EV owner allows the parking lot to charge and discharge the EV. It also determines the EV exit time. In this interaction, if the EV is not charged to the minimum required capacity at the time of leaving the parking lot, the parking lot is required to pay a penalty to its owner. In contrast, the EV owner wants to provide facilities by the parking lot to determine the time of EV leaving. In such cases, in addition to charging and discharging process scheduling, it is necessary to determine the value of penalties that the EV owner must pay to the parking lot in case of violation of the provided information.
3 Scheduling of the Charging and Discharging Process of EVs
The reliability of the distribution network depends on the energy exchanged between the parking lot and the distribution network. The energy exchanged depends on which processor or strategy for charging and discharging is considered by the parking. Definitely, the owner of the parking lot will choose a strategy that will generate more profits by charging and discharging. Determining the optimal strategy cannot be formulated. Therefore, like scenario-based approaches, we explore different strategies that can be adopted. In this study, the charging-discharging strategy means the control method that manages the charging and discharging process in EV parking. There are five different strategies to schedule the charging and discharging process of the EVs in the parking lot.
3.1 Strategy 1
3.1.1 Charging Strategy
In order to schedule the EV charging process at each allowable charging time step, it should be noted that, due to the limitation on the amount of power sent from the grid, the parking lot will not be able to charge all EVs in the parking lot. Therefore, determining the priority for EVs charging has a very important role in the parking profit. The charging strategy at each time step determines the charging priority of the EVs.
In this strategy, the charging priority of EVs in each charging time step is determined only by their SoC level in the same time step, and the behavior of EVs in the previous charging and discharging time steps has no role in determining the charging priority. In the following, the required equations for calculating Jch,1(t) are presented:
In Equation 26, SoCi(t-1) indicates the battery charging status of the EVi in the time step (t-1). Due to the limitation on the maximum number of EVs that the parking lot can charge at any time step, the coefficient v1,i(t) is considered in Eq. 25. v1,i(t) indicates the presence or absence of EVi in the charging process. Therefore, in Eq. 27, it is defined as a binary variable.
Charging strategy constraints include the following equations:
Equations 27–30 are true in all charging strategies. The charging process scheduling up to strategy 3 will be done by the Jch,1(t) function.
3.1.2 Control Filters
In the following, control filters g(x), s(x), and y(x) will be used to express the equations of each strategy:
3.1.3 Discharging Strategy
In scheduling the discharging process, the existence of a limitation on the amount of power that the parking lot can send to the grid at any time step has led to a limitation on the number of EVs that can be discharged at any time step. Therefore, in order to increase parking profits, the priority of discharging EVs must be determined at each time step.
In this strategy, the priority of discharging EVs in each time step t is determined by comparing the parking receipt from the grid for sending power to the grid (via EVi) in the time step t and the parking cost paid to the EVi owner for not providing SoCmcs,i in the time step t. In fact, the discharging function of strategy 1, Jdch,1(t), according to the amount of profit from the discharging of EVs in the time step t and the limitation on the amount of power sent to the grid determines their discharging priority. In the following, the required equations for calculating Jdch,1(t) are presented:
Due to the limitation on the maximum number of EVs that the parking lot can discharge at any time step t, the coefficient w1,i(t) is considered in Eq. 34. w1,i(t) indicates the presence or absence of EVi in the discharging process. In Eq. 35, Bgdch,i(t) is the parking receipt from the grid for sending power via EVi in time step t. Cmcs,i(t) is equal to the parking cost paid to the EVi owner for not providing SoCmcs,i at time step t.
The required equations to calculate Bgdch,i(t) and Cmcs,i(t) in this strategy are introduced as follows (discharging rate is the same for all EVs):
According to Eq. 38, if the SoC level is still higher than SoCmcs,i, despite discharging EVi in time step t, parking does not pay the cost in time step t. Otherwise, the cost of parking in time step t is equal to C’mcs,i(t).
As shown in Eq. 38, the amount of parking receipt for EVi discharging in the previous discharging time steps is not included in the calculation of Bgdch,i(t). Therefore, the cost to the parking lot of not providing SoCmcs,i at the previous discharging step time should not re-affect the EV discharging priority at time step t.
If EVi has not been discharged by the parking lot in any of the previous discharging time steps, C’mcs,i(t) is calculated as follows:
If EVi has been discharged by the parking lot during the previous discharging time steps, to calculate C’mcs,i(t), it is necessary to calculate how much the parking lot has paid in the previous discharging time steps. As mentioned before, the EVi time step in the parking lot consists of charging and discharging discrete time steps. If the EVi passes the charging discrete time step before reaching the time step t, it may be possible to compensate part of the cost incurred in the previous discharging time steps by charging the EVi. However, due to restrictions on Mch, part of this cost is not compensated. Therefore, C’mcs,i(t) is calculated as follows:
Cn-s,i(t) represents the uncompensated payment up to the time step t. Eq. 41 calculates Cu-p,i(t):
tmk,1 is equivalent to the first continuous-time step in the kth of the discharging discrete time step.
Discharging strategy constraints include the following equations, which are true of all discharging strategies:
3.2 Strategy 2
3.2.1 Discharging Strategy
In strategy 2, the simplification and acceleration of the EV discharging process scheduling is considered. In this strategy, the priority of discharging EVs in each time step t, by comparing the total parking received profit from the grid, for power exchange with the grid (via EVi), from the first allowable discharging time step of tm1,1 to the time step t and the total parking cost paid to EVi owner for not providing SoCmcs,i will be determined up to time step t. Therefore, the discharging function of strategy 2, Jdch,2(t), examines the total received parking profit from the grid up to time step t and the total parking payment cost for not providing SoCmcs,i if EVi is discharged at time step t:
In Equation 46, B″gdch,i(t) represents the total received profit by the parking lot from the grid for the exchange of power through EVi, from time step tm1,1 to time step t. C″mcs,i(t) represents the total cost of parking for not providing SoCmcs,i up to time step t.
According to the above points, B″gdch,i(t) is defined as follows:
In relation (47), mk is equivalent to kmth of the discharging discrete time step and tmk,1 is its first continuous-time step. Eq. 48 shows how C″mcs,i(t) is calculated.
3.3 Strategy 3
3.3.1 Discharging Strategy
In this strategy, the priority of discharging EVs at each time step is determined according to the behavior of EVs during the previous charging and discharging time steps. Accordingly, the number of times that the EV has participated in the charging process in the previous time steps and also the number of times that the EV has not participated in the discharging process in the previous time steps despite being in the parking lot plays an essential role in determining EV discharging priority because EVi’s participation in the charging process and its non-participation in the discharging process in the previous time steps reduce the penalty paid to its owner.
EVi performance during the charging and discharging time steps will affect the cost paid for Cmcs,i (according to Eq. 15). Therefore, the discharging function of strategy 3, Jdch,3(t), first examines that if EVi is discharged in time step t, how it will operate during the time of entering the parking lot until the end of time step t, what will be the share of the amount of cost paid for Cmcs,i. Then, by comparing this amount of contribution (paid contribution) and the maximum possible amount for it, the EVi discharging priority is determined. The following equations are required to calculate Jdch,3(t):
The parking payment contribution at time step t depends on the maximum possible amount for SoCi from the entering time of EVi to the parking lot to time step t. Thus, Fi(t) is defined as follows:
In Eq. 50, SoCmpv,i(t) is the maximum possible value for SoCi in the time step t. Thefollowing equation shows how to calculate G′1,3,i(t):
In the following, the required equations for calculating G″1,3,i(t), G″2,3,i(t), and G′2,3,i(t) are presented.
In the case where it is possible to obtain SoCmcs,i for EVi and despite the discharging of EVi in the time step t, the amount of SoCi is higher than that of SoCmcs,i. The paid contribution of parking is as follows:
On the contrary, the maximum values of SoCmpv,i(t), SoCmcs,i, and SoCi(t-1) are equal to Ebattery, and the minimum values are zero. Therefore, the range of changes Cpc,i (t) will be in the range −Es.r3 to Es.r3. Accordingly, G″1,3,i(t) is defined as follows:
In circumstances that it is possible to obtain SoCmcs,i for EVi and discharging EVi at a time t reduce the amount of SoCi from the amount of SoCmcs,i, the paid contribution of the parking lot is as follows:
G″2,3,i(t) is defined as follows:
If it is not possible to obtain SoCmcs,i for EVi, the parking paid contribution is equal to the cost of not providing SoCmpv,i(t). Therefore, the paid contribution of the parking lot is as follows:
According to the above point, in case the parking paid cost is the same for different EVs, the EV with a higher SoCi(t-1) will have a higher priority. Therefore, α(SoCi(t-1)) will be considered in the calculations. By performing trial and error calculations, α is equal to 0.0001.
G′2,3,i(t) is defined as follows:
3.4 Strategy 4
In strategy 4, the charging and discharging process of EVs is scheduled according to EVs’ performances in the past time steps.
3.4.1 Charging Strategy
In this strategy, the priority of charging EVs at each time step is determined according to the behavior of EVs during the previous charging and discharging time steps. In other words, the number of times that EV did not participate in the charging process during the previous allowable charging time steps despite being in the parking lot and the number of times EV participated in the charging process during the previously allowable charging time steps play a key role in determining EV charging priority. Therefore, the charging function of strategy 4, Jch,4(t), first examines how the EVi will function from the time it takes to enter the parking lot to the start of time step t and what will contribute to the amount of energy not supplied (energy shortage compared to SoCmcs). Then, by comparing this amount of contribution and the maximum possible amount for it, the EVi charging priority is determined. The following equations are required to calculate Jch,4(t)
The amount of not supplied contribution at time step t depends on the maximum possible value for SoCi from the time EVi enters the parking lot until time step t. Thus, Fi(t) is defined as follows:
In the following, the required equations for calculating F′1,4,i(t) and F′2,4,i(t) are presented. Therefore, first Ensc,i (t) is calculated to determine the extent of EVi energy shortage due to non-participation in the charging process, and also a participation in the discharging process is encountered.
In case it is possible to obtain SoCmcs,i for EVi, it is not supplied contribution is in the following form:
In contrast, the maximum values of SoCmpv,i(t), SoCmcs,i, and SoCi(t-1) are equal to Ebattery, and the minimum values are zero. Therefore, the range of changes Ensc,i (t) will be in the range −Es to Es. Accordingly, Es- Ensc,i (t) will always have a non-negative value, and as a result, it is possible for all EVs to participate in the charging process, even if their SoC value is higher than SoCmcs,i. Thus, F′1,4,i(t) is defined as follows:
In case it is not possible to obtain SoCmcs,i for EVi, it is not supplied contribution is in the following form:
According to the above point, in case the amount of not supplied contribution is the same for different EVs, the EV with a higher SoCi(t-1) will have a higher priority. Therefore, α(SoCi(t-1)) will be considered in the calculations. By performing trial and error calculations, α is equal to 0.0001.
F′2,4,i(t) is defined as follows:
3.4.2 Discharging Strategy
As mentioned, strategy 3 determines EV priorities based on their performance during the presence in the parking lot. Therefore, strategy 4, the Jdch,3(t) function, is used to schedule the discharging process.
3.5 Strategy 5
3.5.1 Bpark Calculation in Interaction 3
In interaction 3, the EV owner determines the exit time, so the parking lot is required to schedule charging and discharging according to the EV leaving time. As mentioned, the EV owner is asking for parking facilities in exchange for determining the duration of the EVs’ presence in the parking lot. Accordingly, the value of Cpark,i in interaction 3 is calculated according to the following equation, where r<a must be specified:
3.5.2 Bpen Calculation in Interaction 3
Charging and discharging scheduling is done according to how long the EV will be in the parking lot, and providing incorrect information by the EV owner will reduce the parking profit. Therefore, the EV owner is required to pay a cost if he does not leave the parking lot at a specified time.
If the EV leaves the parking lot earlier than scheduled, the parking lot will not be able to attain the benefits of selling energy to the grid despite scheduling, so the EV owner is required to compensate for the cost. This cost is determined as follows:
In relation (114), dap,i is the allotted time for EVi to be present in the parking lot. dpark,i is the length of time EVi has been in the parking lot.
If the EV leaves the parking lot later than scheduled because the parking lot is not aware of how long the EV will be in the parking lot, EV charging and discharging cannot be done based on the length of time in the parking lot the parking profit will be reduced. Accordingly, the EV owner is required to pay the EV parking cost in the parking lot for a period longer than the allotted time, in accordance with the amount determined in interaction 2. This cost is determined as follows:
3.5.3 Charging Strategy
In this strategy, the charging priority of EVs at each time step is determined based on their future behavior. The charging function of strategy 5, Jch,5(t), determines the EVi charging priority according to the remaining time for its presence in the parking lot and its SoC level. The following equations are required to calculate Jch,5(t):
In order to satisfy the customer and the possibility of participation of EVs in the sale of energy to the grid, EVs whose energy level, even if EV is charged at all allowable charging time steps and not discharged at all allowable discharging future time steps, is less than SoCmcs,i. They have a higher priority than other EVs to participate in the charging process. Thus, F5,i(t) is defined as follows:
Nch,i is the number of allowable time steps for charging during the study period. The expected SoCout,i, SoCexp,i, are calculated according to the conditions in the time step t as follows:
In Eq. 69 Ndch,i is the number of allowable time steps for discharging during the study period, and SoCexp,I is the expected SoC for EVi considering its duration in the parking lot. If there is no limitation on the battery capacity, the maximum possible value for SoCexp is equal to Nch. pch + Ebattery. Therefore, for calculating Jch,5(t), the following equations are used:
The values of F′1,5,i(t) and F′2,5,i(t) will always be non-negative. The coefficient β is also determined as 0.1 by performing calculations.
3.5.4 Discharging Strategy
In this strategy, the priority of discharging EVs in time step t is determined based on their behavior in the future, that is, how long they will be in the parking lot. Strategy 5 discharging function, Jdch,5(t), determines the priority of EVi discharging according to the remaining time for its presence in the parking lot and its SoC level. The following equations are required to calculate Jdch,5(t):
In order to satisfy the EV owner, if the parking presence time and the amount of SoCi(t-1) are such that if the EV is discharged at time step t and charged at all allowable future time steps, the amount of battery energy will decrease compared to SoCmcs,i, and the parking lot is not allowed to discharging it. Because of the limitation in Mch(t), EVi may not be able to participate in all steps of charging, so if EV is discharged, the difference between SoCout,i and SoCmcs,i will increase. According to this, G5,i(t) is defined as follows:
EVs that are present in the parking lot for such a time step that even if the EV is discharged in all allowable discharging time steps and it is not charged in all allowable charging time steps, its energy level still exceeds the value of SoCmcs,i, have higher priority. Otherwise, they have less priority to participate in the discharging process. Thus, G′1,5,i(t) is defined as follows:
where coefficient µ >>1.
3.6 Summary of Strategies
In order to simplify the proposed strategies and transfer the concepts appropriately, Table 1 (a) to (j) summarizes the equations of the functions.
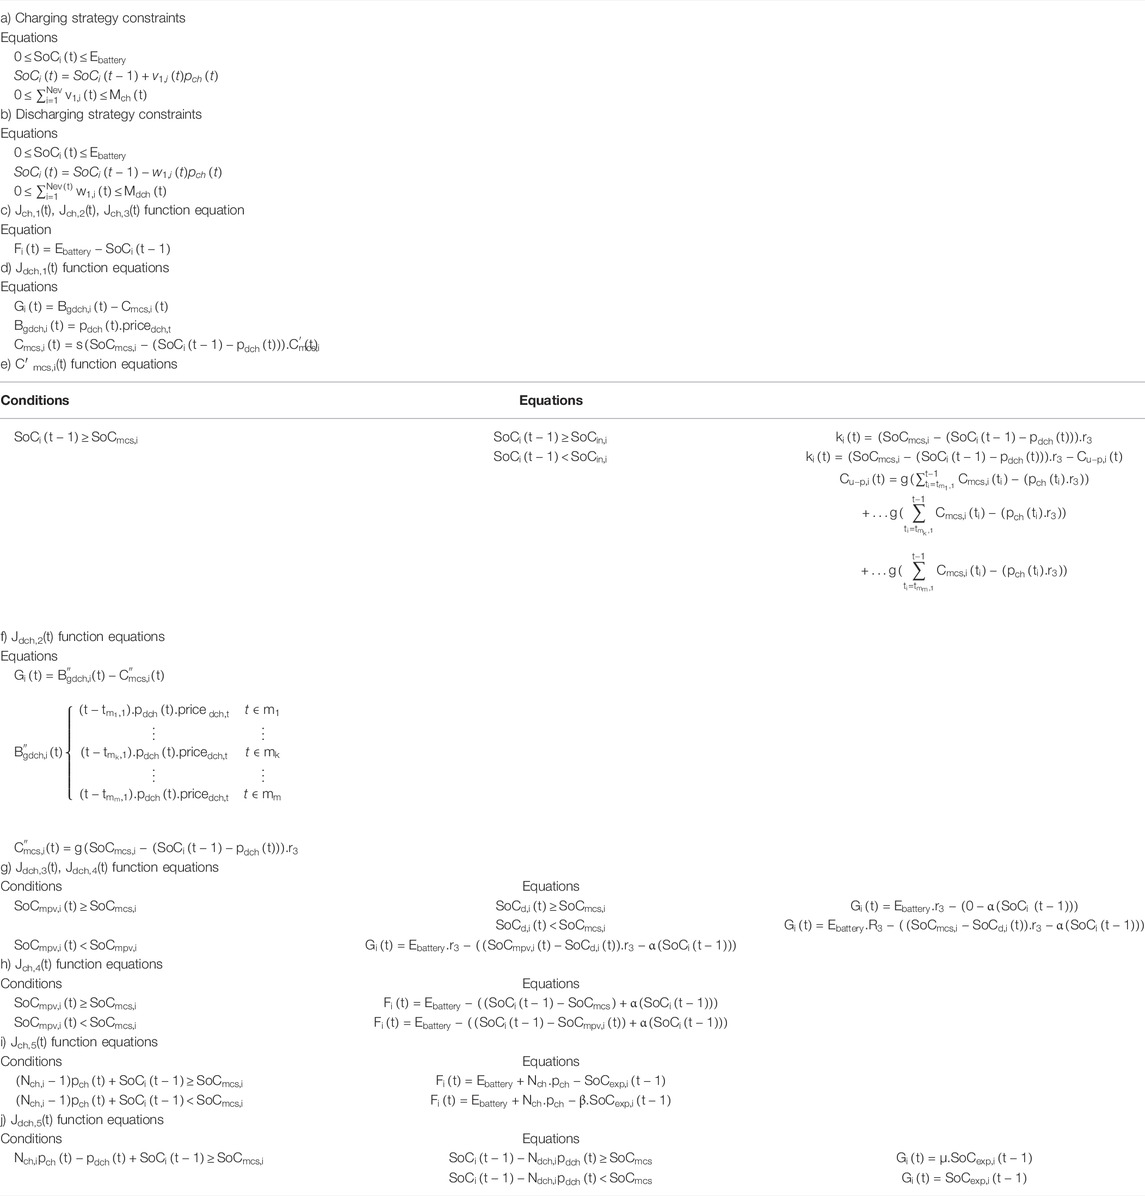
TABLE 1. Summarization of equations of the functions.
3.7 Comparison of Strategies
Table 2 investigates the pros and cons of the proposed strategies.
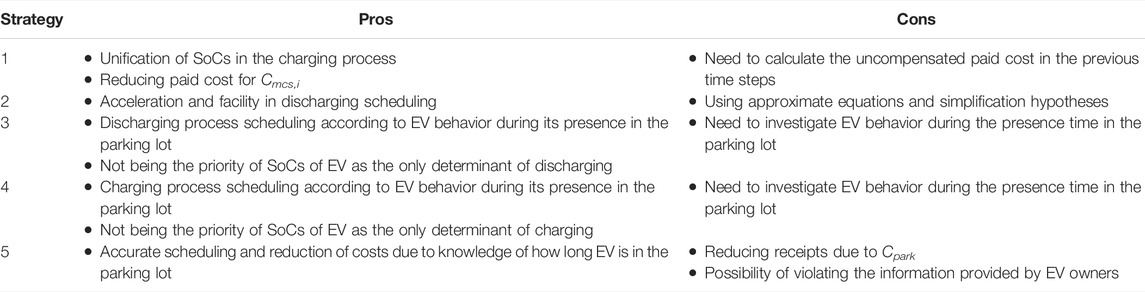
TABLE 2. Pros and cons of the proposed strategies.
4 Simulations Results
In this study, according to the type of interaction between EV and parking owners, there are different strategies for scheduling the charging and discharging process. In each of the strategies, the charging and discharging priority of EVs is determined by optimizing the Jch,q(t) and Jdch,q(t) functions. Each strategy leads to a certain amount of profit and load behavior. Therefore, the load probabilistic distribution and parking power generation in different strategies will be different. These probabilistic distribution diagrams are used to evaluate the reliability of the distribution system.
Due to the probabilistic nature of EV behavior, the parking profit and load behavior of each strategy are random in nature. The Monte Carlo method is used to obtain the profit and load behavior of each strategy.
4.1 Parking Lot Profit Function Calculation
Figure 1 shows the flowchart for calculating the parking profit and the reliability of the distribution system. In this study, the number of strategies is equal to 5. Moreover, the number of iterations for each strategy is equal to 100 (iterations = 100).

FIGURE 1. Flowchart of calculating the parking profit of the smart distribution system.
In this study, energy price values for a time step of 48 h were obtained from Igualada et al. (2014) and according to Table 3. The parking situation at different time steps is also shown in Table 3.
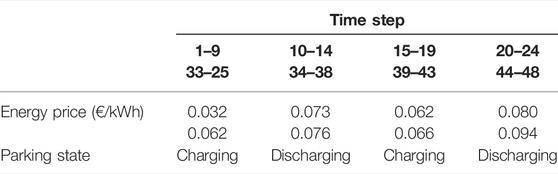
TABLE 3. Energy price and parking state.
The results of the scheduled charging and discharging strategy can lead to logical analysis when the driving patterns of the EVs are properly modeled. Accordingly, numerical results and equations in Dallinger et al. (2011) are used to model the driving patterns of EVs.
In this study, a parking lot with a capacity of 100 EVs has been used to investigate the proposed strategies. The characteristics of EVs and under-study parking lots are shown in Table 4. In order to increase the participation of EVs in sending power to the grid and thus improve the reliability of the distribution system, energy purchase and sale tariffs from the EV owner and SoCmcs not supplied tariffs are set out in Table 4.
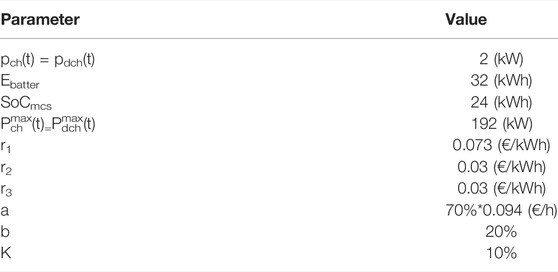
TABLE 4. EV and parking lot economic specifications.
In the following, the average values of cost functions are evaluated in Table 5.
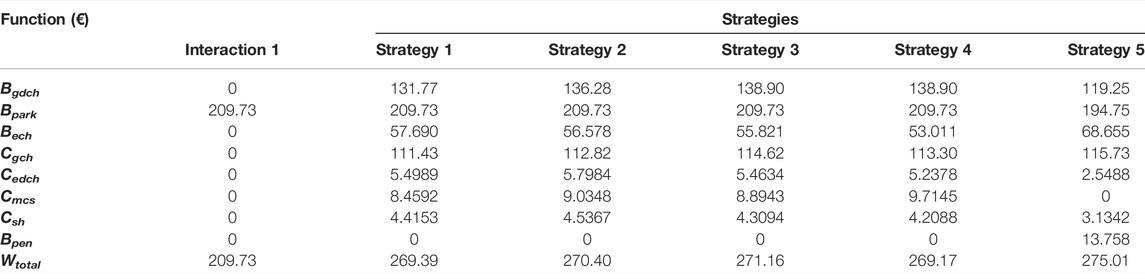
TABLE 5. Parking profit functions.
Table 5 shows that the received profit by the parking lot in interaction 1 has the lowest value compared to the others due to the lack of charging and discharging of the EVs in the parking lot. In strategy 3, due to the increase in the amount of energy purchased from the grid, the parking lot could make more profit than strategy 4 by selling energy to EV owners. In strategy 5, the parking lot can make more detailed schedules according to the duration of the presence of EVs in the parking lot. This has reduced the cost of parking to zero for Cmcs. If the parking strategy does not require a reduction in parking costs, the parking profit will increase much more than the Wtotal amount. In strategy 5, the parking lot can schedule more precisely according to the time length of the EVs’ presence in the parking lot. This has reduced the cost of parking to zero for Cmcs.
Table 5 shows that the parking lot could increase profitability in all strategies compared to interaction 1. The maximum profit increment in interaction 2 is 29% and in interaction 3 is 31%. Enough information about the duration of EVs in the parking lot has improved scheduling and increased profits in interaction.
In order to increase accuracy and study the effect of the duration of each time step on the profit of parking, the duration of each time step has been reduced from 1 h to 15 min. The first strategy was re-evaluated over a 48 h time interval and over 192 time steps of 15 min. The study is also re-evaluated in 100 iterations. Figure 2A shows the values of the parking profit functions in the first strategy when the duration of each time step is 15 min (number of time steps equal to 192 time steps) and when the duration of each time step is 1 h (number of time steps equal to 48 time steps).
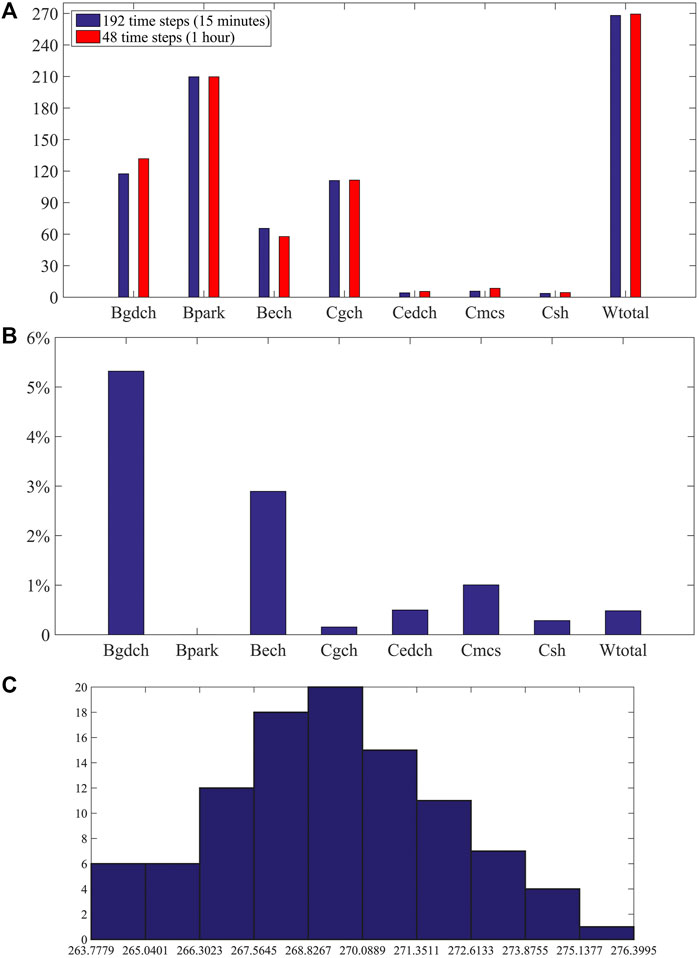
FIGURE 2. (A) The values of the parking profit functions in strategy 1. (B) The percentage of changes in parking functions relative to Wtotal. (C) Diagram of the frequency distribution of parking lot profit (€) in strategy 1.
Figure 2B shows the percentage of changes in parking functions relative to Wtotal (269.39). Figures 2A,B show that the amount of changes in parking functions is negligible. Most of the changes are related to the Bgdch, which is reduced by 5.32%. On the contrary, a decrease in the amount of energy sold to the grid has led to an increase in the amount of energy sold to homeowners, and Bech increased by 2.89%. Wtotal is almost identical in both states. Therefore, the parking profit is independent of the duration of each time step. For this reason, other strategies were not re-evaluated.
In this study, the Monte Carlo method has been used to obtain the profit and load behavior of each strategy. Because of the use of Monte Carlo, sensitivity analysis is also implicitly performed. Because this manuscript is simulated by the Monte Carlo method and uses uncertain and probabilistic data, sensitivity analysis is not required. Each strategy has been evaluated in 100 iterations. Figure 2C shows the diagram of the frequency distribution of parking lot profit per 100 iterations in strategy 1.
4.2 Distribution System Reliability Calculation
Figure 3 shows the flowchart for calculating the reliability of the distribution system.
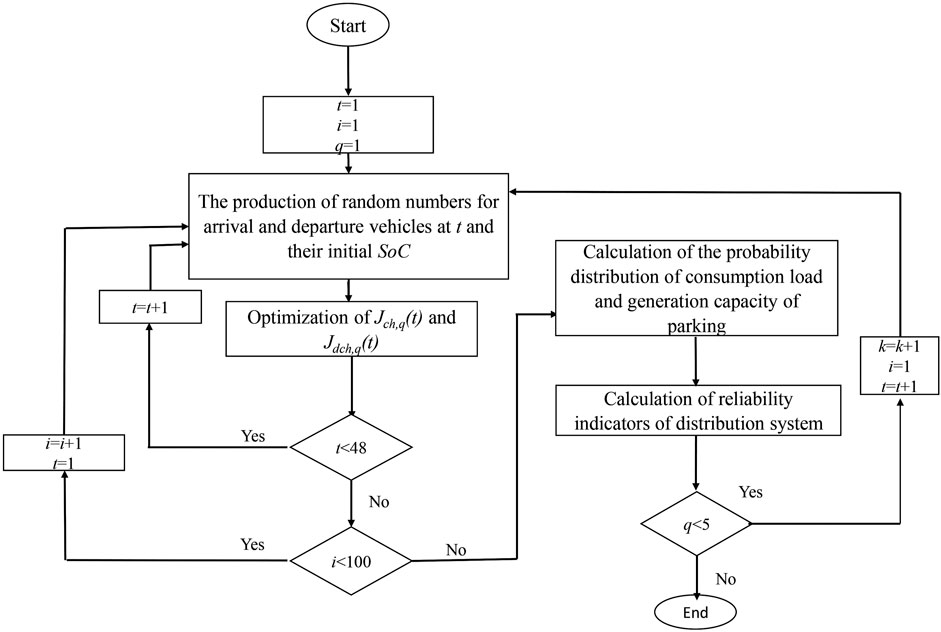
FIGURE 3. Flowchart of calculating the reliability of the distribution system.
In this paper, the studied smart radial distribution system is shown in Figure 4 Billinton and Li (2014), and the reliability is evaluated under different strategies and it is assumed that the parking lot is located in busbar C.
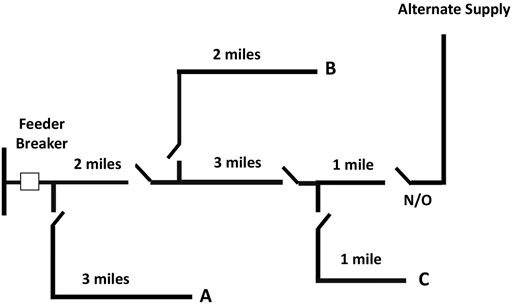
FIGURE 4. The studied radial distribution system (Billinton and Li, 2014).
The load duration curve (LDC) introduced by Barrows et al. (2020) is also used to determine the peak load per hour. The peak of power consumption of the studied smart distribution system per hour is also shown in Table 6.
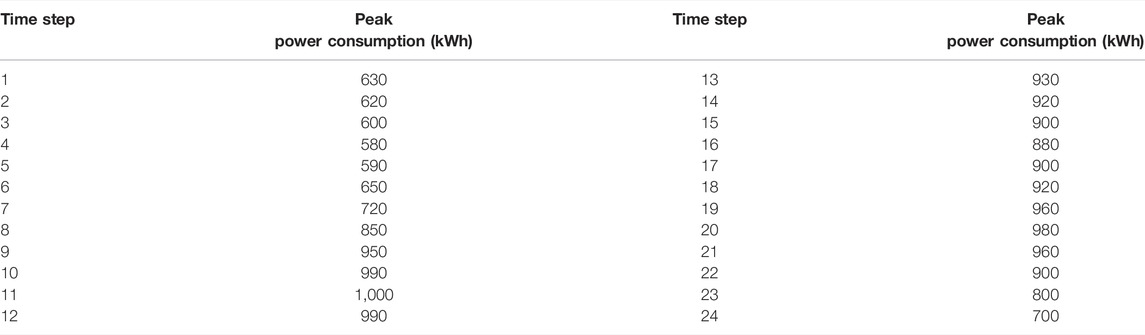
TABLE 6. Peak of power consumption of the studied distribution system per hour.
Considering the change in the amount of load consumed and the power produced by the parking lot during each hour, reliability indices should be calculated per hour.
Charging and discharging process scheduling is different in different strategies. As a result, first, in order to investigate the reliability indices in each of the strategies, it should be noted that the load probabilistic distribution of parking in charging time steps and the power generation probabilistic distribution of parking in discharging time steps will be different in each strategy. Figure 5A shows the probability distribution of parking consumption load in the period 17:00 to 17:59 in strategy 1. Figure 5B shows the probability distribution of parking generation power in the period 19:00 to 19:59 in strategy 1.
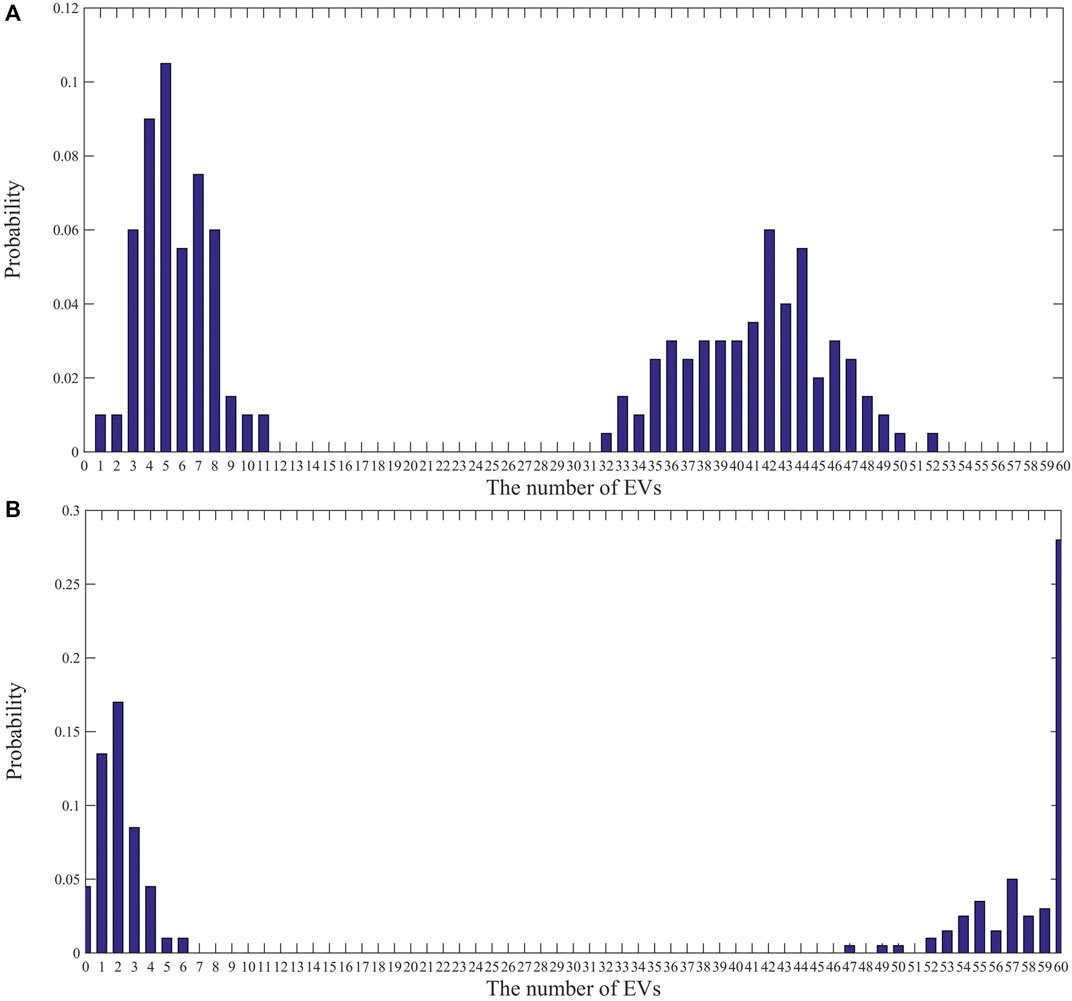
FIGURE 5. (A) Probability distribution of parking lot consumption load (in 17 to 17:59) in strategy 1. (B) Probability distribution of parking generation power (in 19 to 19:59) in strategy 1.
Calculation reliability indicators—ENS (energy not supplied), ASAI (average system availability index), SAIFI (system average interruption frequency index), and SAIDI (system average interruption duration index) — are very necessary in order to investigate the impact of each strategy on the reliability of the system, in cases where parking is not equipped with V2G technology and in addition, the process of charging the EVs in the parking lot is performed in a random and unplanned way.
4.1.1 Charging Mode
If the parking lot is in charging mode, the reliability indices are calculated as follows:
Nev,ch(t) is the number of EVs charged by the parking in time step t. P(t) is the parking power consumption and Po(t) is the probability of occurrence of any of the conditions. According to Guner and Ozdemir (2020), T′ is equivalent to 8,760 h.
4.2.2 Discharging Mode
When the parking lot acts as a generator, if the generating power exceeds the load on the C busbar, this excess can be transferred to the B busbar via the CB line. In this case, the reliability indices are calculated as follows:
pC(t) is the average power consumption of each C busbar customer and pB(t) is the average power consumption of each B busbar customer. Mfed,C(t) and Mfed,B(t) also represent the number of busbar C and B customers, respectively, fed by the parking lot:
In the following, the average values of reliability indices are evaluated.
Figure 6A shows that the availability of V2G capabilities during high-load hours will reduce the amount of energy not supplied in the system. Figure 6B shows the average ASAI values in charging conditions without scheduling and scheduled charging and discharging.
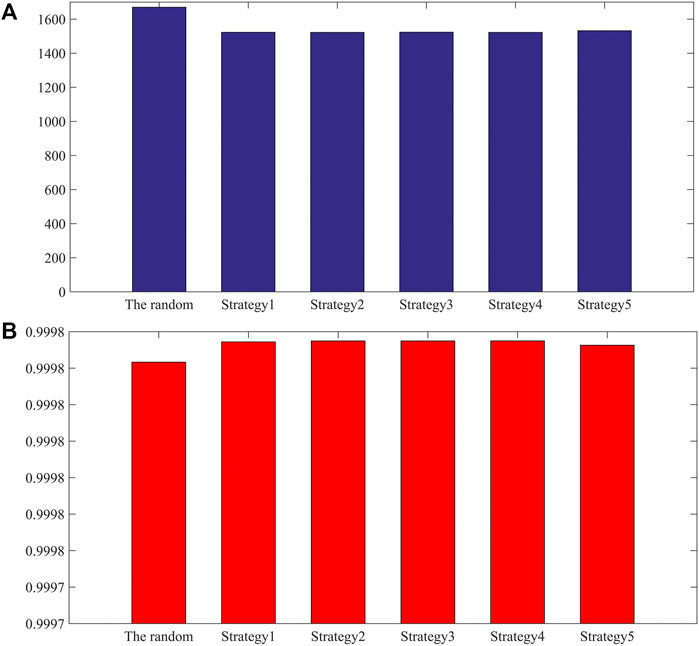
FIGURE 6. (A) The mean values of ENS. (B) The average ASAI values.
As observed in Figure 6, having a V2G capability and scheduling the charge-discharge process will increase the probability of system availability in all scenarios relative to random and unscheduled mode because with the generation power of the parking lot, some customers are fed on the C and B buses every hour, and as a result, they will not be interrupted by the system interruption.
Figure 7 compares the amount of received energy from the grid, the amount of energy sent to the grid, and the amount of SOC increment and Figures 8A–C illustrate the average values of reliability indicators in different strategies.
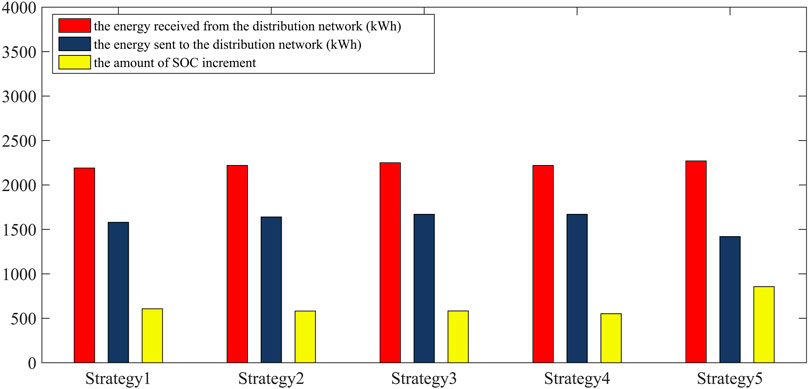
FIGURE 7. Comparison of the amount of received energy from the grid, the amount of energy sent to the grid, and the amount of SOC increment in each of the strategies.
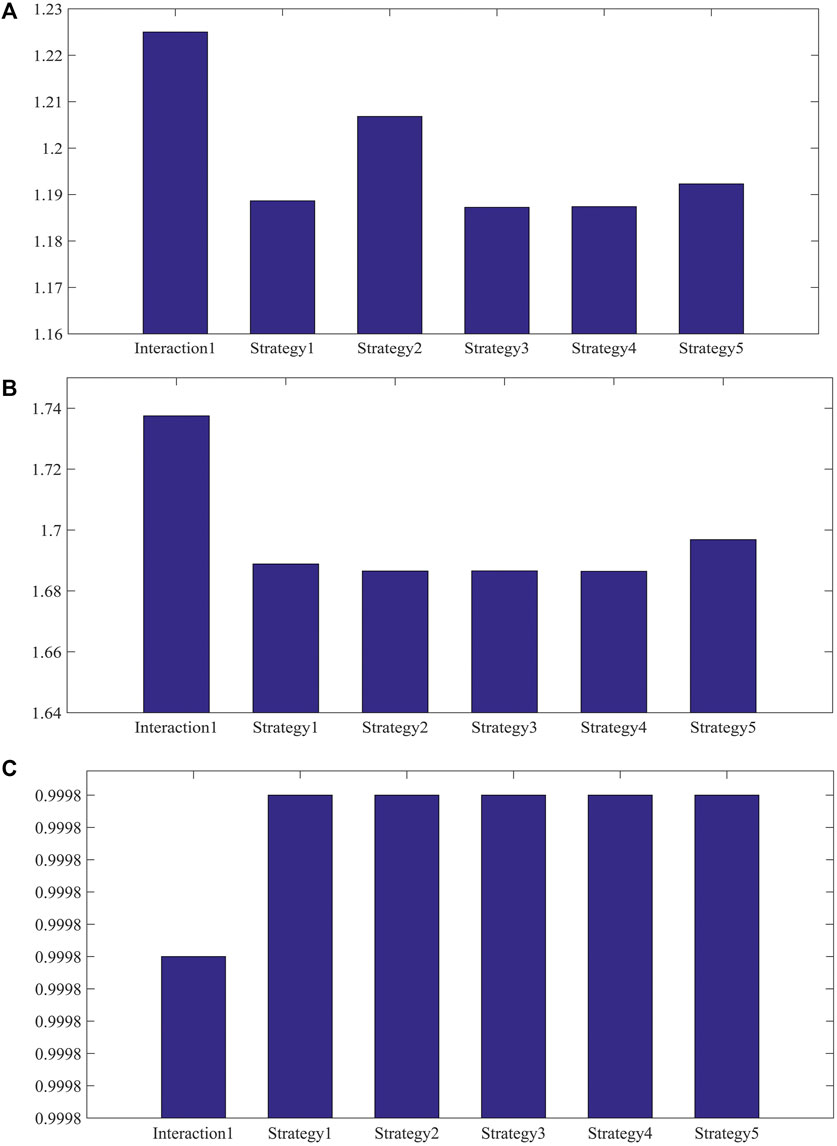
FIGURE 8. (A) Values of SAIFI index. (B) Values of SAIDI index. (C) Values of ASAI index.
Table 7 shows the average values of reliability indicators in each of the strategies.
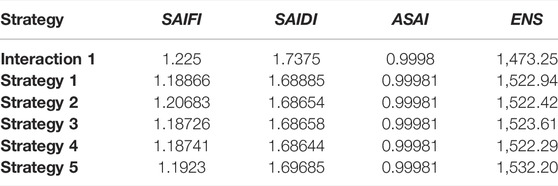
TABLE 7. The reliability indicators.
According to Figures 8A–C and Table 7, it should be noted that when the parking lot is in power generation condition, as the amount of energy sent to the grid increases, the number of not supplied customers decreases and the SAIFI index improves. Accordingly, strategy 3 has improved the SAIFI index more than other strategies. If the parking lot can compensate more for its consumption load, the SAIDI and ASAI indices will improve. Accordingly, in strategy 5, because the amount of energy allocated to increasing the SoC is more than in other strategies, the rate of improvement of SAIDI and ASAI in this strategy is less than that of other strategies. The ENS index increases with increasing energy consumption and non-compensation. Therefore, because in strategy 5, the total energy received from the grid and the energy allocated to increasing the SoC (energy not supplied to the grid) is more than in other strategies, ENS has been significantly increased compared to other strategies.
With the comprehensive investigation of all strategies, it is determined that, in the situation that the parking lot is allowed to charge and discharge the EVs present in the parking lot because the number of interrupted customers decreases during the discharge time steps, SAIFI, SAIDI, and ASAI indices compared to interaction 1 are also improved. The presence of a new customer increases the ENS index compared to interaction 1. In contrast, in strategy 5, increasing energy purchases from the grid and reducing the amount of exchange with the grid causes ENS to increase compared to other strategies.
5 Conclusion
Increasing the parking profit is a very important step in satisfying the parking lot to participate in the V2G process and improve the reliability of the distribution system. Due to the important point that energy pricing per hour is directly related to the amount of power consumption, scheduling the charging and discharging process based on energy prices also improves the reliability of the system. Accordingly, in this chapter, according to the receipt and payment of parking and its profit function, strategies are introduced to schedule the charging and discharging process. In the second step, according to the energy price, the allowable time steps for charging (time steps when the energy price is lower) and the allowable time steps for discharging are selected.
In designing the strategies, two serious limitations were considered in the scheduling of the charging and discharging process of EVs:
• Stochastic and unpredictable nature of EV entry and exit times and their energy level when entering the parking lot.
• Limitation on the amount of power sent from the distribution system to the parking lot and vice versa.
The proposed strategies try to increase the parking profit by increasing the parking receipts and reducing the amount of paid costs. The results of each of the strategies show that having V2G technology and scheduling the charging and discharging process of EVs in the parking lot improves the reliability indices of the distribution system. By evaluating the economic benefits of each strategy, it is considered that if there is appropriate information about the duration of EV in the parking lot, the received profit by the parking lot will increase due to more precise scheduling and no payment for Cmcs. However, in a situation where the parking lot does not have information about the exit time of the EVs, strategy 3 increases the profit of the parking lot to an acceptable level by unifying the conditions of all EVs in the charging process and paying attention to their behavior in the past time steps.
Data Availability Statement
The data analyzed in this study is subject to the following licenses/restrictions: in this article, we have used the network information provided in the references. Requests to access these datasets should be directed to. In this article, we have used the network information provided in the references.
Author Contributions
Conceptualization: FJ and KM; methodology: FJ and HH; software: FJ; validation: AA and KM; formal analysis: AA and HH; investigation: FJ, AA, and KM; resources: FJ and AA; data curation: AA; writing—original draft preparation: FJ and AA; writing—review and editing: AA and KM; visualization: FJ and HH; supervision: KM and HH; project administration: KM. All authors have read and agreed to the published version of the manuscript.
Funding
This is academic research within the University of Zanjan. The research was supported by the University of Zanjan as the primary affiliation of all authors.
Conflict of Interest
The authors declare that the research was conducted in the absence of any commercial or financial relationships that could be construed as a potential conflict of interest.
Publisher’s Note
All claims expressed in this article are solely those of the authors and do not necessarily represent those of their affiliated organizations or those of the publisher, the editors, and the reviewers. Any product that may be evaluated in this article, or claim that may be made by its manufacturer, is not guaranteed or endorsed by the publisher.
References
Abdali, A., Mazlumi, K., and Guerrero, J. M. (2020). Integrated Control and Protection Architecture for Islanded PV-Battery DC Microgrids: Design, Analysis and Experimental Verification. Appl. Sci. 10 (24), 8847. doi:10.3390/app10248847
Abdali, A., Mazlumi, K., and Noroozian, R. (2017). A Precise Fault Location Scheme for Low-Voltage Dc Microgrids Systems Using Multi-Layer Perceptron Neural Network. Sigma J. Eng. Nat. Sci. 36 (3), 821–834.
Akhavan-Rezai, E., Shaaban, M. F., El-Saadany, E. F., and Karray, F. (2018). New EMS to Incorporate Smart Parking Lots into Demand Response. IEEE Trans. Smart Grid 9 (2), 1376–1386. doi:10.1109/tsg.2016.2587901
Alahyari, A., Fotuhi-Firuzabad, M., and Rastegar, M. (2014). Incorporating Customer Reliability Cost in PEV Charge Scheduling Schemes Considering Vehicle to Home Capability. IEEE Trans. Veh. Technol. 64, 2783–2791. doi:10.1109/tvt.2014.2352413
Barrows, C., Preston, E., Staid, A., Stephen, G., Watson, J.-P., Bloom, A., et al. (2020). The IEEE Reliability Test System: A Proposed 2019 Update. IEEE Trans. Power Syst. 35 (1), 119–127. doi:10.1109/tpwrs.2019.2925557
R. Billinton, and W. Li (Editors) (2014). Reliability Assessment of Electric Power Systems Using Monte Carlo Methods (New York, NY: Springer).
Dallinger, D., Krampe, D., and Wietschel, M. (2011). Vehicle-to-grid Regulation Reserves Based on a Dynamic Simulation of Mobility Behavior. IEEE Trans. Smart Grid 2 (2), 302–313. doi:10.1109/tsg.2011.2131692
Faia, R., Soares, J., Fotouhi Ghazvini, M. A., Franco, J. F., and Vale, Z. (2021). Local Electricity Markets for Electric Vehicles: An Application Study Using a Decentralized Iterative Approach. Front. Energy Res. 9, 705066. doi:10.3389/fenrg.2021.705066
Fang, B., Li, B., Li, X., Jia, Y., Xu, W., and Liao, Y. (2021). Multi-objective Comprehensive Charging/discharging Scheduling Strategy for Electric Vehicles Based on the Improved Particle Swarm Optimization Algorithm. Front. Energy Res. 9, 811964. doi:10.3389/fenrg.2021.811964
Gou, J., Lin, C., Li, J., Geng, B., Li, Z., Cao, Y., et al. (2021). Charging Strategy for Electric Vehicles Considering Consumer Psychology and Trip Chain. Front. Energy Res. 9, 723370. doi:10.3389/fenrg.2021.723370
Guner, S., and Ozdemir, A. (2020). Reliability Improvement of Distribution System Considering EV Parking Lots. Electr. Power Syst. Res. 185, 106353. doi:10.1016/j.epsr.2020.106353
Hadian, E., Akbari, H., Farzinfar, M., and Saeed, S. (2020). Optimal Allocation of Electric Vehicle Charging Stations with Adopted Smart Charging/discharging Schedule. IEEE Access 8, 196908–196919. doi:10.1109/access.2020.3033662
Hua, L., Wang, J., and Zhou, C. (2014). Adaptive Electric Vehicle Charging Coordination on Distribution Network. IEEE Trans. Smart Grid 5 (6), 2666–2675. doi:10.1109/tsg.2014.2336623
Igualada, L., Corchero, C., Cruz-Zambrano, M., and Heredia, F.-J. (2014). Optimal Energy Management for a Residential Microgrid Including a Vehicle-To-Grid System. IEEE Trans. Smart Grid 5 (4), 2163–2172. doi:10.1109/tsg.2014.2318836
Jozi, F., Mazlumi, K., and Hosseini, H. (2022). Evaluation of the Reliability of the Deregulated Radially Distribution Network with Consideration of Vehicle to Grid. Sci. Iran. 2022, 5304. doi:10.24200/SCI.2022.57567.5304
Khan, R., Mehmood, K. K., Bukhari, S. B. A., Imran, K., Wadood, A., Rhee, S. B., et al. (2021). An Optimization-Based Reliability Enhancement Scheme for Active Distribution Systems Utilizing Electric Vehicles. IEEE Access 9, 157247–157258. doi:10.1109/access.2021.3127802
Meenual, T., and Usapein, P. (2021). Microgrid Policies: A Review of Technologies and Key Drivers of Thailand. Front. Energy Res. 9, 591537. doi:10.3389/fenrg.2021.591537
Nizami, M. S. H., Hossain, M. J., and Mahmud, K. (2021). A Coordinated Electric Vehicle Management System for Grid-Support Services in Residential Networks. IEEE Syst. J. 15 (2), 2066–2077. doi:10.1109/jsyst.2020.3006848
Pinto, J., Carvalho, A., and Morais, V. (2021). Power Sharing in Island Microgrids. Front. Energy Res. 8, 609218. doi:10.3389/fenrg.2020.609218
Sabillon Antunez, C., Franco, J. F., Rider, M. J., and Romero, R. (2016). A New Methodology for the Optimal Charging Coordination of Electric Vehicles Considering Vehicle-To-Grid Technology. IEEE Trans. Sustain. Energy 7 (2), 596–607. doi:10.1109/tste.2015.2505502
Sattarpour, T., and Farsadi, M. (2017). Parking Lot Allocation with Maximum Economic Benefit in a Distribution Network. Int. Trans. Electr. energy Syst. 27 (1), e2234. doi:10.1002/etep.2234
Shafiq, S., Irshad, U. B., Al-Muhaini, M., Djokic, S. Z., and Akram, U. (2020). Reliability Evaluation of Composite Power Systems: Evaluating the Impact of Full and Plug-In Hybrid Electric Vehicles. IEEE Access 8, 114305–114314. doi:10.1109/access.2020.3003369
Sufyan, M., Rahim, N. A., Muhammad, M. A., Tan, C. K., Raihan, S. R. S., and Bakar, A. H. A. (2020). Charge Coordination and Battery Lifecycle Analysis of Electric Vehicles with V2G Implementation. Electr. Power Syst. Res. 184, 106307. doi:10.1016/j.epsr.2020.106307
Wang, S., Bi, S., Zhang, Y.-J. A., and Huang, J. (2018). Electrical Vehicle Charging Station Profit Maximization: Admission, Pricing, and Online Scheduling. IEEE Trans. Sustain. Energy 9 (4), 1722–1731. doi:10.1109/tste.2018.2810274
Xu, N. Z., and Chung, C. Y. (2016). Reliability Evaluation of Distribution Systems Including Vehicle-To-Home and Vehicle-To-Grid. IEEE Trans. Power Syst. 31 (1), 759–768. doi:10.1109/tpwrs.2015.2396524
Xu, N. Z., and Chung, C. Y. (2014). Well-being Analysis of Generating Systems Considering Electric Vehicle Charging. IEEE Trans. Power Syst. 29 (5), 2311–2320. doi:10.1109/tpwrs.2014.2307865
Nomenclature
Abbreviations
a Fixed tariff for EV parking in the parking lot
b Variable tariff for EV parking in the parking lot
ASAI Average System Availability Index
Bech The total received cost by a parking lot from EV owners for the increase in vehicle battery when leaving the parking lot
Bech,i The cost that EVi pays for parking its SoC increment
Bgdch Total parking profit received from the grid for the sale of energy to the grid
Bgdch,i The receipt of the parking lot for the sale of energy to the grid from the battery discharging of the EVi
Bgdch,i(t) The parking receipt from the grid for sending power via EVi in time step t
B′′gdch,i(t) Total received profit by the parking lot from the grid for the exchange of power through EVi, up to time step t.
Bpark The total parking fee from the owners of the EV for parking the EV in the parking lot
Bpark,i The cost that EVi pays for parking EV
Bpen The total received cost by the parking lot for EV violation
Bpen,i The receipt of parking received for EVi violation
Btotal Total parking revenue
Cedch The total parking cost paid to EV owners for decreasing EV battery charge while departing the parking lot
Cedch,i The cost that the parking lot pays to the owner for reducing the SoCi
Cgch The total parking cost paid to the grid for purchasing energy from the grid
Cgch,i The parking cost for purchasing energy from the grid from EVi battery charging
Cmcs Total parking fee to EV owners for failing to provide SoCmcs,i
Cmcs,i The cost that the parking lot pays to the owner of EVi for not providing SoCmcs,i
Cmcs,i(t) The parking cost paid to the EVi owner for not providing SoCmcs,i at time step t
C′′mcs,i(t) Total cost of parking for not providing SoCmcs,i up to time step t
Cu-p,i(t) The uncompensated payment up to the time step t
Cpc,i(t) The paid contribution of parking to EVi
Csh The total parking fee paid to the owners of EV for the share of the EV owner in the profit of the V2G
Csh,i The cost that the parking lot pays to the owner for the benefit of EVi
Ctotal Total parking costs
d0 Maximum parking time of EVs in the parking lot without the need to pay a variable fee
dap,i Allotted time for EVi to be present in the parking lot
dpark,i Duration of the presence of EVi in the parking lot
ENS Energy not supplied
Ensc,i(t) The parking contributions in energy not supplied by EVi
Ebattery Battery capacity
Fq,i(t) The main function to prioritize the EVi charge in Jch,q(t)
F′1,q,i(t), F′2,q,i(t) Conditional functions to prioritize the EVi charge in Jch,q(t)
g(x), s(x), and y(x) Control filters
Gq,i(t) The main function to prioritize the EVi discharge in Jdch,q(t)
G′′1,q,i(t), G′′2,q,i(t), G′′′′1,q,i(t), G′′′′2,q,i(t) Conditional functions to prioritize the EVi discharge in Jdch,q(t)
Jch,q(t) The function to schedule the EVs charging process in strategy number q at time step t
Jdch,q(t) The function to schedule the EVs discharging process in strategy number q at time step t
K The coefficient to determine the contribution of EVs to the profit earned
m The number of discrete time steps for the discharging process
M.I The median index for energy prices in a day
Mch(t) The maximum number of EVs that the parking lot can charge in time step t
Mdch(t) The maximum number of EVs that the parking lot can discharge in time step t
Mfedz(t) The number of busbar z customers, fed by the parking lot
n The number of discrete time steps for the charging process
Nch The number of allowable time steps for charging during the study period
Nch,i The number of authorized charging steps during the time the EVi will be in the parking lot
Ndch The number of allowable time steps for discharging during the study period
Ndch,i The number of authorized discharging steps during the time the EVi will be in the parking lot
Nev The number of EVs
Nev,ch(t) The number of EVs that are charged by the parking in time step t
Ntotal Total number of distribution system customers
Nts The number of study time steps
Nz The number of customers at busbar z
P (t) The parking power at time step t
pch(t) The actual power that the parking lot receives from the grid for charging EVi at time t
Pchmax(t) The maximum power that the parking lot can receive from the grid at time step t
pdch(t) The actual power that the parking lot sends to the grid from the battery discharging point of the EVi at time t
Pdchmax(t) The maximum power that the parking lot can send to the grid at time step t
Po(t) The probability of occurrence of any of the conditions.
pricech,t The purchase price of energy from the grid at time t
pricedch,t The selling price of energy to the grid at time t
pz The average power consumption of each z busbar customer
Pz The average power consumption at the busbar z
r Fixed tariff for EV parking in the parking lot in the interaction 3
R Study period
r1 The energy sales tariff to the EV owner
r2 The energy purchase tariff from the EV owner
Rch Allowable time steps for charging
Rdch Allowable time steps for discharging
Ri The time steps when the EVi is present in the parking lot
SAIDI System Average Interruption Duration Index
SAIFI System Average Interruption Frequency Index
SoC State of charge
SoCexp,i Expected SoC for EVi considering its duration in the parking lot
SoCi SoC of EVi
SoCin,i Initial SoCi at the entrance to the parking lot
SoCmcs,i Minimum capacity specified for SoCi
SoCmpv,i(t) The maximum possible value for SoCi in the time step t
SoCout,i SoC when EVi goes out of the parking
t Time step
T Duration of study time
tmk,1 Beginning of the mk time step
tmk,y End of the mk time step
tnj,1 Beginning of the nj time step
tnj,x End of the nj time step
Uz Annual availability or duration of interruption at busbar z
vq,i(t) The binary variable indicates the presence or absence of EVi in the charging process No. q at time t
wq,i(t) The binary variable indicates the presence or absence of EVi in the discharging process No. q at time t
Wtotal Total parking profit
λz Failure rate at busbar z
ap Allotted time to be in the parking lot
ch Charge
dch Discharge
ech Energy exchange between the parking and the EV through charging
edch Energy exchange between the parking and the EV through discharging
battery Battery
ev Electric vehicle
exp Expected
fed Fed
gch Energy exchange between the grid and the EV through charging
gdch Energy exchange between the grid and the EV through discharging
i EV number
j Allowable charging discrete time step number
k Allowable discharging discrete time step number
mcs Minimum capacity specified
mk kth allowable discharging discrete time step
mpv Maximum possible value
nj jth allowable charging discrete time step
nsc Not supplied contribution
o Occurrence
park Park
pc Paid contribution
pen Penalty
q Strategy number
sh Share
total Total
ts Time step
u-p Uncompensated payment
x Allowable charging continuous-time step number
y Allowable discharging continuous-time step number
z Busbar name.
Keywords: electric vehicles, vehicle-to-grid technology, electricity market, charging and discharging process scheduling, reliability, smart distribution grid
Citation: Jozi F, Abdali A, Mazlumi K and Hosseini SH (2022) Reliability Improvement of the Smart Distribution Grid Incorporating EVs and BESS via Optimal Charging and Discharging Process Scheduling. Front. Energy Res. 10:920343. doi: 10.3389/fenrg.2022.920343
Received: 14 April 2022; Accepted: 02 May 2022;
Published: 16 June 2022.
Edited by:
Hamed Hashemi-Dezaki, University of West Bohemia, CzechiaReviewed by:
H. Torkaman, Shahid Beheshti University, IranSeyed Amir Hosseini, Isfahan University of Technology, Iran
Copyright © 2022 Jozi, Abdali, Mazlumi and Hosseini. This is an open-access article distributed under the terms of the Creative Commons Attribution License (CC BY). The use, distribution or reproduction in other forums is permitted, provided the original author(s) and the copyright owner(s) are credited and that the original publication in this journal is cited, in accordance with accepted academic practice. No use, distribution or reproduction is permitted which does not comply with these terms.
*Correspondence: Kazem Mazlumi, a21hemx1bWlAem51LmFjLmly