 Peiyue Li
  Zhijie Wang
  Jiahui Jin
  Guibing Li
- 1School of Electrical Engineering, Shanghai Dianji University, Shanghai, China
- 2State Grid Shanxi Electric Power Company, Xinzhou, China
With the increase in renewable energy penetration, energy deviation settlement penalties are imposed on incremental distribution and retail companies (IDRCs). Most IDRCs are at financial risk. Given this background, a bidding model of the two-stage dynamic alliance is proposed to maximize IDRCs’ profits. In the first stage, potential alliances of IDRCs are established by the gravity model. In the second stage, the bi-level bidding model is modeled in energy and primary frequency regulation markets, where the upper level maximizes alliance profits by considering the cooperation costs and alliance constraints, and the lower level simulates market clearing. Then, the bi-level model is transformed into a mixed-integer linear programming model by the strong duality theory, Karush–Kuhn–Tucker conditions, and large M method. Verified by the complex network theory, results show that a complex alliance network has a high transmission efficiency and capacity to resist risk. Moreover, IDRCs with large capacity and superior location are important in the alliance. In addition, the proposed model increases the satisfaction rate by 20%, which increases IDRCs’ profits and reduces cooperation costs.
1 Introduction
With the reform of the electricity market in China (Fu et al., 2022), IDRC has become a strategic player in the wholesale electricity market, operating the distribution network and distributed energy resources (DERs). Under the background of carbon neutrality and carbon peak (Li et al., 2022), the penetration of renewable energy in the distribution network gradually increases. Due to the uncertainty of renewable energy output and load, the deviation between contract and actual volume is inevitable for IDRC (Moghimi and Barforoushi, 2020). Before establishing the spot market in China, an energy deviation settlement (EDS) mechanism is proposed to balance the deviation (Lu et al., 2021). Nearly 80% of IDRCs suffer losses monthly (Hwang et al., 2020). Therefore, optimization decision has great significance for IDRCs.
The operation problem of the IDRC as a strategic player has been studied in several works. In an active distribution network (ADN), a risk-based competitive bi-level framework is proposed by Hamedi et al. (2021). As the leader of the game, IDRCs offer an optimal price for winning the competition. Moghimi and Barforoushi (2020) stated that IDRC owns conventional and energy storage systems. Under real-time pricing, the profits from selling energy are maximized. Zhongkai et al. (2020) proposed a bi-level programming approach for an ADN with multiple virtual power plants (VPPs). As a pricemaker, IDRCs participate in the energy and reserve markets, as stated by Bahramara et al. (2018). The strategic behavior of the IDRC is modeled as a bi-level optimization problem.
In the above studies, the IDRC is operated independently. The cooperative strategy has been studied in several works to reduce the deviation penalty. The cooperation of IDRCs has many aspects, such as DERs cooperation, retail business cooperation, and VPP cooperation. Lu et al. (2020) proposed the cooperative strategy of internal DERs and external electric vehicle aggregators (EVAs) to deal with uncertainty, where average deviation penalties are reduced. A cooperative strategy for the wind-storage system is proposed by Xie et al. (2021). Storage arbitrages by absorbing low-cost energy and selling at a higher price. To realize the carbon neutralization of an integrated energy system composed of hydrogen and natural gas storage, Yang and Wang (2021)proposed a cooperative game model.
Due to the physical characteristics of the distribution network, power deals among adjacent IDRCs are not transferred by the transmission network (Huang et al., 2021), which reduces the deviation penalty of the measurement gateway. Therefore, the location of IDRC is considered in the cooperation strategies of IDRCs, which firstly motivates this work.
On the premise that all members participate in the alliance (Lasemi and Arabkoohsar, 2020; Fan et al., 2022), the following studies focus on maximizing alliance profits and profit distribution. A two-stage energy management system is proposed by Lasemi and Arabkoohsar (2020), including wind turbine, photovoltaic, and energy storage. Based on symbiosis theory, a spot quotation alliance model of cascade hydropower stations is proposed by Zhu et al. (2021). In a bi-level cooperative game model, the planned output of renewable energy and the capacity allocation are optimized by Fang et al. (2020). Fan et al. (2022) proposed a bi-level optimization model of wind and thermal power plants in electricity markets. The results show that joint participation is more profitable than an independent one.
However, the cooperation cost is not considered in the above research. Although EDS costs of IDRCs are minimized when all IDRCs join the same alliance, IDRCs in an alliance inevitably compete for their own profits (Zhang et al., 2019). Due to dissatisfaction with the distribution of profits, IDRC may violate the alliance agreement, resulting in cooperation costs and limiting the scale of the alliance. Tang et al. (2021) proposed an alliance strategy for IDRCs considering regional advantages and cooperation costs. The results show that the geographical advantage of IDRC directly affects the revenues, and the cost of cooperation affects the size of the alliance. Therefore, cooperation costs need to be considered. If the satisfaction rate of the alliance players is improved, disputes and cooperation costs are reduced. When distribution profits are more than expected, IDRC is allowed to align and alliances vary dynamically with expected profits, which secondly motivates this work.
The complex network theory studies network characteristics based on network topology (Aleksandra et al., 2021), which is often used to analyze network vulnerability, transmission efficiency, and the importance of nodes. This theory is widely used in the military, aviation, and other fields (Zhao and Li, 2021; Yang et al., 2021). A security evaluation model and index system are proposed for the supply chain network system by Zhao and Li (2021). Based on the complex system, a coordinated optimization model of the green supply chain is established (Guan et al. (2021). Papakostas et al. (2016) considered the deployment of combat communications as a complex multi-layer network, where each layer may be a group of helicopters and vehicles, among others. Yang et al. (2021) used complex networks to study the dynamics of airline networks. In the electricity industry, complex networks are often used to analyze power networks, such as fault identification (Tikariha et al., 2021), vulnerable line analysis (Shi et al., 2018), and power grid modeling (Nepal et al., 2020). However, this method is not used in analyzing the alliance network. Therefore, it is necessary to evaluate the alliance network structure and vulnerability based on the complex network, which thirdly motivates this work.
In some of the studies above, the IDRC’s decision problem is modeled as a single-level model (Lu et al., 2020). These models cannot accurately reflect the behavior of IDRC as a strategic player. In the bi-level models, IDRC does not adopt a cooperative strategy (Zhongkai et al., 2020). In the cooperative strategy, location advantages, alliance update, and cooperation costs are ignored (Fan et al., 2022). In addition, an alliance network is complex, which needs to evaluate the transmission efficiency and network vulnerability through the complex network theory. Table 1 shows the features of previous research and this study.
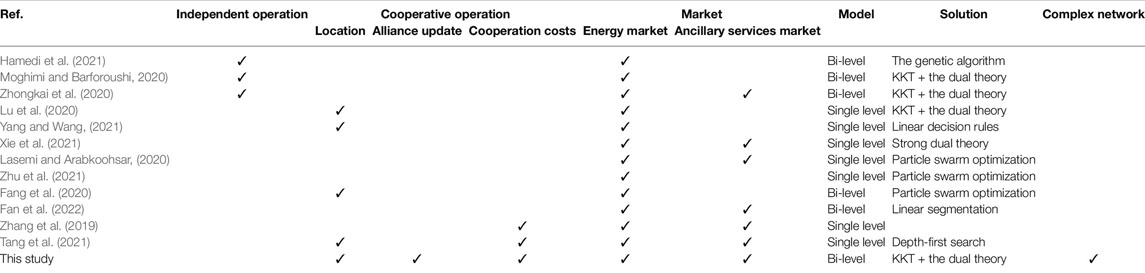
TABLE 1. the features of previous research and this study.
The IDRC alliance and bidding strategy are studied to reduce the penalty cost of EDS. In the medium- and long-term alliance strategies, potential alliances are updated dynamically with the establishment of IDRC. Meanwhile, IDRC’s location and capacity are considered to improve transmission efficiency and risk-resistance ability. In the bidding model of the day-ahead alliance, the cost of cooperation is considered. The main contributions are presented below.
In energy and PFR markets, a bidding model of the two-stage dynamic alliance is proposed. In the medium- and long-term alliance strategies, IDRCs’ potential alliance is determined by the gravity model. The bidding strategy of the day-ahead alliance is the bi-level model. The upper level maximizes the profits of the alliance, where the cooperation costs and alliance condition constraints are considered. Alliance profits are distributed by the Shapley value method. The lower level maximizes social welfare.
In the bi-level model, the lower level is transformed into the constraints of the upper level by the KKT conditions. Then, the strong duality theory and large M method transform the single-level mathematical planning with equilibrium constraints (MPEC) into MILP.
The complex alliance network is formed by the proposed model. The vulnerability and transmission efficiency of alliance network are evaluated by the basic parameters of the complex network theory.
The rest of this study is organized as follows. Section II presents the complex alliance network and the decision framework of IDRC. The bidding model of the two-stage dynamic alliance is presented in Section III. The model solution is presented in Section IV. Case studies and conclusions are, respectively, described in Sections V and Sections V.
2 The Market Decision Framework Based on Complex Network
2.1 IDRCs’ Complex Alliance Network and Characteristic Parameters
Considering the complexity of IDRCs’ alliance operation, the complex alliance network is proposed by referring to the complex supply chain (Guan et al., 2021) and complex power network (Nepal et al., 2020).
The complex alliance network is modeled as a graph G = (V, E), composed of edges set E and nodes set V. IDRC is modeled as the network node N = |V|. Node information includes IDRC number, unit type, and capacity. The edge M = |E| between two nodes indicates that the two nodes have cooperative relations. As the reciprocation of bilateral trade, the complex alliance network is undirected.
2.1.1 Node Degree
Node degree ki is the number of edges directly connected to node i. The higher the degree is, the more important the node is. The scale-free characteristic is that the high degree nodes are a few, and the degree distribution has power-law properties.
2.1.2 Average Path Length
The average path length L is the average distance among all nodes, which is an important index to evaluate the transmission efficiency of the network. A small-world network is a network model between the regular and random networks, widely existing in various complex networks. The characteristic of this network is the small average path length, which aggravates fault propagation:
2.2 Decision Framework for IDRC
With the reform of the Chinese electricity market, IDRC sells electricity and operates DERs as the new market player. As the uncertainty of load and renewable energy output, IDRC has a high risk of deviation penalty (Huang et al., 2021). In order to reduce the deviation penalty, cooperative alliances are built to bid strategically. In the electricity market, many IDRCs are reduced to a few alliances, which reduces the trading complexity.
The IDRCs’ decisions are composed of two parts. On the one hand, the penalty is reduced by the strategic alliance. The two-stage alliance strategy includes medium- and long-term alliance decision and day-ahead alliance decision. In the medium- and long-term alliance decision, IDRC’s location and capacity are considered. Potential alliances are dynamically updated as the growth of complex alliance network nodes. In the day-ahead alliance decision, the binary variables of the alliance are added by alliance constraints. When the distributed profits of the alliance are higher than expected, IDRC participates in the alliance. The alliance constraints improve the satisfaction rate, reducing the cooperation cost caused by disputes.
On the other hand, IDRC buys energy from wholesale markets and sells it to consumers. To maximize profits in the energy and PFR markets, IDRC strategically bids as the owner of DERs in the distribution network. Market participants submit bidding plans to the Distribution System Operator (DSO). Then, DSO completes market clearing (Wang et al., 2022). Participants also include generation companies (Gencos) and retailers. To sum up, how to form alliances and how to strategically bid are the key to IDRCs’ decisions. The bidding decision process of the two-stage dynamic alliance is shown in Figure 1. Firstly, in the medium- and long-term strategy, IDRC selects a potential alliance. Moreover, a potential alliance network is formed. Then, IDRC decides on the day-ahead alliance and bidding. Meanwhile, the bidding strategy is reported to DSO. Finally, the energy and PFR markets are cleared by DSO.
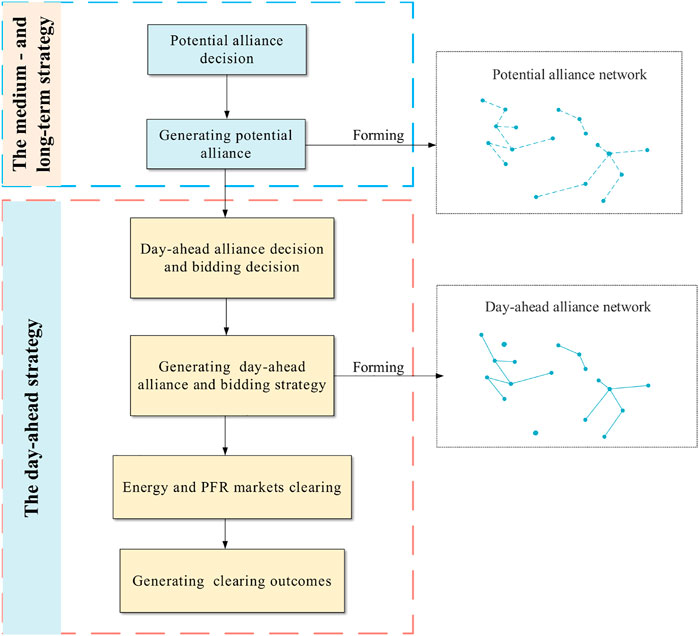
FIGURE 1. The bidding decision process of the two-stage dynamic alliance.
3 The Bidding Model of Two-Stage Dynamic Alliance
3.1 The Medium- and Long-Term Alliance Strategy
Considering the complementation of the deviation volume among IDRCs, the alliance of IDRCs is established. When the IDRC in the alliance faces a deviation penalty, the power of other IDRCs is dispatched to reduce the deviation, which alleviates profits losses. The complex alliance network is changed as social capital investment or the alliance willingness. These changes have medium and long term. In order to maximize IDRC’s profits, the medium- and long-term potential alliances are updated with the change of alliance network.
The gravity model is widely used to quantify the economic relation intensity in trade fields (Wang and Li, 2021). In the mid- and long-term alliance strategy, the above model is applied to quantify the alliance intensity. The gravity model is as follows:
The alliance intensity Tij forms an alliance intensity matrix T:
l is a potential alliance company of i. The potential alliance set is described as
3.2 The Bidding Strategy of Day-Ahead Alliance
In the energy and PFR markets, the bidding strategy of the day-ahead alliance is modeled as a bi-level optimization model in Figure 2. In the upper model, alliance profits are maximized, and the day-ahead alliance is determined. The alliance bidding plan is passed to the lower model. In the lower model, the market is cleared to maximize social welfare. After market-clearing, clearing powers and clearing prices are fed back to the upper level.
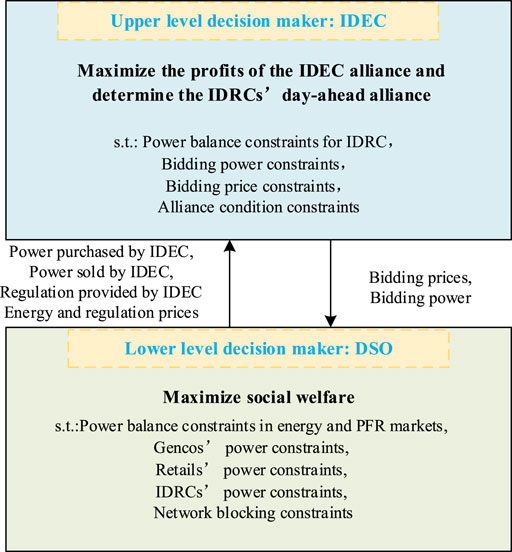
FIGURE 2. The energy and PFR markets framework.
3.2.1 Upper Level
Alliance profits are the total profits of IDRCs minus the cooperation costs. Equation 5 represents the objective function of alliance operation. The first term is IDRCs’ profits in the energy market. In the PFR market, the second term is IDRCs’ mileage profits, and the third term is IDRCs’ capacity profits. The last term is the cooperation cost. The low operating costs of wind turbines and energy storage are ignored. With the increase in IDRCs in alliance, profits disputes increase. The cooperation cost is linearly related to the number of IDRCs. As the alliance constraints, the players’ profits in the alliance mostly meet the expected, reducing the cooperation cost. However, disputes are inevitable. The cooperation cost is still considered. The multi-scenario method describes the error between the predicted output and the actual one.
If i is allied, ui = 1. If not, ui = 0. If IDRC is honest, ci is small:
Equations 7–9 are used to justify the relation between possible scenarios and outcomes:
Power balance constraints of IDRC:
Bidding power constraints of IDRC:
Bidding price constraints of IDRC:
Alliance constraints of IDRC: alliance profits are distributed by the Shapley value method. On the left of the constraint is the distributed profits. On the right is the binary alliance decision variable multiplied by the expected profits:
K are the whole subsets of wj, which include i. When the distributed profits in the day-ahead market are higher than expected, IDRC joins the alliance and vice versa:
3.2.2 Lower Level
IDRCs participate in energy and PFR markets to maximize profits, which are operated by DSO. Market participants also include Gencos and retailers. The behaviors of Gencos and retailers are considered non-strategic to stimulate the opening-up of the distribution side.
Maximum social welfare means minimum system costs. Eq. 22 is the objective function of the lower level. In the energy market, Gencos sell energy and retailers buy energy, modeled as first and second terms. The third and fourth terms are, respectively, the sale and purchase of energy by IDRCs. In the PFR market, the regulation costs of Gencos, retailers, and IDRCs are modeled in the other terms, respectively:
Power balance constraints in energy and PFR markets: energy and regulation balance constraints are modeled as follows:
The mileage offer of the marginal regulation unit is the mileage clearing price. The capacity clearing price is the difference between the regulation clearing price and the mileage clearing price.
Gencos’ power constraints: operational constraints of Gencos in both energy and PFR markets are modeled as follows:
Retailers’ power constraints: operational constraints of retailers in both energy and PFR markets are modeled as follows:
IDRCs’ power constraints: operational constraints of IDRCs in both energy and PFR markets are modeled as follows:
Line power flow and node phase angle constraints: the constraints of network blocking are modeled as follows:
XLL is the decision variables of the lower level, defined as
Note that
4 Solution Method
In the bidding model of the day-ahead alliance, the upper level is nonlinear and the lower level is linear. Generally, there are two kinds of solving methods for the bi-level programming problem.
To handle the nonlinear or nonconvex of these bi-level optimization models, some heuristic methods, such as the particle swarm and genetic algorithms, are developed by Fang et al. (2020) and Hamedi et al. (2021). However, when the number of variables is large, these kinds of methods often suffer from local optimal and solution time is lone.
The bi-level programming model is transformed into MPEC by some mathematical tools, such as the KKT conditions in Zhongkai et al. (2020) and linear segmentation in Fan et al. (2022). Then, the equivalent model can be easily solved by traditional mathematical programming methods. However, this kind of approach confronts challenges if the model is nonlinear and nonconvex. In this article, MPEC is nonlinear as the multiplication of decision variables. For an easier solution, the nonlinear terms of MPEC are replaced with linear terms by the strong duality theory and large M method. After the linearization, MPEC is transformed into the MILP model, which can be solved directly by commercial solvers. The transformation process is shown in Figure 3.
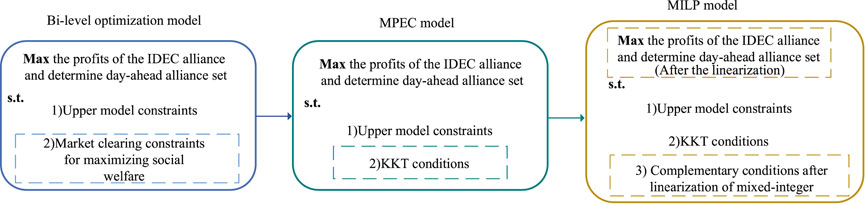
FIGURE 3. The transformation process of the model.
4.1 The KKT Conditions
In the bi-level model, the decision variables of the upper-level model are considered constants of the lower-level model. Therefore, the lower level is a linear model, which is replaced by KKT conditions. The KKT conditions of the lower-level model consist of equality constraints Eqs. 23–24 and Eqs. 37–63:
4.2 Linearize MPEC
MPEC is composed of Eqs. 5–21, 23, 24, and37 –63. The objectives of Eq. 5 and Eqs. 46–63 are nonlinear, caused by multiplying the decision variables. The nonlinear terms are linearized to solve MPEC effectively.
The objective function is linearized by the strong duality theory as follows:
Nonlinear equations46 –63 are linearized by the big M method. Take the linearization of Eq. 47 as an example:
5 Case Analysis
The effectiveness of the model is verified by using the illustrative test case, the IEEE 33-bus system case, and the PG&E 69-bus system case. The model is implemented in MATLAB using the CPLEX solver.
5.1 Illustrative Example
This section analyzes the implications of alliance strategies on the characteristics of complex networks by the illustrative test case. A fictitious power system is presented. This test system has 10 Gencos, 30 IDRCs, and 3 retailers. Tables 2, 3 provide the data of the Gencos and the retailers, respectively, including the energy bids/offers, the capacity bids/offers, the mileage bids/offers, and the maximum power of the Gencos and the retailers. The maximum regulation capacity of Gencos is 10% of the maximum power generation. IDRCs’ load requirements are reduced to three categories. The load requirements of retailers and IDRCs are shown in Figure 4. The maximum regulation capacity of retailers is 10% maximum power.
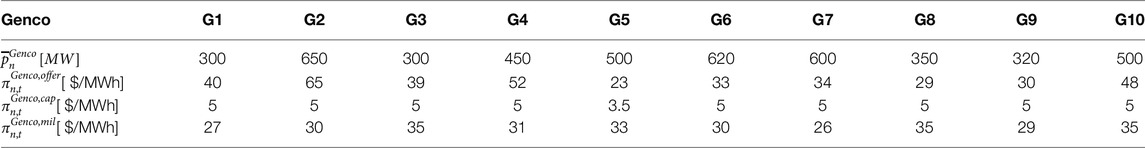
TABLE 2. Gencos’ parameters.
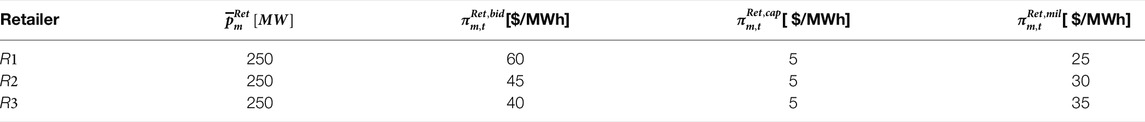
TABLE 3. Retailers’ parameters.
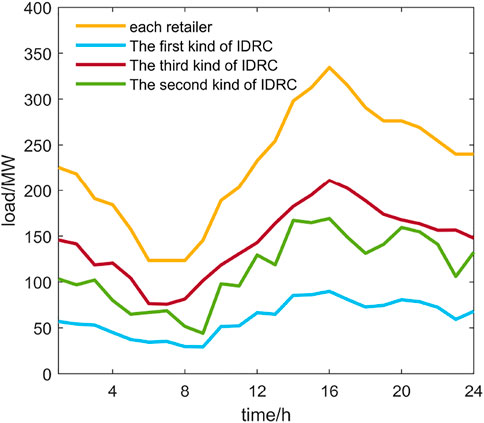
FIGURE 4. Load demand from retailers and IDRCs.
The regulation capacity requirement of the system is 1% of the system load. The regulation mileage requirement is the capacity requirement multiplied by the historical mileage capacity ratio (take 10). IDRCs establish three types of wind turbines and two types of energy storage. Probability scenarios of wind turbine output are obtained by Monte Carlo simulation and scene reduction algorithm. The SOC of energy storage is 10%–90% of capacity. The SOC of the initial and end periods is 10% of capacity. Charge and discharge efficiencies are 92%. The data of IDRCs are shown in Table 4, including the capacity of different units and dimensionless position coordinates. In order to verify the effectiveness of the proposed potential alliance model, the characteristic parameters of the complex alliance network are compared in different alliance strategies. The three potential alliance strategies are as follows:
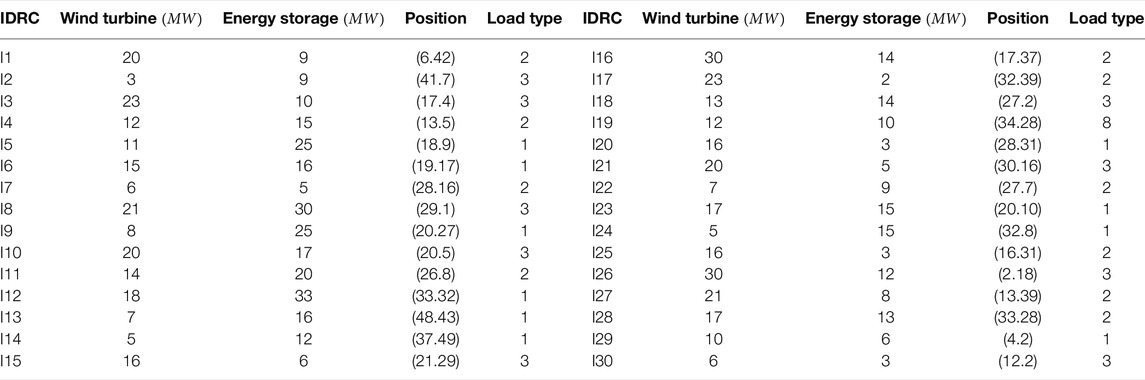
TABLE 4. Retailers’ parameters.
Case 1: when forming potential alliances, the capacity of IDRC is considered and the advantage of the location is ignored.
Case 2: when forming potential alliances, the advantage of the location is considered and the capacity of IDRC is ignored.
Case 3: when forming potential alliances, the advantage of the location and capacity is considered, which is the strategy proposed in this study.
5.1.1 Comparison of Average Path Lengths
The average path length is an important index reflecting network transmission efficiency. The long average path length increases the energy loss.
As shown in Figure 5, case 1 has the longest average path length, which is 1.87. In case 1, the capacity of IDRC is only considered. Therefore, all IDRCs are connected with the IDRC of the largest capacity, which increases the resistance to the risk. However, it also decreases the efficiency of energy transmission. Case 2, which only considers the location, has the shortest average path length. IDRC tends to align with neighboring companies. Therefore, the average distance length is the smallest, which effectively improves the transmission efficiency of energy. However, as the small average path length, the potential alliance network has small-world properties. Faults are easily spread to adjacent and non-adjacent nodes, where networks are vulnerable. The average path length of case 3 is medium, which is 1.3. The alliance strategy of case 3 considers installed capacity and location, which improves the ability to resist risks and the efficiency of energy transmission. The effectiveness of the potential alliance strategy is verified.
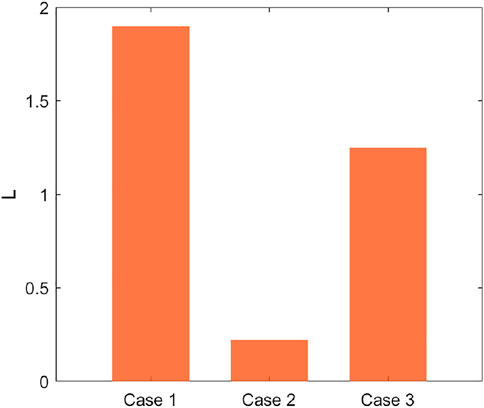
FIGURE 5. The average path lengths of different cases.
5.1.2 Comparison of Degree Distributions
The degree distributions of different strategies are shown in Figure 6. The horizontal axis is degrees. The vertical axis is the probability of degree. The blue points in Figure 6 are the distribution of degrees. The red curves are power-law fitting curves of degree distribution. The diameter of the blue point indicates the total capacity in degree.
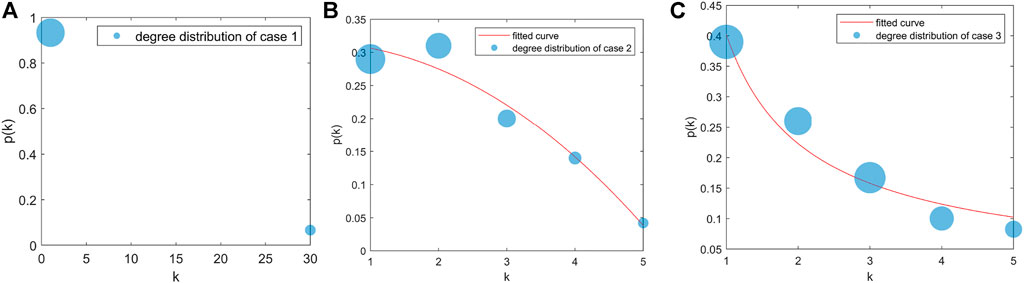
FIGURE 6. The degree distributions of different cases. (A) Case 1. (B) Case 2. (C) Case 3.
In case 1, the capacity of IDRC is only considered. The IDRC with the largest capacity has the maximum degree. The degrees of other nodes are 1. Degree distribution has no power-law properties. The IDRC with the largest capacity is the most important in the complex alliance network. In case 2, degree distribution has power-law properties, where p(k) = k−λ(λ = 2.029,R−square = 0.9692). Many degrees of nodes are 2 and a few ones are 5. As the degree increases, the total capacity decreases. The number of small degree nodes is large, and the corresponding capacity is large. When the degree increases, the number of nodes decreases, decreasing the capacity. The IDRC closest to other IDRCs has the highest degree, meaning the most important in case 2.
In case 3, degree distribution also has power-law properties, where λ = 0.8597 and R−square = 0.9606. The degree of maximum probability is 1. Furthermore, the degree of minimum probability is 5. With the increase in degree, the total capacity decreases, increases, and decreases again. Although the IDRCs of small degrees have a small capacity, they have a considerable number. Therefore, the total capacity is large. When the degree increases, the number of IDRCs decreases, decreasing the total capacity. Then, IDRCs of large capacity appear, increasing the total capacity. Finally, the number of large-capacity IDRCs declines, decreasing the total capacity. Aligning with neighboring and large-capacity IDRCs can improve the capacity of resisting risk and transmission efficiency. IDRCs of excellent location and large capacity have a large degree, which shows the effectiveness of the potential alliance strategy.
However, as degree distribution is scale-free in case 3, the high degree nodes have a great impact on the vulnerability of the alliance network. Therefore, how to rationally distribute the alliance profits of important nodes is the focus of future research.
5.2 The IEEE 33 Node System Case
The topology of the IEEE 33-bus distribution system is shown in Figure 7. The line parameters refer to Baran and Wu (1989). In order to verify the effectiveness of the proposed day-ahead alliance strategy, IDRCs’ satisfaction rates and profits are compared in different strategies. The period of meeting expectations to the total period is the satisfaction rate. The analysis of profits takes the I3 as an example. In addition, a sensitivity analysis of expected profits is performed. The three day-ahead alliance strategies are as follows:
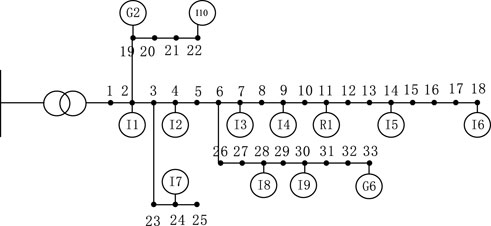
FIGURE 7. IEEE 33-bus distribution system.
Case 1: IDRC bids as an independent market player and does not participate in the alliance.
Case 2: IDRC participates in the alliance, and the alliance constraints are not considered in the day-ahead alliance strategy.
Case 3: IDRC participates in the alliance, and the alliance constraints are considered in the day-ahead alliance strategy.
5.2.1 Comparison of Satisfaction Rates and Profits
Satisfaction rates of IDRCs under different strategies are shown in Figure 8A. The satisfaction rate in case 1 is the lowest. Because IDRC does not participate in the alliance, the risk of deviation cannot be reduced by power complementation between IDRCs. In addition, the independent bidding is conservative as the risk of deviation. The profits are low and do not meet the expected profits in most periods, which is also reflected in the comparison of the expected profits with the profits of case 1.
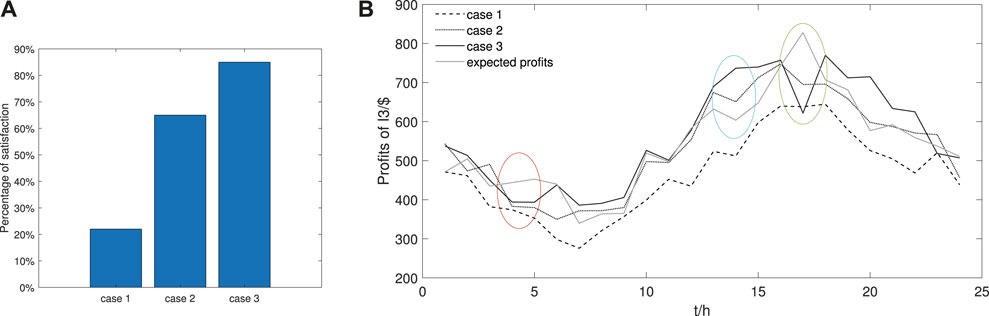
FIGURE 8. (A) The satisfaction rates of IDRCs. (B) Expected profit and market profits of different strategies.
In case 2, the satisfaction rate is greatly improved. IDRCs reduce the cost of deviation penalty by complementary deviation. IDRCs bid aggressively and strategically adjust the clearing price, which is stimulated by the alliance. In Figure 8B, the profits are higher than those in case 1. Moreover, the difference is significant during the heavy load periods. As a seller in the PFR market, the IDRC aggressive bids, raising the clearing price and profits. However, the satisfaction rate of case 2 is still lower than that of case 3. In case 3, the alliance constraints reduce the cooperation cost, increasing the distribution profits. This is also reflected in the profits comparison between case 2 and case 3 in Figure 8B.
5.2.2 Sensitivity Analysis
Figure 8B reflects the impact of expected profit on the profits of case 3. As shown in the red circle, when the load demand is small and the expected profit is high, the I3 does not meet the alliance conditions. Binary decision variable of alliance limits to the alliance of I3. After leaving the alliance, the profits of case 3 are basically the same as the ones of case 1. When the load demand is small, alliance strategy bidding has little influence on the market.
As shown in the blue circle, when the system load demand is high and the expected profit of I3 is low, the binary decision variable of the alliance has no significant impact on the profits. However, in the green circle, the expected profit of the I3 is high. The binary decision variable again limits alliance. Then, the profits of I3 are decreased, which are still higher than the profits in case 1. This is the result of the alliance’s strategic behaviors.
When the load demand is large, the strategic bidding of the alliance has a significant influence on the market. When the alliance sells capacity in the PFR market, the regulation clearing price is raised by the alliance’s strategic behaviors. When the power demand is not afforded by the wind turbines and storage, the alliance acts as a buyer in the energy market and the energy clearing price is reduced. Meanwhile, to reduce purchasing power, the distributed resources of the alliance are adjusted to increase power generation.
It is seen from the above analysis that IDRCs with conservative expectations are more likely to align and increase profits. In order to prevent the IDRC from violating the alliance agreement, ci is increased with dishonest behavior, which is negative for participating in the alliance. The effectiveness of the day-ahead alliance model is verified.
5.3 PG&E 69 Node System
In order to verify the applicability of the proposed model in large-scale distribution networks, the PG&E 69-bus system is used to test. The topology is shown in Figure 9, and line parameters are listed in Baran and Wu (1989).
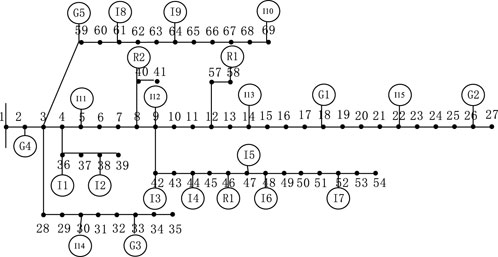
FIGURE 9. PG&E 69-bus distribution system.
5.3.1 Analysis of Clearing Results
The market-clearing results are shown in Figures 10–12. In the energy market, the power generation of Gencos is described in Figure 10. The regulation capacity of market participants is shown in Figure 11. In the energy and PFR markets, percentages of the optimal decisions are shown in Figure 12.
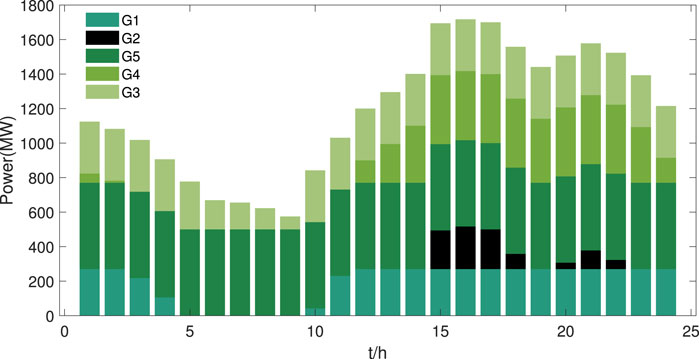
FIGURE 10. Power generation of Gencos to meet the demand.
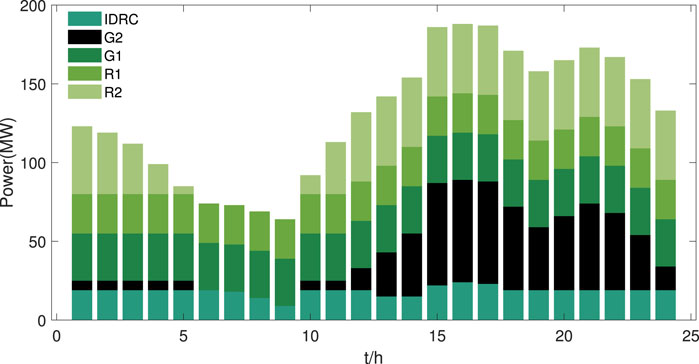
FIGURE 11. Regulation capacity provided by each player.
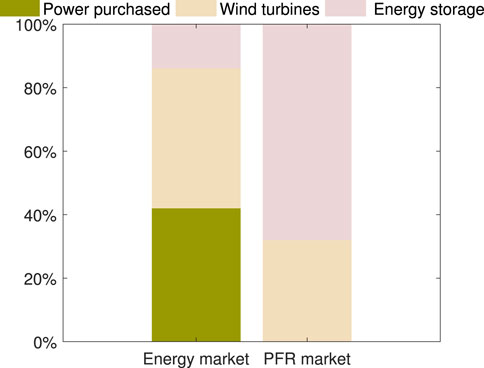
FIGURE 12. Optimal decisions percentage of the alliances.
In Figure 10, except for peak periods 15–18 and 20–22, the load demand is afforded by the G5, G3, G1, and G4 of low price. As the load in these periods is small, the low-offer Gencos are cleared first and the clearing price is low in the energy market. During the peak periods of 15–18 and 20–22, the G2 of high-offer wins the bid. Meanwhile, the power generation of wind turbines and energy storage is adjusted to reduce the energy purchase by the alliance. This is the result of the alliance’s strategic behavior, which reduces the complexity of the transaction and the clearing price of the energy market. However, the influence of strategic behavior is limited. For example, in hours 12–14, the total load of the system is decreased by alliance strategy, which makes G2 free. In hour 15, G2 cannot be free due to insufficient power generation in the alliance.
In Figure 11, the winning bidders include Gencos, retailers, and IDRCs in the PFR market. G1 and G2 participate in both the energy and PFR markets. As the low offer of G5 in the energy market, all the power of G5 is cleared in the energy market without participating in the PFR market. The percentages of optimal decisions are reflected in Figure 12. In the energy market, the energy sources of IDRC are divided into three parts. 42% of the energy is purchased from the market, 44% from internal wind turbines, and 14% from internal energy storage. In the PFR market, the proportion of energy storage significantly increases to 68%. The proportion of wind turbines decreases to 32%. The excellent regulation performance of energy storage reduces the cost of regulation, making it easier for IDRC to win the bidding in the PFR market. Therefore, investing in energy storage benefits IDRCs in the PFR market.
5.3.2 Impact of Grid Congestion
In order to analyze the impact of grid congestion on clearing results, the clearing power and clearing prices of the two cases are compared. The two cases are as follows:
Case 1: in the PG&E 69-bus system, grid congestion constraints are not considered.
Case 2: in the PG&E 69-bus system, grid congestion constraints are considered. In different cases, Figure 13 shows the clearing power and the clearing electricity prices at Bus 4. In the energy market, generated power of G4 is studied. The power of case 2 is decreased obviously during the peak periods of 15–18 and 20–22. Due to the heavy load of the system, the transmission power of the line is large, resulting in line blockage. In order to reduce the transmission power of overloaded lines, the generated power of G4 is reduced, and one of the high-priced G2 is increased. In the period of 20, G2 is free neglecting grid blockage. However, when network blockage is considered, G2 wins the bidding and the energy clearing price is increased to 65 $/MWh. In the PFR market, the bidding price of R2 and G2 is the same. When the system load is low, the regulation power is purchased from R2 to reduce the power loss. With the system load increases, regulation power from G2 increases to reduce the transmission power on the overloaded line. With the increase in power losses and IDRCs’ strategic behavior, the PFR clearing price is increased after considering grid congestion.
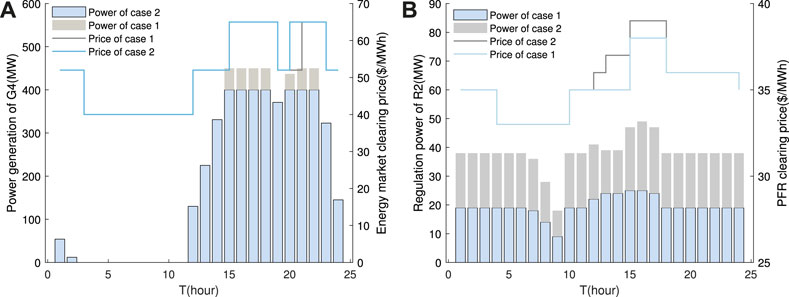
FIGURE 13. The clearing power and the clearing electricity price of different cases. (A) The energy market. (B) The PFR market.
6 Conclusion
In energy and PFR markets, a bi-level bidding model of the two-stage dynamic alliance is proposed. The dynamic of the complex alliance network is considered in the two-stage alliance strategy. In the medium- and long-term alliance strategy, the location and capacity of IDRCs are considered. In the day-ahead alliance strategy, binary alliance decision variables are added by alliance condition constraints. The main conclusions are as follows.
As installed capacity and distance are considered in the medium- and long-term alliance strategy, the alliance risk resistance and transmission efficiency are improved. The degree distribution of alliance has power-law properties. IDRCs with large capacity and superior location are important in the alliance.
Binary alliance decision variables improve the satisfaction rate of the alliance. The cost of cooperation is reduced, increasing the profits of the alliance. A sensitivity analysis on excepted profits shows that this parameter has an important impact on the IDRC’s profits. IDRCs need to reasonably choose expected profits to maximize their own profits. Furthermore, the IDRC’s dishonest behavior affects its subsequent alliance.
The IDRC optimizes the operation of internal generation resources, which adjusts the clearing price and maximizes social welfare. In the PFR market, energy storage is more likely to profit as excellent regulation performance. In addition, grid blockage affects market-clearing prices and players’ profits. Network location should be considered when investing in IDRC.
In this study, the research on alliance bidding strategy provides a reference for IDRC participating in the energy and PFR markets. With the complexity of electricity market transactions, the distribution of alliance profits is simplified. How to distribute profits according to the importance of IDRC is studied in future work.
Data Availability Statement
The original contributions presented in the study are included in the article/supplementary material. Further inquiries can be directed to the corresponding author.
Author Contributions
PL and ZW participated in the conception and design of the study. PL organized the database. JJ performed the simulation analysis. PL wrote the first draft of the manuscript. PL, ZW, and GL revised sections of the manuscript. All authors contributed to manuscript revision and read and approved the submitted version.
Funding
This research was supported by the Natural Science Foundation of Shanghai (Grant no. 15ZR1417300).
Conflict of Interest
Author GL was employed by State Grid Shanxi Electric Power Company.
The remaining authors declare that the research was conducted in the absence of any commercial or financial relationships that could be construed as a potential conflict of interest.
Publisher’s Note
All claims expressed in this article are solely those of the authors and do not necessarily represent those of their affiliated organizations or those of the publisher, the editors, and the reviewers. Any product that may be evaluated in this article, or claim that may be made by its manufacturer, is not guaranteed or endorsed by the publisher.
References
Aleksandra, M.-K., Ryan, B. J., Laura, A., Lance, C., and Huy, T. T. (2021). A Complex Network Framework for Validated Assessments of Systems of Systems Robustness. Automation Electr. Power Syst. 45, 9. doi:10.1109/JSYST.2021.3064817
Bahramara, S., Yazdani-Damavandi, M., Contreras, J., Shafie-Khah, M., and Catalao, J. P. S. (2018). Modeling the Strategic Behavior of a Distribution Company in Wholesale Energy and Reserve Markets. IEEE Trans. Smart Grid 9, 3857–3870. doi:10.1109/tsg.2017.2768486
Baran, M. E., and Wu, F. F. (1989). Optimal Capacitor Placement on Radial Distribution Systems. IEEE Trans. Power Deliv. 4, 725–734. doi:10.1109/61.19265
Fan, W., Huang, L., Cong, B., Degejirifu, Z., Tan, Z., and Xing, T. (2022). Research on an Optimization Model for Wind Power and Thermal Power Participating in Two-Level Power Market Transactions. Int. J. Electr. Power & Energy Syst. 134, 107423. doi:10.1016/j.ijepes.2021.107423
Fang, F., Zhu, Z., Jin, S., and Hu, S. (2020). Two-layer Game Theoretic Microgrid Capacity Optimization Considering Uncertainty of Renewable Energy. IEEE Syst. J. 15, 4260–4271. doi:10.1109/JSYST.2020.3008316
Fu, X., Yang, K., Li, G., and Zeng, D. (2022). Research on the Trading Arrangement and Clearing Model of Medium and Long Term Inter-provincial Markets Considering Security Constraints. Front. Energy Res. 9, 807590. doi:10.3389/fenrg.2021.839108
Guan, Y., Aamir, M., Dayo, Z. A., Rahman, Z., Abro, W. A., Ali, I., et al. (2021). A Coordinated Optimization Model of the Complex System of the Green Supply Chain Distribution Network. Discrete Dyn. Nat. Soc. 2021, 4077151. doi:10.1155/2021/4077151
Hamedi, H., Talavat, V., Tofighi, A., and Ghanizadeh, R. (2021). A Risk-Based Competitive Bi-level Framework for Operation of Active Distribution Networks with Networked Microgrids. J. Mod. Power Syst. Clean Energy 9, 9. doi:10.35833/mpce.2020.000415
Huang, Z., Zhang, Y., Zhang, F., Lin, J., An, X., and Han, S. (2021). Day-ahead and Real-Time Energy Management for Active Distribution Network Based on Coordinated Optimization of Different Stakeholders. Power Syst. Technol. 45, 2299–2308. doi:10.13335/j.1000-3673.pst.2020.0410
Hwang, H.-K., Yoon, A.-Y., Kang, H.-K., and Moon, S.-I. (2020). Retail Electricity Pricing Strategy via an Artificial Neural Network-Based Demand Response Model of an Energy Storage System. IEEE Access 9, 13440–13450. doi:10.1109/ACCESS.2020.3048048
Lasemi, M. A., and Arabkoohsar, A. (2020). Optimal Operating Strategy of High-Temperature Heat and Power Storage System Coupled with a Wind Farm in Energy Market. Energy 210, 118545. doi:10.1016/j.energy.2020.118545
Li, X., Liu, C., Sheng, K., Wen, B., Xie, H., Zhao, W., et al. (2022). A Multi-Level Investment Demand Assessment Model for Renewable-Dominated Power System Planning. Front. Energy Res. 9, 807590. doi:10.3389/fenrg.2021.807590
Lu, T., Zhang, W., and Ding, X. (2021). Operation Strategy of Electricity Retailers Based on Energy Storage System to Improve Comprehensive Profitability in China’s Electricity Spot Market. Energies 14, 6424. doi:10.3390/en14196424
Lu, X., Chan, K. W., Xia, S., Shahidehpour, M., and Ng, W. H. (2020). An Operation Model for Distribution Companies Using the Flexibility of Electric Vehicle Aggregators. IEEE Trans. Smart Grid 12, 1507–1518. doi:10.1109/TSG.2020.3037053
Moghimi, F. H., and Barforoushi, T. (2020). A Short-Term Decision-Making Model for a Price-Maker Distribution Company in Wholesale and Retail Electricity Markets Considering Demand Response and Real-Time Pricing. Int. J. Electr. Power and Energy Syst. 117, 105701. doi:10.1016/j.ijepes.2019.105701
Nepal, S., Thang, D. Q., Higashino, T., and Okada, M. (2020). Optimization of Multi-Frequency Network with Dvb-T2 Services for Regions with Complex Geographies: A Case Study of Nepal. IEEE Trans. Broadcast. 67, 299–312. doi:10.1109/TBC.2020.3028320
Papakostas, D., Basaras, P., Katsaros, D., and Tassiulas, L. (2016). “Backbone Formation in Military Multi-Layer Ad Hoc Networks Using Complex Network Concepts,” in MILCOM 2016 - 2016 IEEE Military Communications Conference, 842–848. doi:10.1109/MILCOM.2016.7795434
Shi, Y., Zhang, D., and Diao, Z. (2018). An Improved Parallel Maximum Flow Approach for Vulnerability Analysis of Power System. IEEE 9, 777–785. doi:10.1109/icbda.2018.8367715
Tang, J., Zhang, Z., Yang, L., Cui, J., Chen, J., and Lin, Z. (2021). Modeling the Strategic Behavior of a Distribution Company in Wholesale Energy and Reserve Markets. Automation Electr. Power Syst. 45, 9. doi:10.1109/TSG.2017.2768486
Tikariha, A., Londhe, N. D., Bag, B., and Raj, R. (2021). Classification of Faults in an Ieee 30 Bus Transmission System Using Fully Convolutional Network. Int. Trans. Electr. Energy Syst. 31, e13134. doi:10.1002/2050-7038.13134
Wang, H., and Li, M. (2021). Improved Gravity Model under Policy Control in Regional Logistics. Meas. Control 54, 811–819. doi:10.1177/0020294020919849
Wang, X., Ying, L., Wen, K., and Lu, S. (2022). Bi-level Non-convex Joint Optimization Model of Energy Storage in Energy and Primary Frequency Regulation Markets. Int. J. Electr. Power and Energy Syst. 134, 107408. doi:10.1016/j.ijepes.2021.107408
Xie, Y., Guo, W., Wu, Q., and Wang, K. (2021). Robust Mpc-Based Bidding Strategy for Wind Storage Systems in Real-Time Energy and Regulation Markets. Int. J. Electr. Power and Energy Syst. 124, 106361. doi:10.1016/j.ijepes.2020.106361
Yang, H., Le, M., and Wang, D. (2021). Airline Network Structure: Motifs and Airports' Role in Cliques. Sustainability 13, 9573. doi:10.3390/su13179573
Yang, Q., and Wang, H. (2021). Distributed Energy Trading Management for Renewable Prosumers with Hvac and Energy Storage. Energy Rep. 7, 2512–2525. doi:10.1016/j.egyr.2021.03.038
Zhang, Z., Jiang, Y., Lin, Z., Wen, F., Ding, Y., Yang, L., et al. (2019). Optimal Alliance Strategies Among Retailers under Energy Deviation Settlement Mechanism in china’s Forward Electricity Market. IEEE Trans. Power Syst. 35, 2059–2071. doi:10.1109/TPWRS.2019.2955479
Zhao, J., and Li, Y. (2021). Supply Chain Security Evaluation Model and Index System Based on a 5g Information System. Neural Comput. Appl. 5, 1–11. doi:10.1007/s00521-021-06584-5
Zhongkai, Y., Yinliang, X., Jianguo, Z., Wenchuan, W., and Hongbin, S. (2020). Bi-level Programming for Optimal Operation of an Active Distribution Network with Multiple Virtual Power Plants. IEEE Trans. Sustain. Energy 11, 2855–2869. doi:10.1109/TSTE.2020.2980317
Zhu, Y., Huang, W., Chen, S., Zhang, S., Lai, C., and Ma, G. (2021). Spot Quotation Alliance Modeling Method of Cascade Hydropower Based on Symbiosis Theory. J. Hydrology 602, 126753. doi:10.1016/j.jhydrol.2021.126753
Nomenclature
Abbreviations
i, j, l Number of IDRCs
N Total number of IDRCs
n, m Number of Gencos and retailers
w Number of scenarios
t Time interval
a, b Number of wind turbines and batteries
α, β Bus index
k Relative gravitational coefficient
ci Historical credibility of IDRCs
ρw Probability of a scenario
Mi, Mj Total capacity of IDRCs
dij Shortest path edges between IDRCs
η Efficiency of the IDRCs transformer
Wi Excepted profits of IDRC
Fα,β Max power flow of transmission line
Bα,β Susceptance of line
L Average path length
Tij Alliance intensity between IDRCs
T Alliance intensity matrix
Til Row maximum value matrix
Jn Total number of potential alliances
ui Binary decision variable of alliance
Ew,t,b Energy storage of battery
vΨ, vΨ/i Profits of joining and not joining virtual alliance
θα Phase angle of bus
Keywords: complex network, two-stage dynamic alliance, cooperation cost, alliance conditional constraints, bidding strategy
Citation: Li P, Wang Z, Jin J and Li G (2022) Two-Stage Dynamic Alliance Bidding for Incremental Distribution and Retail Companies Based on Complex Network Theory. Front. Energy Res. 10:924106. doi: 10.3389/fenrg.2022.924106
Received: 20 April 2022; Accepted: 14 June 2022;
Published: 09 August 2022.
Edited by:
Xiaoshun Zhang, Northeastern University, ChinaCopyright © 2022 Li , Wang , Jin and Li. This is an open-access article distributed under the terms of the Creative Commons Attribution License (CC BY). The use, distribution or reproduction in other forums is permitted, provided the original author(s) and the copyright owner(s) are credited and that the original publication in this journal is cited, in accordance with accepted academic practice. No use, distribution or reproduction is permitted which does not comply with these terms.
*Correspondence: Zhijie Wang, d3pqc2hkakAxNjMuY29t