Abstract
Exploring renewable energy is beneficial for ameliorating the energy crisis and reducing environmental emissions. The hybrid utilization of solar and geothermal energies is an effective way to improve the existing energy consumption structure dominated by fossil energy. This paper proposes a novel power generation system composed of a topping recompression supercritical carbon dioxide (sCO2) Brayton cycle and a bottom organic flash cycle (OFC) driven by the hybrid solar-geothermal energies. The sCO2 Brayton cycle is driven by the heat from the solar tower system, and the OFC is driven by a part of the heat from CO2 in the sCO2 Brayton cycle and another part of the heat from the geothermal water. The corresponding energy and exergy analyses of the proposed combined system are presented. The effects of the five main parameters on the system thermodynamic performance are carried out, which are direct radiation intensity, concentration ratio, sCO2 pressure ratio, preheater terminal temperature difference, and flash temperature. Results show that the OFC with R245ca has the highest exergy efficiency among the different four fluids. The energy efficiency and exergy efficiency of the total system are 26.03% and 33.38%, respectively, since the energy losses exist in the heliostat field and central receivers. There observes that through the parametric study the parameters of direct radiation intensity and concentration ratio are larger causing better system thermodynamic performance. Through the thermodynamic analysis, there observes the power cycle subsystem has the largest energy loss, while the central receiver possesses the highest among other subsystems.
1 Introduction
With the rapid development of the global economy, energy crises and environmental problems have become major global issues. The exploitation of renewable energies, such as solar, geothermal, biomass, and wind, is one of the potential ways to solve such energy and environmental problems and satisfy the gradually growing electricity demand. It has been reported that the goal of increasing the renewable energy production share has been made, which requires a further 50% increase planned between 2019 and 2024 from 26% of the global share in 2018 (Song et al., 2021). Solar as a widely accessible renewable energy is an indispensable part of the future energy framework, with many promising technologies, like photovoltaic (Mariaud et al., 2017), photothermal (Wang et al., 2020a), and hybrid photovoltaic–thermal (Herrando et al., 2018) technologies. Geothermal is also an attractive renewable resource characterized by its relative stability and reliability and suitable for baseload power generation (Wang et al., 2018a).
The complementary use of different renewable energies can improve its energy utilization efficiency, but it enhances the complexity of energy system design. The integrated utilization of solar and geothermal energies is a potential application way. This conception was firstly proposed in 1975 (Li et al., 2020), and continues to attract attention for different types of energy provision. Many research works about this integrated energy utilization have been reported and are drawing interest. Ayub et al. (2015) studied the thermo-economic performance of a solar-binary geothermal power system. Results found that the proposed system had nearly 6% higher net power output and 2% lower levelized cost of electricity compared with a geothermal organic Rankine cycle (ORC) system. Alirahmi et al. (2020) studied a multi-generation system exploiting geothermal and solar energies. Multi-objective optimization results showed that the exergy efficiency and total unit cost were 30% and 130 $/GJ under the optimal design conditions, respectively. Al-Hamed and Dincer (2019) proposed a novel solar-geothermal system integrated with an ejector-absorption chiller. They found that the thermal efficiency of the proposed system was up to 53%, and the corresponding COP was about 1.03. Another hybrid power generation system for solar-geothermal application was investigated by Bonyadi et al. (2018), who carried out a techno-economic study. Results found that compared with a typical geothermal plant the proposed system had higher thermal efficiency by 12% and less brine consumption. To sum up, there are many ways of integrated utilization of solar and geothermal energy. The design principle of its energy system mainly depends on the energy demand of the user side. The current research mainly focuses on system structure design, operation parameter optimization, demand side optimization, etc.
In recent years, the supercritical carbon dioxide (sCO2) Brayton cycle with its advantages of compact volume and high-efficient (Liu et al., 2019) has drawn plenty of attention, including configuration optimization (Gao et al., 2021; Gao et al., 2022), economic and environmental evaluation (Wu et al., 2018; Xiao et al., 2022), dynamic control (Wang et al., 2021a), etc., Many research works have been reported focused on the applications of the sCO2 Brayton cycle in the renewable energy field. For example, Novales et al. (2019) studied the different sCO2 system structures for concentrating solar power through sensitivity analysis. Results showed that the partial cooling cycle was sensitive to turbine efficiency. A multi-objective optimization focused on the different types of sCO2 Brayton cycle was conducted by Wang et al. (2018b), who reported inter-cooling and partial cooling types as the most suitable ones applied in solar power tower systems. Yang et al. (2020) established the off-design model of the sCO2 Brayton cycle for solar power tower application. The interaction effects between thermal storage system, heliostat field, and Brayton cycle at part-load conditions were discussed. Thus, it can be seen that the application of the sCO2 Brayton cycle in the solar-geothermal fields is of great value (Cao et al., 2022).
In the recompression sCO2 Brayton cycle, a considerable amount of thermal energy is discharged to the cooling water when the CO2 is cooled to about 32°C before the compression process. Thus, the sCO2 Brayton cycle performance could be enhanced by adding an appropriate bottoming cycle to utilize this part of energy (Mishra and Singh, 2018). To further improve the solar energy utilization efficiency, the sCO2 Brayton cycle is supposed to be integrated with a bottoming cycle, like ORC (He et al., 2012; Wang et al., 2020b; Cai et al., 2021; Wang et al., 2022), transcritical CO2 cycle (Kochunni and Chowdhury, 2021), refrigerating cycle (Wang et al., 2020c; Wang et al., 2021b), etc., Wang et al. (2016) proposed the combined cycle composed of the sCO2 Brayton cycle and ORC and studied its thermodynamic performance. They found that the ORC arranged between split point and low-temperature recuperator was the optimal scheme. Manjunath et al. (2018) studied the thermodynamic performance of the sCO2 Brayton cycle combined with the transcritical CO2 cycle for shipboard turbine waste recovery. Results found the integrated system improved the net power output by 18% compared with the basic one. In addition, the organic flash cycle (OFC) is another potential way to treat the bottoming cycle in the sCO2 Brayton cycle, since it can avoid the pinch limitation of traditional ORC and the condensation process in the OFC cooler through conventional coolant at all ambient temperatures. Lee et al. (2016) studied the thermodynamic performance of different OFC system structures, including basic type and double expander type, and compared the system performance with ORC for low-grade waste heat recovery. Wu et al. (2018) studied the integration of the sCO2 Brayton cycle with OFC. Results found that the combined cycle had advantages in cost and efficiency. The mentioned-above studies are usually needed only one heat source to drive. In the case of hybrid solar-geothermal energy utilization, heat available from the geothermal brine can also be utilized to preheat the bottoming cycle, which motivates the pursuit of further performance improvement in this work.
Nevertheless, until now, limited research works have been done focused on the combination between the sCO2 Brayton cycle and OFC in the context of hybrid solar-geothermal power generation. In this work, a novel hybrid power generation system powered by solar and geothermal energies is proposed. The hybrid power generation system is composed of the recompression sCO2 Brayton cycle and OFC. The thermodynamic analysis is conducted to showcase the advantages of the proposed system scheme. The parametric study of the combined sCO2-OFC system is used to illustrate the effects of important design parameters on thermodynamic performance. The comparative study between different structures and working fluids showcases the advantages of the proposed scheme. The approach assists the design of similar energy cascaded utilization systems, and the obtained results help better design the combined system using sCO2 and organic fluid.
2 System Description
The schematic diagram of the hybrid power generation system is shown in Figure 1, which is a topping recompression sCO2 Brayton cycle and a bottoming OFC. The topping cycle contains two recuperators (named LTR and HTR), two heaters (named Heater-Ⅰ and Preheater), a cooler (named Precooler), two compressors (named MC and RC), and a turbine (named Turbine-Ⅰ). The bottoming cycle is composed of a heater (named Heater-Ⅱ), two valves, a condenser, a flasher, a mixer, a pump, and a turbine (named Turbine-Ⅱ). The partial heat released from the sCO2 Brayton cycle heats the organic fluid in OFC, and then another geothermal stream continues to heat the fluid. The OFC works here to not only utilize the geothermal energy but also strengthen the regenerative effect of the sCO2 Brayton cycle.
FIGURE 1

Scheme diagram of the combined sCO2 Brayton cycle with OFC system for hybrid solar-geothermal power generation and the related T-s diagrams.
In the topping sCO2 Brayton cycle, the cooled CO2 stream (at state point 1) is pressurized by the MC (process 1–2). After that, the high-pressure CO2 stream (at state point 2) flows through the LTR heated by another CO2 stream (at state point 7) (process 2–3a) and then mixes with CO2 stream 3b (process 3a, 3b–3). The merged CO2 stream (at state point 3) flows through the HTR to be heated by the expanded CO2 stream (at state point 6) exhausted from the Turbine-Ⅰ and stream four absorbs the solar heat in the Heater-Ⅰ (process 4–5). The CO2 (at state point 5) exiting the Heater-Ⅰ expands to a low-pressure stream six and generates power in the Turbine-Ⅰ (process 5–6). The expanded CO2 stream (at state point 6) continuously flows through the HTR and LTR in turn to heat the high-pressure CO2 fluid (process 6–7–8). The CO2 stream (at state point 8) process is split into the main CO2 stream (at state point 8a) and the bypass CO2 stream (at state point 8b). The mainstream (at state point 8a) flows through Preheater to drive the bottoming cycle (process 8a–9) and then is cooled by cooling water (process 9–1). Another bypass stream (at state point 8b) is compressed by RC (process 8b–3b) and then merged with CO2 stream 3a.
In the bottoming OFC, the organic fluid (at state point 01) at the Condenser outlet is pressurized by the Pump (process 01–02). The high-pressure organic fluid (at state point 02) flows through the Heater-Ⅱ being heated by the hot CO2 stream (process 02–03). Then, the heated organic fluid (at state point 03) is heated again by the geothermal water to a saturated liquid state (process 03–04). After that, the liquid expands in the valve (process 04–05) to be a two-phase fluid (at state point 05). The fluid is separated into saturated vapor (at state point 06) and saturated liquid (at state point 08) in the flash separator. Then, the vapor (at state point 06) enters the Turbine-Ⅱ to drive the generator. The liquid (at state point 08) leaving the separator is combined with the expanded flow from Turbine-Ⅱ (state 06) in the mixer after being decompressed by another valve. Finally, the mixed fluid (at state point 010) flows through the condenser being cooled by the cooling water (process 010–01) before being pressurized by the pump again.
The following reasonable assumptions are made to simplify the simulation:
1) The whole system runs under steady-state;
2) The heat transfer losses and pressure drops in the heat exchanger and pipe are ignored;
3) The fluids in the flash separator and mixer are diabatic and isobaric states, and the throttling valve is isenthalpic equipment.
4) Organic fluid at condenser and heater outlets is a saturated liquid state.
5) The cooling water at cooler and condenser inlets is under ambient conditions.
3 System Modeling
The combined system is modeled by the MATLAB simulation program, including the conservations of mass, energy, and exergy equations for each equipment. The thermophysical properties of all the fluids are obtained from the NIST REFPROP database (Lemmon et al., 2010).
3.1 Solar Tower Subsystem
A typical tower solar power subsystem includes a heliostat field, a central receiver, and molten salt circulation. The heliostat field is used to collect energy from the sun. The energy (Qsun) and exergy (Esun) are defined aswhere DNI is the direct normal irradiance, Ah is the heliostat field area; T0 is the environment temperature; Tsun is the Sun’s surface temperature.
The role of the central receiver is to receive the energy reflected from the heliostat field. Based on the literature (Padilla et al., 2015; Herrando et al., 2018; Zhang et al., 2022), the energy efficiency of the heliostat field (ηhel) is set as a constant. Thus the energy (Qrec) and exergy (Erec) absorbed by the central receiver can be expressed as
Besides, the thermal efficiency of the central receiver (ηrec) is defined as (Ho and Iverson, 2014; Padilla et al., 2015),where α is absorptance, ε is thermal emittance, σ is Stefan Boltzmann constant, Fview is radiative view factor; fconv is convective heat loss factor; hconv is convective heat transfer coefficient, TR is solar receiver temperature, and C is concentration ratio.
In this paper, the shape type of the central receiver is the cavity receiver, molten salt flows through the receiver to absorb heat and transfer it to carbon dioxide. The mixture of 60 wt% NaNO3 and 40 wt% KNO3 is selected as the molten salt, and its specific heat iswhere Tms denotes the molten salt temperature.
The energy and exergy equations of molten salt are as follows:where mms is the molten salt mass flow rate, and Ta and Tb are the inlet and outlet temperatures of molten salt.
3.2 sCO2 Cycle Subsystem
For the sCO2 cycle subsystem, the exergy balance is defined aswhere h denotes the enthalpy, s is the entropy, m means the mass flow rate, and the subscript “i” and “0” represent the specific and ambient state points, respectively.
In the Heater-Ⅰ, the heat absorbed by CO2 and the corresponding exergy destruction are expressed as the following equations:where mCO2 is the CO2 mass flow rate, and I denotes exergy destruction.
In the Turbine-Ⅰ, the power output and exergy destruction are defined aswhere WT1 is the power output by the Turbine-Ⅰ, and ηT1 is the isentropic efficiency of Turbine-Ⅰ.
In the HTR, the energy and exergy balance equations, as well as the effectiveness equation, are given aswhere ε is the effectiveness efficiency.
In the LTR, the energy and exergy balance equations, as well as the effectiveness equation, arewhere x denotes the CO2 recompressed flow ratio.
In the Preheater, the CO2 stream provides heat for the bottoming OFC.where mOFC is the mass flow rate of organic fluid in the OFC.
In the Precooler, the CO2 is cooled by the cooling water, and the corresponding energy and exergy equations arewhere mcw1 is the mass flow rate of the cooling water 1.
For the MC and RC, the relative equations are shown as followswhere ηcom is the isentropic efficiency of the compressor.
3.3 OFC Subsystem
In the pump, the energy and exergy balance equations are given aswhere ηP means the isentropic efficiency of the pump.
In the Heater-Ⅱ, the heat absorbed by organic fluid and the corresponding exergy destruction are expressed as the following equations:where mgw is the mass flow rate of the geothermal water.
In the flash separator, the energy balance equations are:where qvap is the vapor quality of the organic fluid at the flash separator.
In the Turbine-Ⅱ, the power output and exergy destruction are defined aswhere WT2 is the power output by the Turbine-Ⅱ, and ηT2 is the isentropic efficiency of Turbine-Ⅱ.
In the mixer, the corresponding modeling equations are expressed as
For the valve, the exergy destruction is defined as
In the condenser, the relative equations are expressed aswhere mcw2 is the mass flow rate of the cooling water 2.
3.4 System Performance Index
The net power output of the proposed sCO2-OFC system is calculated below:
The thermal efficiency of the entire system can be defined as
The exergy efficiency of the proposed system can be expressed aswhere Egw is the exergy of the geothermal water, which is defined as
4 Results and Discussions
4.1 Model Validation
In this work, the thermodynamic model of the proposed sCO2-OFC system has been validated to ensure the accuracy of simulation results. The model validation is carried out based on each subsystem, including the sCO2 Brayton cycle and OFC, and the data from the reported literature (S. Mahmoudi et al., 2017; Tang et al., 2021). A comparison between the data reported by S. Mahmoudi et al. (2017) and our present work for the sCO2 Brayton cycle is shown in Table 1. In Table 2, the results reported by Tang et al. (2021) and our model are presented about the subsystem of OFC. Referring to comparison results, it can be seen that there is good agreement between our model and it reported in the literature.
TABLE 1
| Items | Split ratio (m8a/m8) | η th/% | |||||||
|---|---|---|---|---|---|---|---|---|---|
| T 1 (K) | T 5 (K) | P 2(Mpa) | P 2/P1 | Present work | Ref. (S. Mahmoudi et al., 2017) | RDa(%) | Present work | Ref. (S. Mahmoudi et al., 2017) | RD(%) |
| 305.15 | 823.15 | 20 | 2.64 | 0.3338 | 0.334 | −0.06 | 41.18 | 41.18 | 0 |
| 305.15 | 823.15 | 30 | 3.86 | 0.3549 | 0.355 | −0.02 | 43.31 | 43.32 | −0.02 |
| 323.15 | 823.15 | 20 | 2.40 | 0.1845 | 0.184 | 0.27 | 36.71 | 36.71 | 0 |
| 323.15 | 823.15 | 30 | 2.80 | 0.2541 | 0.254 | 0.04 | 38.93 | 38.93 | 0 |
Model validation of sCO2 Brayton cycle adopting the data reported by S. Mahmoudi et al. (2017).
RD means the relative deviation, which is defined as . The xR and xS are the values obtained from references and our simulation, respectively.
TABLE 2
| State points | P (kPa) | T (K) | h (kJ/kg) | ||||||
|---|---|---|---|---|---|---|---|---|---|
| Present work | Ref. (S. Mahmoudi et al., 2017) | RD(%) | Present work | Ref. (S. Mahmoudi et al., 2017) | RD(%) | Present work | Ref. (S. Mahmoudi et al., 2017) | RD(%) | |
| 01 | 249.41 | 250 | −0.24 | 313.15 | 313.15 | 0 | 252.10 | 252.57 | −0.19 |
| 02 | 1545 | 1549 | −0.26 | 313.79 | 313.85 | −0.15 | 253.26 | 253.82 | −0.22 |
| 03 | 1545 | 1549 | −0.26 | 382.51 | 382.51 | 0 | 354.41 | 354.80 | −0.11 |
| 04 | 789 | 789 | 0 | 353.3 | 353.15 | 0.19 | 354.41 | 354.80 | −0.11 |
| 05 | 789 | 789 | 0 | 353.3 | 353.15 | 0.19 | 462.86 | 461.75 | 0.24 |
| 06 | 249.41 | 250 | −0.24 | 322.83 | 324.33 | −2.93 | 443.74 | 444.95 | −0.27 |
| 07 | 789 | 789 | 0 | 353.3 | 353.15 | 0.19 | 308.98 | 309.24 | −0.08 |
| 08 | 249.41 | 250 | −0.24 | 313.15 | 313.15 | 0 | 308.98 | 309.24 | −0.08 |
| 09 | 249.41 | 250 | −0.24 | 313.15 | 313.15 | 0 | 348.62 | 349.78 | −0.33 |
Model validation of OFC adopting the data reported by Tang et al. (2021).
4.2 Base Case Study
Based on the subsystem models, the performance of the proposed sCO2/OFC system driven by solar energy and geothermal energy is explored in this section. The proposed system is set located in Gonghe, Qinghai Province, China, which is full of solar energy and geothermal energy. Moreover, the geothermal energy in Gonghe is the type of hot dry rock (HDR) with a higher temperature and promising application prospect, which is the highest-temperature HDR resource found in China so far (Senqi et al., 2018; Zhang et al., 2020). Thus, the geothermal energy used here is considered an enhanced geothermal system (EGS). Table 3 shows the design conditions of the solar tower and HDR-EGS subsystems. The based operation condition of the power subsystem is listed in Table 4.
TABLE 3
| Subsystem | Parameters | Valve |
|---|---|---|
| Location | - | 36⁰ 6ʹ 8ʹʹ N |
| - | 100⁰ 37ʹ 30ʹʹ E | |
| Ambient temperature (K) | 303.15 | |
| Heliostat field | Heliostat field area | 12,000 m2 |
| Heliostat field efficiency | 75% | |
| Direct normal irradiance (DNI) | 800 W/m2 | |
| Central receiver | Absorptance (α) | 0.95 |
| Thermal emittance (ε) | 0.85 | |
| Radiative view factor (Fview) | 1 | |
| Convective heat loss factor (fconv) | 1 | |
| Convective heat transfer coefficient (hconv) | 10 W/m2 K | |
| Concentration ratio (C) | 960 | |
| Solar receiver temperature difference (ΔTR) | 423.15 K | |
| Molten salt inlet temperature (Ta) | 698.15 K | |
| Molten salt outlet temperature (Tb) | 858.15 K |
Design point parameters of the solar tower subsystem (Delussu, 2012; Soo Too and Benito, 2013; Ho and Iverson, 2014).
TABLE 4
| Subsystem | Parameters | Valve |
|---|---|---|
| EGS | Depth (D) | 3705 |
| Temperature of HDR (THDR) | 509.15 K | |
| Temperature of hot water (Tg1) | 453.15 K | |
| Mass flow rate of hot water (mg) | 50 kg/s | |
| sCO2-OFC power subsystem | Environment pressure | 101.325 kPa |
| sCO2 minimum pressure | 7.4 MPa | |
| sCO2 pressure ration (PR) | 3 | |
| sCO2 compressor inlet temperature | 308.15 K | |
| sCO2 compressor efficiency | 85% | |
| sCO2 turbine efficiency | 90% | |
| Heat exchanger efficiencies of recuperator (εHTR and εLTR) | 0.95 | |
| OFC turbine efficiency | 80% | |
| OFC pump efficiency | 75% | |
| Terminal temperature difference in the preheater (ΔTt, pre) | 10 K |
Design point parameters of the EGS and sCO2-OFC power subsystems (Zhang et al., 2020; Cao et al., 2022; Zhang et al., 2022).
Besides, R245ca is selected as the working fluid for the OFC system (Cao et al., 2022; Tang et al., 2022). Table 5 lists the main performance parameters of R245ca working fluids (Calm and Hourahan, 2011). It can be seen that R245ca owns 0 ozone depletion potential, low global warming potential, and meets the requirements of closed power cycles. In addition, it also has a higher critical temperature which is closed to the EGS temperature.
TABLE 5
| Working fluid | Molecular mass (g/mol) | T c (K) | P c (MPa) | ODP | GWP/100years | Safety level |
|---|---|---|---|---|---|---|
| R245ca | 134.05 | 447.55 | 3.93 | 0 | 726 | A2 |
Main performance parameters of R245ca.
This section presents the energy and exergy analysis of the proposed system under the base case. Table 6 lists the thermodynamic performance of the total system, while Table 7 shows the results of the sCO2-OFC power subsystem.
TABLE 6
| Subsystems | Energy input (kW) | Energy output (kW) | Energy efficiency (%) | Energy loss ratiob (%) | Exergy input (kW) | Exergy output (kW) | Exergy efficiency (%) | Exergy loss ratioc (%) |
|---|---|---|---|---|---|---|---|---|
| Heliostat field | 9600.00 | 7200.00 | 75 | 26.38 | 8446.10 | 6817.47 | 80.72 | 26.40 |
| Central receiver | 7200.00 | 6225.89 | 86.47 | 10.71 | 6817.47 | 3751.71 | 55.03 | 49.69 |
| Power cycle | 8800.00 | 3076.90 | 34.96 | 62.91 | 4551.90 | 3076.90 | 67.60 | 23.91 |
| Total system | 12,174.2a | 3076.90 | 25.27 | - | 9246.29a | 3076.90 | 33.28 | - |
System baseline simulation results.
For the total system, there is an extra energy input from EGS (2574.2 kW).
Energy loss ratio = Energy loss/Total energy loss ×100%.
Exergy loss ratio = Exergy loss/Total exergy loss ×100%.
TABLE 7
| Items | Valve |
|---|---|
| sCO2 turbine power output (Wt, CO2) | 4313.58 kW |
| sCO2 main compressor power consumption (Wmc) | 852.22 kW |
| sCO2 recompressor power consumption (Wrc) | 821.90 kW |
| sCO2 net power output (Wnet, CO2) | 2639.45 kW |
| OFC turbine power output (Wt, OFC) | 510.96 kW |
| OFC pump power consumption (Wp) | 73.52 kW |
| OFC net power output (Wnet,OFC) | 437.44 kW |
| Power subsystem net power output (Wnet, power) | 3076.90 kW |
| Power subsystem thermal efficiency (ηth, power) | 34.96% |
| Power subsystem exergy efficiency (ηex, power) | 67.60% |
System baseline simulation result of the sCO2-OFC system.
As shown in Table 6, under the base condition, the heliostat field can deliver 7200 kW of thermal energy to the central receiver, with all energy input from the sun (9600 kW). It should be noted that the energy input from the EGS system is 2574.2 kW. From the results, it is interesting that the power cycle subsystem has the largest energy loss, accounting for 62.91% of total exergy losses, while it also has the least exergy losses, accounting for only 23.91%. On the contrary, although the central receiver accounts for the least energy loss ratio of 10.71%, its exergy loss is highest among other subsystems, with a proportion of 49.69%. The reason caused this phenomenon is the working process of the central receiver: the very high-temperature sunlight (∼5300 K) is concentrated by the receivers to improve the receiver surface temperature, causing a high-temperature difference. Meanwhile. there still occurs a high-temperature difference in the energy absorption process between the receiver and molten salts. Therefore, the energy loss in the central receiver has high quality with a big temperature difference and huge heat energy. Referring to Table 7, with the total energy input (Qgeo + Qms) of 12,174.2 kW, the power subsystem can produce a net power output of 3076.90 kW, which is the sum of sCO2 net power output (2639.45 kW) and OFC net power output (437.44 kW). The OFC net power output only accounts for 14.2% of total system output. Moreover, the thermal and exergy efficiencies of the power subsystem are 34.96 and 67.60%, respectively, while the corresponding valves of the total system are 25.27 and 33.28%, respectively.
In addition, since the relatively high energy and exergy losses of the power cycle subsystem, the exergy loss ratio of each power cycle subsystem’s component is presented in Figure 2. As shown in Figure 2, Turbine-I has the largest exergy losses of 14.59% due to the large mass flow rate of fluids during the expansion process, followed by 11.13% in the HTR and 9.65% in the LTR. In addition, the exergy loss in two heaters (Heater-I and Heater-II) reach 8.64% and 9.60%, respectively, which is mainly caused by the large temperature difference at the heat exchanger inlet and outlet. The large exergy loss in the above components indicates that people should pay more attention to those to improve the system performance. In addition, it is noted that the component of the sCO2 cycle has more exergy losses than the OFC cycle.
FIGURE 2

Exergy loss ratio of different equipment in the hybrid power generation system.
4.3 Parameter Effect on System Thermodynamic Performance
In this section, it should be noted that the proposed system consists of the solar tower, sCO2, and OFC subsystems. Hence, the parameters of each subsystem should be considered. The direct normal irradiation (DNI) and the concentration ratio (C) are selected as the key parameters because they directly affect the performance of the heliostat field and central receiver subsystems. Meanwhile, for the power subsystem, both the state points of the sCO2 cycle and OFC cycle should be considered. Thus, the pressure ratio of the sCO2 cycle (PR), the pinch point in the preheater (ΔTpre), and the flash temperature (T04) are selected. The former parameter affects the performance of the sCO2 cycle, while the latter two affect the OFC cycle. The other parameters keep unchanged when one parameter is discussed.
4.3.1 Effect of Direct Radiation Intensity (DNI)
The effects of Direct Radiation Intensity (DNI) are presented in Figure 3. As shown in Figure 3A, the central receiver efficiency (ηrec) increases with the increment of DNI. This is because a large DNI also means an increasing energy input from the sun (Qsun). In detail, Qsun rises from 7200 kW to 12,000 kW and ηrec rises from 83.63% to 88.18% when DNI ranging 600–1000 W/m2. Thus, there is also an increment in the net power outputs of sCO2 and OFC cycles, as shown in Figure 3B. The reason for this trend is that a higher Qsun increases the mass flow rate of CO2 working fluid, then resulting in a higher net power output of the sCO2 cycle. Meanwhile, the mass flow rate of the OFC cycle also increases with the increasing msCO2, so the net power output of the OFC cycle increases as well. As a result, it can be seen in Figure 3C that both the total system thermal and exergy efficiencies grow up with a liner increment, under the positive effect of the large increment of net power output.
FIGURE 3

Effects of the direct radiation intensity. (A) Central receiver efficiency, (B) net power outputs and (C) total system efficiencies.
4.3.2 Effect of Concentration Ratio (C)
Figure 4 shows the effects of concentration ratio (C) on system performance. Similar to DNI, the concentration ratio also has a positive effect on ηrec. When C ranges from 800 to 1200, ηrec rises from 84.76% to 88.18%, as shown in Figure 4A. Then the energy input of the sCO2 cycle increases as well, causing the increment of msCO2. Meanwhile, the state point of the sCO2 cycle has not been changed. As a result, the net power output of the sCO2 cycle increases as shown in Figure 4B. Meanwhile, the mass flow rate of the OFC cycle also increases with the increasing msCO2, so the net power output of the OFC cycle increases as well. With the increment of total system output, it can be seen from Figure 4C that system thermal efficiency grows up from 24.88% to 25.67%, and system exergy efficiency grows up from 32.67% to 33.88%.
FIGURE 4

Effects of the concentration ratio (C). (A) Central receiver efficiency, (B) net power outputs and (C) total system efficiencies.
4.3.3 Effect of sCO2 Pressure Ratio (PR)
Figure 5 illustrates the influence of the sCO2 pressure ratio (PR). As shown in Figure 5A, when PR changes from 2.6 to ∼ 3.15, Wnet, sCO2 increases but turns to decrease when PR is beyond 3.15. This is because, for the sCO2 cycle, a large PR means a high turbine inlet pressure, so the consumption power of the two compressors will increase. Meanwhile, the turbine output also increases under a higher PR. Thus, there is an optimal PR valve for the net power output of the sCO2 cycle. In Figure 5B, it can be seen that the OFC net power output decreases within the range of PR. The reason for this phenomenon is that: a higher PR makes the outlet temperature of LTR (T8) increase, then increases the OFC working fluid temperature at the preheater outlet. Meanwhile, the mass flow rate of working fluids in the sCO2 cycle and OFC cycle reduce. Thus, OFC net power output shows a declining trend (from 581.05 to 445.40 kW). The decline of OFC net power output offset the increment of sCO2 net power output, so net power output decreased.
FIGURE 5
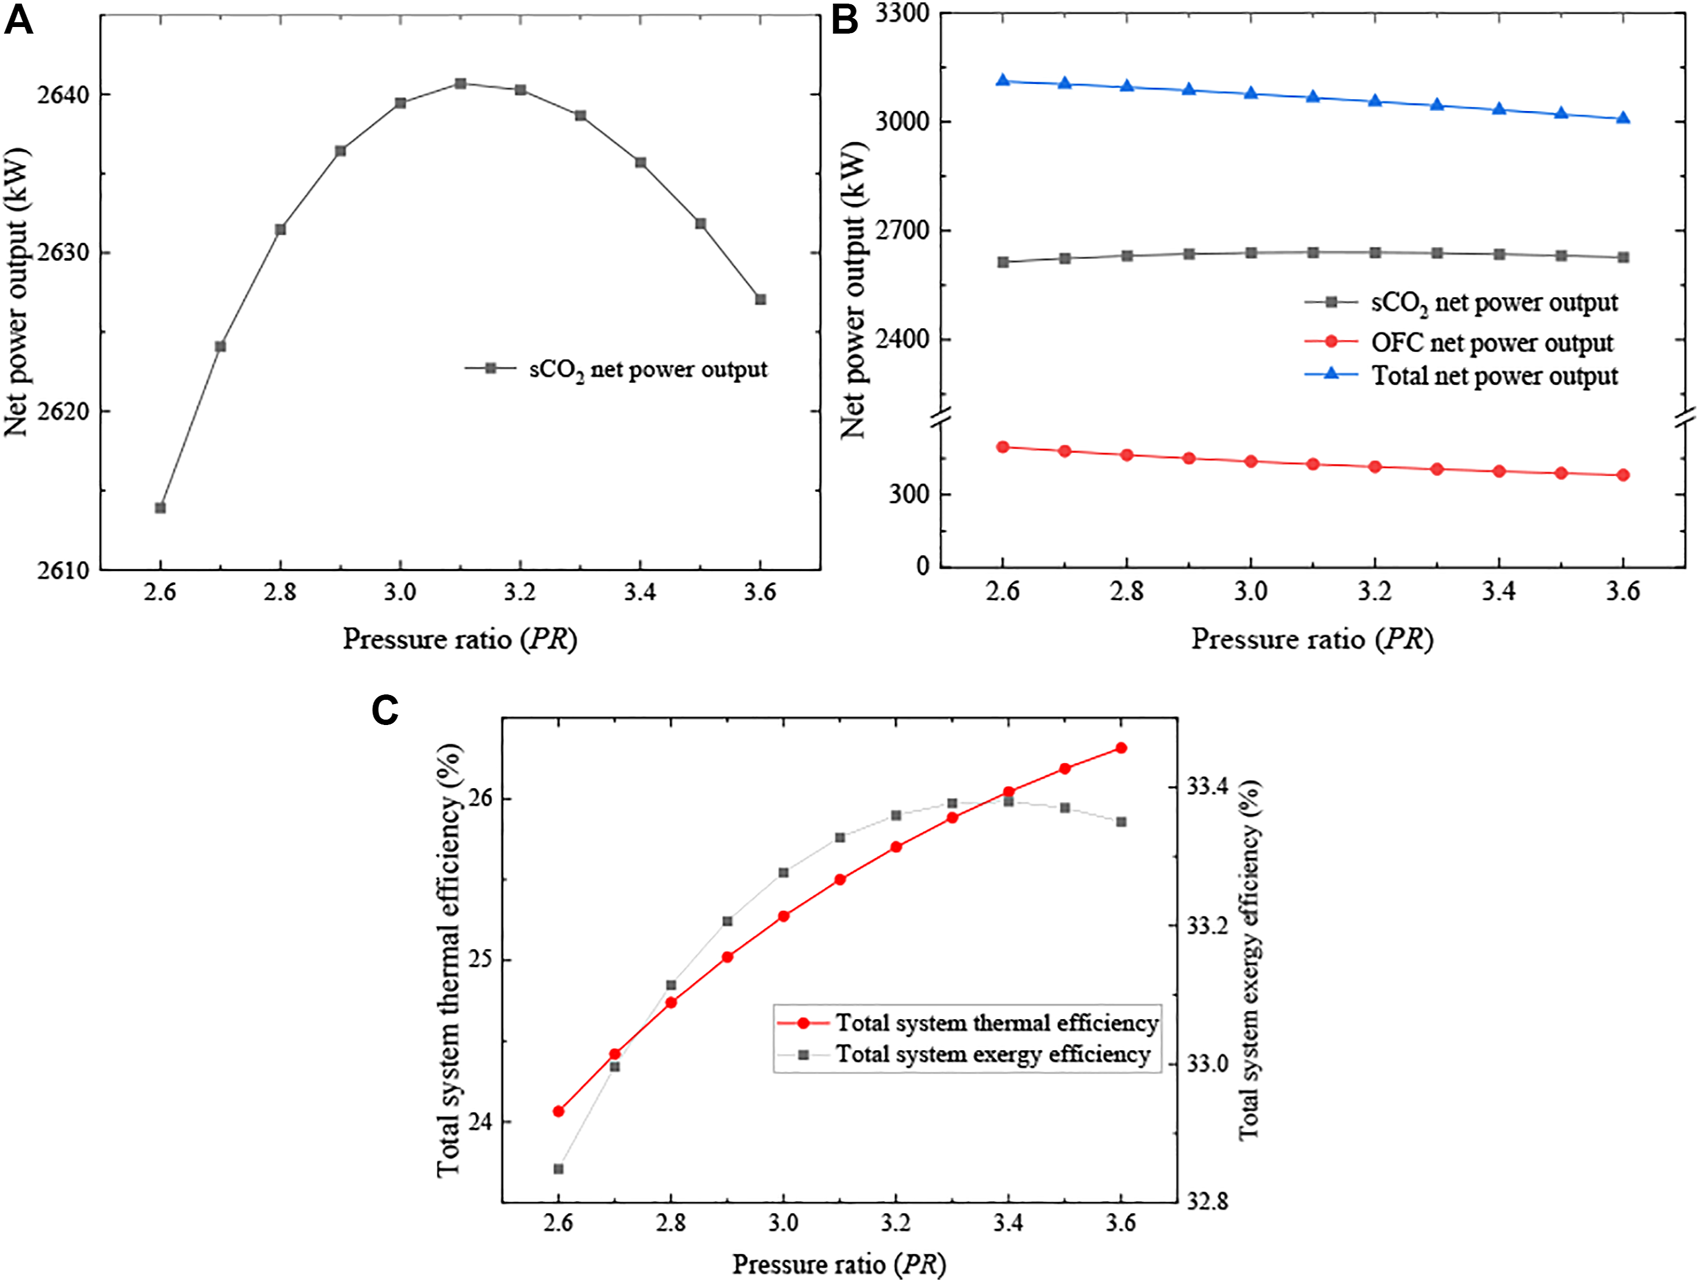
Effects of the pressure ratio (PR). (A) sCO2 cycle net power outputs, (B) net power outputs and (C) total system efficiencies.
In addition, the energy input for the geothermal energy reduces as well, from 3328.59 to 1832.19 kW (shown in Figure 6). In other words, the total energy is declining fast with the change in PR. As shown in Figure 5C, under the combined effect of net power output and energy input, the increment of system efficiencies becomes smaller. In particular, the exergy efficiency reaches the maximum value of about 33.38% with a PR of 3.3.
FIGURE 6

Variations of the geothermal energy inputs with the PR.
4.3.4 Effect of Preheater Terminal Temperature Difference (ΔTt, Pre)
Figure 7 shows the influence of preheater terminal temperature difference (ΔTt, pre). As shown in Figure 7A, since the sCO2 net power output keeps constant, the total net power output decreases with a decreasing OFC net power output. This is because, for the OFC cycle, a large ΔTt, pre means the heat transfer in the preheater (i.e., the energy input from the sCO2 cycle to the OFC cycle) gets worse. In other words, the mass flow rate of OFC working fluid reduces as well, resulting in a reduction in the OFC net power output (from 450.63 to 427.55 kW). As a result, as shown in Figure 7B, system energy and exergy efficiencies decrease in a similar decline in net power output, from 25.58% to 24.98% and 33.52%–33.06% respectively.
FIGURE 7

Effects of the preheater terminal temperature difference (ΔTt, pre). (A) System net power outputs and (B) total system efficiencies.
4.3.5 Effect of Flash Temperature (T05)
Figure 8 illustrates the influence of flash temperature (T05) on the system performance. Like ΔTt, pre, the change of T05 affects the OFC performance first and then changes the total system performance. In the OFC cycle, T05 not only determines the turbine inlet temperature (T06 = T05) but also the saturated pressure of the organic working fluid (i.e., the turbine inlet pressure). Namely, the inlet temperature and pressure of the turbine increase when T05 arises. On the one hand, a higher turbine inlet pressure contributes to the increasing enthalpy drop of the turbine. On the other hand, the vapor exiting the flasher also drops with an increasing T05, which means the working fluid flowing into the turbine is reduced. There exists a game relationship between the increasing enthalpy drop and decreasing the mass flow of vapor. At first, the positive effect brought by the increasing enthalpy drop can offset the negative effect brought by the decreasing mass flow of vapor, the net power output of OFC increases at a lower T05 (below 393.15 K). When T05 is beyond 393.15 K, the negative effect dominates the trends of OFC net power output and causes the decline of Wnet, OFC. Therefore, as shown in Figure 8A, there is an optimal T04 that can reach maximum OFC net power output as well as that of the total system. In Figure 8B, since the input energy of the total system remains constant, the system efficiencies show similar variation trends when the flash temperature changes.
FIGURE 8

Effects of the flash temperature (T05). (A) System net power outputs and (B) total system efficiencies.
4.4 Comparative Study and Parameter Optimization
In this section, a comparative study is conducted to reveal the difference between different system structures and fluids in the OFC subsystems. After that, the system design parameters are optimized based on the maximum energy efficiency.
4.4.1 Comparison With Different System Layouts
The regenerative sCO2 Brayton cycle integrated with a bottoming OFC is another normally used way to convert renewable energies into power, as shown in Figure 9. To compare the system performance between different structures comprehensively, two commonly used system structures are employed.
FIGURE 9

A regenerative sCO2 Brayton cycle integrated with a bottoming OFC.
The system performance comparison between the two different layouts is listed in Table 8. It can be seen that the recompression type has higher power output generated by the sCO2 cycle, but lower power produced from OFC than the regenerative type. This is because in the recompression type system the top cycle utilizes more energy, while in the regenerative type system more heat is used by the bottom OFC. As for the other parameters, since the recompression type system generates more power, both the energy efficiency and exergy efficiency of the recompression type system are higher than another system.
TABLE 8
| Items | Regenerative sCO2—OFC cycle | Recompression sCO2—OFC cycle |
|---|---|---|
| W t, CO2 (kW) | 3404.54 | 4313.58 |
| W mc (kW) | 948.61 | 852.22 |
| W rc (kW) | - | 821.90 |
| W net, CO2 (kW) | 2455.93 | 2639.45 |
| W t, OFC (kW) | 567.27 | 510.96 |
| W p (kW) | 81.62 | 73.52 |
| W net,OFC (kW) | 485.65 | 437.44 |
| W net, power (kW) | 2941.58 | 3076.90 |
| m OFC (kg/s) | 23.87 | 21.44 |
| Q geo (kW) | 2828.64 | 2574.15 |
| η th, power (%) | 31.63 | 34.96 |
| η ex, power (%) | 61.59 | 67.60 |
| η th, tot (%) | 23.67 | 25.27 |
| η ex, tot (%) | 31.55 | 33.28 |
System performance comparison with two different layouts.
4.4.2 System Parameter Optimization and Comparison Between Different Fluids
The discussions of Section 4.4.1 show the superiority of the combined recompression sCO2—OFC cycle on the hybrid solar-geothermal energy utilization. Meanwhile, the parametric analysis shows that sometimes, there is an opposite variation trend between the combined cycle efficiency and combined cycle net power, which indicates that this variation is related to the utilization of geothermal energy. The increment of net power is on the premise of a significant increase in geothermal energy consumption. Moreover, the parametric analysis also shows the combined system has an optimal value of PR and T05 to achieve maximum energy efficiency.
Hence, this section aims to conduct a performance optimization to find these optimal variables and improve the power generation capacity of the system on the premise of ensuring efficiency. To perform the optimization, the genetic algorithm (GA) is adopted (Gen and Lin, 2007). And the PR and T05 are selected as the decision variables. Table 9 summarizes the details of boundary conditions and settings for optimization. Moreover, R245ca along with three other working fluids, R123, MM, and R601a is considered to be used in the proposed system.
TABLE 9
| Items | Valve |
|---|---|
| Population size | 50 |
| Generation size | 400 |
| Crossover fraction | 0.8 |
| Migration fraction | 0.2 |
| Stopping criteria | Tolerance <10−4 |
| PR | 2.6–3.6 |
| T 5 (°C) | 80–160 |
Boundary conditions and settings for optimization.
The system optimization results with four working fluids are listed in Table 10. Referring to Table 10, the proposed system obtains the total net power outputs of about 2977.03–3035.01 kW and the exergy efficiencies of about 32.96–33.38%. Among the four working fluids, the proposed system with R245ca presents the highest net power output at about 3035.01 kW, followed by R601a, MM, and R123. Due to the higher net power, R245ca also owns the highest exergy efficiency of other fluids. Similarly, the exergy efficiency of the combined system has the same sort of order for the OFC with these four fluids. Moreover, it also can be found that a larger net power of OFC corresponds to a larger absorption of geothermal energy (Qgeo), indicating that the employment of geothermal energy is beneficial to power production. At last, the optimization results show that the proposed system with different working fluids can achieve better efficiency under almost the same operating pressure.
TABLE 10
| Fluids | OFC with R245ca | OFC with R123 | OFC with MM | OFC with R601a |
|---|---|---|---|---|
| PR | 3.38 | 3.44 | 3.39 | 3.40 |
| T5 (°C) | 121.49 | 116.11 | 109.98 | 116.47 |
| W net, CO2 (kW) | 2636.37 | 2634.47 | 2635.95 | 2635.73 |
| W net,OFC (kW) | 398.64 | 342.56 | 349.57 | 370.12 |
| W net, power (kW) | 3035.01 | 2977.03 | 2985.53 | 3005.84 |
| m OFC (kg/s) | 19.53 | 26.14 | 14.18 | 11.15 |
| Q geo (kW) | 2063.93 | 1869.70 | 1715.53 | 1942.44 |
| η th, tot (%) | 26.03 | 25.96 | 26.02 | 26.01 |
| η ex, tot (%) | 33.38 | 32.96 | 33.23 | 33.20 |
The Optimization results for the proposed system with different working fluids.
5 Conclusion and Future Work
This paper carried out the thermodynamic analysis of a hybrid solar-geothermal sources powered combined system by introducing an organic flash cycle. The system is composed of a topping recompression sCO
2Brayton cycle and a bottom OFC. The sCO
2Brayton cycle is driven by the heat from the solar tower system, and the OFC is driven by a part of the heat from CO
2in the sCO
2Brayton cycle and another part of the heat from the geothermal water. The main conclusions are summarized as follows:
1) The OFC subsystem with R245ca owns the highest exergy efficiency among involved working fluids. The power output generated by the combined sCO2-OFC system is 3035.00 kW, including the net power output produced by the sCO2 cycle of about 2636.37 kW and from the OFC of 398.64 kW. Moreover, the energy efficiency and exergy efficiency of the total system are 26.03% and 33.38%, respectively, since the energy losses exist in the heliostat field and central receivers.
2) Through the parametric study, there observes that the values of DNI and C are larger, and the performance of the hybrid power generation system is better. There is an optimal PR and T05, corresponding to the maximum exergy efficiency of the combined system. The system performance is better when the preheater terminal temperature difference is smaller.
3) The power cycle subsystem has the largest energy loss, while it also has the least exergy losses. On the contrary, the central receiver accounts for the least energy loss ratio, but its exergy loss is highest among other subsystems.
In the future, a more systematic analysis could be considered, like thermos-economic, environmental, and ecological impacts. Besides, the off-design analysis and dynamic analysis can also be employed to offer guidelines for the utilization of renewable energies in future research.
Statements
Data availability statement
The original contributions presented in the study are included in the article/supplementary material, further inquiries can be directed to the corresponding authors.
Author contributions
YQ: Conceptualization, methodology, data analysis, paper writing. ZH: Methodology, data analysis. SR: Methodology, data analysis. ZJ: Conceptualization, supervision of the project, and paper writing and reviewing.
Funding
The work is supported by the National Natural Science Foundation of China (No. 51506013).
Conflict of interest
YQ, ZH, and SR were employed by the company China Petroleum Engineering and Construction Corporation Southwest Company.
The remaining author declares that the research was conducted in the absence of any commercial or financial relationships that could be construed as a potential conflict of interest.
Publisher’s note
All claims expressed in this article are solely those of the authors and do not necessarily represent those of their affiliated organizations, or those of the publisher, the editors and the reviewers. Any product that may be evaluated in this article, or claim that may be made by its manufacturer, is not guaranteed or endorsed by the publisher.
References
1
Al-Hamed K. H. M. Dincer I. (2019). Investigation of a Concentrated Solar-Geothermal Integrated System with a Combined Ejector-Absorption Refrigeration Cycle for a Small Community. Int. J. Refrig.106, 407–426. 10.1016/j.ijrefrig.2019.06.026
2
Alirahmi S. M. Rahmani Dabbagh S. Ahmadi P. Wongwises S. (2020). Multi-objective Design Optimization of a Multi-Generation Energy System Based on Geothermal and Solar Energy. Energy Convers. Manag.205, 112426. 10.1016/j.enconman.2019.112426
3
Ayub M. Mitsos A. Ghasemi H. (2015). Thermo-economic Analysis of a Hybrid Solar-Binary Geothermal Power Plant. Energy87, 326–335. 10.1016/j.energy.2015.04.106
4
Bonyadi N. Johnson E. Baker D. (2018). Technoeconomic and Exergy Analysis of a Solar Geothermal Hybrid Electric Power Plant Using a Novel Combined Cycle. Energy Convers. Manag.156, 542–554. 10.1016/j.enconman.2017.11.052
5
Cai S. Wu C. Li X. Li Q. (2021). Effects of Lubricant on Evaporation and Boiling Processes of R1234Ze(E): A Molecular Dynamics Study. Appl. Therm. Eng.193. 10.1016/j.applthermaleng.2021.117009
6
Calm J. M. Hourahan G. C. “Physical, Safety, and Environmental Data for Current and Alternative Refrigerants,” in Proceedings of 23rd international congress of refrigeration (ICR2011) (Prague, Czech Republic2011, 21–26.
7
Cao Y. Li P. Qiao Z. Ren S. Si F. (2022). A Concept of a Supercritical CO2 Brayton and Organic Rankine Combined Cycle for Solar Energy Utilization with Typical Geothermal as Auxiliary Heat Source: Thermodynamic Analysis and Optimization. Energy Rep.8, 322–333. 10.1016/j.egyr.2021.11.258
8
Delussu G. (2012). A Qualitative Thermo-Fluid-Dynamic Analysis of a CO2 Solar Pipe Receiver. Sol. Energy86, 926–934. 10.1016/j.solener.2011.12.023
9
Gao L. Cao T. Hwang Y. Radermacher R. (2021). Graph-based Configuration Optimization for S-CO2 Power Generation Systems. Energy Convers. Manag.244. 10.1016/j.enconman.2021.114448
10
Gao L. Cao T. Hwang Y. Radermacher R. (2022). Robustness Analysis in Supercritical CO2 Power Generation System Configuration Optimization. Energy242. 10.1016/j.energy.2021.122956
11
Gen M. Lin L. (2007). Genetic Algorithms. Wiley Encyclopedia of Computer Science and Engineering, 1–15.
12
He C. Liu C. Gao H. Xie H. Li Y. Wu S. et al (2012). The Optimal Evaporation Temperature and Working Fluids for Subcritical Organic Rankine Cycle. Energy38, 136–143. 10.1016/j.energy.2011.12.022
13
Herrando M. Ramos A. Freeman J. Zabalza I. Markides C. N. (2018). Technoeconomic Modelling and Optimisation of Solar Combined Heat and Power Systems Based on Flat-Box PVT Collectors for Domestic Applications. Energy Convers. Manag.175, 67–85. 10.1016/j.enconman.2018.07.045
14
Ho C. K. Iverson B. D. (2014). Review of High-Temperature Central Receiver Designs for Concentrating Solar Power. Renew. Sustain. Energy Rev.29, 835–846. 10.1016/j.rser.2013.08.099
15
Kochunni S. K. Chowdhury K. (2021). Effect of Precooling with Transcritical CO2 Cycle on Two Types of LNG Boil-Off Gas Reliquefaction Systems. J. Nat. Gas Sci. Eng.89. 10.1016/j.jngse.2021.103876
16
Lee H. Y. Park S. H. Kim K. H. (2016). Comparative Analysis of Thermodynamic Performance and Optimization of Organic Flash Cycle (OFC) and Organic Rankine Cycle (ORC). Appl. Therm. Eng.100, 680–690. 10.1016/j.applthermaleng.2016.01.158
17
Lemmon E. W. Huber M. L. Mclinden M. O. (2010). NIST Standard ReferenceDatabase 23: Reference Fluid Thermodynamic and Transport Properties-REFPROP. 9.0. Gaithersburg: NIST NSRDS -.
18
Li K. Liu C. Jiang S. Chen Y. (2020). Review on Hybrid Geothermal and Solar Power Systems. J. Clean. Prod., 250. 10.1016/j.jclepro.2019.119481
19
Liu Y. Wang Y. Huang D. (2019). Supercritical CO2 Brayton Cycle: A State-Of-The-Art Review. Energy189. 10.1016/j.energy.2019.115900
20
Manjunath K. Sharma O. P. Tyagi S. K. Kaushik S. C. (2018). Thermodynamic Analysis of a Supercritical/transcritical CO 2 Based Waste Heat Recovery Cycle for Shipboard Power and Cooling Applications. Energy Convers. Manag.155, 262–275. 10.1016/j.enconman.2017.10.097
21
Mariaud A. Acha S. Ekins-Daukes N. Shah N. Markides C. N. (2017). Integrated Optimisation of Photovoltaic and Battery Storage Systems for UK Commercial Buildings. Appl. Energy199, 466–478. 10.1016/j.apenergy.2017.04.067
22
Mishra R. S. Singh H. (2018). Detailed Parametric Analysis of Solar Driven Supercritical CO2 Based Combined Cycle for Power Generation, Cooling and Heating Effect by Vapor Absorption Refrigeration as a Bottoming Cycle. Therm. Sci. Eng. Prog.8, 397–410. 10.1016/j.tsep.2018.09.013
23
Novales D. Erkoreka A. De la Peña V. Herrazti B. (2019). Sensitivity Analysis of Supercritical CO2 Power Cycle Energy and Exergy Efficiencies Regarding Cycle Component Efficiencies for Concentrating Solar Power. Energy Convers. Manag.182, 430–450. 10.1016/j.enconman.2018.12.016
24
Padilla R. V. Soo Too Y. C. Benito R. Stein W. (2015). Exergetic Analysis of Supercritical CO 2 Brayton Cycles Integrated with Solar Central Receivers. Appl. Energy148, 348–365. 10.1016/j.apenergy.2015.03.090
25
Senqi Z. Weide Y. Dunpeng L. Xiaofeng J. Lisha H. (2018). Characteristics of Geothermal Geology of the Qiabuqia HDR in Gonghe Basin, Qinghai Province. Geol. China45, 1087–1102.
26
S. Mahmoudi S. Salehi S. Yari M. Rosen M. (2017). Exergoeconomic Performance Comparison and Optimization of Single-Stage Absorption Heat Transformers. Energies10, 532. 10.3390/en10040532
27
Song J. Wang Y. Wang K. Wang J. Markides C. N. (2021). Combined Supercritical CO2 (SCO2) Cycle and Organic Rankine Cycle (ORC) System for Hybrid Solar and Geothermal Power Generation: Thermoeconomic Assessment of Various Configurations. Renew. Energy174, 1020–1035. 10.1016/j.renene.2021.04.124
28
Soo Too Y. C. Benito R. (2013). Enhancing Heat Transfer in Air Tubular Absorbers for Concentrated Solar Thermal Applications. Appl. Therm. Eng.50, 1076–1083. 10.1016/j.applthermaleng.2012.06.025
29
Tang J. Zhang Q. Zhang Z. Li Q. Wu C. Wang X. (2022). Development and Performance Assessment of a Novel Combined Power System Integrating a Supercritical Carbon Dioxide Brayton Cycle with an Absorption Heat Transformer. Energy Convers. Manag., 251. 10.1016/j.enconman.2021.114992
30
Tang Z. Wu C. Liu C. Xu X. Liu J. (2021). Thermodynamic Analysis and Comparison of a Novel Dual-Ejector Based Organic Flash Combined Power and Refrigeration Cycle Driven by the Low-Grade Heat Source. Energy Convers. Manag.239. 10.1016/j.enconman.2021.114205
31
Wang K. Li M.-J. Guo J.-Q. Li P. Liu Z.-B. (2018). A Systematic Comparison of Different S-CO2 Brayton Cycle Layouts Based on Multi-Objective Optimization for Applications in Solar Power Tower Plants. Appl. Energy212, 109–121. 10.1016/j.apenergy.2017.12.031
32
Wang M. Zhao P. Wang J. Li H. Dai Y. (2016). Conceptual Design and Parametric Study of Combined Carbon Dioxide/organic Rankine Cycles. Appl. Therm. Eng.103, 759–772. 10.1016/j.applthermaleng.2016.04.046
33
Wang S. Liu C. Li J. Sun Z. Chen X. Wang X. (2020). Exergoeconomic Analysis of a Novel Trigeneration System Containing Supercritical CO2 Brayton Cycle, Organic Rankine Cycle and Absorption Refrigeration Cycle for Gas Turbine Waste Heat Recovery. Energy Convers. Manag.221, 113064. 10.1016/j.enconman.2020.113064
34
Wang S. Liu C. Li Q. Liu L. Huo E. Zhang C. (2020). Selection Principle of Working Fluid for Organic Rankine Cycle Based on Environmental Benefits and Economic Performance. Appl. Therm. Eng.178, 115598. 10.1016/j.applthermaleng.2020.115598
35
Wang S. Liu C. Zhang C. Xu X. Li Q. (2018). Thermo-economic Evaluations of Dual Pressure Organic Rankine Cycle (DPORC) Driven by Geothermal Heat Source. J. Renew. Sustain. Energy10, 063901. 10.1063/1.5034062
36
Wang S. Liu C. Zhang S. Li Q. Huo E. (2022). Multi-objective Optimization and Fluid Selection of Organic Rankine Cycle (ORC) System Based on Economic-Environmental-Sustainable Analysis. Energy Convers. Manag.254, 115238. 10.1016/j.enconman.2022.115238
37
Wang S. Zhang L. Liu C. Liu Z. Lan S. Li Q. et al (2021). Techno-economic-environmental Evaluation of a Combined Cooling Heating and Power System for Gas Turbine Waste Heat Recovery. Energy231, 120956. 10.1016/j.energy.2021.120956
38
Wang X. Li X. Li Q. Liu L. Liu C. (2020). Performance of a Solar Thermal Power Plant with Direct Air-Cooled Supercritical Carbon Dioxide Brayton Cycle under Off-Design Conditions. Appl. Energy261. 10.1016/j.apenergy.2019.114359
39
Wang X. Wang R. Bian X. Cai J. Tian H. Shu G. et al (2021). Review of Dynamic Performance and Control Strategy of Supercritical CO2 Brayton Cycle. Energy AI5. 10.1016/j.egyai.2021.100078
40
Wu C. Wang S.-s. Li J. (2018). Exergoeconomic Analysis and Optimization of a Combined Supercritical Carbon Dioxide Recompression Brayton/organic Flash Cycle for Nuclear Power Plants. Energy Convers. Manag.171, 936–952. 10.1016/j.enconman.2018.06.041
41
Xiao T. Liu C. Wang X. Wang S. Xu X. Li Q. et al (2022). Life Cycle Assessment of the Solar Thermal Power Plant Integrated with Air-Cooled Supercritical CO2 Brayton Cycle. Renew. Energy182, 119–133. 10.1016/j.renene.2021.10.001
42
Yang J. Yang Z. Duan Y. (2020). Off-design Performance of a Supercritical CO2 Brayton Cycle Integrated with a Solar Power Tower System. Energy201. 10.1016/j.energy.2020.117676
43
Zhang X. Zhang T. Xue X. Si Y. Zhang X. Mei S. (2020). A Comparative Thermodynamic Analysis of Kalina and Organic Rankine Cycles for Hot Dry Rock: a Prospect Study in the Gonghe Basin. Front. Energy14, 889–900. 10.1007/s11708-020-0704-1
44
Zhang Y. Du Y. Lu X. Zhao P. Dai Y. (2022). Performance Improvement of a Solar-Powered Recompression Supercritical Carbon Dioxide Cycle by Introducing an Ammonia-Water Cooling-Power System. Front. Energy Res.9. 10.3389/fenrg.2021.801428
Summary
Keywords
hybrid solar-geothermal energy, supercritical carbon dioxide brayton cycle, organic flash cycle, thermodynamic analysis, combined system
Citation
Que Y, Hu Z, Ren S and Jiang Z (2022) Thermodynamic Analysis of a Combined Recompression Supercritical Carbon Dioxide Brayton Cycle With an Organic Flash Cycle for Hybrid Solar-Geothermal Energies Power Generation. Front. Energy Res. 10:924134. doi: 10.3389/fenrg.2022.924134
Received
20 April 2022
Accepted
19 May 2022
Published
03 June 2022
Volume
10 - 2022
Edited by
Wen Su, Central South University, China
Reviewed by
Junjiang Bao, Dalian University of Technology, China
Lei Gao, University of Maryland, United States
Yue Cao, Southeast University, China
Updates
Copyright
© 2022 Que, Hu, Ren and Jiang.
This is an open-access article distributed under the terms of the Creative Commons Attribution License (CC BY). The use, distribution or reproduction in other forums is permitted, provided the original author(s) and the copyright owner(s) are credited and that the original publication in this journal is cited, in accordance with accepted academic practice. No use, distribution or reproduction is permitted which does not comply with these terms.
*Correspondence: Yi Que, queyi_sw@cnpc.com.cn; Zhang Jiang, 20183313@cqu.edu.cn
This article was submitted to Process and Energy Systems Engineering, a section of the journal Frontiers in Energy Research
Disclaimer
All claims expressed in this article are solely those of the authors and do not necessarily represent those of their affiliated organizations, or those of the publisher, the editors and the reviewers. Any product that may be evaluated in this article or claim that may be made by its manufacturer is not guaranteed or endorsed by the publisher.