 Bowen Wang
 Hongbin Sun2
- 1School of Electrical Engineering, Northeast Electric Power University, Jilin, China
- 2School of Computer Technology and Engineering, Changchun Institute of Technology, Changchun, China
- 3State Grid Changchun Power Supply Company Substation Operation and Maintenance Center, Changchun, China
As an important research direction of the energy system, the integrated energy system of a park plays an important role in the field of energy optimization and sustainable economic operation. In this study, a low-carbon optimal operation model of the integrated energy system of an industrial park is proposed, considering a controllable flexible load response. First, the typical structure of the integrated energy system of the park and the model of each subsystem are introduced; then, under the premise that flexible electrical and thermal loads can be used for adjustment of energy utilization, a complete dispatch scheme is constructed according to the energy consumption and system operation characteristics of the integrated energy system. Finally, an optimal scheduling model for the combined supply and demand of the integrated energy system is established with the aim of minimizing the total operating cost. For experimental results, the YALMIP toolbox and the CPLEX solver are used to verify the results of the study; simulation results show that the optimal scheduling of controllable loads can effectively reduce the comprehensive operating cost of a community integrated energy system.
Introduction
Considering the diversity and scale of energy demand in industrial parks, industrial energy conservation has become a main theme of energy conservation. The community integrated energy system (IES) has controllable new energy units; gas units; energy storage devices; and cold, heat, and electricity loads, constituting a variety of heterogeneous energy complementing energy supply and demand systems, which can not only improve energy utilization efficiency but also meet various load needs. Therefore, industrial parks have become the main application object of IES. IES couples electricity, heat, and gas systems to coordinate the conversion of multiple energy sources within an industrial park. At present, research on IES scheduling methods has mainly focused on equipment modeling and energy supply structure. To address the scheduling problem of electric integrated energy systems, Katiraei et al. (2008) proposed an energy hub (EH) model type, which has been widely used in research related to an intermediate for integrated energy systems such as optimizing scheduling and energy consumption. With the continuous development of energy utilization technology, load side management has also received more and more attention, and flexible load scheduling plays an important role in energy consumption. The load in the microgrid can be roughly divided into three categories according to scheduling capacity, namely, important load, adjustable load, and translational load (Hatziargyriou et al., 2007; Stluka et al., 2011). Basic loads must be powered within a specific period of time, such as lighting; adjustable loads refer to loads where users cannot use electricity according to plan and demand variable loads, such as air conditioning and heating; shiftable loads refer to loads whose load power supply time can be changed according to plans, such as washing machines and disinfection cabinets (Alipour et al., 2018). Dolatabadi and Mohammadi-Ivatloo (2017) established an optimal operating model of a multi-energy system consisting of a multi-energy carrier production and transmission system and a connected smart EH, with the aim of minimizing energy supply costs and maximizing user satisfaction, adjusting the energy consumption of end users according to the energy prices published by the system operator and formulating internal operating plans. Chen et al. (2015) established an optimization model of various energy supply modes including cogeneration, wind energy, via an electric boiler, and heat storage, and the introduction of electric boilers and heat storage devices was verified to improve the flexibility of cogeneration and effectively reduce the role of curtailed wind power. Li et al. (2016) indicated that the use of heat storage capacity of the district heating network to coordinate the short-term operation of the power and district heating system effectively promoted the wind power grid and optimal operation of the system. In addition, due to the deepening of the connection between electric load equipment, the heat load response presents peak shaving and valley filling values, as confirmed by the application of user-side load response in the power system. Therefore, it is imperative to explore the dispatchable value of demand-side electricity and heat loads in park IES, and study the collaborative control and scheduling optimization of multiple-load response capabilities on the user-side of the IES, to achieve optimal utilization of various load resources.
The major contributions of this study are as follows: this study establishes a park integrated energy system including wind turbine (WT), photovoltaics (PV), natural gas micro-combustion engine (micro-gas turbine, MT), gas turbine (GT), gas boiler (GB), bromine cooler (lithium bromide refrigerator, LBR), energy storage systems, and loads. Based on existing research, with the dispatchable value of multiple loads in the comprehensive energy system management, an economic operation dispatch model considering the demand response is proposed, and the transmission characteristics of the heat load and the electric load are studied, which shows that the dispatch model considering the electric load response plays an important role in energy consumption in the proposed demand response.
When the controllable load of cold and heat participates in the dispatch of the integrated energy system, considering the economic optimization of the previous dispatch, a target function considering the flexible dispatch of load under the carbon trading mechanism is proposed. In this model, the consumption of new energy is also maximized. The CPLEX solution objective function in the Yamalab toolbox was called. CPLEX is very powerful IBM-developed optimization software, which can also support parallel computing, C, C++, Java, MATLAB, and other software interface programming and can also be used directly with the own IDE for programming; the performance of the official programming language for OPL is better. By comparing the two scenarios, you can intuitively derive the superiority of the model proposed in the article.
The remainder of this article is organized as follows. The second part discusses the equipment model within the park’s integrated energy system. The third part discusses load models, including transferable loads, interruptible loads, and translatable loads, as well as their constraints. The fourth part discusses the objective function of the economic operation of the park and the constraints of the park system. Conclusion and analysis are presented in the last part.
Integrated Energy System Architecture of the Park
The IES structure and energy flow of the park studied in this article are shown in Figure 1, including energy conversion equipment, energy supply side, and three parts of the electric–thermal load demand response. The park’s integrated energy system consists of WT, PV, natural gas micro-combustion engine (MT), GT, GB, bromine cooler (LBR), electrical energy storage (ES), heat storage (HS), cold storage (CS), electrical load, cooling load, and heat load. The electric load of the park comprises WT, PV units, and natural gas internal combustion engines, with excess electricity being stored in batteries, while the thermal load is supplied by the waste heat of the MT, electric heating equipment, GB, and the excess heat is stored.
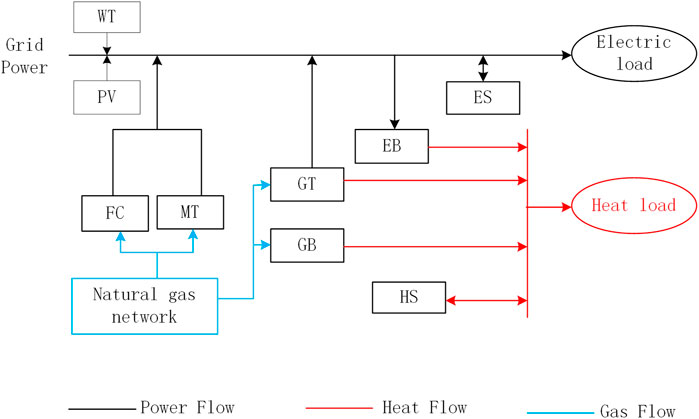
FIGURE 1. IES structure and energy flow.
Fuel Cell
A fuel cell (FC) is a chemical device that directly converts the chemical energy of fuel into electrical energy without other media, and directly converts the chemical energy of fuel and oxidant into electrical energy through electrochemical reactions. The FC can theoretically operate at a thermal efficiency close to 100%, which is highly economical. This study considers that the FC is mainly responsible for electrical energy dispatching in the day-ahead dispatching, and its thermal energy is no longer considered here. The electrical power output of the fuel cell can be expressed as,
where
The amount of natural gas consumed by FCs,
where
Storage Battery
A storage battery is a device that directly converts chemical energy into electrical energy. It is a rechargeable battery designed to be recharged through a reversible chemical reaction. To protect the battery life from being affected by overcharging and discharging, we must constrain the output and state of charge (SOC) of the battery.
where
where
Energy Storage Equipment
The two energy storage devices, HS tank and CS tank, can be represented by a unified energy storage model, in terms of energy conversion. The energy storage equipment will be constrained by the upper and lower limits of the energy storage capacity and charging and discharging power when the system is running. The specific mathematical model (Yang et al., 2021a) is as follows:
where
where
Lithium Bromide Refrigerator
The heat of the heating grid is used to heat the lithium bromide water solution to drive the refrigerator to work. The cooling capacity per unit time can be expressed as:
where
Gas Boilers and Micro-Gas Turbines
The relationship between the heat supply of the GB (Vasilj et al., 2019) and the rated heat supply (Li et al., 2015) is given by:
where
The relationship between the heat generated by the MT and the output electric power (Yang et al., 2021b) is given by:
where
The amount of natural gas consumed by MT can be expressed (Yang et al., 2021b) as:
where
Climbing constraints for MT units are expressed as:
where
Load Model
The controllable load in the comprehensive energy system of the park can be divided into three categories: important load, translational load, and adjustable load according to the energy consumption characteristics. Considering the flexibility of the load, the transfer characteristics of the heating load and the cooling load are not considered here (Chen et al., 2021). Translatable load refers to when the power supply time of the load can flexibly change the load according to the operating state of the IES. The translation of this type of load will not change the total load of the entire scheduling period; hence, it will not affect the total power demand of users.
Expressions for Translatable Loads
The translatable load is more flexible than the shiftable load. For this type of load, the total amount of the transferred load under the condition is unchanged, and the power of each period can be reasonably adjusted according to the charging state characteristics of a private electric vehicle, and its charging power and time can be changed based on the amount of charge it needs.
where
where
Restrictions
The constraints are as follows:
where
Shiftable Load Objective Function of the Integrated Energy System in the Park
The energy-using characteristics of a shiftable load require that it cannot be interrupted during energy use and only allows the load energy consumption period to be panned to another time period as a whole, such as washing machines, water heaters, and ice machines.
Cooling load objective function:
where
where
The electric load objective function is given by:
where
Industrial Park Integrated Energy System Optimal Scheduling Model
In this study, a short-term forecast of the translatable electric heating and the cooling load was carried out, and the output of WTs and PV units was considered to ensure the economy and stability of the operation of the park while meeting the various constraints of the comprehensive energy system of the park. In the scheduling plan, the scheduling cost of the shiftable load, the operating cost of the unit, environmental cost (mainly considering the penalty cost of
The objective function of day-ahead scheduling with a minimum comprehensive running cost in one cycle is given by:
where
The CO2 economic punishment model only highlights companies that exceed the carbon quota standard; thus, low-level carbon emissions are not advocated, which will reduce the enthusiasm for production in the park. The carbon trading mechanism considers carbon emissions as a tradable commodity in the market and uses market means to effectively control carbon emissions, which will promote the use of clean energy. The penalty mode of carbon emissions is mainly manifested via the following two aspects: 1) when the actual carbon emission of the enterprise is less than the carbon quota, excess carbon credits can be sold at real-time transaction prices in the market, which is equivalent to reducing the economic cost of the operation of the IES in the park. 2) When the actual carbon emissions of the enterprise are greater than the carbon quota, enterprises are required to purchase excess carbon credits in the market or pay corresponding over-emission fines, which is equivalent to an increase in the operating cost of the IES system in the park. Thus, the introduction of the carbon trading mechanism has changed the composition of the operating costs of the power system, prompting CO2 sources to incorporate carbon emission costs into their optimization goals, formulate optimization strategies based on allocation quotas and market carbon trading prices, and determine carbon emissions from in-house production in the parks. For the aforementioned model, this article uses the CPLEX solver in the YALMIP toolbox to solve the model in the MATLAB environment (Matlab for 2016b).
Optimization Results Study Analysis
This study considers the IES of a park in northeast China in summer as the research object, and the energy structure diagram of the park is shown in Figure 1. These include units such as fans, PV, GT, batteries, and HS tanks, considering factors such as controllable loads and time-of-use electricity prices. The scheduling period is 24 h, and the time period is scheduled in units of 1 h. The operating parameters of the park are shown in Table 1.
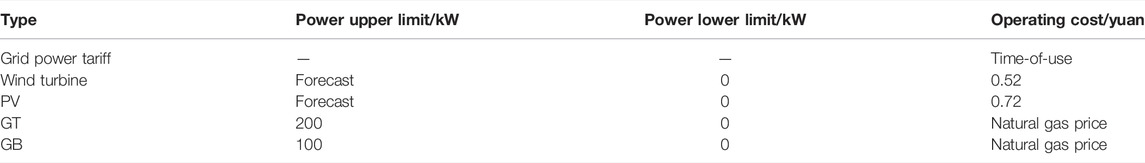
TABLE 1. Park IES operating parameters.
Basic Data
The output of wind power photovoltaic is not so stable and has strong volatility and randomness. The large-scale wind power photovoltaic is gradually connected to the power grid. At the same time, the power grid requires a real-time balance between power generation and consumption. Generally, the power generation plan will be formulated in advance. The formulation of a power generation plan is generally based on the results of load forecasting and new energy forecasting. Therefore, accurately predicting the output of wind power PV in the future is of great significance for power grid supply and demand balance and economic dispatching. This is why the power grid pays more and more attention to this problem.
The typical daily load curve of the park is shown in Figure 2, and the output forecast of WTs and PV units is shown in Figure 3.
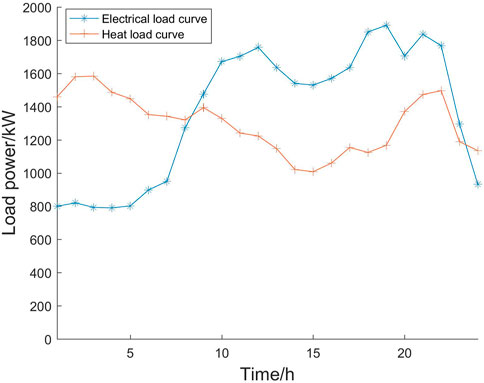
FIGURE 2. Typical user daily load curve.
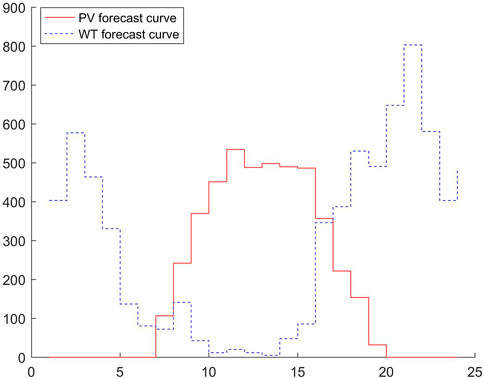
FIGURE 3. New energy forecast.
The energy prices in the optimized scheduling model are time-of-use electricity prices and fixed gas prices. The prices of electricity purchased correspond to the peak, valley, and normal periods, and their price distribution is shown in Figure 4. The valley period ranges from early morning 00:00 to 7:00, the purchase price of electricity is 0.25 yuan, and the price of electricity sold is 0.22 yuan. For the peak hours of 10:00–15:00 and 18:00–21:00, the purchased electricity price was 0.82 yuan and the selling electricity price was 0.65 yuan. For the peak period of 21:00–24:00, the electricity purchase price was 0.53 yuan, the electricity selling price was 0.42 yuan, and the price of natural gas was 0.25 yuan/m3. The proposed energy storage model is a general model under the general energy storage system. Among such general models, the electrical loads on the demand response side mainly include basic loads, translatable electrical loads 1 and 2, transferable electrical loads, and curtailable electrical loads. The thermal loads on the user side mainly include basic thermal loads, translatable thermal loads, and curtailable electrical loads. The heat load of each type of controllable electricity and heat load before optimization are shown in Figure 5.
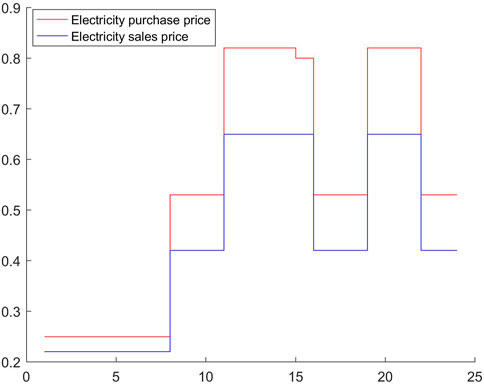
FIGURE 4. Electricity purchase and sale price by time period.
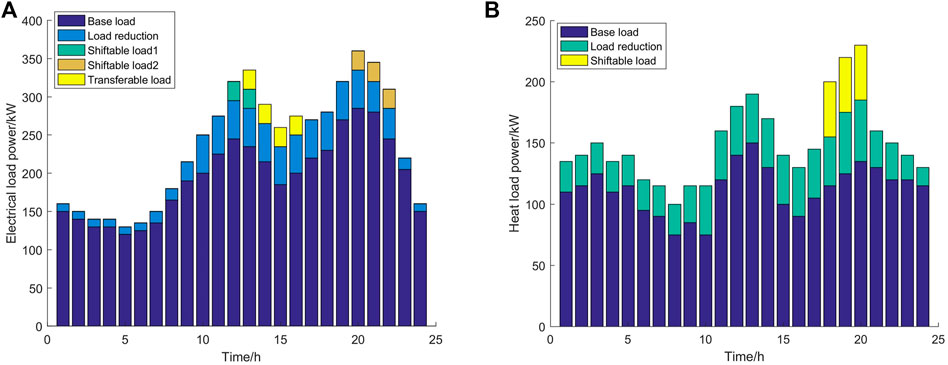
FIGURE 5. User-side electric and heating load distribution before optimization. (A) Electrical load and (B) heat load
Analysis
To verify the impact of flexible loads on comprehensive energy system management, the following two scenarios were set for comparison. Scenario 1: consider the case of flexible electrical loads that can be shifted, transferred, and participate in system optimization scheduling costs and carbon trading costs. Scenario 2: consider the case without flexible loads and carbon trading. These scenarios presented the same conditions with differing load values. Through optimization scheduling analysis using MATLAB, two optimization results were obtained. Figure 5 shows the demand response load curve before and after scenario 1 optimization, Figure 6 presents the output of each energy source, and Figures 6–8 show the flexible load distribution after optimization.
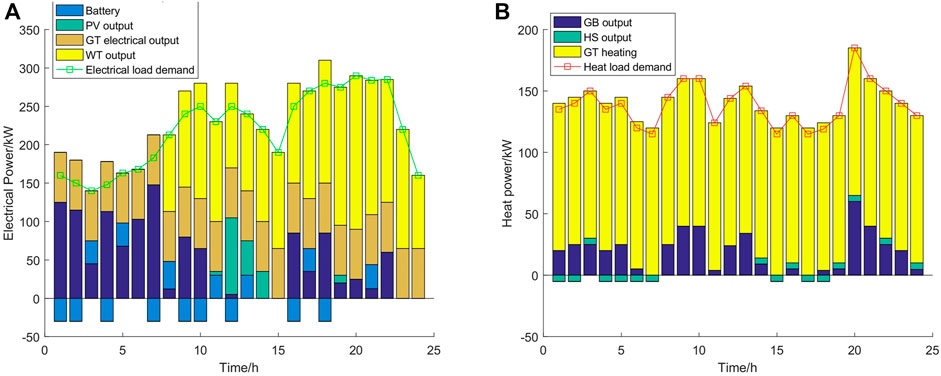
FIGURE 6. Scenario 1: Balance of electrical load and heat load after optimization. (A) Electrical load and (B) heat load.
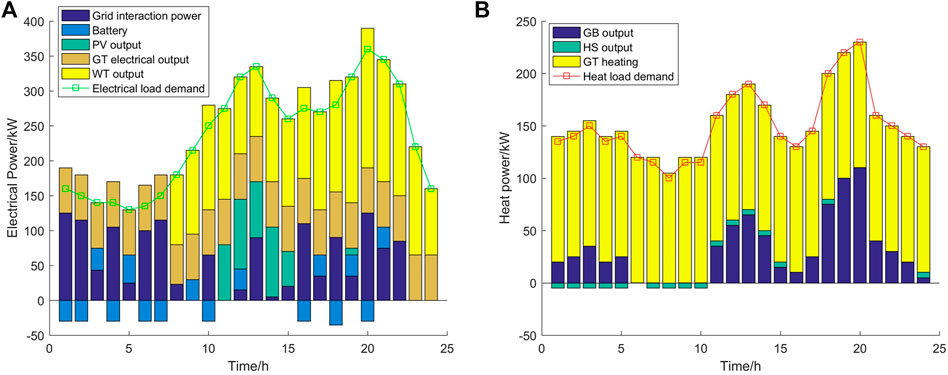
FIGURE 7. Scenario 2: Balance of electrical load and heat load after optimization. (A) Electrical load and (B) heat load.
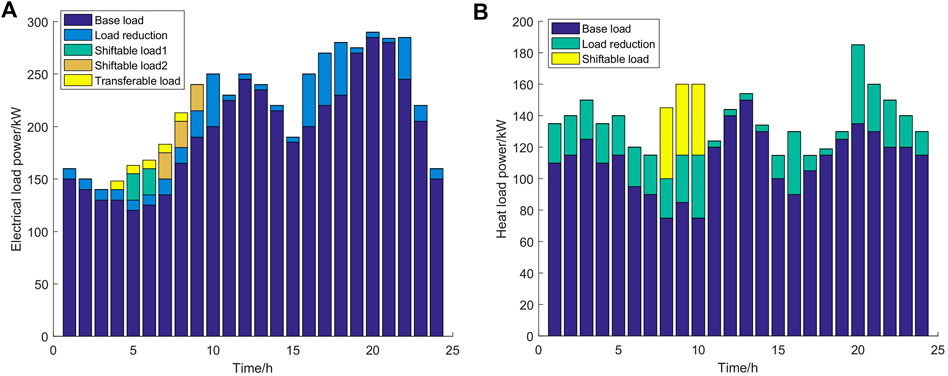
FIGURE 8. Scenario 1: Distribution of electrical load and heat load after optimization. (A) Electrical load and (B) heat load.
In Figure 8, for the electrical load, during the period 00:00–07:00, the electricity price is in the valley, and the required electricity load is also relatively low. At this time, the electricity price is 0.25 yuan/kWh. WT has no output, and the operating cost of the WT was 0.52 yuan/kWh, which is higher than that of the electricity price; hence, the grid was powered, and the WT provided no output before 8:00. The GT was in the mode of determining electricity by heat; hence, there would be excess electricity to charge the battery. During the period 10:00–15:00 and 18:00–21:00, new energy PV was abundant but similar to the cost of buying electricity from the grid. In such cases, the WT could be effectively utilized as the battery was charged during the period of low electricity prices, such as 00:00–04:00, 15:00–18:00, discharged during periods of high electricity prices such as 10:00–15:00, 19:00–21:00.
For the heat load, most of the heat was provided by the heat recovery system, and the GB and the HS tank were used for supplementary combustion. During the period of 00:00–07:00, the output of the GB reduced the heat output and electrical output of the GT; concurrently, the electrical output of the gas turbine decreased, such that the power dispatch should purchase electricity from the point network, with the excess electricity being stored in the battery, reducing the cost of power dispatching during this period. At 10:00–15:00 and 18:00–21:00, the full power of the GT could also compensate for the shortage of electricity. During the periods of 00:00–01:00, 10:00–11:00, 13:00–15:00, and 18:00–19:00, when the heat load was at a low point, HS can store heat through GB. When the heat load reached its peak, the HS tank released heat and demonstrated peak shaving and valley filling.
Comparing Figures 8, 9, for the flexible electrical load, the translatable load 1 translated from 19:00–22:00 to 05:00–08:00, while the translatable load 2 translated from 11:00–13:00 and 15:00–17:00, and the shiftable loads 1 and 2 were shifted from the high electricity price period to the low electricity price period. Load reduction occurred during the periods of 10:00–15:00 and 18:00–21:00, mostly during the peak period of electricity prices. For the flexible thermal load, similar to the electrical load, the shiftable load was shifted from the evening peak period to the normal period, which indicated peak shaving, and load reduction further reduced the thermal load. Considering the economic and environmental benefits in the earlier different scenarios, the models of each scenario were solved, and the scheduling results are shown in Table 2.
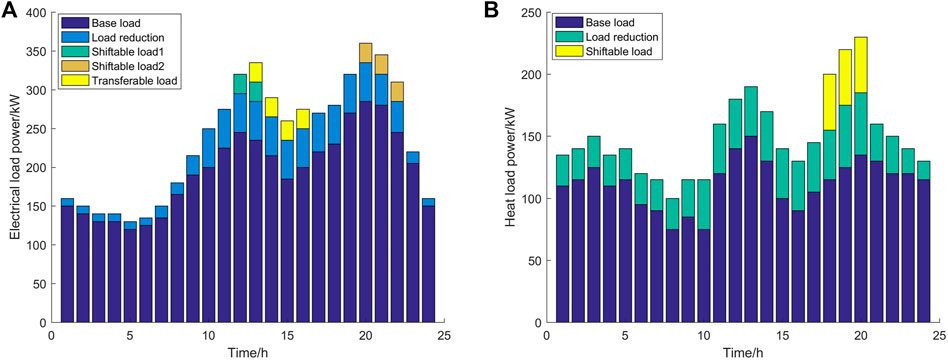
FIGURE 9. Scenario 2: Distribution of electrical load and heat load after optimization. (A) Electrical load and (B) heat load.
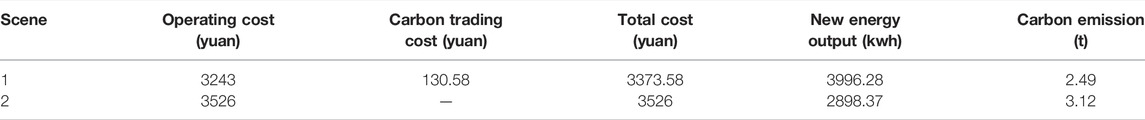
TABLE 2. Scheduling results for different scenarios.
From Table 2, scenario 2 did not consider carbon transaction costs. In Table 2, the carbon emission cost of scenario 2 was significantly higher than that of scenario 1, and its utilization rate of new energy was only 78.2% of that of scenario 1. The running cost of scenario 2 was approximately 9.1% higher than that of scenario 1. Thus, the orderly control of the controllable power load not only improves the environmental benefits but also optimizes the overall benefits of the IES in the park.
To verify the impact of the introduction of flexible loads and carbon trading on the economic dispatch of the IES in the park, scenarios 1 and 2 were analyzed, and the output of each energy source and the response curve of the electric heat load were obtained, respectively.
On comparison of Figures 10 and 11, it could be concluded that in scenario 1, when the flexible load translation reduction was considered, the overall trend showed that the peak period of electricity and heat consumption shifted like a valley period, with no change in scenario 2. Passing Figure 10, we could intuitively conclude that the utilization rate of wind energy and light energy in scenario 1 was higher than that in scenario 2, which is more concentrated in electricity price valleys and normal times. Scenario 1 had a higher utilization rate of clean energy; hence, its electricity purchase cost would be lower than that of scenario 2. The power storage device would shave peaks and fill valleys in different situations. Unlike scenario 2, scenario 1 was favorable for the use of clean energy for energy storage devices.
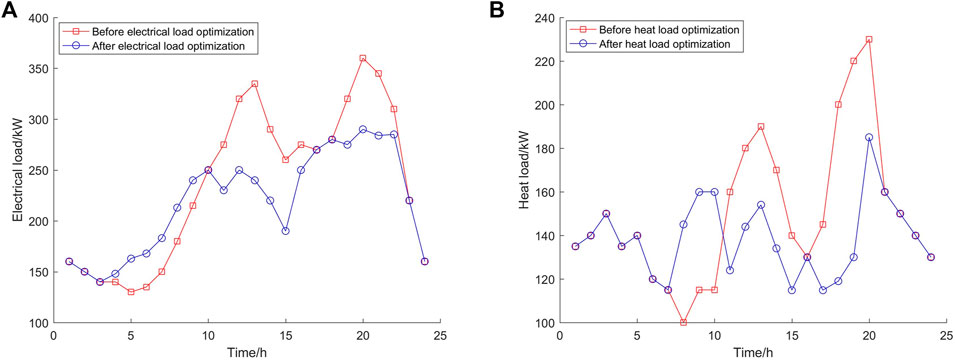
FIGURE 10. Scenario 1: Electric heating load response curve before and after optimal scheduling. (A) Before optimal scheduling and (B) after optimal scheduling.

FIGURE 11. Scenario 2: Electric heating load response curve before and after optimal scheduling. (A) Before optimal scheduling and (B) after optimal scheduling.
Conclusion
This study proposes an industrial park system model that considers the comprehensive demands of multiple loads of electric and thermal. Through analyzing the structure of the integrated energy system, the characteristics of important components, considering the dispatchable value of multiple loads in integrated energy management, based on the demand response ability and adjustable ability of the electricity and heat loads on the user-side, a mathematical model of the electricity load response on the user-side based on price-based demand is established. To provide a mathematical description of heat load with special properties, a day-ahead scheduling model for the park IES that considers the carbon trading system and controllable load is proposed, and both operating costs and carbon trading costs are considered.
The optimization effect of the carbon trading system on the energy structure of the IES in the park is confirmed by the two settings, and the participation of the controllable load can optimize the comprehensive economic and environmental benefits of the system. Furthermore, the demand response of multiple controllable loads of electric heating exceeds that of a single load. Thus, the following advantages can be obtained by our method: more economic demand response, higher utilization rate of wind energy and solar energy, and fewer users’ consumption of energy; based on these advantages, we can extend the suggestion of a carbon trading mechanism into a low-carbon economic strategy which greatly helps for environmental protection and economic operation.
Data Availability Statement
The original contributions presented in the study are included in the article/Supplementary Material; further inquiries can be directed to the corresponding author.
Author Contributions
BW: establishes a microgrid model. HS: optimal scheduling strategy. XS: energy storage system.
Funding
This work was supported in part by the Scientific and Technological Planning Project of Jilin Province (20190302106GX).
Conflict of Interest
Author XS was employed by the State Grid Changchun Power Supply Company.
The remaining authors declare that the research was conducted in the absence of any commercial or financial relationships that could be construed as a potential conflict of interest.
Publisher’s Note
All claims expressed in this article are solely those of the authors and do not necessarily represent those of their affiliated organizations, or those of the publisher, the editors, and the reviewers. Any product that may be evaluated in this article, or claim that may be made by its manufacturer, is not guaranteed or endorsed by the publisher.
Acknowledgments
This is a short text to acknowledge the contributions of specific colleagues, institutions, or agencies that aided the efforts of the authors.
References
Alipour, M., Zare, K., and Abapour, M. (2018). MINLP Probabilistic Scheduling Model for Demand Response Programs Integrated Energy Hubs. IEEE Trans. Ind. Inf. 14, 79–88. doi:10.1109/tii.2017.2730440
Chen, X. Y., Kang, C. Q., O’Malley, M. O., Xia, Q., Bai, J., Liu, C., et al. (2015). Increasing the Flexibility of Combined Heat and Power for Wind Power Integration in China: Modeling and Implications. IEEE Trans. Power Syst. 30, 1848–1857. doi:10.1109/TPWRS.2014.2356723
Chen, Y., Gao, Y., and Zeng, B. (2021). “A Hierarchical Optimal Dispatching Method Considering the Flexibility Margin of Regional Power Grid,” in 2021 IEEE Sustainable Power and Energy Conference (iSPEC), Nanjing, China, 23-25 Dec. 2021, 589–595.
Dolatabadi, A., and Mohammadi-Ivatloo, B. (2017). Stochastic Risk-Constrained Scheduling of Smart Energy Hub in the Presence of Wind Power and Demand Response. Appl. Therm. Eng. 123, 40–49. doi:10.1016/j.applthermaleng.2017.05.069
Hatziargyriou, N., Asano, H., Iravani, R., and Marnay, C. (2007). Microgrids. IEEE Power and Energy Magazine 5, 78-94. doi:10.1109/MPAE.2007.376583
Hinton, G. S., Villaseñor, J. L., and Ortiz, E. (2019). The Hintons’ Legacy to the Knowledge of the Flora of Mexico. Bot. Sci. 97, 447n538. doi:10.17129/botsci.2210
Katiraei, F., Iravani, R., Hatziargyriou, N., and Dimeas, A. (2008). Microgrids Management. IEEE Power Energy Mag. 6, 54–65. doi:10.1109/MPE.2008.918702
Li, Z., Wu, W., Wang, J., Zhang, B., and Zheng, T. (2016). Transmission-Constrained Unit Commitment Considering Combined Electricity and District Heating Networks. IEEE Trans. Sustain. Energy 7, 480–492. doi:10.1109/tste.2015.2500571
Li, Z., Zhang, F., Liang, J., and Yun, Z. (2015). Optimization on Microgrid with Combined Heat and Power System. Proc. CSEE 35, 3569–3576. doi:10.13334/j.0258-8013.pcsee.2015.14.011
Stluka, P., Godbole, D., and Samad, T. (2011). “Energy Management for Buildings and Microgrids,” in Proceedings of the IEEE Conference on Decision and Control (Orlando, FL, USA: IEEE), 5150–5157. doi:10.1109/cdc.2011.6161051
Vasilj, J., Gros, S., Jakus, D., and Zanon, M. (2019). Day-Ahead Scheduling and Real-Time Economic MPC of CHP Unit in Microgrid with Smart Buildings. IEEE Trans. Smart Grid 10, 1992–2001. doi:10.1109/tsg.2017.2785500
Yang, T., Liu, W., Kramer, G. J., and Sun, Q. (2021a). Seasonal Thermal Energy Storage: A Techno-Economic Literature Review. Renew. Sustain. Energy Rev. 139, 110732. doi:10.1016/j.rser.2021.110732
Yang, Z., Ghadamyari, M., Khorramdel, H., Alizadeh, S. M. S., Pirouzi, S., and Milani, M. (2021b). Robust Multi-Objective Optimal Design of Islanded Hybrid System with Renewable and Diesel Sources/Stationary and Mobile Energy Storage Systems. Renew. Sustain. Energy Rev. 148, 111295. doi:10.1016/j.rser.2021.111295
Keywords: integrated energy system, flexible load, carbon trading, optimal dispatch, load adjustability
Citation: Wang B, Sun H and Song X (2022) Optimal Dispatching Modeling of Regional Power–Heat–Gas Interconnection Based on Multi-Type Load Adjustability. Front. Energy Res. 10:931890. doi: 10.3389/fenrg.2022.931890
Received: 29 April 2022; Accepted: 26 May 2022;
Published: 01 July 2022.
Edited by:
Chen Chen, Xi’an Jiaotong University, ChinaReviewed by:
Jian Wang, Southwest Jiaotong University, ChinaBao Liu, China Universtiy of Petroleom, China
Li Wanggen, AHNU, China
Copyright © 2022 Wang, Sun and Song. This is an open-access article distributed under the terms of the Creative Commons Attribution License (CC BY). The use, distribution or reproduction in other forums is permitted, provided the original author(s) and the copyright owner(s) are credited and that the original publication in this journal is cited, in accordance with accepted academic practice. No use, distribution or reproduction is permitted which does not comply with these terms.
*Correspondence: Xiaosong Song, MjUwOTg2MDIyN0BxcS5jb20=