 Riccardo Maria Pulselli1,2*
 Maria Vittoria Struglia3
 Matteo Maccanti4
 Morena Bruno4
 Nicoletta Patrizi4
 Elena Neri2
 Adriana Carillo3
 Ernesto Napolitano3
 Nikolaos Stefanatos5Christoforos Perakis6
 Markos Damasiotis6Federica Di Pietrantonio7Stefano Magaudda8Venturo Madalena8
 Hrvoje Stančin9
 Hrvoje Mikulčić9,10
 Vasilis Petrou11Konstantinos Smagas11Eleni Valari11Louisa Marie Shakou12
 Simone Bastianoni4
- 1Department of Architecture, University of Florence, Florence, Italy
- 2Indaco2 srl, Colle Val d’Elsa (SI), Italy
- 3Climate Modeling Laboratory, Division Model and Technologies for Risk Reduction, Department for Sustainability, ENEA, Rome, Italy
- 4Department of Physical, Earth and Environmental Sciences, University of Siena, Siena, Italy
- 5Division of Renewable Energy Sources, Centre for Renewable Energy Sources and Saving—CRES, Pikermi, Greece
- 6Division of Development Programs, Centre for Renewable Energy Sources and Saving—CRES, Pikermi, Greece
- 7Department of Architecture, University of Roma Tre, Rome, Italy
- 8U-space sl, Sevilla, Spain
- 9Faculty of Mechanical Engineering and Naval Architecture, University of Zagreb, Zagreb, Croatia
- 10MOE Key Laboratory of Thermo-Fluid Science and Engineering, Xi’an Jiaotong University, Xi’an, China
- 11Geoimaging Ltd, Nicosia, Cyprus
- 12Climate Change and Environment Department, Cyprus Energy Agency, Nicosia, Cyprus
Blue Energy (BE) is expected to play a strategic role in the energy transition of Europe, particularly toward the 2050 horizon. It refers to a set of Marine Energy Sources (MES), including offshore wind, waves, tides, marine currents, sea thermal energy, salinity gradients, and marine biomass, which are exploited by different BE technologies. Nevertheless, the implementation of integrated solutions to exploit MES in marine areas does not just concern technological issues; it requires inclusive planning practices considering different aspects regarding climate and environmental impacts, landscape compatibility, interference with other marine activities (such as shipping, fishing, and tourism), and social acceptance. A replicable BE planning framework has been developed based on interdisciplinary knowledge in three Mediterranean sites in Greece, Croatia, and Cyprus, under the scope of the Interreg Med BLUE DEAL project. It has been implemented by some interdisciplinary experts through a collaborative and iterative process of data elaboration, mapping, evaluation, and visualization. Results concern the localization of suitable sites to install BE plants and the estimation of potential energy production and avoided emissions in selected scenarios. Together with visual simulations, this study shows the potential effects of the implementation of BE in specific marine areas, with a special focus on the most promising offshore floating wind farms and wave energy converters (WECs), as basic information for participative design and stakeholder engagement initiatives, including public authorities, businesses, and citizens.
Introduction
The Sixth Assessment Report of the IPCC highlights climate change impacts and risks emphasizing the interdependence of climate and human societies. The recognition of climate risks, especially in the Mediterranean, one of the world’s hotspots in terms of temperature increase, is expected to strengthen mitigation and adaptation actions and accelerate transitions to a more resilient state (IPCC, 2022). In particular, the risks of climate change give rise to a timebound imperative to transform modern energy systems into low-carbon alternatives (Fries, 2021). This will require multiple efforts to implement necessary measures, including high penetration of renewable energy, development of distributed and integrated energy systems, management of inherent intermittency of renewable sources, real-time supply-demand balancing, innovation and testing of alternative low-carbon technologies in initial markets, and selection of the ones best suited to customer needs (Petit, 2018; Helm and Miller, 2021; Zhao et al., 2021).
Especially in Europe, the wide deployment of renewable energy sources is a necessary condition to meet the EU targets of greenhouse-gas emission reduction by at least 55% by 2030 (compared to the 1990 levels) and carbon neutrality by 2050. Among other Marine Energy Sources (MES), offshore wind energy is expected to become the European largest source of electricity generation, with an increase of the offshore wind power in Europe from 12 GW to 60 GW by 2030 and 300 GW by 2050. These targets (COM, 2020) demand for a commitment by the Member States to include MES in their future planning and actions. The EU Commission considers that a diversified approach is required, tailored to the different contexts, in which specific policy solutions are adapted to the different levels of development of available technologies and regional contexts, particularly as different technological solutions suit different sea basins. The Interreg Med BLUE DEAL project (BLUE DEAL, 2022) gives a broader interpretation of the energy transition as a complex process that mainly involves citizens, local communities, and stakeholders, which should be carefully supervised by local public authorities to ensure that the introduction of new technologies harmonizes with already existing economic activities, and that possible conflicts among different productive sectors are managed while complying with environmental legislation and integrated maritime policy (Bastianoni et al., 2020).
The major instrument to do this is to develop early Maritime Spatial Plans (MPSs) that identify suitable areas for the deployment of offshore energy farms (Soukissian et al., 2017). While several European countries in the Northern Seas have already implemented their own ocean planning that includes MES, mainly offshore wind, in the Southern Seas, such a process has been hindered by both technical difficulties and administrative and consent limitations (Pisacane et al., 2018). A recent review (Quero Garcia et al., 2020) compared the MSPs of Southern Countries and analyzed their impact on the Blue Energy (BE) sector: the authors found that Spain, Italy, Greece, and Malta have explicitly considered offshore renewables among their energy policies; nevertheless, a qualitative assessment of the progress of MSP with respect to BE in these countries still shows low and medium levels of development. The influence of national regulatory frameworks concerning MSP on the development of BE has been analyzed by Salvador et al. (2019) with a focus on Portugal. The authors highlight the importance of flexible planning systems, setting criteria for the prioritization of marine uses, incorporating trade-off mechanisms, and regulating pilot zones. These measures can help streamline licensing processes, avoid and resolve conflicts with other sea users, and adapt planning instruments to the rapid development of new BE technologies. Howells and Ramirez-Monsalve (2022) investigated the Danish approach to governing land-sea interactions, exploring the impacts of various institutional and procedural factors on the MSP practice. The authors notice a lack of integration between the maritime and terrestrial planning systems, which are differentiated in terms of institutional responsibility and scale, thus creating conflicts at the coastline. First, they recommend the cooperation of local authorities and experts to improve the governance and build consensus around decisions, especially if carried out at an earlier stage in the planning process. Second, they support the need to move toward marine planning processes at the regional or municipal level rather than purely national. Nevertheless, in this perspective, MSP practices still look immature. Kyvelou (2017) argued that improved governance and capacity building is necessary considering that there are no generalized solutions and that each managed area requires a customized and specialized design approach. Geographically explicit examination of areas susceptible to change and suitable development locations is an essential part of any evidence-based planning and decision-making process. In this regard, González et al. (2020) reviewed available web mapping tools that can contribute to anticipating and avoiding land and marine-use conflicts, comparing planning alternatives, and forecasting the impacts of planning decisions. According to the authors, the value of spatial data exploration is to support analytical planning practices through robust, systematic, and consistent means, assuring transparent and informed decisions.
Considering the increasing demand for multiuse of marine space, at least between uses that show reasonable compatibility, Kyriazi et al. (2016) mentioned several parameters to consider, starting from the involvement of players affected by the decision-making process. In general, to guarantee an efficient, fair, and acceptable spatial coexistence, parties interested in the same area should negotiate the terms of co-use (Grip and Blomqvist, 2021; Moodie and Sielker, 2022). Therefore, maximizing spatial efficiency and minimizing conflicts of use should not be seen as one-off management decisions but as a dynamic integrated MSP process that needs to respond to actual developments in the use of marine space. Stakeholder processes in MSP and their effects are interpreted as crucial actions (Twomey and O’Mahony, 2019; Zaucha and Kreiner, 2021) to encourage ownership of the plan, engendering trust among stakeholders and decision-makers; improve understanding of the complexity (spatial, temporal) and human influences of the marine management area; develop a mutual and shared understanding about the problems and challenges, as well as perceptions and interests that stimulate the integration of policies; examine existing and potential compatibility and/or conflicts of multiple-use objectives; aid the generation of new options and solutions that may not have been considered individually; and expand the capacity of the planning team, in particular by acquiring new information.
Therefore, a set of gaps emerge from the literature on MSP, not yet properly solved. The main improvements and recommendations concern the release of specifically addressed regulatory frameworks; the resolution of conflicts between responsible institutions, especially due to different sectors and spatial scales of competence; the development of regional and local planning practices rather than national; the need for capacity building and informed design practices, particularly taking advantage of available web tools to address choices; and the stakeholders’ engagement to guarantee transparent, fair, and widely shared decision-making, especially regarding the coexistence of marine uses. This is particularly true looking at the growing interest in MES, especially in the offshore wind sector. Due to the different maturity levels of BE technologies, with some of them still at an early stage of technical development, their inclusion in MSP requires the definition of a proper planning methodology, which is able, through scientific and technological skills, to fill knowledge gaps and promote the inclusion of these technologies in future energy plans.
How can MSP strategies consider MES and embed BE technologies to support their deployment? The present study shows a systematic procedure of BE planning to identify suitable sites for different BE plants; determine their possible location and size against environmental, physical, legal, or social constraints; evaluate potential effects in terms of energy production and carbon emission mitigation; and visualize possible configurations in relation to coastal landscapes. The BE planning framework involves multidisciplinary experts and exploits available web tools to address choices as part of MSP in regional and local contexts; it has been demonstrated in three workshops, namely, BLUE DEAL Labs (BLUE DEAL, 2022) in Crete (Greece), Split (Croatia), and Larnaca (Cyprus). The procedure has been conceived as a practical guide to start and support new MSP initiatives, including MES, to hypothesize possible scenarios for further integration of BE plants, discuss limits and opportunities, and foster public–private cooperation for BE deployment in Mediterranean regions by engaging public authorities, businesses, and citizens in participative design processes. Rather than being definitive or exhaustive, results concern reliable scenarios and allow for bringing a set of solutions to the table and leading the discussion toward concrete questions, instead of hypothetical purposes, to attract interest from a wide number of audiences and players and raise awareness of specific themes. Based on the BE planning action, the Labs are intended as kick-off initiatives to start a proactive debate around MES in target regions.
Materials and Methods
The BE planning framework presented here combines interdisciplinary knowledge to integrate BE into strategic and operational plans in compliance with physical, regulatory, environmental, technical, and social constraints that necessarily emerge in the Mediterranean area. The planning procedure is structured into several iterative processes grouped into a sequence of six main stages: Stage 1—identification of BE potentials; Stage 2—identification of suitable BE technologies; Stage 3—identification of potential sites; Stage 4—energy assessment; Stage 5—carbon footprint mitigation assessment; and Stage 6—visual impact assessment (VIA). Table 1 outlines the planning framework and the methodological stages, outputs, and used tools. The final outcome consists of a comprehensive BE plan with possible scenarios of BE deployment and quantitative estimates. The resulting maps and assessments aim to support the narrative and make the process easily understandable to a wide audience.
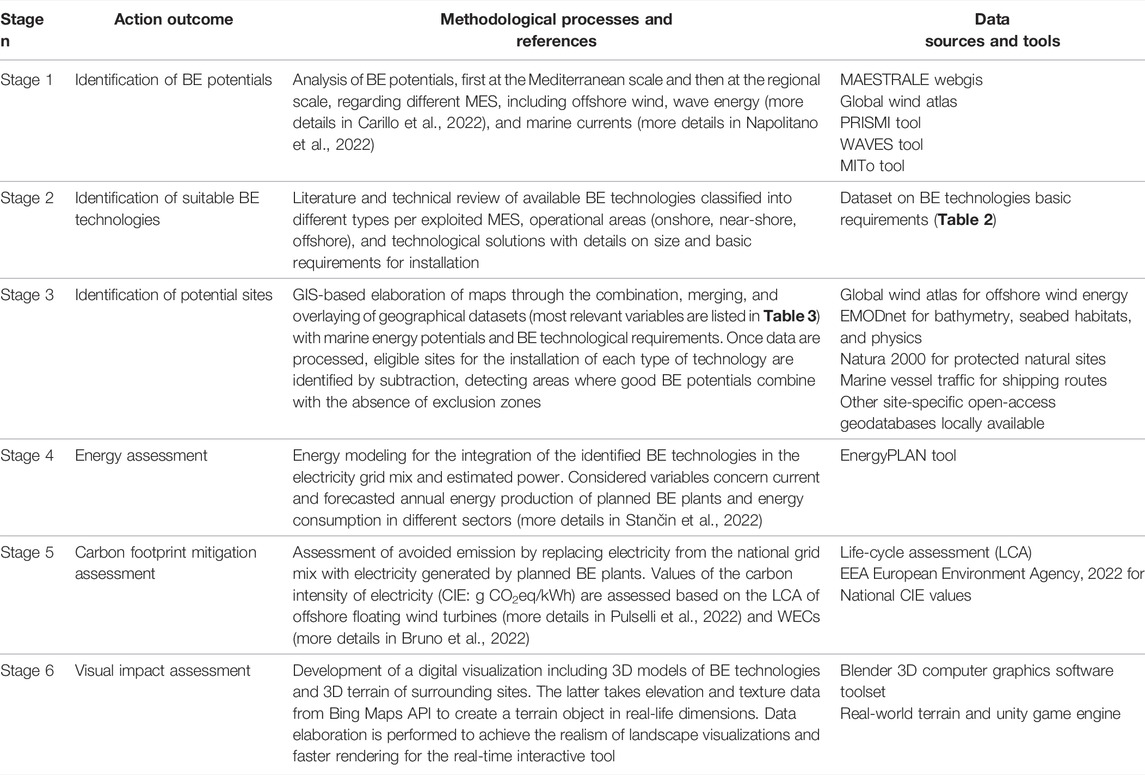
TABLE 1. Stages of the BE planning framework, methodological approach, data sources and tools, and references for methodological insights.
Necessary information for the implementation of the planning process is collected from sources at a regional or local level (e.g., government departments and agencies; other research projects; research and academia), if available, or otherwise taken from official databases at a national or EU level. More detailed data allow for more accurate elaboration, but general databases can be useful anyhow to draft coherent scenarios and start a proactive discussion on their feasibility and concrete implementation. Any outcome from the planning process can be further investigated, finetuned, and changed.
Identification of Blue Energy Potentials
Different tools can be used for the analysis of BE potentials in the Mediterranean, with different levels of accuracy (Stage 1). The MAESTRALE webgis (2018) provides access to open geographical data on BE potentials, including offshore wind, wave, tides, marine currents, and salinity gradients. It was first developed under the scope of the Interreg Med MAESTRALE project (MAESTRALE, 2019) to support researchers, decision-makers, and investors in setting the basis for the development of BE initiatives in the Mediterranean. From this general overview, it emerges that, in general, MES in the Mediterranean have lower potential with respect to the Northern Sea and the Atlantic ocean, but there is evidence of high availability that can eventually be exploited for profit. The highest potentials are those related to offshore wind and wave energy; marine currents are not intensive sources, except for specific hotspots in the Strait of Messina and Gibraltar, and tides are almost irrelevant; seawater thermal energy, salinity gradients, and marine biomass are valuable options in specific contextual circumstances.
The MAESTRALE webgis is a practical tool that can be used in Stage 3 of the procedure; nevertheless, besides this general overview of the Mediterranean basin, site-specific data, when available, are also necessary to investigate scenarios of BE installations at the regional and local levels making the analysis in Stage 4 more robust and exhaustive, especially concerning offshore wind and wave energy (Carillo et al., 2022). In particular, climatological atlases are the primary instrument to be used to establish whether a particular technology is worth being installed in a specific location or not. However, they can be enriched with complementary information from operational oceanographic models, which allow for the construction of long time series of high spatial and temporal resolution data characterizing MES in the Mediterranean. This information is relevant for designing, tuning, and optimizing the production of different BE technologies in specific marine areas and for the planning of monitoring activities of any kind of device deployed at sea.
For assessing wind potentials, representative wind speed time series for the selected sites were established through the use of the PRISMI tool along with the data collected from open wind data (Global Wind Atlas, 2015). The PRISMI tool is based on the long-term MERRA data for defining the yearly and diurnal wind speed variations that are accordingly scaled against either measured or calculated yearly averaged values. The defined yearly time series are consequently transformed into wind power time series via a representative offshore wind turbine power curve.
For the assessment of wave energy potentials, the WAVES tool was used. It is based on the spectral model WAM (version 4.5.3) and implemented over the Mediterranean Sea with a spatial resolution of 1/32° (approximately 3.5 km). Forecast outputs are released hourly over a 5-day simulation and have been used to build a dataset of significant wave height, energy, peak period, and wave direction. The model is forced with winds produced by the SKIRON forecast model (Kallos, 1997) and has been validated over the years against in situ measurements (buoy data) and satellite data (Carillo et al., 2013; Carillo et al., 2014; Carillo et al., 2015). For the regions targeted in this study, a detailed statistical analysis of wave energy has been done, relying on the database constructed on the hourly outputs of the wave operational forecast system, daily operating since 2014 at the ENEA Climate and Impact Modeling Laboratory.
Similarly, the MITO tool is based on an innovative three-dimensional numerical model of marine circulation implemented in the Mediterranean (Napolitano et al., 2022) and Black Seas; it includes the main tidal effects, both produced by local forcing and coming from the Atlantic boundary (Palma et al., 2020) with a horizontal detail of 1/48° (about 2 km)—twice as high as the current operating models available of the Mediterranean (CMEMS-Copernicus)—which increases further up to a few hundred meters, in the region of the Strait of Gibraltar and the Strait of the Dardanelles. Looking at the mean kinetic energy related to currents along the entire Mediterranean basin, marine currents are not a valuable source of energy, but a few hotspots for energy harvesting can be identified anyhow. The Messina strait and Gibraltar strait are the areas with the highest energy potential of marine currents in the Mediterranean.
Identification of Suitable Blue Energy Technologies
The energy potential analysis from marine sources above (Stage 1) allows understanding the most promising options in the Mediterranean Sea for implementing BE technologies. Stage 2 is based on a survey of available BE technologies classified into different types, depending on the MES exploited, operational areas (onshore, near-shore, offshore), and technological solutions referring to the physical principle exploited. The observation of available BE technologies allowed for identifying the main characteristics to inform the planning process, such as nominal power, size, basic requirements for installation, and technology readiness level.
Offshore wind turbines are the best-known technology available in terms of production yields and technology readiness level. They are classified into two main categories: bottom-fixed and floating windmills. Wave Energy Converters (WECs) are promising solutions to harvest wave energy; their three main categories include Oscillating Water Column (OWC), Overtopping Breakwater Systems (OBS), and Floating Buoy Systems (FBS). Moreover, WECs are classified into onshore devices fixed on piers and docks or other coastal infrastructures; near-shore, including oscillating buoys connected to generators fixed on the seabed; and offshore, including buoys taken by a mooring system. Other BE technologies include biorefineries for biofuel or biogas production from marine biomass, Reverse Electro Dialysis (RED) to exploit salinity gradients combined with desalinating plants and underwater turbines exploiting marine currents in very specific locations. Seawater-based heat exchange combined with heat pumps for climate conditioning of buildings is among the most mature BE technologies.
In Table 2, basic requirements have been determined per each type of technology based on data from the literature or private companies, concerning the size of devices, distance from the shore, distance from devices, water depth, relevant physical or legal constraints, optimal working regime (e.g., minimum wind speed or wave high), and mean potential production yields.

TABLE 2. Technical requirements of BE technologies.
Identification of Potential Sites
The identification of sites suitable for the installation of BE plants is a GIS-based procedure that entails the production of maps through the combination, merging, and overlaying of relevant geographical datasets (Stage 3). It starts from the combination of data concerning BE potentials (Stage 1) and the basic requirements of BE technologies (Stage 2) (i.e., technical and environmental conditions, such as sea depth, wave height, and wind speed) needed to ensure their operability. This allows for identifying marine and coastal areas that, fulfilling such conditions, are theoretically suitable for their installation.
This procedure also introduces additional variables corresponding to supplementary datasets and GIS layers, which contribute to determining zones with physical or legal restrictions. The objective is twofold: on the one hand, to minimize the disturbance of environmentally sensitive areas and the interference with other maritime activities and, on the other hand, to assess the presence of coastal infrastructure (i.e., buildings and other facilities) that can host/incorporate BE systems and/or consume the energy produced.
The additional variables introduced belong to three main categories: 1) environmentally sensitive areas: protected natural areas (both marine and terrestrial), reserves, and sensitive marine ecosystems (such as Posidonia meadows); 2) spatial footprint of other maritime activities: navigation routes, ports and ships’ maneuvering areas, military areas, aquaculture plants; and 3) large energy consumers along the coast (desalination plants, public buildings, large hotels, and tourist resorts, etc.). A short checklist of the most relevant variables used in this analysis is shown in Table 3 and corresponds to the datasets to be provided for each target area.
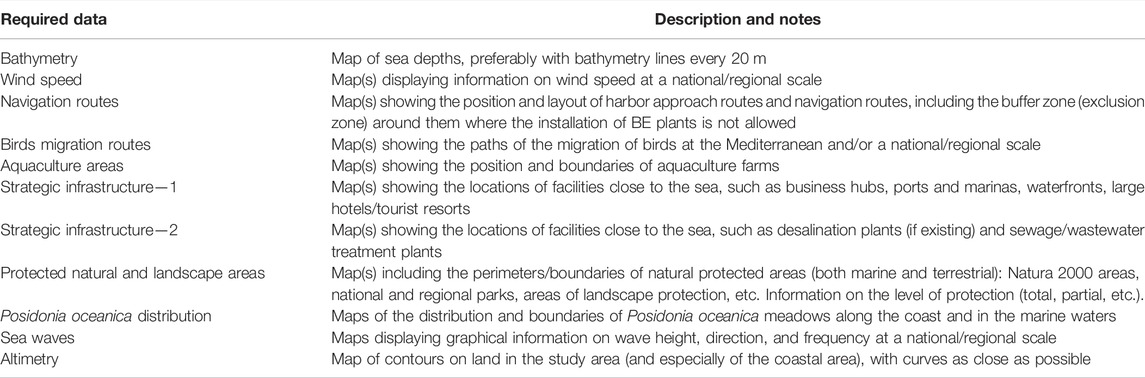
TABLE 3. Types of data needed for BE planning.
All groups of datasets undergo the same processing, albeit with some adjustment depending on the energy source considered (wind and waves) and on the distance from shore of the BE technology analyzed (onshore, near-shore, or offshore). The basic steps are the following:
a. Matching the map of marine energy potentials relevant to the specific BE technologies considered (e.g., wind speed, wave height, and wave power) with the minimum requirements for these technologies to operate efficiently, including water depth (bathymetry map);
b. Uniting the boundaries of environmentally sensitive areas, thus producing a map of ecological constraints;
c. Uniting the tracks of the main navigation routes with the boundaries of ports, marinas, and ships maneuvering areas and/or military areas to avoid interferences;
d. Mapping aquaculture farms to avoid interferences and identify possible synergies (i.e., collection of marine biomass for energy purposes) and/or potential BE consumers;
e. Mapping desalination plants (to eventually host BE systems based on salinity gradient) and wastewater treatment plants (to incorporate algae cultivations for energy purposes).
Overlapping and union of the maps resulting from steps b to d determine the exclusion areas, that is, areas unsuitable for the installation of the type of technology considered. Buffer areas around them are also excluded, their size depending on international and national laws and the type of technology considered.
When datasets are available, these results are further refined by producing additional maps of the following:
- Coastal public/private infrastructure with intense energy use, as potential developers of BE systems for energy self-consumption;
- Tourist infrastructure (diving centers, etc.) to avoid interference with;
- Bird migration routes, essential to identify unsuitable areas for offshore wind turbines;
- Submarine archaeological sites to avoid interference with cultural heritage.
Data collection involves local stakeholders and institutions that are more likely to possess detailed and up-to-date information: public authorities (at the national, regional, and local levels) in charge of spatial planning, energy planning and environmental protection, port authorities, universities and research centers, and environmental associations. In order to speed up the process, data are required in formats (shp, geoJSON, geoTIFF, gdb, and spatialite) that can be easily treated even by open-source GIS software.
Once the data are processed, the marine areas eligible for the installation of each type of technology can be identified by subtraction, detecting the areas where a good BE potential combines with the absence of exclusion zones. The procedure ends with a further selection of the eligible areas with the highest energy potential, finally proposed as “pilot areas.”
It is worth stressing the preliminary and indicative nature of these results: further in-depth analysis is needed (at a smaller scale and considering site-specific restrictions from the environmental and legal standpoint) to verify the eligibility of the chosen sites. Moreover, energy potential analysis should be further refined because the range values used as a starting point only represent the minimum requirements for each type of technology and not the optimal ones for a specific device.
Assessment of the Energy Production of the Blue Energy Plans
Once available sites for the installation of BE plants have been identified (Stage 3), effective energy production can be estimated considering site-specific and operational energy system characteristics (Stage 4). Therefore, a specific energy modeling for the integration of BE in the regional energy system is developed (Stančin et al., 2022 for details). In the first place, this is related to the annual energy demand for power generation, residential, industry, and transport sectors. Moreover, it is necessary to include in the analysis all the energy sources, baseload, and intermittency to investigate their interaction and identify potential spots that might disrupt system stability. The latter concerns the capability of the existing grid to integrate electricity generated by intermittent renewable sources, such as BE.
Through the EnergyPLAN tool, the energy modeling for evaluating the integration of the identified BE technologies in the electricity mix considers a set of variables that covers the current and forecasted annual energy production and consumption in all considered sectors. The modeling is performed on an hourly basis for an average 1-year period (long-term time-series data provided in Stage 1), which allows for the identification of peak loads, a lack or excess in electricity production from renewables, energy imports and exports, and spots for better inter-sectoral integration.
First, a reference scenario of the energy system is determined and validated based on the available data from statistics or grid operators, which is done using the data in Table 4. Then, existing energy strategies are checked to identify future system capacities and energy demand. These strategies and plans serve as a backbone for building up different scenarios in which BE are included. Finally, the scenario that shows the most promising renewable energy potential and does not express disruptions with the inclusion of BE is chosen for further analysis to determine an optimal size for BE devices such as offshore wind farms (OWFs) and WECs.
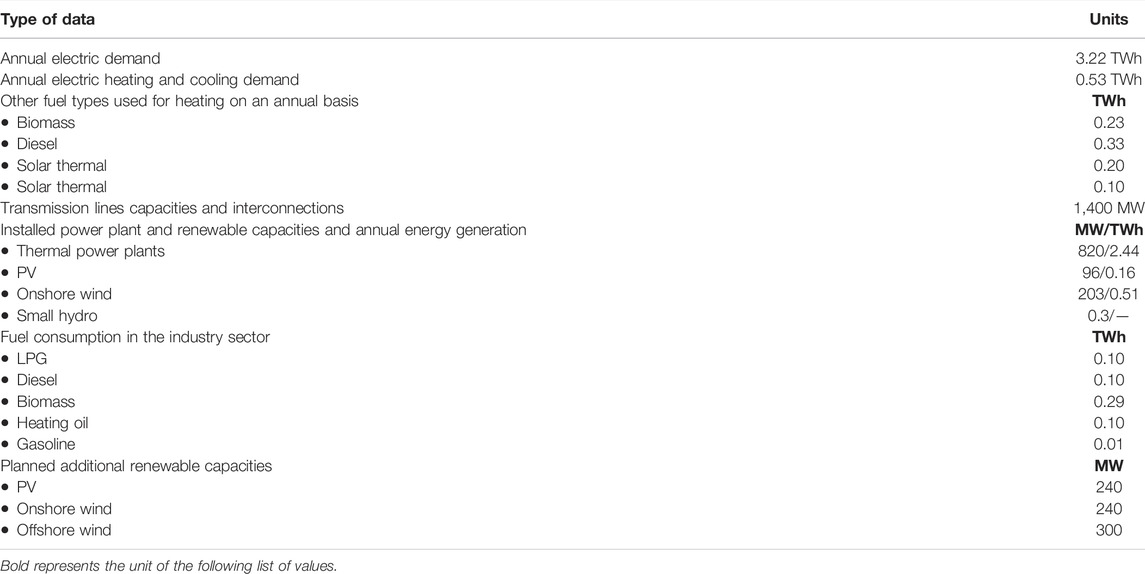
TABLE 4. Data input for energy planning in the case of Crete.
Assessment of the Carbon Footprint Mitigation Effect of the Blue Energy Plan
Based on the estimate of energy production from MES in selected scenarios, the reduction of GHG emissions in the studied areas is assessed to highlight how BE can contribute to the European goal of carbon neutrality (Stage 5). The values of the carbon intensity of electricity (CIE: g CO2eq/kWh) are used to assess the avoided emission due to the replacement of electricity from the national grid mix (Pulselli et al., 2018) with electricity generated by OWFs and WECs. The first has been assessed by Pulselli et al. (2022) based on a life-cycle assessment (LCA) of floating wind mills, including the phases of manufacturing, installation, maintenance, and end of life. Results show different intervals of values in Crete, Croatia, and Cyprus depending on the different site-specific wind energy potentials and two different floating wind turbines: spar buoy and raft buoy. The latter was assessed by Bruno et al. (2022) based on the life-cycle assessment of various devices: onshore fixed floating buoys (i.e., 93–372 g CO2eq/kWh) and near-shore buoys (i.e., 101–151 g CO2eq/kWh). Table 5 shows values of CIE for the national grid mix in Crete, Croatia, and Cyprus (EEA European Environment Agency, 2022), for OWFs and WECs (taking interval values for both onshore and near-shore devices).
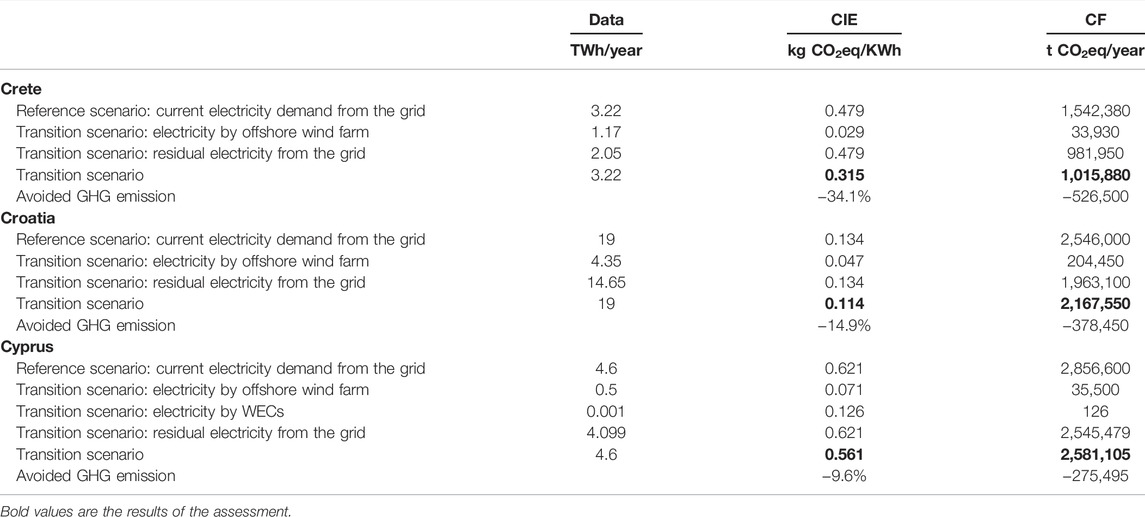
TABLE 5. Carbon footprint mitigation effect of BE plans.
Assessment of the Visual Impact of the Blue Energy Plan
Tools for 3D modeling and virtual touring have been used to visualize the installations forecasted in BE plans, involve the stakeholders engaged in BLUE DEAL Labs, and stimulate discussions, contributing to a more open, transparent, and inclusive planning process (Stage 6). The simulated virtual environments have been created to show the characteristics of selected BE technologies and their interaction with the landscape, considering the physical and infrastructural configurations of shores and the most relevant viewpoints along the coast. These allowed introducing elements of VIA as a systematic analysis of potential impacts to landscapes.
The VIA takes inspiration from a set of references. Molina-Ruiz et al. (2011) predicted and evaluated, before construction, the visual impact of wind farms placed on mountains from different observation points; a Digital Elevation Model (DEM) with a 20 m retail was produced for an area and transformed into Triangulated Irregular Network (TIN) by way of 3D ArcGIS Analyst to create the 3D terrain and 50 m high cones, with 20 m of diameter, placed to simulate the wind turbines in photographs. Molnarova et al. (2012) used a set of 18 photographs (with a basic focal length of 50 mm) that included landscapes of varying aesthetic value in the Czech Republic, with and without wind turbines. These were included in questionnaires, and respondents were asked to evaluate the aesthetic value of the landscapes. Takacs and Goulden (2019) used photomontage to add turbines on a photograph of a landscape for VIA and noticed that camera lens focal length affects the perception of the scale of wind turbines; results show that panoramic photomontages are perceived as the least accurate, whereas images taken at 75 mm focal length in full-frame format are perceived as the most accurate form of representation of the scale and visual impact of wind turbines focal length. Maslov et al. (2017) developed a methodology to assess the degree of visibility of an offshore wind farm from an observer located along the coast; an index of horizon occupation was determined by considering the projection of several distinguishable turbines (installed in Saint-Nazaire in Northwest France) on a plane perpendicular to the sight direction. Sklenickaa and Zouhar (2018) evaluated public visual preferences using photos taken on days with clear weather conditions using a digital camera with a focal length of 50 mm and a tripod set to a height of approximately 170 cm (an “adult man’s eye view”). A wind farm was digitally added with 10 wind turbines into each photo. Kokologos et al. (2014) showcased a realistic 3D simulation of a study area before and after construction by importing orthophotomaps, which, together with field observation of the area, allowed the simulation of elements such as trees and houses; finally, wind turbines were designed and imported in the 3D model at their exact dimensions.
In this study, the composition of a wind park scenery uses two basic elements: the various 3D models of BE technologies and the 3D terrain of the surrounding site. Blender 3D computer graphics software toolset has been used to manually design each technology model based on images. All the 3D terrains were created inside the Unity Game Engine using the real-world terrain asset. This asset uses elevation and texture data from Bing Maps API to create a terrain object in real-life dimensions. An API key can be issued from the Bing Maps Dev Center. Then, a high spatial resolution is used for the terrain near the installed technologies and a lower one for the terrain that is visible but not near to achieving both realism and faster rendering, especially for the real-time interactive tool.
The activity of visualizing BE devices and plants in a realistic environment was realized through an online interactive tool developed to increase the engagement of stakeholders participating in the planning process. To allow replicability of this “experience,” an open-access tool for 3D visualization of BE technologies in real contexts has been provided, including interactive elements for gamification that can also contribute to increasing the engagement level. A game engine was selected to allow users to interact with the scene, go around, see how technologies function, and simulate the scenery from every angle and location the viewer could choose. To enhance realism in user experience, Ceto Ocean System has been used to simulate the sea in the scene, and objects were given physics rules such as buoyancy, which is available in the Ceto package, and gravity, which is available in Unity. Accuracy of the location of the installed technologies is achieved by loading and aligning the GIS software analysis layers (Stage 3) as an image depicting the eligible area of each technology on top of the Unity terrain area. During the design phase, a grid available in Unity’s scene environment is used to assure that every technology has the right dimensions and sets the correct distance between objects. Full atmospheric visibility is assumed in all scenarios, and all objects further than a predefined distance from the camera plane are clipped (50 km for the wind turbines scene, 25 km for the rest). The project has been exported into a WEBGL format to be integrated into the web platform and be easily accessible by anyone. The Earth curvature effect was also implemented in the developed tool, especially for scenarios with turbines placed far from shore (the cases of Croatia and Cyprus). Due to the curvature of the Earth, objects placed further than the horizon, for a specific observation point, tend to have their lower part obscured. The height of the obscured part of the object was calculated in real time, and this phenomenon was simulated in Unity according to the altitude of the camera and the distance of the arc between the camera and any object.
Results
The BE planning framework has been tested and demonstrated in three case study areas. Although not exhaustive, outcomes from the planning process show the basic ingredients of a comprehensive BE plan to inform and address the next MSP initiatives in the area. The general information on MES potentials (Stage 1) and BE technologies (Stage 2) is followed by a site-specific analysis and proposal, showing selected marine areas (Stage 3), potential energy production and integration within the regional energy system (Stage 4), potential effects of mitigation of carbon emissions (Stage 5), and hypothetical views of installed BE plants in specific sites with proper infrastructures and landscape (Stage 6). In particular, the analyses presented here have focused on offshore wind and wave energy, considered the most promising MES.
Blue Energy Plan in Crete
In Crete, the identification of eligible and possible pilot sites started from the definition of main variables and the check of available data. The analysis of BE potentials (Stage 1) has been built on geographical datasets from the MAESTRALE webgis integrated into the GIS-based procedure. Technological requirements then allowed for mapping suitable areas per each type of BE technology (Stage 2). Coherently with technical requirements in Table 2, some assumptions derived from a preliminary consultation with local stakeholders: for OWFs, the distance from the coast was considered from 5 to 80 km, given that wire connection would not be cost-effective beyond that limit; for WECs, a maximum bathymetric depth of 100 m limited the field within 20 km from the shore. After matching the map of BE potentials with that representing the operational requirements of each technology, the analysis was restricted to five types of BE technologies, more suitable for installation in the target region: offshore floating wind turbines and the following WECs: OWC, oscillating floaters, Seabed-based buoys, and oscillating buoys.
The exclusion zones concern the boundaries of areas of high ecological value (sites included in the Natura2000 network, Greek protected areas classified as GEA/GEN/GEETHA Areas, and Posidonia meadows) and areas interested by navigation routes and ports assuming a buffer zone ranging from 0.5 to 5 km depending on the type of technology. For inclusion in the GIS-based procedure, open data have been downloaded from a set of web portals regarding offshore wind energy potential (Global Wind Atlas, 2015); bathymetry, seabed habitats, and ocean physics (EMODnet, 2021); sites belonging to the Natura 2000 network (Natura 2000); shipping routes (Marine Vessel Traffic, 2017) and bird migration routes (Hellenic Ornithological Society, 1982); site-specific basic maps and open-access geodata (Geofabrik, 2007; Greek Government Geodata, 2018; Greek Ministry of Maritime Affairs, 2020).
The combination of the energy potential maps and the exclusion zones derived from the analysis led to the identification, by subtraction, of the eligible areas and the two most appropriate pilot sites for each type of technology (Stage 3). Figure 1 shows the sequence of variables made spatially explicit and overlaid to determine exclusion zones and identify the most suitable sites for the installation of BE plants.
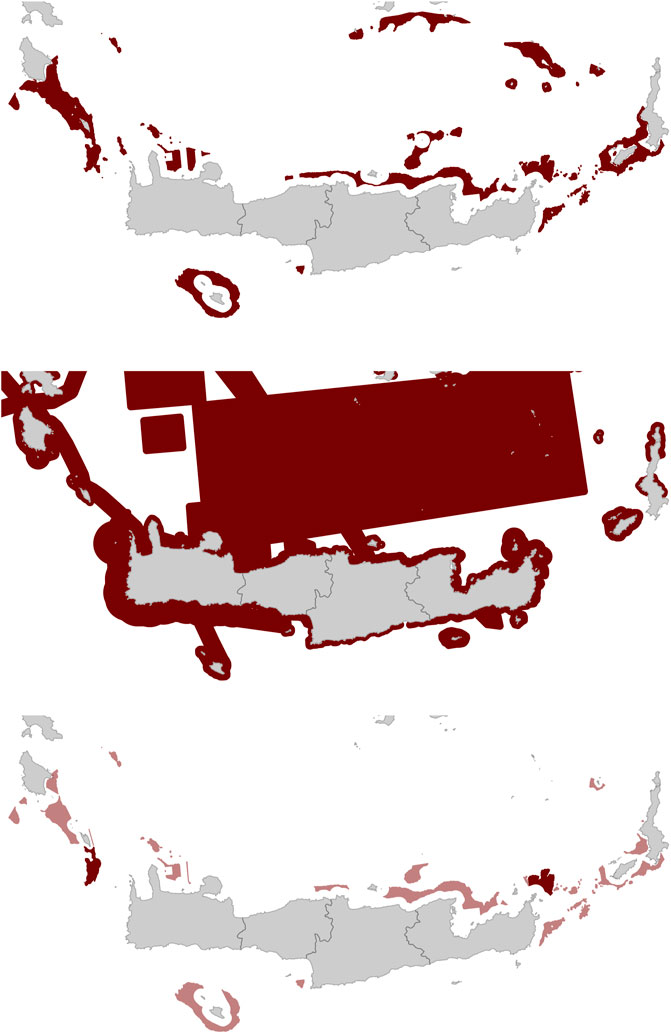
FIGURE 1. Sequence of maps showing the process for the identification of potential sites for the installation of offshore wind turbines in Crete: a. Combination of bathymetry (50–400 m) and wind speed (>4 m/s); b. Exclusion zones: the union of areas with high ecological value (2 km buffer zone), main navigation routes, and maneuvering areas of ports (5 km buffer zone); c. Eligible areas (in light red) from the combination of the two previous maps and pilot sites (optimal wind speed ≥7 m/s at 100 m above sea level).
Figure 2 summarizes the results achieved for all the considered technologies. It is worth mentioning that the optimal pilot areas for the installation of offshore wind turbines (e.g., with wind speed ≥7 m/s at 100 m above sea level) are located off both the eastern and western extremities of Crete Island, whereas potential sites for WECs are concentrated along its southern coastline.
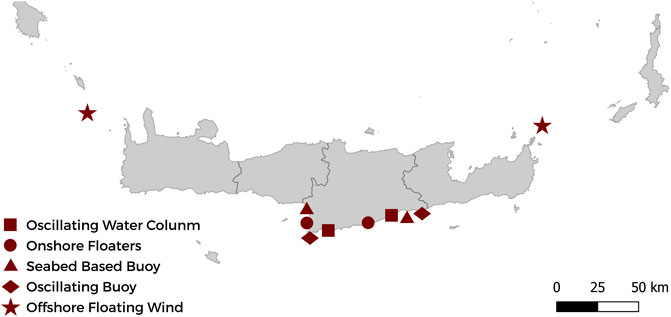
FIGURE 2. Synthetic map with the identified potential pilot areas for the installation of wind and wave energy plants in Crete.
Being the BE planning an iterative process, additional observations have determined further restrictions, especially concerning the installation of WECs. An assessment of wave resources has been made in specific locations in the Cretan Sea based on the dataset built on the hourly outputs of the wave operational forecast system at the ENEA Climate and Impact Modeling Laboratory (Stage 1).
Figure 3 shows the map of the yearly mean value of the significant wave height, computed over the whole period of 2014–2020. The mean value of the significant wave height (Hs) in this subdomain ranges from 0.5 to 1.2 m. The westernmost zone of Crete Island is the most productive, as it is exposed to the waves propagating from the Ionian Sea and those generated by the northerly winds. Also, the eastern part of the island is characterized by waves exceeding 1 m in height on average and can be considered eligible for wave energy harvesting. The black dots in the figure show the sites for which a more detailed analysis has been done: CR-1 has been selected as an example of a location, on the western flank of the Crete Island, with high wave potential; CR-2 instead had been selected through the BE-planning approach for wave energy devices applied to the Heraklion county; and CR-3 and CR-4 correspond to the locations identified as suitable for the installation of WECs. For each location, the distribution of yearly average energy in terms of the mean period (Te) and of Hs has been evaluated over 7 years simulation period. Contribution to the total energy given by individual sea states is lumped together in 0.25 s intervals of Te and 0.25 m intervals of Hs. Wave power contributions of individual 1 h sea states obtained from the model output are calculated using the power equation. Table 6 summarizes the mean power and the yearly average for each point together with the bathymetric depth among the variables mentioned in the technology requirements.
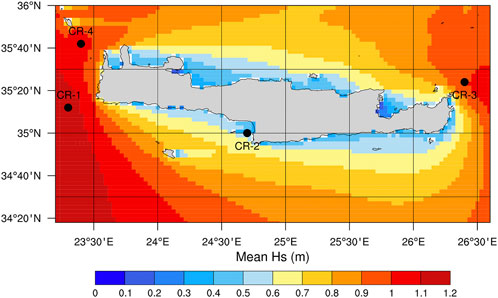
FIGURE 3. Mean wave height Hs (m) over the period 2014–2020. Dots indicate locations monitored in detail.
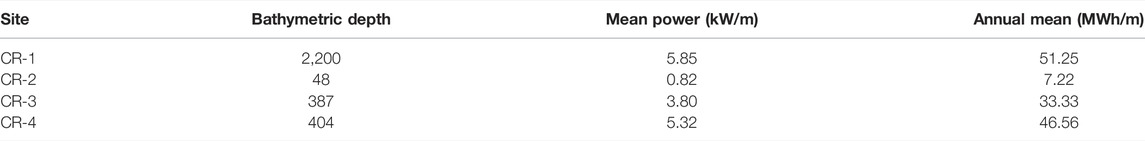
TABLE 6. Mean wave energy for the selected points around Crete.
As a result, the CR-2 location, a representative for most of the sites identified through the mapping procedure, does not show exploitable potential. The most energetic site is CR-1. The sites CR-3 and CR-4 are also suitable for the installation of offshore WECs. Nevertheless, the bathymetric values do not allow for a favorable and cost-effective installation at the moment, except for the eventual integration of WECs in the structure of floating wind farms.
Stančin et al. (2022) demonstrated how different scenarios for integrating BE plants into the energy system of the study areas are examined by determining the electricity production and their share in the electricity production mix (Stage 4). Precisely, four different scenarios were considered for the case of Crete, starting from the Referent scenario: the transition scenario concerns 300 MW of offshore wind with 400 MW of interconnection capacity to the mainland; the BE scenario considers the complete phase-out of thermal power plants and the interconnection with the mainland in full capacity of 1,400 MW. Finally, the renewable scenario implies an additional 480 MW of installed capacities, equally divided between PV and onshore wind. The information about the maximum potential of 480 MW of additional renewables that can be integrated is directly obtained by the system distributor. Because the National Energy Strategy implies PV and wind as the backbone of the decarbonized energy system, the maximum potential is distributed as explained above.
This analysis showed that the maximum production from OWFs of 300 MW of installed capacity is 1.17 TWh per year, with an average load factor of 41%. Therefore, in the case of the transition scenario where thermal power plants are still operating, and there is interconnection to the mainland, the offshore wind farm allows for a reduction of oil for power generation by more than 1 TWh on an annual basis. Furthermore, with the installation of additional renewable capacities in PV and onshore wind, the production of electricity on the island can cover up to more than 70% of annual demand. The rest of the electricity demand is met by importing from the mainland through the interconnector, of which 25% of nominal capacity is continuously used for grid balancing. Besides, a significant amount of production excess can be exported to the mainland, which improves the wind farm economics. Finally, a complete phase-out of the thermal power plant can achieve savings of 6.4 TWh in terms of heating oil consumption. Better intersectoral integration, especially electrification of transport, heating, and industry sectors, could allow for even greater penetration of the MES, especially of offshore wind, which also shows good potential on the west side of the island.
This analysis is then further developed with an assessment of how the integration of BE technologies can result in a reduction of greenhouse gas (GHG) emissions and support the goal of a carbon-neutral energy system through carbon footprint and life-cycle assessment evaluations (Stage 5). In the reference scenario for Crete, electricity (3.22 TWh demand per year) is assumed as taken from the grid (479 g CO2eq/kWh), and the corresponding greenhouse gas emission is, therefore, 1,542,380 t CO2eq/year. The 1.17 TWh (36%) per year produced by the offshore wind farm (average 29 g CO2eq/kWh of carbon intensity) in the transition scenario would decrease the emission to 1,015,880 t CO2eq/year with 526,500 t CO2eq/year of avoided emission (−34%). The new value for CIE of the grid mix would decrease to 315 g CO2eq/kWh (Table 5).
The interactive visual tool developed during the Crete BLUE DEAL Lab (Bluedealmed visual-too-Cyprus, 2022) contains a fully 3D virtual world where the user can navigate and look at the BE plants with location and size determined in Stage 3 and Stage 4, respectively. The selected area for the offshore wind farm in Crete is localized to the northeast of the island, as shown in Figure 1 and Figure 2; this has been modeled for 3D visualization. When the interactive visual tool is loaded, on the top right of the user interface, three buttons allow the user to navigate the area (Figure 4) using a drone or a boat and obtain a view from shore. Using the drone camera, the user can go anywhere in the environment, even underwater, which is very helpful to see parts of the submerged technologies. With the use of direction keys (ASDW keys), the user can navigate, control vehicle speed, and rotate the viewing camera. The user can freely navigate the different locations and technologies using the top-left dropdown menu. On the bottom right, a virtual map depicts the current location. Selecting the map allows viewing the whole area. A compass is also available on screen to help the viewer with the scene orientation. The settings button on the bottom left lets the users set the graphics quality, monitor frames per second, and adjust the wind levels, which simulates waves, particularly useful when observing buoys. Advised graphics quality is set to at least 25 frames per second for a better and smooth experience.
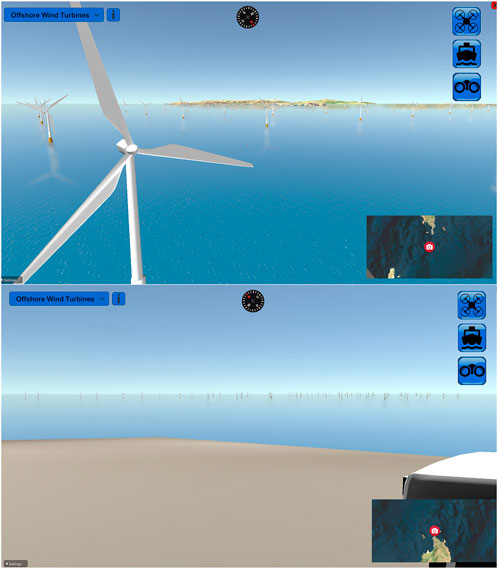
FIGURE 4. Wind farm visualization in Crete, view from the sea and the shore.
Blue Energy Plan in Croatia
Similarly, results have been obtained in two other locations: the marine areas of Split (Croatia) and Larnaca (Cyprus).
In Croatia, the process for the identification of pilot sites regarded the marine area of the Split-Dalmatia County and, in particular, the internal waters and territorial seas, thus excluding international waters (farther than 12 nautical miles from the coastline) whose energy exploitation could imply additional permitting issues. Moreover, for offshore wind energy, only areas more than 10 km from the coast were considered to avoid visual impact (and hence potential public acceptance issues) in an area rich in small islands and strongly devoted to tourism. As regards the types of technologies, ten different technologies were considered, also excluding seawater heat pumps, which are already a well-established technology in Croatia.
Figure 5 summarizes the results achieved in terms of eligible and pilot areas for the above-mentioned technologies. It is worth mentioning that no potential whatsoever was detected for overtopping breakwaters, oscillating attenuators, and tidal turbines, thus cutting the technologies applicable in the region down to seven. These are mostly concentrated in the northern part of the region and, for wind energy, in two offshore areas: one situated between the islands of Vis and Korčula and the other located northwest of Vis.
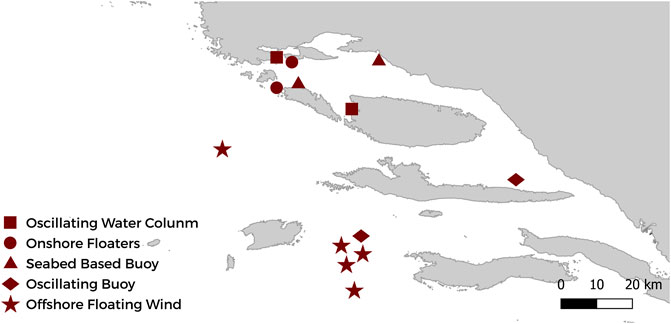
FIGURE 5. Synthetic map with the identified potential pilot areas for the installation of wind and wave energy plants in Croatia.
Given that Split-Dalmatia County was selected as a pilot site, the energy consumption and production were observed firstly only on the county level and then given in the perspective of the whole Croatian energy system. The simulated scenarios include the referent case and a transition scenario. In 2018, the electricity demand in Croatia was 19 TWh, of which is mostly supplied by hydropower plants (7.7 TWh), thermal power plants (3.7 TWh), and onshore wind (1.3 TWh). There is also a net import of about 6.3 TWh per year.
In the analysis, only the area of Split Dalmatia County was observed for the deployment of OWFs. At two selected sites (north and south), the maximum potential is 1,590 MW and 204 MW, respectively. If the nominal capacity of each unit is considered as 6 MW (technology is still in development), this will account for 265 and 34 wind turbines per site. With those installed capacities, electricity production from the north wind farm would be 3.85 TWh/year and 0.5 TWh/year for the south site. The average load factors for both wind farms would be 28%. Together, OWFs could contribute with 4.35 TWh to the national grid, which is around 22% of annual electricity demand, making offshore wind the second most important energy source. The small drawback might represent the fact that offshore wind production does not correlate with demand. Therefore, the lowest output is during the summer months, whereas the highest production is noted during the winter months.
As a testing case, the wave energy potential was analyzed for Split Dalmatia County for 2050. At the selected testing sites, approximately 267 devices of oscillating buoys of 100 kW were considered. On an annual basis, such devices with the current level of development could provide around 1 GWh of electricity. This represents an almost negligible share of total demand; therefore, this technology was considered not promising for the Adriatic coast. This was expected since the Adriatic Sea is a semi-closed sea with poor wave resources.
In Croatia, electricity (19 TWh demand per year) from the grid has a low emission factor due to a high share of renewables (134 g CO2eq/kWh) and the corresponding greenhouse gas emission is therefore 2,546,000 t CO2eq/year. The 4.35 TWh per year produced by the OWFs (average 47 g CO2eq/kWh of carbon intensity) would decrease the emission to 2,167,5500 t CO2eq/year with 378,450 t CO2eq/year of avoided emission (−15%). The new value for CIE of the grid mix would decrease to 114 g CO2eq/kWh (Table 5).
After the results of eligible and pilot areas from the analyses were available, the interactive visual tool was developed for this scenario (Bluedealmed visual-tool-Croatia, 2022). Nearby 3D terrains were generated, and the technologies were placed in the pilot areas accordingly. Figure 6 showcases the 3D simulation for the cases of wind turbines accordingly, as seen from the drone camera in the tool.
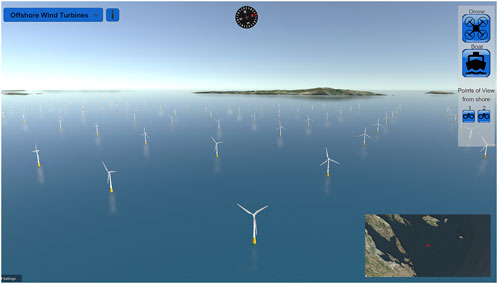
FIGURE 6. Wind farm visualization Croatia, view from the sea.
Blue Energy Plan in Cyprus
In Cyprus, the process for the identification of pilot sites regarded all marine areas belonging to the internal waters, territorial seas, and contiguous zones, thus excluding international waters. Moreover, for Croatia, only areas more than 10 km from the coast were considered for offshore wind energy to avoid the visual impact of turbines.
Figure 7 summarizes the results achieved in terms of eligible and pilot areas. It is worth mentioning that no potential whatsoever was detected for overtopping breakwaters, oscillating attenuators, and tidal turbines. The potential pilot areas for the remaining technologies are concentrated in the southern and northwestern parts of the island, with a suitable site for the installation of an offshore floating wind farm off the southern coast between Larnaca and Limassol.
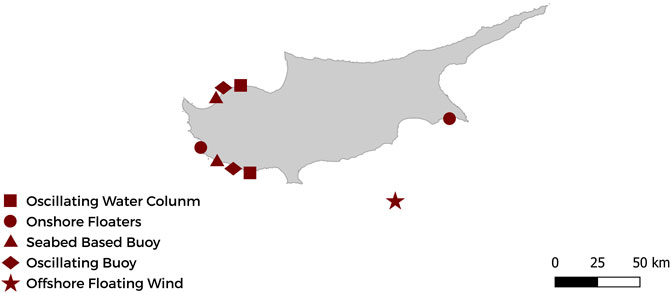
FIGURE 7. Synthetic map with the identified potential pilot areas for the installation of wind and wave energy plants in Cyprus.
The energy system of Cyprus is mostly dependent on fossil fuels and expresses an evident seasonality in terms of electricity consumption due to the notable touristic activity. In 2018, less than 10% of electricity was from renewable sources, mainly PV and onshore wind. The transition scenario with the inclusion of MES is built for 2030, according to the national strategy to increase the share of renewables. From the perspective of MES, offshore wind is considered with 300 MW, and wave energy with the 30 MW of installed capacity. Wave energy capacities are equally divided between OWCs, onshore floaters, and seabed buoys at two selected sites. Additionally, it was assumed that the interconnection cable will be operational by 2030, with a capacity of 1200 MW which is essential for higher penetration of RES.
Offshore wind could produce around 0.5 TWh of electricity per year, accounting for only 10% of annual demand (4.6 TWh), with a quite poor load factor of 18%. This low load factor is partially derived from the fact that the energy system is heavily based on baseload power plants. Therefore, the maximum potential cannot be exploited. Electricity production from WECs is almost negligible and accounts for 10 GWh per year, with a poor load factor of only 2%. This implies that wave energy has a long road ahead before becoming a significant part of the energy system. Finally, the deployment of additional onshore renewable sources, mostly PV, and offshore wind farm could increase the share of renewables in total primary fuel consumption from 5% to 11%. Even more, in such a case for 2030, the share of renewables in the electricity mix would be around 45%, with an annual production of 1.9 TWh. For more in-depth decarbonization, it is necessary to include seawater heat pumps for heating and cooling in both household and service sectors and carry out electrification of the transport sector, which would allow even higher penetration of renewables from the perspective of grid balancing strategy.
In Cyprus, electricity (4.6 TWh demand per year) from the grid has a high emission factor due to a high share of fossil sources (621 g CO2eq/kWh), and the corresponding greenhouse gas emission is therefore 2,856,600 t CO2eq/year. The 0.5 TWh (11%) per year produced by the OWFs (average 71 g CO2eq/kWh of carbon intensity) and 10 GWh (0.2%) per year produced by WECs (average 126 g CO2eq/kWh of carbon intensity for near-shore buoys) would decrease the emission to 2,581,105.t CO2eq/year with 275,495.t CO2eq/year of avoided emission (almost −10%). The new value for CIE of the grid mix would decrease to 561 g CO2eq/kWh (Table 5).
In Figure 8, the image above shows the offshore wind turbine park, which is placed 39,868 m from this observation point on the shore near Pervolia Area and can be seen through a zoomed virtual camera. In this implementation of the tool (Bluedealmed visual-too-Cyprus, 2022) in the bottom left of the UI, users can monitor the average distance of the turbines from the camera, the elevation of the camera, and the average obscured height of the turbines in the park. The image below showcases oscillating buoys in Pomos Paphos area, as seen from the drone camera in the tool.
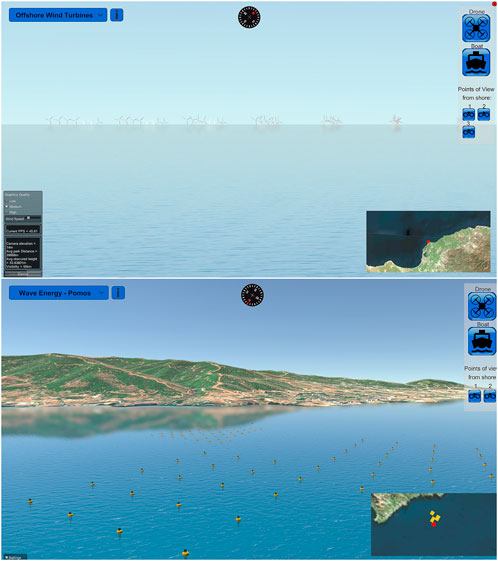
FIGURE 8. Offshore wind park including 50 spar buoys wind turbines (250 MW), view from Pervolia Area in Cyprus (above) and Oscillating buoys in Pomos Paphos area in Cyprus including 50 seabed-based buoys, 750 m minimum distance (below).
Discussion
Experts from partner institutions of the BLUE DEAL project have developed the different phases of the planning process according to their specialized knowledge and finally provided a BE plan for each target area. The plan was graphically displayed and presented, combining different representations and visualization tools to make it “readable” to a general audience. Given the innovative nature of BE technologies and their dependency on a wide range of conditions (environmental, administrative, and technical) that cannot be fully and consciously handled, the role of the experts was crucial to process, summarize, and transfer scientific data and information that can be used as a basis for discussion, policymaking, and action planning.
Despite assumptions and approximations, the BE planning framework provides a reliable result with concrete information on potential locations for BE plants and estimated benefits. Given that accuracy can be improved based on more accurate data sources, the BE plan presented anyhow provides concrete subjects for an open consultation with local stakeholders, which brings to a constructive discussion on solutions for the energy transition. In particular, results have been presented and used to address the discussion on BE development in target regions during public workshops: BLUE DEAL Labs.
In the BLUE DEAL Lab, the preliminary work of experts providing a comprehensive, integrated BE plan is the pre-requisite to launch a participative design process by engaging local stakeholders with a double aim, which is to validate results according to their expertise and eventually contribute to improve and fine-tune the planning process and to acquire knowledge on opportunities and requirements in order to start a process of capitalization.
Stakeholders engaged in Labs are expected to take vision of the proposed solutions and act as developers of the planned initiatives that will necessarily involve public and private actors throughout the value chain of BE technologies and plans. These include the following:
- Public authorities in charge of regional planning: first, these can provide specific information and ensure full access to main data sources, including geographical data on restrictions preventing the installation of BE devices, for example, regional/local protected areas not included in the Natura 2000 network (information not available on EU platforms). Then, these can support the inclusion of BE plants in the next MPSs or regional energy plans.
- Public authorities in charge of ports management: first, these can provide information on restrictions preventing the installation of BE devices, for example, due to requisites for ports operations, navigation routes, and other spaces that can be subject to the provisions of local laws and regulations. Then, these can support the inclusion of BE technologies in new port master plans, for example, in new or renewed infrastructures.
- Public authorities in charge of environmental protection and environmental associations of citizens: first, these can provide information regarding the spatial distribution of vulnerable species and habitats (i.e., Posidonia meadows) or birds’ migration routes and other information on marine wildlife. Then, these can play a role in supporting initiatives for the energy transition and sustainable development of local communities.
- Public authorities in charge of tourism and private stakeholders, such as associations of hotels, entrepreneurs, and SMEs, to identify tourist facilities along the coast willing to invest in BE technologies: together with the association of citizens, these can play a role as end-users, for example, in the case of energy communities supplied by renewable MES.
- Private stakeholders, such as SMEs or investors interested in new start-up initiatives to evaluate business opportunities in prototyping, installing, and maintaining BE plants in target regions.
Further work can be done in the future to improve the BE planning framework presented here and related tools, such as visual tools for public consultation.
Regarding the identification of BE potentials (Stage 1), MES in the Mediterranean have lower potentials compared to oceans and the North Sea, but minimum requisites are often satisfied, for example, regarding wind speed and wave energy. Results of electricity generation (Stage 4) show that wind farms would have different production yields in selected sites in Crete, Croatia, and Cyprus due to different wind potentials; the identification of suitable sites depending on maximum available potentials at the regional level allowed for maximizing efficiency and provided profitable results in each of the three case studies, meaning that offshore wind represents a profitable solution for increasing renewable rates of energy systems. Wave energy is not as easily exploitable as wind, especially in near-shore areas (only the case of Cyprus shows interesting results compared to negligible outcomes in Crete and Croatia); waves can eventually represent a valuable source of energy in the case of offshore solutions, such as in combination with wind farms (e.g., hybrid floating platforms), where there is evidence of higher potentials. The methodological approach in Stage 1 for assessing BE potentials is crucial in BE planning. Open-access tools, such as the MAESTRALE website, can be used for a preliminary estimate. Nevertheless, the development of site-specific analysis is always recommended at the regional level and needs specific competencies of experts and advanced models to be implemented.
Regarding the identification of BE technologies (Stage 2), offshore wind is currently the most profitable MES, but, considering the bathymetric slope in the Mediterranean Sea, floating wind turbines are a mandatory choice in most cases. Although floating platforms have not been widely tested yet at full scale, floating wind farms have been interpreted by stakeholders during Labs as the most profitable solution. WECs show a lower TRL, but several innovative solutions are under study. Despite the lower potential, the interest of stakeholders, such as Port Authorities, is mainly addressed to onshore and near-shore WEC devices that, for example, can be included in plans of port expansion to make harbors and marinas energy self-sufficient. In the future, the advancement of TRL values would likely increase the performance and applicability of WECs and allow for their effective inclusion in BE planning. In Stage 2 of the methodology, the basic requirements of BE technologies derive from the most recent survey and should be taken as general indications to address planning activities rather than mandatory prescriptions; the survey should be periodically updated because of the fast innovation trends and technological development in this sector.
Regarding the identification of potential sites (Stage 3), maps have been provided in the three case studies, including possible locations for wind farms and WECs and options for technologies coupled with aquacultural systems (marine biomass), desalinating plants (salinity gradients), and touristic infrastructures (seawater heat-cold exchange). Besides seawater-based heat pumps that are already widely used, most of these combined solutions would require extensive innovation and investments for prototyping and testing, and their production yields are still uncertain. The procedure in Stage 3 depends on data availability and accuracy. Far from being an exhaustive spatial plan, results provide matter for a debate with local stakeholders and lay the basis for a discussion on regional MSP that would need deeper and more accurate investigations. Cooperation with experts and negotiations with local stakeholders regarding data sources and their interpretation are recommended for finetuning the spatial analysis. Additional variables, besides those mentioned in the case studies, should be added to inform the mapping process according to site-specific characteristics and needs of target regions.
Energy assessment (Stage 4) faces the problem of temporal intermittence of renewable energy, such as wind and wave energy, that must suit the local energy grid with no dysfunction. The connection with broader grids, such as the national electricity grids, has been forecasted in the hypothesized scenarios as a factor of stability for integrated energy systems. Isolated sites, such as remote islands, would need a deeper analysis to introduce energy storage facilities and production-consumption interactions with other sectors. In Stage 4, a set of progressively improved scenarios, also in combination with other renewable energy sources, with increasing renewable rates, is recommended to guarantee the coherence of interventions and plan the required technical improvements of grids with proper production-consumption-storage balance.
The assessment of carbon footprint mitigation effects (Stage 5) by different BE technologies is based on the various sources used for energy production in target regions (national electricity grid mix). The CIE from local grids are different in the three case studies and, consequently, the contribution of MES in terms of avoided emission. Values of CIE of BE technologies, specifically offshore floating wind farms and WECs, derive from LCA-based assessments, considering the main lifecycle processes of the devices, from manufacturing to maintenance, use, and end of life. Therefore, results open an additional debate, engaging local stakeholders to be actively involved in the value chain with potential effects in terms of climate action (CIE), economic growth (investments, services), and job opportunities. In Stage 5, wider research on the impacts of BE technologies, other than greenhouse gas emission, would improve the accuracy of results, allow for cost-effective organization of lifecycle processes throughout the production chain of BE plants by decreasing impacts and maximizing efficiency (lower CIE values), and increase the capacity to plan fair and sustainable interventions.
VIA (Stage 6) plays a crucial role in the interaction with local stakeholders, especially in engaging non-technical audiences. It can help build social acceptance and better understand impacts and benefits in terms of landscape compatibility and land-use change. An innovative conceptual approach to the problem of the visual impact of renewable energy systems was introduced by Paolinelli et al., 2022; rather than minimizing the visual impact by moving offshore devices as far away as possible from the shore, their expressiveness can eventually be enhanced and interpreted as an added value. In Stage 6, the web tools for visualization of BE plants can contribute to supporting the discussion in this field. More realistic effects can eventually be rendered. For example, even though the terrain of the nearest shore is created using real DEM and texture data, it is very poor in terms of elements such as trees and buildings, which are essential to identify the region; a drone can be used to create an exact 3D model of the landscape containing all the above elements and then it can be imported in the Unity project. Although the environment is in 3D, it is very easy to underestimate or overestimate the dimensions due to various facts, including the camera’s focal length and the fact that screens are flat and vary in dimensions. The perception will change if we experience the tool through a laptop screen, a PC monitor, or a larger TV screen. A virtual reality version of the tool would contribute to making this action even more effective for citizen engagement, and their early assessment of BE plans through immersive experiences.
Table 7 provides a synthetic description of key findings and methodological recommendations to improve the BE planning methodology and facilitate its replicability. The implementation of BLUE DEAL Labs provided an opportunity to build a narrative, that is, a story, of what BE technologies are and how they can provide clean energy and new job opportunities in the region. Currently, in the Mediterranean region, there is a narrative that BE potential is very low and that the technologies suitable for deployment in the region are limited. At the same time, there are concerns by other marine users and the general public that such technologies may have negative impacts. An alternative narrative can be presented to local stakeholders through appropriate means, which can spark their imagination. Building an alternative positive narrative can be achieved through storytelling in which existing BE technologies and BE future technologies are presented to demonstrate the variety of solutions and broaden the concept of BE.
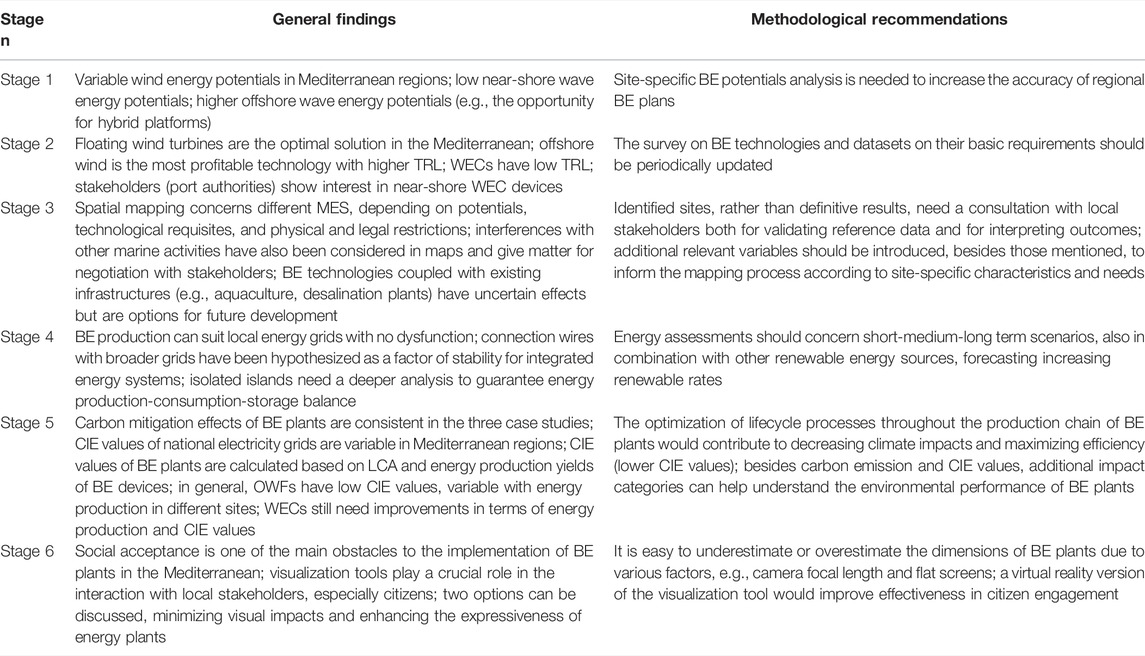
TABLE 7. List of main findings per each stage and recommendations for methodological improvement and replication of the BE planning framework.
Conclusion
The BE planning framework described in this study has been developed under the scope of the Interreg Med BLUE DEAL project to promote the deployment of BE technologies in the Mediterranean region and support their inclusion in regional Energy Plans and Marine Spatial Planning initiatives.
The proposed methodology has been demonstrated during three BLUE DEAL Labs in Crete, Croatia, and Cyprus to preliminarily identify the areas that are eligible for the deployment of blue energies, dimension possible interventions, and assess potential outputs and impacts. In general, results from the three case studies confirm that BE can consistently contribute to the energy transition of Mediterranean regions, especially in the case of offshore floating wind farms, depending on site-specific potentials. WECs are still at an early stage of development and currently show low efficiency compared to other renewable sources, but technological improvements may likely allow for profitably harvesting wave energy in the next future. While thermal energy already represents a valuable option, exploitable through seawater-based heat pumps, limited and still uncertain potentials are associated with marine biomass, in combination with aquaculture, and salinity gradients, coupled with desalinating plants. Marine currents are not significant enough in the Mediterranean except for a few hotspots.
A sequence of clearly defined stages is provided to release an early integrated BE plan to exploit different MES in specific marine areas. This takes into consideration local BE potentials (Stage 1), characteristics, and minimum requirement of technologies to ensure their operability (Stage 2), and the combination with physical, environmental, and legal restrictions in the area, as well as other maritime activities (e.g., shipping, fishing, and tourism) (Stage 3). Moreover, the hypothesized scenarios are evaluated by assessing the impact of the penetration into the local energy grid mix (Stage 4), the effects in terms of carbon footprint mitigation of BE plants, and renewable energy systems (Stage 5). The last stage concerns the visualization of the planned BE plants in contextual landscapes through digital simulations (Stage 6). Limitations of the procedure have been systematically highlighted in this study per each stage, with recommendations to improve accuracy and increase the reliability of results. Besides the suggested datasets and tools, additional data sources, models and tools, variables analyzed, visualization and communication techniques, and other complementary competencies, such as economic estimates and financial issues, would contribute in the future to advance the planning methodology, building on more robust knowledge and transparent and widely shared information.
The procedure, initially based on open-access web tools and datasets, can be performed by an interdisciplinary group of experts in a few working days to transfer scientific and technical knowledge to a broad range of stakeholders. Although assumptions and approximations can determine inaccurate outcomes, the resulting BE plans provide matter for discussion within participatory forums through which the interested parties can learn how to profitably implement BE technologies in target regions, collaborate to sign cooperation agreements, and take action. In particular, national and regional public authorities can be informed to decide whether and where to support BE deployment in their marine areas.
The Blue Energy Planning framework can be a valuable tool to facilitate dialog and discussions among local administrators, industry, and civil society. Through open consultation, it can help anticipate possible causes of resistance against the deployment of Blue Energies and proactively address emerging problems, thus making a step forward in the social acceptance of these new technologies. Although each test case had its own characteristics and specificities, the replicability of the proposed method in different regions of the Mediterranean can contribute to promoting and accelerating an effective and fair energy transition based on marine energy and boost regional and transnational cooperation for a sustainable blue economy.
Data Availability Statement
The original contributions presented in the study are included in the article. Further inquiries can be directed to the corresponding author.
Author Contributions
RP: research coordinator, main curator, and writer. SB: general supervisor and project coordinator. Co-authors: writers of specific sections, all involved in the cooperative work.
Funding
This study has been developed in the framework of the Interreg Med BLUE-DEAL (2019–2022) project co-financed by the European Regional Development Fund (Ref. 5381). Website: https://blue-deal.interreg-med.eu.
Conflict of Interest
RP and EN were employed by Indaco2. SM and VM were employed by U-space. VP, KS, and EV were employed by Geoimaging. LS was employed by Cyprus Energy Agency.
The remaining authors declare that the research was conducted in the absence of any commercial or financial relationships that could be construed as a potential conflict of interest.
Publisher’s Note
All claims expressed in this article are solely those of the authors and do not necessarily represent those of their affiliated organizations or those of the publisher, the editors, and the reviewers. Any product that may be evaluated in this article, or claim that may be made by its manufacturer, is not guaranteed or endorsed by the publisher.
References
Hellenic Ornithological Society (1982). Hellenic Ornithological Society. Available at: http://www.ornithologiki.gr.
Arena, F., Romolo, A., Malara, G., and Ascanelli, A. (2013). “On Design and Building of a U-Owc Wave Energy Converter in the Mediterranean Sea: A Case Study,” in Proceedings of the ASME 2013 32nd International Conference on Ocean, Offshore and Arctic Engineering, Nantes, France, June 9-14, 2013. OMAE2013. doi:10.1115/OMAE2013-11593
Babarit, A., Hals, J., Muliawan, M. J., Kurniawan, A., Moan, T., and Krokstad, J. (2012). Numerical Benchmarking Study of a Selection of Wave Energy Converters. Renew. Energy 41, 44–63. doi:10.1016/j.renene.2011.10.002
Barbot, Y., Al-Ghaili, H., and Benz, R. (2016). A Review on the Valorization of Macroalgal Wastes for Biomethane Production. Mar. Drugs 14 (6), 120. doi:10.3390/md14060120
Bastianoni, S., Coppola, F., Tiezzi, E., Colacevich, A., Borghini, F., and Focardi, S. (2008). Biofuel Potential Production from the Orbetello Lagoon Macroalgae: A Comparison with Sunflower Feedstock. Biomass Bioenergy 32, 619–628. doi:10.1016/j.biombioe.2007.12.010
Bastianoni, S., Praticò, C., Damasiotis, M., and Pulselli, R. M. (2020). Editorial: Perspectives for Marine Energy in the Mediterranean Area. Front. Energy Res. 8. article 09 September 2020. doi:10.3389/fenrg.2020.00209
BLUE DEAL (2022). Interreg Med Project Official Website. Available at: https://blue-deal.interreg-med.eu.
Bluedealmed visual tool Crete (2022). Bluedealmed Visual Tool Crete. Available at: https://bluedealmed.eu/visual-tool.
Bluedealmed visual tool Croatia (2022). Bluedealmed Visual Tool Croatia. Available at: https://bluedealmed.eu/visual-tool-croatia.
Bluedealmed visual tool Cyprus (2022). Bluedealmed Visual Tool Cyprus. Available at: https://bluedealmed.eu/visual-tool-cyprus.
Bonfanti, M., Hillis, A., Sirigu, S. A., Dafnakis, P., Bracco, G., Mattiazzo, G., et al. (2020). Real-Time Wave Excitation Forces Estimation: An Application on the ISWEC Device. Jmse 8 (10), 825. doi:10.3390/jmse8100825
Bozzi, S., Besio, G., and Passoni, G. (2018). Wave Power Technologies for the Mediterranean Offshore: Scaling and Performance Analysis. Coast. Eng. 136, 130–146. doi:10.1016/j.coastaleng.2018.03.001
Bozzi, S., Miquel, A., Antonini, A., Passoni, G., and Archetti, R. (2013). Modeling of a Point Absorber for Energy Conversion in Italian Seas. Energies 6, 3033–3051. doi:10.3390/en6063033
Bruno, M., Maccanti, M., Sabbetta, A., Neri, E., Patrizi, N., Pulselli, R. M., et al. (2022). Benchmarking Marine Energy Technologies through LCA: Wave Energy Converters in the Mediterranean. Front. Energy Res. In press (this research topic).
Buccino, M., Dentale, F., Salerno, D., Contestabile, P., and Calabrese, M. (2016). The Use of CFD in the Analysis of Wave Loadings Acting on Seawave Slot-Cone Generators. Sustainability 8, 1255. doi:10.3390/su8121255
Carillo, A., Lombardi, E., and Sannino, G. (2013). Report di sintesi sulla realizzazione di un sistema operativo per la previsione dell’energia da moto ondoso. RdS/2013/085.
Carillo, A., Lombardi, E., and Sannino, G. (2014). Validazione del sistema operativo per la previsione del moto ondoso nel Mediterraneo. RdS/PAR2014/238.
Carillo, A., Pisacane, G., and Struglia, M. V. (2022). Exploitation of an Operative Wave Forecast System for Energy Resource Assessment in the Mediterranean Sea. Front. Energy Res. In press (this research topic).
Carillo, A., Sannino, G., and Lombardi, E. (2015). Wave Energy Potential: A Forecasting System for the Mediterranean Basin. Energ. Ambiente Innov. 61 (special n. 2), 16–21.
Chatzigiannakou, M. A., Dolguntseva, I., and Ekström, R. L. (2015)). “Offshore Deployment of Marine Substation in the Lysekil Research Site,” in Proceedings of the Twenty-fifth (2015) International Ocean and Polar Engineering Conference Kona, Hawaii, USA, June 21-26, 2015. Big Island. ISBN 978-1-880653-89-0; ISSN 1098-6189.
Chatzigiannakou, M., Dolguntseva, I., and Leijon, M. (2017). Offshore Deployments of Wave Energy Converters by Seabased Industry AB. Jmse 5, 15. doi:10.3390/jmse5020015
Chipindula, J., Botlaguduru, V., Du, H., Kommalapati, R., and Huque, Z. (2018). Life Cycle Environmental Impact of Onshore and Offshore Wind Farms in Texas. Sustainability 10, 2022. doi:10.3390/su10062022
Coiro, D. P., Troise, G., and Bizzarrini, N. (2018). Experiences in Developing Tidal Current and Wave Energy Devices for Mediterranean Sea. Front. Energy Res. 6, 136. doi:10.3389/fenrg.2018.00136
Coiro, D. P., Troise, G., Ciuffardi, T., and Sannino, G. (2013). “Tidal Current Energy Resource Assessment: the Strait of Messina Test Case,” in 2013 International Conference on Clean Electrical Power, Alghero, Italy (ICCEP), 213–220. doi:10.1109/ICCEP.2013.6586992
Coiro, D. P., Troise, G., Scherillo, F., De Marco, A., Calise, G., and Bizzarrini, N. (2017). Development, Deployment and Experimental Test on the Novel Tethered System GEM for Tidal Current Energy Exploitation. Renew. Energy 114, 323–336. doi:10.1016/j.renene.2017.01.040
COM (2020). An EU Strategy to Harness the Potential of Offshore Renewable Energy for a Climate Neutral Future. Brussels, Belgium: EU Commission. Brussels. 741.
Contestabile, P., Di Lauro, E., Buccino, M., and Vicinanza, D. (2017). Economic Assessment of Overtopping BReakwater for Energy Conversion (OBREC): a Case Study in Western Australia. Sustainability 9, 51. doi:10.3390/su9010051
Contestabile, P., Ferrante, V., Di Lauro, E., and Vicinanza, D. (2016). “Prototype Overtopping Breakwater for Wave Energy Conversion at Port of NaplesProceedings of the Twenty-Sixth,” in International Ocean and Polar Engineering Conference (Rhodes, Greece. 978-1-880653-88-3. June 26-July 1, 2016ISSN 1098-6189.
Curto, D., Franzitta, V., and Guercio, A. (2021). Sea Wave Energy. A Review of the Current Technologies and Perspectives. Energies 14, 6604. doi:10.3390/en14206604
EEA European Environment Agency (2022). Greenhouse Gas Emission Intensity of Electricity Generation in Europe. Published: 18 November 2021. Available at: https://www.eea.europa.eu/ims/greenhouse-gas-emission-intensity-of-1.
EMODnet (2021). EMODnet. Available at: https://emodnet.ec.europa.eu/.
ENERCOAST (2014). “Renewable Energies in the Marine-Coastal Areas of the Adriatic-Ionian Region,” in Project Deliverable “Technical, Environmental and Economic Analysis of Low and Medium Size of Solar Cooling Systems, Heat Pumps with Sea Water, Wind Turbines and Tidal Current Technologies. Available at: https://bib.irb.hr/datoteka/784638.ENERCOAST_Technology_data.pdf (Accessed on April 01, 2022).
EWP Eco Wave Power (2022). How it Works. Available at: https://www.ecowavepower.com/our-technology/how-it-works/(accessed on March 29, 2022).
EWP Eco Wave Power (2019). Invitation to Subscribe for Shares in EWPG Holding AB (Publ). Review Report. Stockholm, June 26, 2019. Available at: https://www.ecowavepower.com/wp-content/uploads/2019/07/EWP_prospekt_EN.pdf (Accessed on March 29, 2022).
Falcão, A. F. O., and Henriques, J. C. C. (2016). Oscillating-water-column Wave Energy Converters and Air Turbines: A Review. Renew. Energy 85, 1391–1424. doi:10.1016/j.renene.2015.07.086
Faÿ, F.-X., Henriques, J. C., Kelly, J., Mueller, M., Abusara, M., Sheng, W., et al. (2020). Comparative Assessment of Control Strategies for the Biradial Turbine in the Mutriku OWC Plant. Renew. Energy 146, 2766–2784. doi:10.1016/j.renene.2019.08.074
Fries, S. (2021). Transforming Energy Systems: Economics, Policies and Change. Cheltenham, United Kingdom: Edward Elgar Publishing.
Geofabrik (2007). Geofabrik. Available at: https://www.geofabrik.de.
Global Wind Atlas (2015). Global Wind Atlas. Available at: https://globalwindatlas.info/.
González, A., Kelly, C., and Rymszewicz, A. (2020). Advancements in Web‐mapping Tools for Land Use and Marine Spatial Planning. Trans. GIS 24 (2), 253–267.
Greek Government Geodata (2018). Greek Government Geodata. Available at: http://geodata.gov.gr/.
Greek Ministry of Maritime Affairs (2020). Greek Ministry of Maritime Affairs. Available at: https://www.ynanp.gr/.
Grip, K., and Blomqvist, S. (2021). Marine Spatial Planning: Coordinating Divergent Marine Interests. Ambio 50 (6), 1172–1183. doi:10.1007/s13280-020-01471-0
Helm, C., and Mier, M. (2021). Steering the Energy Transition in a World of Intermittent Electricity Supply: Optimal Subsidies and Taxes for Renewables and Storage. J. Environ. Econ. Manag. 109, 102497. doi:10.1016/j.jeem.2021.102497
Howells, M., and Ramírez-Monsalve, P. (2022). Maritime Spatial Planning on Land? Planning for Land-Sea Interaction Conflicts in the Danish Context. Plan. Pract. Res. 37 (2), 152–172. doi:10.1080/02697459.2021.1991656
Ibarra-Berastegi, G., Sáenz, J., Ulazia, A., Serras, P., Esnaola, G., and Garcia-Soto, C. (2018). Electricity Production, Capacity Factor, and Plant Efficiency Index at the Mutriku Wave Farm (2014-2016). Ocean. Eng. 147, 20–29. doi:10.1016/j.oceaneng.2017.10.018
Ibarra-Berastegi, G., Ulazia, A., Sáenz, J., Serras, P., González Rojí, S. J., Esnaola, G., et al. (2021). The Power Flow and the Wave Energy Flux at an Operational Wave Farm: Findings from Mutriku, Bay of Biscay. Ocean. Eng. 227, 108654. doi:10.1016/j.oceaneng.2021.108654
IPCC (2022). Climate Change 2022 Impacts, Adaptation and Vulnerability. Contribution of Working Group II to the Sixth Assessment Report of the Intergovernmental Panel on Climate Change.
Kallos, G. (1997)). “The Regional Weather Forecasting System SKIRON,” in Proceedings, Symposium on Regional Weather Prediction on Parallel Computer Environments, 15–17.
Kokologos, D., Tsitoura, I., Kouloumpis, V., and Tsoutsos, T. (2014). Visual Impact Assessment Method for Wind Parks: A Case Study in Crete. Land Use Policy 39, 110–120. doi:10.1016/j.landusepol.2014.03.014
Kyriazi, Z., Maes, F., and Degraer, S. (2016). Coexistence Dilemmas in European Marine Spatial Planning Practices. The Case of Marine Renewables and Marine Protected Areas. Energy Policy 97, 391–399. doi:10.1016/j.enpol.2016.07.018
Kyvelou, S. (2017). Maritime Spatial Planning as Evolving Policy in Europe: Attitudes, Challenges, and Trends. Eur. Q. Political Attitudes Ment. 6 (3), 1–13.
MAESTRALE (2019). Interreg Med Project Official Website. Available at: https://maestrale.interreg-med.eu.
MAESTRALE webgis (2018). MAESTRALE Webgis. Available at: http://maestrale-webgis.unisi.it.
Malara, G., Romolo, A., Fiamma, V., and Arena, F. (2017). On the Modelling of Water Column Oscillations in U-OWC Energy Harvesters. Renew. Energy 101, 964–972. doi:10.1016/j.renene.2016.09.051
Marchesi, E., Negri, M., and Malavasi, S. (2020). Development and Analysis of a Numerical Model for a Two-Oscillating-Body Wave Energy Converter in Shallow Water. Ocean. Eng. 214, 107765. doi:10.1016/j.oceaneng.2020.107765
Marine Vessel Traffic (2017). Marine Vessel Traffic. Available at: https://www.marinevesseltraffic.com/.
Maslov, N., Claramunt, C., Wang, T., and Tang, T. (2017). Evaluating the Visual Impact of an Offshore Wind Farm. Energy Procedia 105, 3095–3100. doi:10.1016/j.egypro.2017.03.649
Mattiazzo, G. (2019). State of the Art and Perspectives of Wave Energy in the Mediterranean Sea: Backstage of ISWEC. Front. Energy Res. 7, 114. doi:10.3389/fenrg.2019.00114
Migliore, G., Alisi, C., Sprocati, A. R., Massi, E., Ciccoli, R., Lenzi, M., et al. (2012). Anaerobic Digestion of Macroalgal Biomass and Sediments Sourced from the Orbetello Lagoon, Italy. Biomass Bioenergy 42, 69–77. doi:10.1016/j.biombioe.2012.03.030
Molina-Ruiz, J., Martínez-Sánchez, M. J., Pérez-Sirvent, C., Tudela-Serrano, M. L., and García Lorenzo, M. L. (2011). Developing and Applying a GIS-Assisted Approach to Evaluate Visual Impact in Wind Farms. Renew. Energy 36, 1125–1132. doi:10.1016/j.renene.2010.08.041
Molnarova, K., Sklenicka, P., Stiborek, J., Svobodova, K., Salek, M., and Brabec, E. (2012). Visual Preferences for Wind Turbines: Location, Numbers and Respondent Characteristics. Appl. Energy 92, 269–278. doi:10.1016/j.apenergy.2011.11.001
Moodie, J. R., and Sielker, F. (2022). Transboundary Marine Spatial Planning in European Sea Basins: Experimenting with Collaborative Planning and Governance. Plan. Pract. Res. 37 (3), 317–332. doi:10.1080/02697459.2021.2015855
Napolitano, E., Iacono, R., Palma, M., Sannini, G., Carillo, A., Lombardi, E., et al. (2022). MITO: a New Operational Model for the Forecasting of the Mediterranean Sea Circulation. Front. Energy Res. In press (this research topic).
Natura (2000). Natura. Available at: https://natura2000.eea.europa.eu/.
Negri, M., and Malavasi, S. (2018). Wave Energy Harnessing in Shallow Water through Oscillating Bodies. Energies 11, 2730. doi:10.3390/en11102730
Nordic Heat Pump (2017). How Low Can Nordic Heat Pumps Go? Available at: https://www.nordicghp.com/2017/01/heat-pump-effective-temperature-range/ (Accessed on April 01, 2022).
Offei, F., Mensah, M., Thygesen, A., and Kemausuor, F. (2018). Seaweed Bioethanol Production: A Process Selection Review on Hydrolysis and Fermentation. Fermentation 4 (4), 99. doi:10.3390/fermentation4040099
Palma, M., Iacono, R., SanninoBargagli, G. A., Bargagli, A., Carillo, A., Fekete, B. M., et al. (2020). Short-term, Linear, and Non-linear Local Effects of the Tides on the Surface Dynamics in a New, High-Resolution Model of the Mediterranean Sea Circulation. Ocean. Dyn. 70, 935–963. doi:10.1007/s10236-020-01364-6
Pantusa, D., Francone, A., and Tomasicchio, G. R. (2020). Floating Offshore Renewable Energy Farms. A Life-Cycle Cost Analysis at Brindisi, Italy. Energies 13, 6150. doi:10.3390/en13226150
Pantusa, D., and Tomasicchio, G. R. (2019). Large-scale Offshore Wind Production in the Mediterranean Sea. Cogent Eng. 6 (1), 1661112. doi:10.1080/23311916.2019.1661112
Paolinelli, G., Fortuna, L., Marinaro, L., and Valentini, A. (2022). On Marine Wind Power Expressiveness: Not Just an Issue of Visual Impact. Front. Energy Res. In press (this research topic).
Parker, R. P. M., Harrison, G. P., and Chick, J. P. (2007). Energy and Carbon Audit of an Offshore Wave Energy Converter. Proc. Institution Mech. Eng. Part A J. Power Energy 221, 1119–1130. doi:10.1243/09576509JPE483
Patrizi, N., Pulselli, R. M., Neri, E., Niccolucci, V., Vicinanza, D., Contestabile, P., et al. (2019). Lifecycle Environmental Impact Assessment of an Overtopping Wave Energy Converter Embedded in Breakwater Systems. Front. Energy Res. 7, 32. doi:10.3389/fenrg.2019.00032
Petit, V. (2018). The New World of Utilities: A Historical Transition towards a New Energy System. Springer.
Pisacane, G., Sannino, G., Carillo, A., Struglia, M. V., and Bastianoni, S. (2018). Marine Energy Exploitation in the Mediterranean Region: Steps Forward and Challenges. Front. Energy Res. 6. doi:10.3389/fenrg.2018.00109
Poujol, B., Prieur‐Vernat, A., Dubranna, J., Besseau, R., Blanc, I., and Pérez‐López, P. (2020). Site‐specific Life Cycle Assessment of a Pilot Floating Offshore Wind Farm Based on Suppliers' Data and Geo‐located Wind Data. J. Industrial Ecol. 24, 248–262. doi:10.1111/jiec.12989
Pulselli, R. M., Maccanti, M., Bruno, M., Sabbetta, A., Neri, E., Patrizi, N., et al. (2022). Benchmarking Marine Energy Technologies through LCA: Offshore Floating Wind Farms in the Mediterranean. Front. Energy Res. 10, 902021. doi:10.3389/fenrg.2022.902021
Pulselli, R. M., Marchi, M., Neri, E., Marchettini, N., and Bastianoni, S. (2018). Carbon Accounting Framework for Decarbonisation of European City Neighbourhoods. J. Clean. Prod. 208, 850–868.
Quero García, P., Chica Ruiz, J. A., and García Sanabria, J. (2020). Blue Energy and Marine Spatial Planning in Southern Europe. Energy Policy 140, 111421. doi:10.1016/j.enpol.2020.111421
Raadal, H. L., Vold, B. I., Myhr, A., and Nygaard, T. A. (2014). GHG Emissions and Energy Performance of Offshore Wind Power. Renew. Energy 66, 314–324. doi:10.1016/j.renene.2013.11.075
Rémouit, F., Chatzigiannakou, M.-A., Bender, A., Temiz, I., Sundberg, J., and Engström, J. (2018). Deployment and Maintenance of Wave Energy Converters at the Lysekil Research Site: A Comparative Study on the Use of Divers and Remotely-Operated Vehicles. Jmse 6, 39. doi:10.3390/jmse6020039
Salvador, S., Gimeno, L., and Sanz Larruga, F. J. (2019). The Influence of Maritime Spatial Planning on the Development of Marine Renewable Energies in Portugal and Spain: Legal Challenges and Opportunities. Energy Policy 128, 316–328. doi:10.1016/j.enpol.2018.12.066
Seapower scrl (2022). Horizontal Axis Marine Turbine. Available at: http://www.seapowerscrl.com/ocean-and-river-system/gem#slide_5 (Accessed on March 31, 2022).
Seghetta, M., Hou, X., Bastianoni, S., Bjerre, A.-B., and Thomsen, M. (2016). Life Cycle Assessment of Macroalgal Biorefinery for the Production of Ethanol, Proteins and Fertilizers - A Step towards a Regenerative Bioeconomy. J. Clean. Prod. 137, 1158–1169. doi:10.1016/j.jclepro.2016.07.195
Sklenicka, P., and Zouhar, J. (2018). Predicting the Visual Impact of Onshore Wind Farms via Landscape Indices: A Method for Objectivizing Planning and Decision Processes. Appl. Energy 209, 445–454. doi:10.1016/j.apenergy.2017.11.027
Soukissian, T., Denaxa, D., Karathanasi, F., Prospathopoulos, A., Sarantakos, K., Iona, A., et al. (2017). Marine Renewable Energy in the Mediterranean Sea: Status and Perspectives. Energies 10, 1512. doi:10.3390/en10101512
Spanos, P. D., Strati, F. M., Malara, G., and Arena, F. (2018). An Approach for Non-linear Stochastic Analysis of U-Shaped OWC Wave Energy Converters. Probabilistic Eng. Mech. 54, 44–52. doi:10.1016/j.probengmech.2017.07.001
Stančin, H., Pfeifer, A., Perakis, C., Stefanatos, N., Damasiotis, M., Magaudda, S., et al. (2022). Blue Energy Spearheading the Energy Transition: The Case of Crete. Front. Energy Res. 10, 863664. doi:10.3389/fenrg.2022.868334
Stival, C. A. (2014). “Methodological Approach for Recovery and Energetic Requalification of Historical Buildings. Fondazione Internazionale Trieste per il Progresso e la Libertà delle Scienze,” in Proceedings of the Workshop on Geothermal Energy. Status and future in the Peri - Adriatic Area, Veli Losinj (HR), 25-27 August 2014. Available at: https://www.researchgate.net/publication/303507189.
Strömstedt, E., Svensson, O., and Leijon, M. (2012). A Set-Up of 7 Laser Triangulation Sensors and a Draw-Wire Sensor for Measuring Relative Displacement of a Piston Rod Mechanical Lead-Through Transmission in an Offshore Wave Energy Converter on the Ocean Floor. ISRN Renew. Energy 2012, 1–32. Article ID 746865. doi:10.5402/2012/746865
SWEL Sea Wave Energy Ltd (2022). SWEL Sea Wave Energy Ltd Research. Available at: https://swel.eu/research/(Accessed on March 31, 2022).
Takacs, B., and Goulden, M. C. (2019). Accuracy of Wind Farm Visualisations: The Effect of Focal Length on Perceived Accuracy. Environ. Impact Assess. Rev. 76, 1–9. doi:10.1016/j.eiar.2019.01.001
Tedesco, M., Brauns, E., Cipollina, A., Micale, G., Modica, P., Russo, G., et al. (2015). Reverse Electrodialysis with Saline Waters and Concentrated Brines: a Laboratory Investigation towards Technology Scale-Up. J. Membr. Sci. 492, 9–20. doi:10.1016/j.memsci.2015.05.020
Tedesco, M., Cipollina, A., Tamburini, A., and Micale, G. (2017). Towards 1 kW Power Production in a Reverse Electrodialysis Pilot Plant with Saline Waters and Concentrated Brines. J. Membr. Sci. 522, 226–236. doi:10.1016/j.memsci.2016.09.015
Tedesco, M., Scalici, C., Vaccari, D., Cipollina, A., Tamburini, A., and Micale, G. (2016). Performance of the First Reverse Electrodialysis Pilot Plant for Power Production from Saline Waters and Concentrated Brines. J. Membr. Sci. 500, 33–45. doi:10.1016/j.memsci.2015.10.057
Tethys (2022). Eco Wave Power Ltd. Available at: https://tethys.pnnl.gov/organization/eco-wave-power-ltd (Accessed on March 29, 2022).
Thomson, R. C., Chick, J. P., and Harrison, G. P. (2019). An LCA of the Pelamis Wave Energy Converter. Int. J. Life Cycle Assess. 24, 51–63. doi:10.1007/s11367-018-1504-2
Thomson, R. C., Harrison, G. P., and Chick, J. P. (2011). “Life Cycle Assessment in the Marine Renewable Energy Sector,” in LCA Report - Instruments for Green Futures Markets: Proceedings from the LCA XI International Conference (Chicago, IL, United States: American Center for Life Cycle Assessment), 120–125. Available at: http://lcacenter.org/Data/Sites/1/lcaxi/LCA%20XI%20Proceedings%20Final%20Version.pdf.October 4-6, 2011LCA XI, Chicago, United States, 4/10/11.
Tsai, L., Kelly, J. C., Simon, B. S., Chalat, R. M., and Keoleian, G. A. (2016). Life Cycle Assessment of Offshore Wind Farm Siting: Effects of Locational Factors, Lake Depth, and Distance from Shore. J. Industrial Ecol. 20 (Number 6), 1370–1383. doi:10.1111/jiec.12400
Twomey, S., and O’Mahony, C. (2019). “Stakeholder Processes in Marine Spatial Planning: Ambitions and Realities from the European Atlantic Experience,” in Maritime Spatial Planning: Past, Present, Future. Editors J. Zaucha, and K. Gee (Cham: Palgrave Macmillan), 295–325. doi:10.1007/978-3-319-98696-8_13
Vannucchi, V., and Cappietti, L. (2016). Wave Energy Assessment and Performance Estimation of State of the Art Wave Energy Converters in Italian Hotspots. Sustainability 8, 1300. doi:10.3390/su8121300
Weinzettel, J., Reenaas, M., Solli, C., and Hertwich, E. G. (2009). Life Cycle Assessment of a Floating Offshore Wind Turbine. Renew. Energy 34, 742–747. doi:10.1016/j.renene.2008.04.004
Zaucha, J., and Kreiner, A. (2021). Engagement of Stakeholders in the Marine/maritime Spatial Planning Process. Mar. Policy 132, 103394. doi:10.1016/j.marpol.2018.12.013
Zhao, Y., Ma, L., Li, Z., and Ni, W. (2021). The Development of Regional Smart Energy Systems in the World and China: The Concepts, Practices, and a New Perspective. Wiley Interdiscip. Rev. Data Min. Knowl. Discov. 11 (6), e1409. doi:10.1002/widm.1409
Keywords: marine energy sources, offshore wind farms (OWFs), wave energy converters (WECs), stakeholders engagement, energy transition
Citation: Pulselli RM, Struglia MV, Maccanti M, Bruno M, Patrizi N, Neri E, Carillo A, Napolitano E, Stefanatos N, Perakis C, Damasiotis M, Di Pietrantonio F, Magaudda S, Madalena V, Stančin H, Mikulčić H, Petrou V, Smagas K, Valari E, Shakou LM and Bastianoni S (2022) Integrating Blue Energy in Maritime Spatial Planning of Mediterranean Regions. Front. Energy Res. 10:939961. doi: 10.3389/fenrg.2022.939961
Received: 09 May 2022; Accepted: 21 June 2022;
Published: 15 August 2022.
Edited by:
Biagio Fernando Giannetti, Paulista University, BrazilReviewed by:
Alessio Tei, University of Genoa, ItalyHale Özgit, Cyprus International University, Cyprus
Maxim A. Dulebenets, Agricultural and Mechanical University, United States
Copyright © 2022 Pulselli, Struglia, Maccanti, Bruno, Patrizi, Neri, Carillo, Napolitano, Stefanatos, Perakis, Damasiotis, Di Pietrantonio, Magaudda, Madalena, Stančin, Mikulčić, Petrou, Smagas, Valari, Shakou and Bastianoni. This is an open-access article distributed under the terms of the Creative Commons Attribution License (CC BY). The use, distribution or reproduction in other forums is permitted, provided the original author(s) and the copyright owner(s) are credited and that the original publication in this journal is cited, in accordance with accepted academic practice. No use, distribution or reproduction is permitted which does not comply with these terms.
*Correspondence: Riccardo Maria Pulselli, cmljY2FyZG9tYXJpYS5wdWxzZWxsaUB1bmlmaS5pdA==