 R. Sitharthan1*
 Karthikeyan Madurakavi2I. Jacob Raglend1
 K. Palanisamy1J. Belwin Edward1M. Rajesh3Shanmuga Sundar Dhanabalan4
- 1School of Electrical Engineering, Vellore Institute of Technology, Vellore, India
- 2School of Electronics Engineering, Vellore Institute of Technology, Vellore, India
- 3Department of Computer Science Engineering, Sanjivani College of Engineering, Kopargaon, India
- 4Functional Materials and Microsystems Research Group, RMIT University, Melbourne, VIC, Australia
The DC Microgrid sounds familiar in recent days for its independent grid operation and energizing small communities without relying on the central grid. The sudden change in energy demand in the microgrid can negatively impact its performance and operation. Energy management is the only optimal solution to the energy production of microgrids. This article -discusses an economically operated DC microgrid for rural electrification with a tri-port converter based on the radial basis function neural network (RBFNN)-based intelligent control strategy to provide enhanced performance to the microgrid. The advantage of the proposed system is that it provides optimal energy management solutions during dynamic loading conditions and enhances the operation of the microgrid. The outstanding aspect of the proposed system is that it boosts the conversion operation and effectively manages the battery energy storage system to supply energy to the domestic loads and supply power to the grid during excess power generation. In the assessment, the rural regions of Tamilnadu and Andhra Pradesh, India, have been considered to enhance the microgrid setup. The performance evaluation of the proposed system has been conducted and validated using an experimental setup. The assessment also discusses the economic and environmental analysis in using the proposed system. The results support the performance and efficiency of the proposed model.
1 Introduction
The energy crisis is one of the vital problems faced by the world today. On taking environmental issues as a major concern, major power sectors have started generating electricity through renewable energy (RE) resources (Bogdanov et al., 2021). The RE sources that are connected to power up a small community or urban location without the support of a central grid is named as a microgrid (Sitharthan et al., 2016). When the microgrid has the feature of energy sharing and trading, then it is called a smart microgrid (SM) (Khorasany et al., 2020). A SM has wide advantages in energizing small communities without the support of the central grid, and it has the features of energy sharing and trading with high stability and security. But the SM gets affected by changes in sudden demand patterns (ur Rehman, 2020). The change in sudden demand patterns could collapse the SM and the failure of the electrical equipment connected to the SM system.
To tackle the change in sudden demand patterns, energy management is the optimal solution for energy production in the SM (England and Alouani, 2020). Several approaches have discussed the energy management solution for the SM (Ahmed et al., 2020; Hosseini et al., 2020; Khattak et al., 2020; Mohamed et al., 2021; Sadek et al., 2021). Blockchain-based energy management for smart cities has been discussed in Khattak et al. (2020). The blockchain application enables the users in the smart grid environment to perform peer-to-peer energy trading and also provides dynamic tariff calculations to the users. It also automates the energy demand and supply and provides price bidding based on the demand and supply. Furthermore, the blockchain also provides privacy and security to the SM. Optimal power management for renewable energy-based smart grids has been discussed in Hosseini et al. (2020). The method uses an algorithm to optimize the supply and demand-side management of the smart grid, and it uses the AI technique for optimal energy management (Ahmed et al., 2020). This work comprises machine learning with the Gaussian process regression (GPR) to develop standard energy management. The work has been split into two stages: initially, performance parameters have been identified and are trained. Then, the source and demand in the RE have been optimized. Finally, they are compared based on the changes, and an optimal solution for energy management is provided. An energy management solution with a two-stage strategy for the isolated microgrid has been developed (Sadek et al., 2021). Energy management provides an optimal solution during RE uncertainty by reducing the operating cost of the SM system. In this study, the cost function of the RE, diesel generator, and inverter operation has been considered, and the capability curve has been provided. The fuzzy-based cloud-enabled approach has been developed to provide an energy management solution for the RE-based microgrid (Mohamed et al., 2021). The proposed approach provides the best solution to energy management considering the different parameters.
Although energy management is important in the SM, an appropriate technique for achieving energy management is vital, and it can be achieved effectively by a converter control strategy (Jia-You Lee et al., 1999; Li et al., 2014; Bilakanti et al., 2017; Hu et al., 2017; Sitharthan and Geethanjali, 2017; Wu et al., 2019). A modular tri-port high-power converter has been proposed (Hu et al., 2017). The developed converter is capable of connecting multiple energy devices to a single converter. It also provides flexible energy management solutions and also different winding connections based on the loading condition. A bidirectional tri-port converter improves the duty cycle and enhances the performance of the overall system (Li et al., 2014). These facilitate the charging of the battery without any additional circuit. A converter with isolated soft-switching has been developed to integrate RE-PV and battery into the grid network (Bilakanti et al., 2017). The developed strategy eliminated the need for the DC capacitor in the back-to-back conversion operation. It provides a high conversion rating with energy management. A boost rectifier cascaded high-frequency tri-port converter has been developed (Jia-You Lee et al., 1999). The converter connects the RE with the load through a tri-port converter, which enables flexible charging to the battery. A tri-port converter for electrical vehicles has been developed (Wu et al., 2019). It enables flexible charging of the electric vehicle with fast charging. From these literature surveys, it is evident that flexible charging and energy management are possible through the tri-port converter. By changing the control strategy, optimal energy management can be achieved. The control strategy through the intelligent neural network can improve the performance of the switching pattern (Sitharthan and Geethanjali, 2017). Boost conversion provides the system’s best performance (Srinivasan et al., 2021). The survey confirms the need for a flexible energy management strategy for the SM, and it also identifies that can be achieved by using an intelligent tri-port converter.
This study discusses an economically operated DC microgrid for rural electrification with a tri-port converter based on the radial basis function neural network (RBFNN)-based intelligent control strategy to provide enhanced performance to the microgrid. The combination of PV/wind and a wind-piezoelectric crystal has been used to create a microgrid setup with a 2.5 kW power rating. The advantage of the proposed system is that it provides optimal energy management solutions during dynamic loading conditions and enhances the operation of the microgrid. The outstanding aspect of the proposed system is that it boosts the conversion operation and effectively manages the battery energy storage system to supply energy to the domestic loads and supply power to the grid during the excess power generation. A significant advantage of the proposed topology is the elimination of DC capacitors which are major life-limiting components in a DC-AC inverter. The tri-port converter can be designed to connect to single-phase or split-phase AC grids, realizing soft-switching across the entire range of operating load levels. In the assessment, the rural region is considered and also discusses the economic and environmental analysis in using the proposed system. In the assessment, the rural regions of Tamilnadu and Andhra Pradesh, India, have been considered to enhance the microgrid setup. The performance evaluation of the proposed system has been conducted and validated using an experimental setup. The assessment also discusses the economic and environmental analysis in using the proposed system. The results support the performance and efficiency of the proposed model.
The article comprises introduction in Section 1, providing the previous literature in brief. The effect of change in sudden demand patterns in microgrids has been discussed in Section 2. Developed system modeling has been discussed in Section 3. Flexible energy control of smart microgrids with the proposed system has been discussed in Section 5. Section 6 comprehends the profound simulation results and discussion. The conclusion of the work is given in Section 7.
2 Effect of Change in Sudden Demand Patterns in the Microgrid
The microgrid network gets affected when there is a change in sudden demand patterns. Any uneven demand can negatively impact the grid frequency. Furthermore, it leads to the collapse of the entire grid network. There are two different patterns of changes that can occur in the microgrid. They are in low demand and high demand. The low demand occurs when the power generation exceeds the requirement and too much electricity is fed into the microgrid network. These changes increase the electrical frequency and cause a high risk in the grid network. The high demand occurs with low electricity availability. The demand increase during the peak demand hour makes frequency drop and causes power quality issues (Sun et al., 2020). The smart microgrid gets disconnected and completely power blackout in both cases to avoid equipment failure. Hence, to protect the smart microgrid, an energy management solution is required.
3 Investigated System Modeling and Description
The studied hybrid power generation system setup comprises a wind power generation system and a PV-based power generation system. Hence, modeling of the individual setup is important in this study. The combination of PV/wind and a wind-piezoelectric crystal creates a microgrid setup with a 2.5 kW power rating. The block diagram of the developed microgrid system is shown in Figure 1. The developed power generated by the PV/wind and wind-piezoelectric crystal has been fed into a 24-V DC bus system. The output from the DC bus system is used to charge the battery set through the developed tri-port charge controller, and furthermore, the DC power is converted into AC power by means of a DC/AC inverter. The inverted AC is connected to terminal 1 of the single-pole double-throw (SPDT) switch. Terminal 2 of the SPDT switch is connected to the grid supply. The main switch is connected to the 220 V, 50 Hz AC bus. The SPDT switch can be switched according to the power needed to satisfy the loads connected to the AC bus.
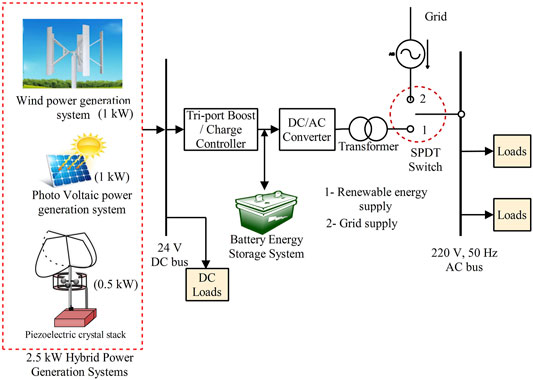
FIGURE 1. Developed smart microgrid for assessment.
3.1 Modeling of the 2.5-kW Hybrid Power Generation System
3.1.1 Modeling of the Wind Power Generation System
The wind power generation system modeled for the study is used (Adedeji et al., 2020; Nyeche and Diemuodeke, 2020). The mechanical power of the wind turbine is given as
where W represents the speed of the wind, A represents the blade spinning area, ρ represents the air density, and Cp (λ, β) represents the power coefficient of the wind turbine where the tip speed ratio λ and pitch angle is β, respectively. The wind turbine tip speed ratio corresponds to the power co-efficient by determining the rotor speed ωr, radius of the turbine blade R, and wind speed. The corresponding equation is given as
where Cp (λ, β) determines the performance of the wind turbine. The study system used a permanent magnet-based synchronous generator as a generator of WPGS.
3.1.2 Modeling of the PV Power Generation System
A solar-based cell is generally a p-n junction developed as a thin layer of a semiconductor. The electromagnetic radiation of solar energy can be straightforwardly changed over power through photovoltaic impact (Mohammad et al., 2020; Mousavi et al., 2020; Nyeche and Diemuodeke, 2020; Verma et al., 2021). The fundamental equation that characterizes the V-I characteristics of a solar cell can be derived from the equivalent circuit by applying Kirchhoff’s current law:
where I is the output current, ISC is the PV generated current, ID is the diode current, and Ish is the shunt current. The current induced by these cells governs a Vj voltage across the diode and shunt resistor.
where V is the terminal voltage, and by applying the Shockly diode equation, we obtain
where I0 is the reverse saturation current, n is the diode identity factor (1 for the ideal diode), q is the elementary charge, k is the Boltzmann constant, and T is the absolute temperature. Consequently, the shunt current can be written as follows:
The open-circuit voltage of the PV cell is given as follows:
Therefore, the short circuit current of the PV cell is given as follows:
A PV array is made out of series and equal associated modules, and the single-cell circuit can be increased to address any series/equal blend. The result got from the PV framework is taken care of in the inverter framework which is associated with the microgrid through the electrical switch. In this study, the solar power generation system has been developed by eight 270 W, 12 V polycrystalline silicon-based solar panels. They are arranged in series and parallel arrays to develop a 1 kW, 12 V power output. The extracted output voltage is integrated into the 24-V DC bus system, as shown in Figure 1.
3.1.3 Modeling of the Piezoelectric-Based Bladeless Wind Power Generation System
In this study, a piezoelectric crystal stack has been developed by means of thiol-capped zinc oxide and polyvinylidene fluoride. The developed piezoelectric crystal is arranged in a series stack to produce 0.5 W output power delivering a voltage of 18–20 V. The studied piezoelectric crystal is made of polyvinylidene fluoride. The polyvinylidene fluoride–based piezo crystal has been selected since it has the capability to produce higher power even at a low frequency with a power density of 60 × 10−6 g cm−3. The detailed modeling of the piezoelectric crystal–based wind power generation system is discussed in (R et al., 2021). The real power generated by the developed piezoelectric crystal-based wind power generation in root mean square (RMS) is given as follows:
where p(t) is the extracted power for the piezoelectric stack mounted to the cantilever at the time
The total power developed by the hybrid power generation system is given as follows:
4 Proposed Intelligent Tri-Port Converter for Flexible Energy Control and Energy Management in the SM
To improve the charging efficiency with low losses, a single-stage triple-port converter system has been developed. The single-stage triple-port converter (TPC) comprises a single-stage dc-to-dc converter with three ports consisting of a battery, hybrid system, and load ports. The compact structure of the proposed converter reduces the number of conversion stages; therefore, the efficiency of the converter is increased, and also, the control of the converter becomes simple. The developed converter is depicted in Figure 2. The developed converter has a voltage multiplier module that provides a good voltage gain. On the other hand, the three-port converter also provides a bidirectional flow of power between the source, battery, and load. The equivalent circuit of the proposed converter is shown in the figure, where L1, D1, and S1 represent the SM port inductor, diode, and switch, respectively; T1N1 and T2N2 specify the coupled inductor primary and secondary, S2 stands for the battery port switch, D01 and D02 represent the output diodes, C01 and C02 are the output capacitors, and Lm and Lk are the magnetizing and leakage inductor (Hu et al., 2015).

FIGURE 2. ENN-based tri-port converter block diagram.
The converter is directly fed to the battery and DC/AC inverter. When there is an excess of energy, for example., the supply is more than the demand, then the battery is charged, permitting the converter to work forward way. When there is a shortage in power, for example ., the supply is not as much to fulfill the demand, then the battery begins releasing, providing the shortfall of capacity to the load. Figure 3 shows the energy management flow chart of the developed converter control strategy. This makes the converter work backward bearing. The charging/discharging of the battery is finished with the assistance of a bidirectional converter.
When the switch is OFF, they are presented by
The second converter is a high-gain boost converter controlled by the second switch with a switching period of T and a duty cycle of D. During the continuous conduction mode of operation, the state space equations are as follows:

FIGURE 3. Energy management flow chart.
When the switch is OFF, the equations are represented by
4.1 Modes of Operation
The proposed converter is capable of maintaining continuous output voltage, owing to the mismatch arising between the generation and demand of its bidirectional power flow nature. When the demand is greater than the generation, then the battery discharges in order to supply power for the load demand. Similarly, when the demand is less than the power generation, then the battery charges from the surplus power. The operating modes of the proposed converter are determined by the power generated and the load demand. The following assumptions are made for simplification to understand the operating modes:
1) All the components are considered ideal.
2) Leakage inductors are ignored.
3) Voltages of the capacitors C01\ and C02 are assumed as constant.
Based on the assumptions made earlier, the operation of the converter during one switching cycle can be classified into five modes. The operating modes of the converter start at the time instant (zero) and end by time t4.
4.1.1 Mode 1 [0, t0]
At time 0, s2 is in the on state and S1 is in the off state. The current path is illustrated in Figure 4A. As S2 is on the voltage from the battery that is fed to the load through the coupled inductors, the current from the battery charges the coupled inductor linearly. The output capacitor (C01) starts to charge from the coupled inductor secondary side (T1N2) through the diode (D01); therefore, the voltage across the capacitor (C01) increases linearly. The output current (iOUT) at time 0 can be obtained from the following equation:
where VBAT is the voltage across the storage battery, VS2 is the voltage across the switch S2, Lm and iLm are the magnetizing inductance and its current, Lk and iLk are the leakage inductance of the coupled inductor secondary side and its current, VOUT and VD01 are the corresponding voltage across the load and diode (D01), respectively. The first mode ends when the switch (S1) is turned on at (t = t0\).
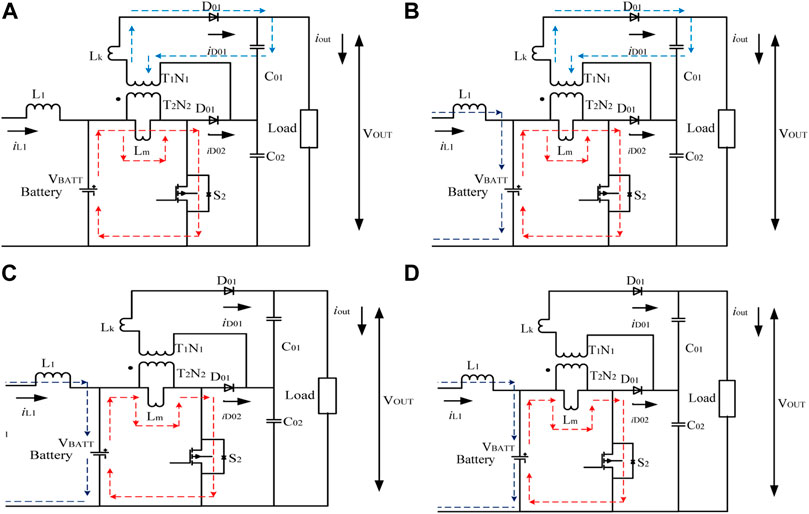
FIGURE 4. Modes of operation of the intelligent tri-port converter for flexible energy control and energy management in the SM.
4.1.2 Mode 2 [t0, t1]
At the time t0, both switches S1 and S2 are in the on state, and the current path is depicted in Figure 4B. Initially, the battery starts to charge by the PV through the inductor (L1), and the inductor current (iL1) increases linearly. Simultaneously, the battery feeds the coupled inductor primary side (T1N1) through the switch (S2); hence, the coupled inductor current increases linearly. In addition, the output capacitor (C01) charges from the coupled inductor secondary side (T1N2) through the diode (D01); therefore, the voltage across the output capacitor (C01) increases linearly. The output current (iout) at the time [t0] can be obtained from Eq. 13 as follows:
This mode ends when switch S2 is turned off.
4.1.3 Mode 3 [t1, t2]
Mode 3 starts at the time t1 when the switch S1 is on and S2 is turned off; the model is illustrated in Figure 4C. Inductor L1 is charged by PV current; therefore, iL1 increases linearly. Simultaneously, battery current and the stored energy in the coupled inductor primary side are delivered to the load causing the voltage across C02 to increase linearly. The output load current iOUT at time t1 can be obtained by Eq. 16:
where VC02 indicates the voltage across the output capacitor C02, and VD02 stands for the voltage of the output diode (D02). Mode 3 ends when the switch (S1) is turned off at (t = t2).
4.1.4 Mode 4 [t2, t3]
In mode 4 at time t2, both the switches S1 and S2 are in the off state. The current flow for mode 4 is shown in Figure 4D; the energy stored in the inductor (L1) starts to discharge to the battery through the diode D01, and therefore, the inductor current iL1 decreases linearly. Meanwhile, the battery provides power through the diode D02. The output current iOUT at time t2 can be obtained from Eq. 19 as follows:
where VD1 is the voltage of diode D1. Mode 4 continues until the inductor L2 current freewheeling is completed at t = t3.
4.1.5 Mode 5 [t3, t4]
In mode 5, at time t3, both the switches S1 and S2 are in the off state, and the current flow is illustrated in Figure 4. The energy stored in the coupled inductor T1N1 is discharged completely to C02 through D02. The output current iOUT at time t3 can be obtained from Eq. 21:
Mode 5 ends when switch S2 is turned on.
4.2 Radial Basis Function Neural Network Control Strategy
The architecture of the implemented RBFNN for the tri-port converter controller consists of two separate RBFNN sets for the d and q axis. The architecture of the d-axis RBFNN is shown in Figure 5. The NN consists of the input layer (i layer), the hidden layer (j layer), and the output layer (k layer). The controlled voltage is estimated by the NN by processing the measured and reference voltage at the load side as the inputs. The developed RBFNN consists of one output layer with one neuron and one hidden layer with ten neurons, respectively. The control function is defined as i*z, and the linearization of the control strategy to apply the RBFNN controller is discussed, and the basic function of each layer is given as follows (Sitharthan et al., 2020; Yang et al., 2020; Gadekallu et al., 2022; Sarkar et al., 2022).
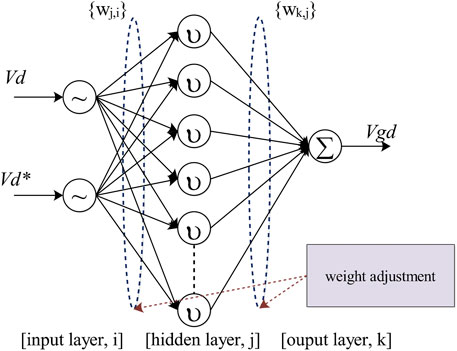
FIGURE 5. Architecture of the RBFNN.
The following are the steps performed:
The nth iteration is represented by
Layer 2 is the network’s hidden layer, with the membership function being a Gaussian function.
In (35), S() is the sigmoid function.
The final output of the number of layers included in the combination of hidden and input layers is often referred to as layer 3. The output layer is denoted by
where
By assigning the right weight function to the connecting weights wji and wkj, the learning process aims to reduce the total error. E gives the training progress error, which is expressed as follows:
The neural network is trained and tested using a specific learning pattern known as chain rules. The following are the rules of the process:
Rule 1: The weights
Consequently, the rationalization of weight
and then, the rationalized weight can be defined as
Rule 2 weights of
The weight
As a result, the connecting weight
where
5 Results and Discussion
To evaluate the contribution of the developed DC microgrid for rural electrification with a neural network-based tri-port converter for flexible energy control, the modeled experimental setup is subjected to the analysis under different conditions such as 1) performance analysis, 2) energy management and economic analysis, and 3) environmental contribution analysis.
Figure 6 depicts the experimental setup considered for the study. The PV system and WPGS are mounted on the rooftop. Figures 6A,B,D depict the PV/wind/ piezo-based hybrid power generation system. Figure 6C depicts the piezoelectric crystal stack which is made to be connected in parallel and covered by the PVC material to protect it from the environmental condition. The developed bladeless piezoelectric-based power generation system is mounted over a spring that oscillates to produce mechanical power by capturing the wind power. Figure 6E depicts the conversion process and 24-V bus system. In the developed system, the PV is connected parallelly, and WPGS is connected in series. The obtained voltage is fed to the 24-V bus system. The system is equipped with a proper CB to protect the system from faulty condition. Figure 6F depicts the power management control and the tri-port converter system. The developed hybrid power generation system is monitored, and power management is carried out by smartwatch power software. The software gives an accurate reading of the hybrid power generation system such as the input voltage and current, battery voltage and current, and rated information of the hybrid system. The developed hybrid power generated is fed to the AC grid through a 2.5-kW hybrid converter. The system is developed to operate in two modes, on-grid and off-grid. To study the characteristic of the system, the developed system undergoes performance enhancement analysis, economic analysis, and environmental contribution analysis.
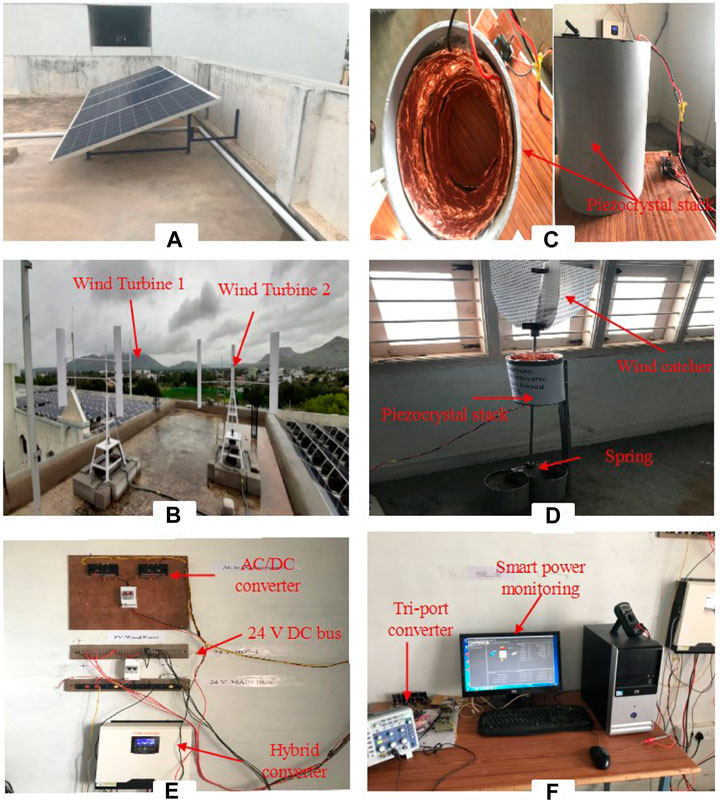
FIGURE 6. Experimental setup for the investigation.
5.1 Performance Enhancement Analysis
The performance analysis has been carried out under rural and urban environmental conditions. The hybrid power generation system is subjected to a wind speed of 6 m/s to 12 m/s and irradiation of 4.89 kWh/m2/day to 5.07 kWh/m2/day. In the developed system, the performance improvement is calibrated by the developed MPPT control strategy. The developed MPPT controller strategy for wind power generation systems uses tip speed ratio control to obtain optimal rotational speed ω*r. When the wind turbine is rationalized to rotate at optimal speed, it obtains the optimal tip speed ratio λopt. The developed wind turbine system delivers optimal power at the optimal tip speed ratio at certain wind speeds. Furthermore, the results obtained for the wind system are depicted in Figure 7. The wind power generation system attains an optimal tip speed ration (lambda) λopt- 6 with a power co-efficient of 0.476, as shown in Figures 7A,B.
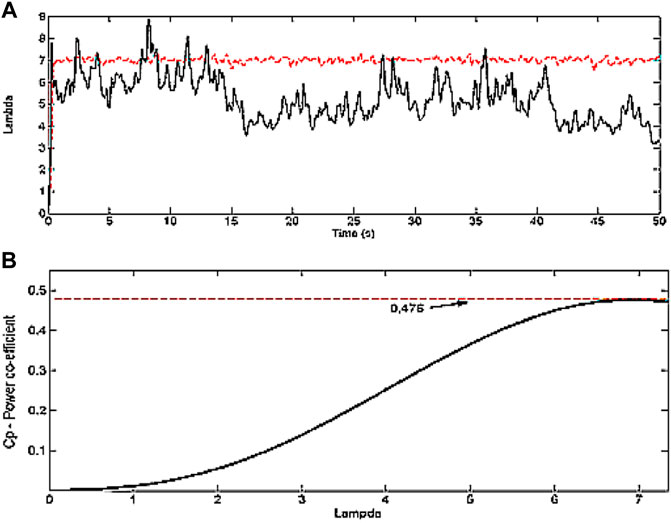
FIGURE 7. Performance analysis of the wind power generation system.
In a bladeless piezoelectric effect-based wind power generation system, a voltage regulator is employed to boost the voltage. The developed MPPT control strategy for PV systems uses the P and O method to obtain maximum power. It tracks the Voc based on the present value and past data fed to it. The results obtained for the PV are depicted in Figure 8. From Figures 8A,B it is observed that the PV attains an open circuit voltage of Voc—24 V and a short circuit current of Isc—5.3 A. From the figure, it is observed that the PV system tracks a maximum power of 200 W at 24 V.
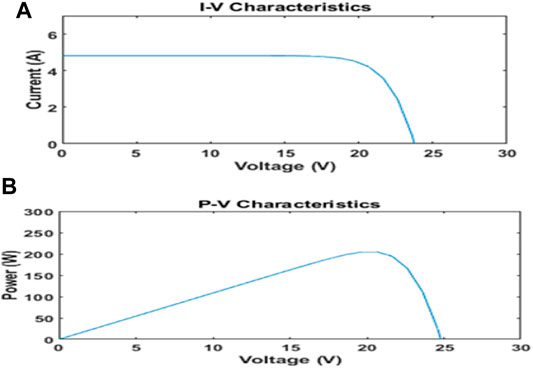
FIGURE 8. Performance analysis of the PV power generation system.
The voltage and current measured from the PV/wind/PEHS-based wind system are depicted in Figure 9. From Figure 9A, it is observed that the wind power generation system delivers a DC voltage of 24 V, with a current of 8 A into the DC bus. From Figure 9B, it is observed that the PV system delivers a DC voltage of 24 V with a current of 4.8 A into the DC bus. From Figure 9C, it is observed that the PEHS based on wind delivers a regulated voltage of 8 V with a current of 0.4 mA. Hence, the PEHS based on wind is studied separately. The DC bus is connected to a TPC. The signal pulse generation method for the TPC is shown in Figure 10. Spartan 6- xc6slx75t-csg484 has been employed in the analysis, which is integrated with the MATLAB system to generate the switching pulse to the TPC. The switching pulse fed to the TPC is depicted in Figure 11. The values obtained while evaluating the efficiency of the developed power generation system is listed in Table 1. From the table, it is observed that the wind power generation system works with an efficiency of 81% with an electrical output power of 384 W (calculated for a single system, two systems are been used in the present project) for an input mechanical power of 470 W calculated using Eqs 45–53 in rural conditions. Consequently, it delivers an efficiency of 63% with an electrical output power of 76.8 W for an input mechanical power of 121 W in urban conditions. Furthermore, the PV system works with an efficiency of 91% with an electrical output power of 192 (W) calculated for the single solar panel) for a solar energy input of 209.5 W calculated using the Eqs 46–48 for both rural and urban conditions. When calculating the efficiency of the bladeless piezoelectric-based wind system. The efficiency is observed to be very low as the stress and strain applied to the piezo crystal are very low. The mechanical input power applied is calculated using Eqs 49–51. The analysis proves the efficiency of the developed hybrid power generation system.
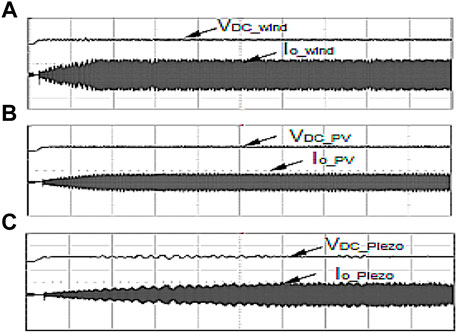
FIGURE 9. DC power is fed to the 24-V bus system.
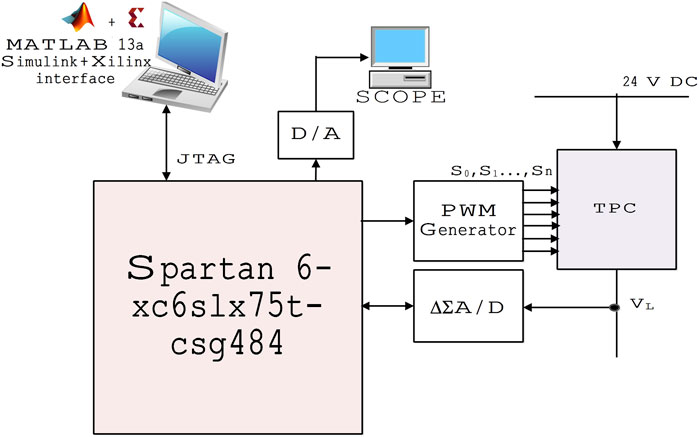
FIGURE 10. Pulse generation for the TPC Spartan 6- xc6slx75t-csg484.
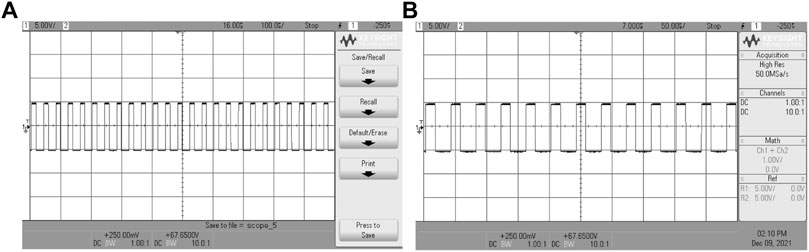
FIGURE 11. Simulated input pulse to the TPC.
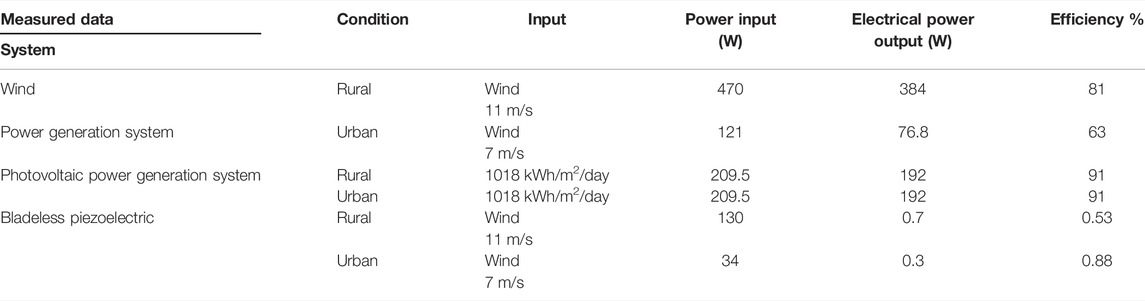
TABLE 1. Performance evaluation of the developed hybrid power generation system.
5.2 Energy Management and Economic Analysis
The economic analysis of the developed hybrid power generation system in the off-grid mode has been analyzed based on two case studies. The case study has been classified into two parts: case A–analysis using the grid supply and case B–analysis using a developed hybrid power generation system. In this case study, loads of the lab are considered as the primary load, and the power requirement by the load is depicted in Figure 12A. The average power generated by the hybrid power generation system is depicted in Figure 12B. In case A analysis, the load of the labs is satisfied by the grid power. The unit consumed is approximately 488 units. The electricity bill paid at Rs. 6.05/unit including ED cost is Rs. 3,615 (approximated to Rs. 3,000, considering vacation of 4 months), yearly: Rs. 36,000 is paid toward the EB bill. The installation charges including 1) EB charge, 2) accessory charge, and 3) operation charge are added up. Therefore, the total investment to get EB power is about Rs. 30,000. In the next case, when analyzing case B, the unit consumed is the same. But the only charge is an investment. An amount of Rs. 4,00,000 is invested to set a hybrid power generation system. In addition to that, Rs. 2,000 will be spent on the maintenance of the hybrid power generation system. The net balance cost after considering case A and case B is Rs. 370,000, as listed in Table 2.
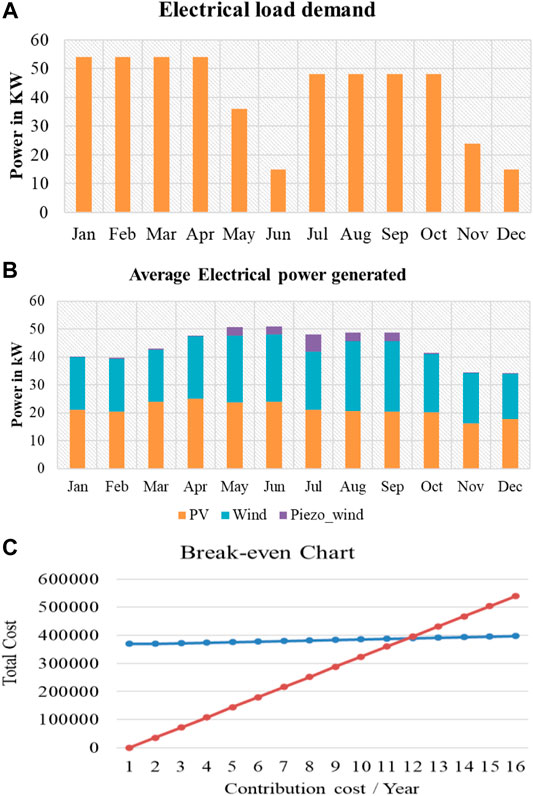
FIGURE 12. (A) Average load requirement measured in the case study. (B) Average electrical power generated by the DC microgrid. (C) Break-even chart of the developed system.
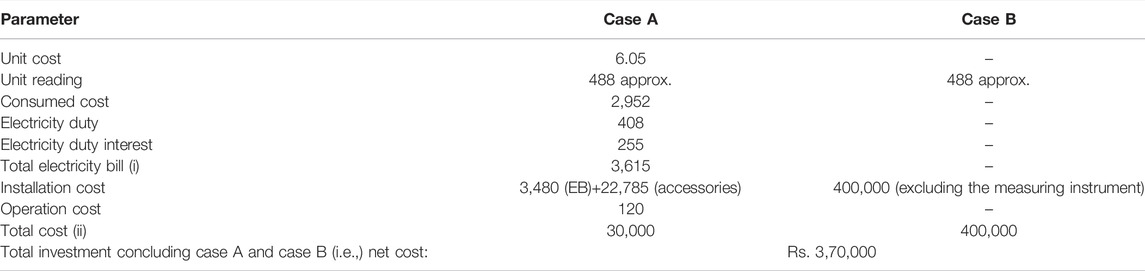
TABLE 2. Analysis of the developed hybrid power generation system.
To analyze the economical aspect, the break-even point calculation is carried out using Eq. 54. The values obtained are plotted in the break-even curve, as shown in Figure 12C. From the figure, it is identified that the breakpoint is 11 years and 3 months. Later, the power generated after 11 years and 3 months will be the profit to the investor. The life span of the hybrid power generation system is 25 years, and the net profit will be earned excluding the investment, which is approximately Rs. 600,000. From the analysis, it is clear that the developed hybrid power generation system is so efficient in an economical aspect.
5.3 Environmental Contribution Analysis
The developed hybrid power generation system effectively delivers an output power of 1.6–1.8 kW. Figure 13A depicts the CO2 emission reduced through the developed hybrid power generation system. Considering the lower case of power generation, the hybrid power generation system effectively reduces 9.324 Kg of CO2 emission per day. When the system is calculated for a period of a month, it effectively reduces 279.72 Kg of CO2 emission. Furthermore, it is estimated that the total CO2 emission reduced per year is 3403.26 Kg, when analyzing the generated power with the crude oil. Figure 13B depicts oil consumption through the developed system. The developed hybrid power generation system reduces 0.0085 barrel of oil consumption. When calculated for a month, the developed hybrid system reduces 0.255 barrel of oil consumption. Also, when calculated for a year, the developed system reduces 3.103 barrel (i.e.,) 494 L of oil consumption.
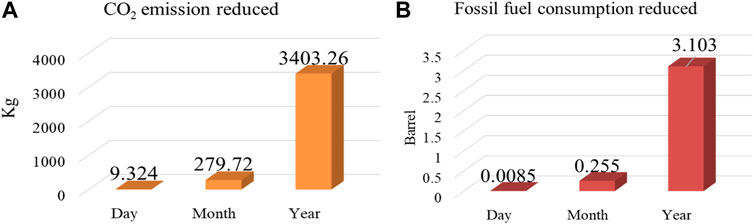
FIGURE 13. Environmental analysis.
6 Conclusion
An economically operated DC microgrid for rural electrification with enhanced performance using a neural network-based tri-port converter has been analyzed in this work. The DC microgrid has been set up for a 2.5 kW power rating with the combination of PV, wind, and a wind-piezoelectric crystal. The developed system provides optimal energy management solutions during dynamic loading conditions and enhances the operation of the smart microgrid. The assessment has been tested for rural electrification, and the following observation has been made. 1) The developed wind, PV, and the wind-piezoelectric-based DC microgrid have an overall efficiency of 57% in wind, and PV has an efficiency of 86%. The efficiency drop is because of low out power from the wind-piezoelectric power generation system. 2) The tri-port converter operates and maintains the flexible energy during the operation. 3) The developed DC-microgrid reduces CO2 emission per year, which is 3403.26 Kg. Therefore, the developed model can provide sustainable development of rural electrification with a reduced environmental contribution.
Data Availability Statement
The original contributions presented in the study are included in the article/Supplementary Material; further inquiries can be directed to the corresponding author.
Author Contributions
All authors listed have made a substantial, direct, and intellectual contribution to the work and approved it for publication.
Conflict of Interest
The authors declare that the research was conducted in the absence of any commercial or financial relationships that could be construed as a potential conflict of interest.
Publisher’s Note
All claims expressed in this article are solely those of the authors and do not necessarily represent those of their affiliated organizations, or those of the publisher, the editors, and the reviewers. Any product that may be evaluated in this article, or claim that may be made by its manufacturer, is not guaranteed or endorsed by the publisher.
Acknowledgments
The authors would like to thank the authorities of the Vellore Institute of Technology, Vellore, Tamilnadu, India, for supporting this research work.
References
Adedeji, P. A., Akinlabi, S., Madushele, N., and Olatunji, O. O. (2020). Wind Turbine Power Output Very Short-Term Forecast: a Comparative Study of Data Clustering Techniques in a PSO-ANFIS Model. J. Clean. Prod. 254, 120135. doi:10.1016/j.jclepro.2020.120135
Ahmed, W., Ansari, H., Khan, B., Ullah, Z., Ali, S. M., Mehmood, C. A. A., et al. (2020). Machine Learning Based Energy Management Model for Smart Grid and Renewable Energy Districts. IEEE Access 8, 185059–185078. doi:10.1109/access.2020.3029943
Bilakanti, N., Zheng, L., Kandula, R. P., Kandasamy, K., and Divan, D. (2017). 2017 IEEE Energy Conversion Congress and Exposition (ECCE). New Jersy,US: IEEE, 482–489. doi:10.1109/ecce.2017.8095822Soft-switching Isolated Tri-port Converter for Integration of PV, Storage and Single-phase AC Grid
Bogdanov, D., Gulagi, A., Fasihi, M., and Breyer, C. (2021). Full Energy Sector Transition towards 100% Renewable Energy Supply: Integrating Power, Heat, Transport and Industry Sectors Including Desalination. Appl. Energy 283, 116273. doi:10.1016/j.apenergy.2020.116273
England, B. S., and Alouani, A. T. (2020). Real Time Voltage Stability Prediction of Smart Grid Areas Using Smart Meters Data and Improved Thevenin Estimates. Int. J. Electr. Power & Energy Syst. 122, 106189. doi:10.1016/j.ijepes.2020.106189
Gadekallu, T. R., Srivastava, G., Liyanage, M., M., I., Chowdhary, C. L., Koppu, S., et al. (2022). Hand Gesture Recognition Based on a Harris Hawks Optimized Convolution Neural Network. Comput. Electr. Eng. 100, 107836. doi:10.1016/j.compeleceng.2022.107836
Hosseini, S. M., Carli, R., and Dotoli, M. (2020). Robust Optimal Energy Management of a Residential Microgrid under Uncertainties on Demand and Renewable Power Generation. IEEE Trans. Automation Sci. Eng. 18 (2), 618–637.
Hu, Y., Gan, C., Cao, W., and Fang, Y., 2015. Tri-port Converter for Flexible Energy Control of PV-Fed Electric Vehicles. In 2015 IEEE International Electric Machines & Drives Conference (IEMDC), Coeur d’Alene, ID, United States, 10–13 May 2015 (pp. 1063–1070). doi:10.1109/iemdc.2015.7409193
Hu, Y., Gan, C., Sun, Q., Li, P., Wu, J., and Wen, H. (2017). Modular Tri-port High-Power Converter for SRM Based Plug-In Hybrid Electrical Trucks. IEEE Trans. Power Electron. 33 (4), 3247–3257.
Jia-You Lee, J. Y., Yu-Ming Chang, Y. M., and Fang-Yu Liu, F. Y. (1999). A New UPS Topology Employing a PFC Boost Rectifier Cascaded High-Frequency Tri-port Converter. IEEE Trans. Ind. Electron. 46 (4), 803–813. doi:10.1109/41.778246
Khattak, H. A., Tehreem, K., Almogren, A., Ameer, Z., Din, I. U., and Adnan, M. (2020). Dynamic Pricing in Industrial Internet of Things: Blockchain Application for Energy Management in Smart Cities. J. Inf. Secur. Appl. 55, 102615. doi:10.1016/j.jisa.2020.102615
Khorasany, M., Azuatalam, D., Glasgow, R., Liebman, A., and Razzaghi, R. (2020). Transactive Energy Market for Energy Management in Microgrids: The Monash Microgrid Case Study. Energies 13 (8), 2010–2023. doi:10.3390/en13082010
Li, W., Xu, C., Luo, H., Hu, Y., He, X., and Xia, C. 2014. Decoupling-Controlled Triport Composited DC/DC Converter for Multiple Energy Interface. IEEE Trans. Industrial Electron. 62 (7), 4504–4513.
Mohamed, M. A., Abdullah, H. M., El-Meligy, M. A., Sharaf, M., Soliman, A. T., and Hajjiah, A. (2021). A Novel Fuzzy Cloud Stochastic Framework for Energy Management of Renewable Microgrids Based on Maximum Deployment of Electric Vehicles. Int. J. Electr. Power & Energy Syst. 129, 106845. doi:10.1016/j.ijepes.2021.106845
Mohammad, A., Zamora, R., and Lie, T. T. (2020). Integration of Electric Vehicles in the Distribution Network: A Review of PV Based Electric Vehicle Modelling. Energies 13 (17), 4541. doi:10.3390/en13174541
Mousavi, N., Kothapalli, G., Habibi, D., Das, C. K., and Baniasadi, A. (2020). Modelling, Design, and Experimental Validation of a Grid-Connected Farmhouse Comprising a Photovoltaic and a Pumped Hydro Storage System. Energy Convers. Manag. 210, 112675. doi:10.1016/j.enconman.2020.112675
Nyeche, E. N., and Diemuodeke, E. O. (2020). Modelling and Optimisation of a Hybrid PV-Wind Turbine-Pumped Hydro Storage Energy System for Mini-Grid Application in Coastline Communities. J. Clean. Prod. 250, 119578. doi:10.1016/j.jclepro.2019.119578
R, S., S, Y., Padmanabhan, S., Holm‐Nielsen, J. B., M, S., M, R., et al. (2021). Piezoelectric Energy Harvester Converting Wind Aerodynamic Energy into Electrical Energy for Microelectronic Application. IET Renew. Power Gen. 15, 1968–1975. doi:10.1049/rpg2.12119
Sadek, S. M., Omran, W. A., Hassan, M. A. M., and Talaat, H. E. A. (2021). Adaptive Robust Energy Management for Isolated Microgrids Considering Reactive Power Capabilities of Distributed Energy Resources and Reactive Power Costs. Electr. Power Syst. Res. 199, 107375. doi:10.1016/j.epsr.2021.107375
Sarkar, S., Agrawal, S., Baker, T., Maddikunta, P. K. R., and Gadekallu, T. R. (2022). Catalysis of Neural Activation Functions: Adaptive Feed-Forward Training for Big Data Applications. Appl. Intell., 1–20. doi:10.1007/s10489-021-03082-y
Sitharthan, R., and Geethanjali, M. (2017). An Adaptive Elman Neural Network with C-PSO Learning Algorithm Based Pitch Angle Controller for DFIG Based WECS. J. Vib. Control 23 (5), 716–730. doi:10.1177/1077546315585038
Sitharthan, R., Geethanjali, M., and Karpaga Senthil Pandy, T. (2016). Adaptive Protection Scheme for Smart Microgrid with Electronically Coupled Distributed Generations. Alexandria Eng. J. 55 (3), 2539–2550. doi:10.1016/j.aej.2016.06.025
Sitharthan, R., Karthikeyan, M., Sundar, D. S., and Rajasekaran, S. (2020). Adaptive Hybrid Intelligent MPPT Controller to Approximate Effectual Wind Speed and Optimal Rotor Speed of Variable Speed Wind Turbine. ISA Trans. 96, 479–489. doi:10.1016/j.isatra.2019.05.029
Srinivasan, S., Tiwari, R., Krishnamoorthy, M., Lalitha, M. P., and Raj, K. K. (2021). Neural Network Based MPPT Control with Reconfigured Quadratic Boost Converter for Fuel Cell Application. Int. J. Hydrogen Energy 46 (9), 6709–6719. doi:10.1016/j.ijhydene.2020.11.121
Sun, H., Qiu, C., Lu, L., Gao, X., Chen, J., and Yang, H. (2020). Wind Turbine Power Modelling and Optimization Using Artificial Neural Network with Wind Field Experimental Data. Appl. Energy 280, 115880. doi:10.1016/j.apenergy.2020.115880
ur Rehman, U. (2020). A Decentralized Dynamic Marketing-Based Demand Response Using Electric Vehicles in Smart Grid. Arab. J. Sci. Eng. 45 (8), 6475–6488. doi:10.1007/s13369-020-04505-7
Verma, A. S., Jiang, Z., Caboni, M., Verhoef, H., van der Mijle Meijer, H., Castro, S. G. P., et al. (2021). A Probabilistic Rainfall Model to Estimate the Leading-Edge Lifetime of Wind Turbine Blade Coating System. Renew. Energy 178, 1435–1455. doi:10.1016/j.renene.2021.06.122
Wu, T., Li, W., Ni, K., Song, S., and Alkahtani, M. (2019). Modular Tri-port Converter for Switched Reluctance Motor Based Hybrid Electrical Vehicles. IEEE Access 7, 15989–15998. doi:10.1109/access.2019.2894818
Keywords: renewable energy, smart microgrid, energy efficiency artificial neural network, converter, energy management, flexible energy control, FPGA
Citation: Sitharthan R, Madurakavi K, Jacob Raglend I, Palanisamy K, Belwin Edward J, Rajesh M and Dhanabalan SS (2022) Performance Enhancement of an Economically Operated DC Microgrid With a Neural Network–Based Tri-Port Converter for Rural Electrification. Front. Energy Res. 10:943257. doi: 10.3389/fenrg.2022.943257
Received: 13 May 2022; Accepted: 07 June 2022;
Published: 08 July 2022.
Edited by:
Celestine Iwendi, School of Creative Technologies University of Bolton, United KingdomReviewed by:
Vimal Shanmuganathan, Ramco.Institute of Technology, IndiaSathees Kumar Nataraj, AMA International University, Bahrain
Abdulla Jaffar Desmal, University of Malaya, Malaysia
Shanavas Shajahan, Khalifa University, United Arab Emirates
Copyright © 2022 Sitharthan, Madurakavi, Jacob Raglend, Palanisamy, Belwin Edward, Rajesh and Dhanabalan. This is an open-access article distributed under the terms of the Creative Commons Attribution License (CC BY). The use, distribution or reproduction in other forums is permitted, provided the original author(s) and the copyright owner(s) are credited and that the original publication in this journal is cited, in accordance with accepted academic practice. No use, distribution or reproduction is permitted which does not comply with these terms.
*Correspondence: R. Sitharthan, c2l0aHVra3lAZ21haWwuY29t