 Hongli Wang
 Junjie Ligao
 Fuzhang Wu1
 Xu Zhu
- 1School of Electrical Engineering and Automation, Wuhan University, Wuhan, China
- 2State Grid Hubei Electric Power Research Institute, Wuhan, China
- 3State Grid Hebei Electric Power Research Institute, Shijiazhuang, China
- 4Electrical Engineering Department, Faculty of Engineering, Aswan University, Aswan, Egypt
The increase in the penetration rate of distributed renewable energy sources has brought unprecedented challenges to the economic and stable operation of the active distribution network (ADN). To improve the operating efficiency and total benefits of the ADN, it is necessary to establish an optimization model considering the stakeholders’ market behavior and the game relationship among them under the market environment. In this paper, a multi-stakeholder potential game model in the ADN considering the bounded rationality of small users is proposed. The game relationships among five stakeholders, including the distributed photovoltaic generation aggregators, the distributed wind power aggregators, the energy storage operators, the large users and the load aggregators, are modeled on an hourly time scale. Existing research has proved that the game equilibrium of the potential game model must exist. Based on the information transfer and the strategy update mode on the social network, a demand response evolutionary game model for small users is established. Moreover, a distributed algorithm is designed to obtain the pure strategy equilibrium. Finally, a case with five stakeholders and 160 small users is used to verify the rationality and feasibility of the proposed model.
1 Introduction
With the continuous development of the global economy, the energy demand is growing rapidly. However, the shortage of traditional energy and the climate change hinder the further use of traditional energy. This leads to the rapid development of clean and renewable energy (Shahbaz et al., 2020). Moreover, to ensure sustainable development, many countries have further accelerated the construction of renewable energy based on wind power and solar (Qazi et al., 2019; Levenda et al., 2021). Due to the large-scale connection of the distributed renewable energy generations to the distribution network, the number of stakeholders in the distribution network continually growing. Coordinating the stakeholders with different competition and cooperation relations and actualizing optimal operation are the urgent problems to be solved in the development of the distribution network. The concept of the active distribution network (ADN) provides technology and solution that can effectively coordinate the “source-network-load-storage” quaternary structure in the distribution network. This can contribute to the local energy accommodation and efficient utilization of distributed renewable energy (Conte et al., 2019). Besides, trading or sharing energy within the ADN can significantly improve the social efficiency (Chen et al., 2020). Therefore, clarifying the relationship between various stakeholders and establishing a reasonable optimization model under the framework of the ADN is an important research direction for the future distribution network.
Most of the research on the multi-agent coordination and optimization modeling of the ADN concentrate on establishing traditional optimization models. For example, an energy trading model of the distribution network was proposed by (Maharjan et al., 2013), which was designed based on the Stackelberg game and was solved by optimization algorithm. The branch power flow equations were relaxed into the convex second-order cone format to ensure global optimality by (Taylor and Hover, 2012). (Mirzapour-Kamanaj et al., 2020) applied the Karush-Kuhn-Tucker (KKT) conditions and the Big-M method to simplify and linearize the bi-level optimal model in the distribution network. However, the traditional models are very strict with the form. They need complex processing such as second-order cone relaxation or KKT conditions to transfer the objective function and constraints into forms that are relatively easy to solve. This sacrifices the accuracy and utility of the model.
Game theory is an effective tool to analyze the relationship between different stakeholders. A number of scholars focus on analyzing the game relationship among multiple stakeholders. The relevant game models can be divided into the following two categories:
Non-cooperative game: A non-cooperative game model was proposed by (Dashti et al., 2019) to describe the pricing mechanism in a distribution network with multiple microgrids. Similar methods were also studied by (Ghorbanian et al., 2021), where the trading relationship among the consumers, the grid operators, and the distributed generations (DGs) were presented as a game model considering the impact of users’ autonomous demand response. (Pang and Shi, 2021) proposed a planning-operation model of ADN based on non-cooperative game. The game relationship among three different stakeholders (distribution network operator, distributed generation operator and demand response operator) was described by a bi-level optimization problem, which was solved by particle swarm optimization algorithm.
Stackelberg game: The energy trading process in distribution network including multiple microgrids was presented as a Stackelberg game with one leader and N followers by (Lin et al., 2021). The game model was solved by the combination of heuristic algorithm (differential evolution algorithm) and MIP method. (Aguiar et al., 2021) proposed a Stackelberg game model to determine the trading prices of flexible users in distribution network.
Different algorithms were applied to solve the game model of distribution network. An optimal scheduling model that coordinates the interests of multiple stakeholders was established by (Lu et al., 2019), and the CEQ (λ) learning algorithm was used to solve the equilibrium strategy. An improved NSGAII algorithm was used to solve the multi-objective optimal dispatching model of ADN by (Mazidi et al., 2013). The final compromise solution in the Pareto optimal solution set was selected by Nash equilibrium game. In the above research, since the mathematical forms of the game models of ADN were complex, they were generally solved by heuristic algorithms because of its complicated mathematical form. However, the heuristic algorithms are easy to fall into local optimum, and the accuracy of the solution is hard to guarantee. Moreover, there is a common problem of in solving the game equilibrium, that is, it needs to prove the existence of Nash equilibrium. Some scholars use mathematical methods to prove and find the Nash equilibrium of the game model in the distribution network (Ghorbanian et al., 2021). The proof process is too complex and applies only to a single type of model. This also limits the model establishment and may increase the difficulty of solving. The potential game, which does not have strict requirements for the mathematical form and equilibrium proof of the game model (Monderer and Shapley, 1996), is suitable for the model establishment of ADN. In addition, the above studies do not take into account the game relationship within the group of small users in the ADN. The bounded rationality of small users as homo economicus with social attributes is also ignored.
In response to the above problems, the main contributions of this paper are as follows.
1) The competing relationship between the stakeholders in the ADN is analyzed. Then, the potential game model of ADN is established based on the utility model of different agents through potential game theory. The utilization of potential game theory ensures the existence of Nash equilibrium.
2) Considering the bounded rationality and social attributes of small users, in this paper, a social network among small users is established based on information interaction and strategy learning patterns. Then, an evolutionary game model for demand response among small users is established.
3) A distributed optimization algorithm and corresponding trading mechanism are proposed based on the potential game model. Moreover, the rationality and effectiveness of the proposed models and algorithms are proved through numerical simulation.
2 Potential game model of active distribution network
2.1 Components of an active distribution network
Under the market environment, the ADN usually consists of five main agents, namely, distributed photovoltaic generation aggregators (DPGA), distributed wind power aggregators (DWGA), energy storage operators (ESO), large users (LU), and load aggregators (LA). LU is generally a large industrial or commercial user. It purchases electricity to meet its own energy demand. LA integrates the load of small users and purchases electricity from other agents to meet the demand of small users. It represents small users to participate in the demand response. In addition, the ADN purchases electricity from the main grid (MG) through transmission lines to supplement the shortage of electricity. The interaction relationships among the five agents are shown in Figure 1.
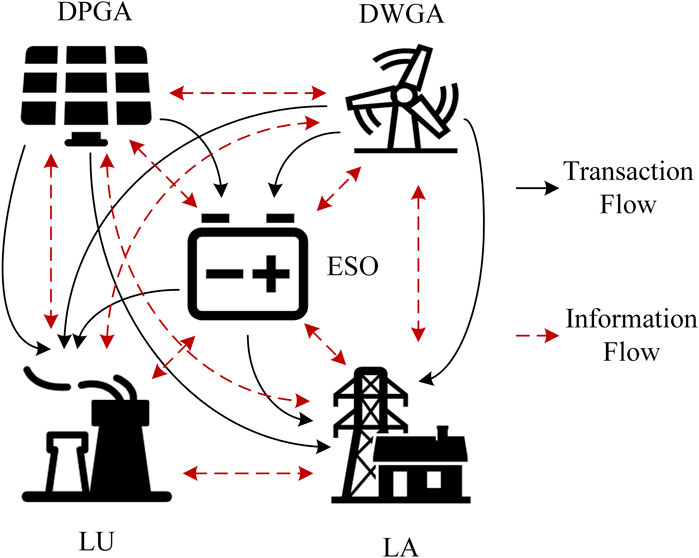
FIGURE 1. Composition of ADN, interest relationship and information interaction of various stakeholders.
2.2 Potential game theory
The potential game is a special kind of non-cooperative game. It can be defined as follows:
For a given game
then G is said to be an exact potential game (EPG) (Monderer and Shapley, 1996).
The finite improvement property of the potential game ensures that the game model established by the potential game definitely has a Nash equilibrium. Thus there is no need to prove the existence of the equilibrium.
2.3 Game model of stakeholders in active distribution network
In this paper, we assume that the transmission capacity of the distribution network lines is large enough that multi-stakeholder transactions do not cause line blocking and the transmission loss can be ignored. Therefore, the network constraint is ignored.
1) Distributed photovoltaic generation aggregator.
DPGA’s utility includes income from electricity sales and PV subsidies. Its costs include operation cost and maintenance costs. Its total utility at time slot t can be given as follows:
where
where
Both the electricity sales price variable and the electricity variable in the utility function have upper and lower bound constraints, then the decision space can be given as follows:
where
2) Distributed wind power aggregator.
The utility composition of DWGA is similar to that of DPGA, including the revenue from electricity sales, wind power subsidies and operating costs. Its total revenue at time slot t can be given as follows:
where
where
Similar to DPGA, the decision space can be given as follows:
where
3) Energy storage operator.
The energy storage operator makes profit by purchasing electricity at a low price and selling it at a high price. Its income comes from the sale of electricity. The cost includes the cost of electricity purchase and the cost of charging and discharging operation and maintenance. Its total utility at time slot t can be given as follows:
where
where
The charging and discharging of the energy storage device cannot be carried out at the same time slot, so:
where
In addition, the energy storage device has a rated capacity and minimum quantity of electric charge. and its state of charge shall be within the allowable range, that is:
where
The decision variables of ESO also have upper and lower limit constraints:
where
4) Large users.
LU satisfies its own electricity demand by purchasing electricity from each electricity seller. The utility function consists only of the cost of electricity purchase, and its total utility at time slot t can be given as follows:
where
where
5) Load aggregator (small users).
The load aggregator integrates small customer load resources to participate in demand response. It purchases electricity from each electricity seller on behalf of small customers to meet the total load demand, and its total utility consists of the cost of electricity purchase only, which can be given as follows:
where
where,
6) Main grid.
As an agent to fill the electricity shortage of the distribution network, the MG has a fixed tariff curve. Moreover, it will meet the electricity demand of other agents as much as possible within the allowed limits.
2.4 Construction of the potential function
The key to establishing the potential game model of ADN is the construction of the potential function. The potential function is constructed as the sum of the utility of all agents, taking into account the electricity supply and demand balance of the large and small users as well as the consistency of tariff and electricity decisions between the two sides of the transaction. The final potential function is obtained as follows.
where
Accordingly, the penalty function is added to the utility function of each agent to satisfy the constraint.
The potential game model established based on Eqs 23, 24 can be proved to be a full potential game.
Proving that the established potential game model is a full potential game requires a classification for discussion:
1) If the agent i is not the LU or the LA, then we have
where,
Therefore,
2) If the agent i is a LU, then we have
where
Therefore,
3) If the agent i is a LA, then we have
where
Therefore,
In summary,
3 A small user evolutionary game model based on social networks
Small users in the ADN generally participate in the game through demand response (Chen et al., 2018). Since the demand response potential of individual users is small, the demand-side flexible load resources of small users are often integrated and unified through LA. The LA has bargaining power in the ADN and actively participate in the operation of the distribution network. It purchases electricity from the distribution network and sells it to small users at a certain price. The price of the electricity sold has an impact on the level of demand response of small users. In turn, the total demand response of small users directly affects the LA’s strategy when playing with other stakeholders in the distribution network, and further affects the price of electricity purchased from the distribution network. In other words, each small user’s electricity consumption decision can affect the electricity price released by the LA to small users.
It is clear from the above that the demand response decisions of the individual small users will indirectly affect the interests of other small users. As individuals with social attributes, small users will exchange information with other small users through social interaction. The network reflecting the social relationship and information interaction among small users is a social network, which is a typical complex network. Therefore, the demand response decision-making process of the small users is essentially a game process on a complex network. Based on this, an evolutionary game model on a small users’ social network will be established in this section.
3.1 Social network model for small users
In this paper, a graph theory approach is used to model the social network of small users. In the social network, nodes represent different small users, and the connection between nodes represents the social connection between users. If two nodes are connected, it means that there is a social relationship between two users, which means there is information interaction and vice versa. (Bandyopadhyay and Kar, 2018; Huang et al., 2018; Wu et al., 2021) demonstrate that the small-world property and the scale-free property are the two main properties of social networks. The scale-free distribution means that the degree distribution of nodes obeys a power-law distribution. The small-world property of complex networks means that the network has a short average path length along with a large agglomeration coefficient. The average path length is the average of the shortest path length between any two points in the network.
Considering that the group of small users in the actual distribution network has obvious community attributes, which means it has the characteristics of gathering in a community. There are strong connections within the community and relatively few social connections outside the community. Combining the small-world properties and scale-free characteristics of social networks, the scale-free community network (Santos and Pacheco, 2005) is used to establish a social network model for simulating the small user social network in the actual distribution network.
3.2 Evolutionary game model of demand response for small users
The load aggregator acts as an agent for small customers and purchases electricity from other distribution network agents in order to meet the customers’ electricity demand. It also publishes electricity prices to small users, who respond according to the prices. Due to the interaction and transmission of information among customers, each customer evaluates and learns from the demand response decisions of other customers with whom he or she has social relationships, thus continuously optimizing his or her own electricity consumption strategy and improving the interests and satisfaction level of electricity consumption. Therefore, each customer’s decision is directly influenced by the decisions of customers with whom he or she is socially connected, and the process of improving interests through strategy evaluation and learning is a reflection of the limited rationality of small customers. Based on this, a game model of demand response decision for small users is established, which contains three typical elements of the game: decision-maker, decision space, and utility function.
1) Decision makers.
There are J small users in the ADN, belonging to m communities.
2) Decision space.
where
where
3) Utility function.
The utility of using electricity for each small user consists of three components: cost of electricity, demand response subsidy, and satisfaction with electricity consumption, namely:
where
where
From Eq. 36, the price of electricity sold by LA to small customers is the weighted sum of the prices of electricity purchased from other electricity selling entities.
Customer satisfaction with electricity consumption can be represented by the following quadratic utility function (Yang and Wang, 2016).
where
3.3 Information interaction and strategy updates on social network
In this paper, we assume that there is complete information and demand response strategy sharing between small users and other small users with whom they are socially connected, meaning that each small user has access to the actual level of demand response and their total utility of the users directly connected to them on their social network. Considering the information transfer and mutual learning of users in social networks, users will pursue their own interests by continuously updating their own strategies. In this paper, an optimal response learning algorithm is used to model this dynamic process of policy adjustment. The basic principle is that a single user gains from playing with other users in the social network, and when the user updates his own strategy, he compares his own gain with the gain of all users with whom he is socially connected, and chooses the strategy with the highest gain as his next game strategy, and converges through many iterations. This process fully demonstrates the bounded rationality of small users, namely, they learn to improve their strategies through trial and error.
4 Distributed optimization algorithms and trading mechanism
As can be seen from Eq. 23, the main part of the potential function is the sum of the benefits of each agent. This to some extent represents the total interests of all production and consumption agents in the ADN, that is, the total social welfare (Contereras-Ocaña et al., 2017). Besides, Eq. 1 shows that the potential function and the individual’s utility function have exactly the same trend and magnitude of change. This means each decision-maker of the game maximizes its own interests and simultaneously jointly promotes the social welfare. Finally, both of the individual game and the potential function can achieve the consistency of the equilibrium at the same time (Yamamoto, 2015; Bahrami et al., 2018). Based on the above analysis, a distributed optimization algorithm is designed to solve the game model, and the solution result can make both of the social welfare and individuals’ utility reach the optimum.
4.1 Optimize feasible domain settings
Since the prerequisite for a potential game to have a pure strategy equilibrium solution is that both its decision-makers and the number of decisions are finite (Monderer and Shapley, 1996), the decision space needs to be discretized by partitioning the decision variables of each game agent at equal intervals within its upper and lower bound constraints to make it a discrete finite set of strategies.
4.2 Strategy update mode
The agents in the ADN are update their strategies in order of priority. Due to the low-carbon and clean characteristics of DPGA and DWGA, the DPGA is set as the first priority and the DWGA as the second priority in consideration of promoting the consumption of new energy. In addition, in order to ensure the electricity demand of small customers, LA is set as the third priority. LUs are given the fourth priority. The ESO is set as the fifth priority. The MG is the last priority. The strategies are updated sequentially in a cycle according to the above priority order.
4.3 Distributed iterative optimal solution process
The distributed iterative optimization solution process designed in this paper is described as follows.
Step 1: Set the model parameters (load forecast results, renewable energy output forecast results, etc.,) and determine the initial decision variables. The initial value of all penalty factors is 1.
Step 2: Iterate by DPGA and update its own strategy by traversing the decision space to select the electricity and tariff decision results that maximize its own benefits according to the latest decision results of other agents at this moment (
Step 3: If the tariff and electricity decision variables are agreed between all stakeholders, that is, the price and power are balanced (
Step 4: The iteration of the time slot is finished, and it goes to the next time slot for solving and back to step 2. If all the time slots are solved (t = T), the solution is finished.
A schematic diagram of the specific solving process and the algorithm flow chart can be seen in Figure 2.
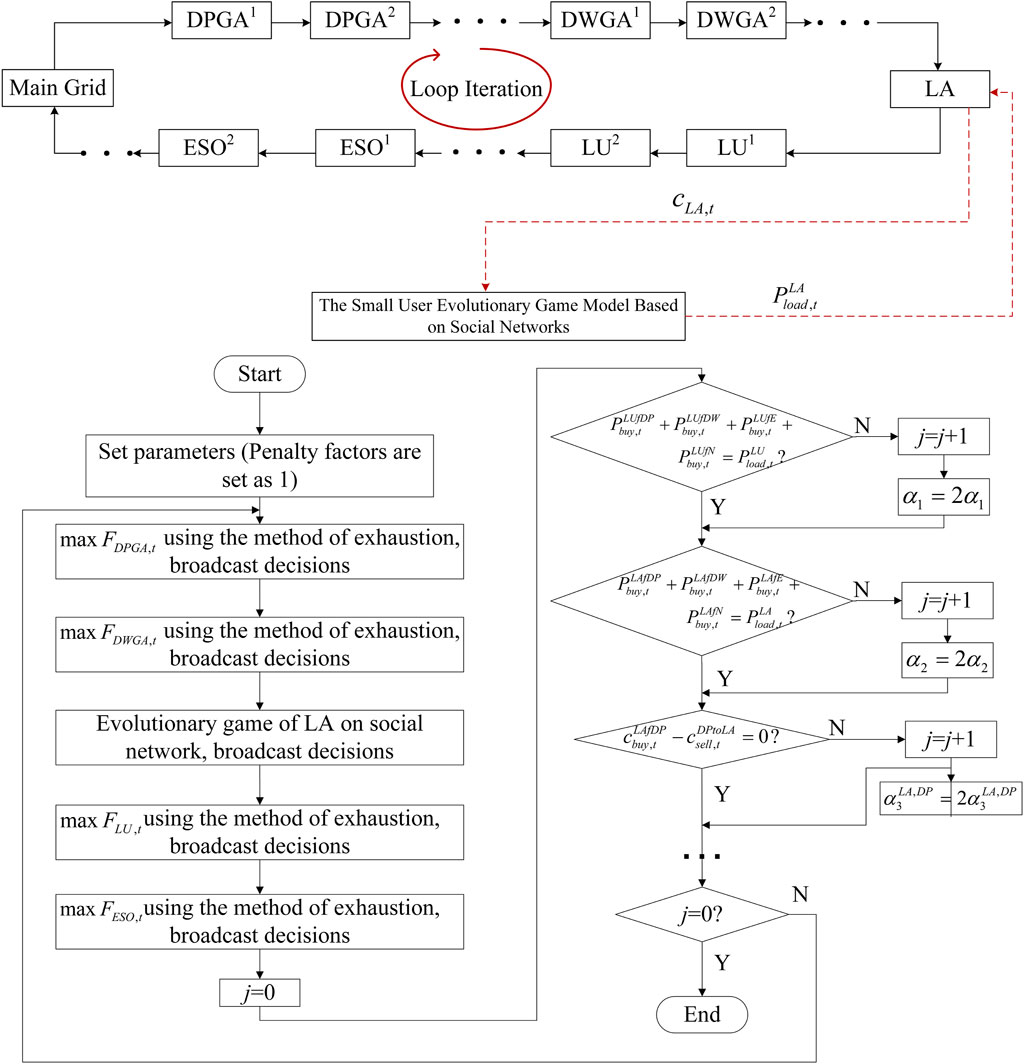
FIGURE 2. Flow diagram of distributed iterative solution and flow chart of proposed algorithm.
4.4 Corresponding trading mechanism
In the actual market transaction process, each agent determines the optimal price and electricity decisions separately and broadcasts them to other agents in the ADN during each trading cycle. The process is carried out sequentially according to the prescribed priority order. Whenever a trading cycle ends, each agent confirms whether there is consensus on the volume and price of the transaction. If a consensus is reached among all agents, the transaction proceeds to the next time slot.
Since in the distributed transaction, the subjects in the ADN do not know the information about each other’s decision space and payoff function. They can only optimize their own payoffs based on the decision information of other subjects in the current trading round. This limitation of information guarantees each subject to improve the total social welfare while optimizing its own benefits, according to the property of EPG (Monderer and Shapley, 1996; Bahrami et al., 2018).
5 Case study
5.1 Data
In this paper, an ADN containing one DPGA, one DWGA, one ESO, one LU, and one LA is used to analyze the game situation of each interested party in the electricity trading process. The day-ahead power forecasts of DPGA, DWGA, LA, and LU are shown in Figure 3. The electricity selling price range of DPGA is 0.3–1.1 RMB/kWh. The electricity selling price range of DWGA is 0.3–1.0 RMB/kWh. The electricity purchase price range of ESO is 0.3–0.95 RMB/kWh and the electricity selling price range is 0.3–1.05RMB/kWh The electricity purchase price for LU ranges from RMB 0.3 to RMB 1.5/kWh, and the electricity purchase price for LA ranges from RMB 0.3 to RMB 0.95/kWh. The subsidy coefficients for DPGA and DWGA are RMB 0.2/kWh and RMB 0.15/kWh, respectively. In this paper, the ESO uses lithium batteries, and its parameters are shown in Table 1. The storage capacity of ESO is 400 kW. The satisfaction parameter of small users
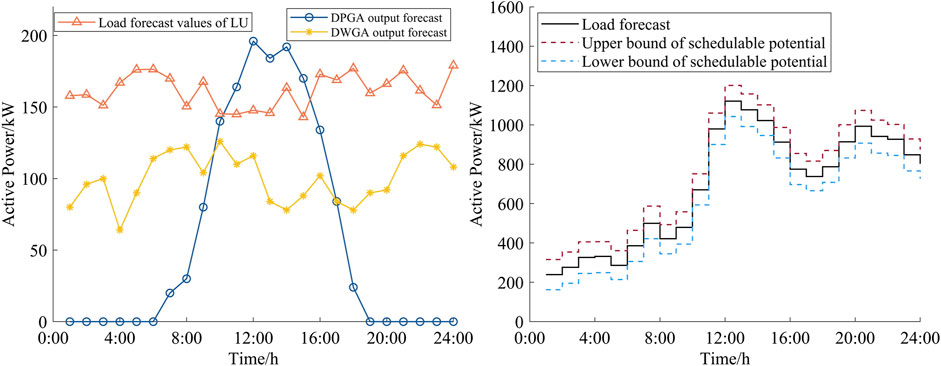
FIGURE 3. Day-ahead power forecast for DPGA, DWGA, LA, and LU.
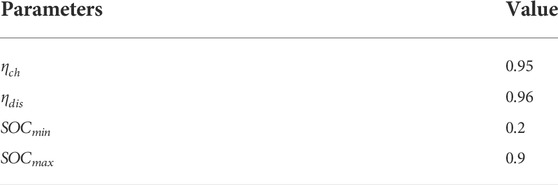
TABLE 1. Lithium Battery Parameters.
5.2 Generation of social networks
In this paper, we consider an ADN containing 160 small users divided into 8 communities and unified by the LA. Its social network is established by a scale-free community network (Santos and Pacheco, 2005). The relevant parameters are set as: initial number of small users
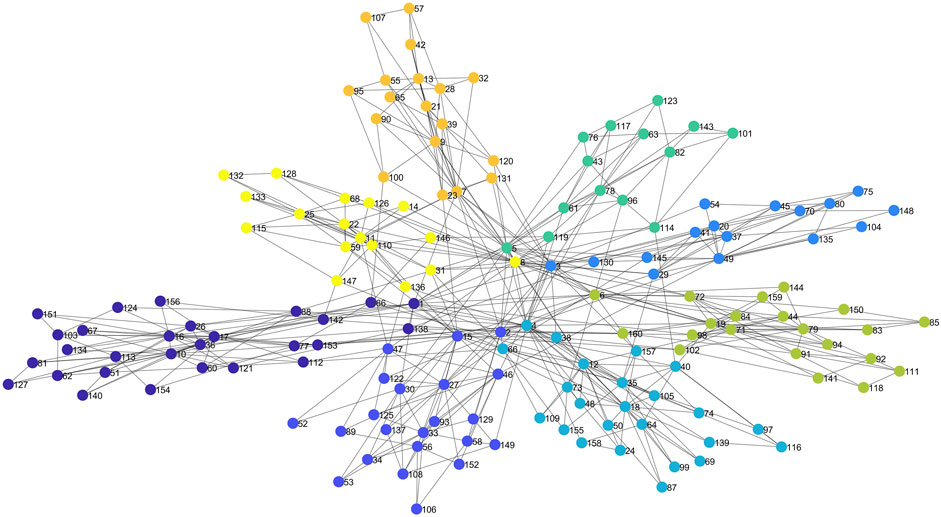
FIGURE 4. Social network topology (Different colors represent belonging to different communities, nodes correspond to different users, the number on the node is the number of small users, and the nodes are connected to indicate the existence of social connections between users).
6 Results
The simulations were performed on the Matlab 2020b platform based on Windows 10, Intel Core i7-10700 CPU, 2.90 GHz, and 16 GB RAM environment.
The final game convergence results are shown in Figures 5–9 after several iterations of the optimization search. In the figure, to ESO, to LA, to LU, from ESO, from DPGA, from DWGA and from N denote the electricity sold to ESO, the electricity sold to LA, the electricity sold to LU, the electricity purchased from ESO, the electricity purchased from DPGA, the electricity purchased from DWGA and the electricity purchased from the superior grid, respectively. Firstly, the electricity output of DPGA is analyzed, which is the first priority agent, as shown in Figure 5A.
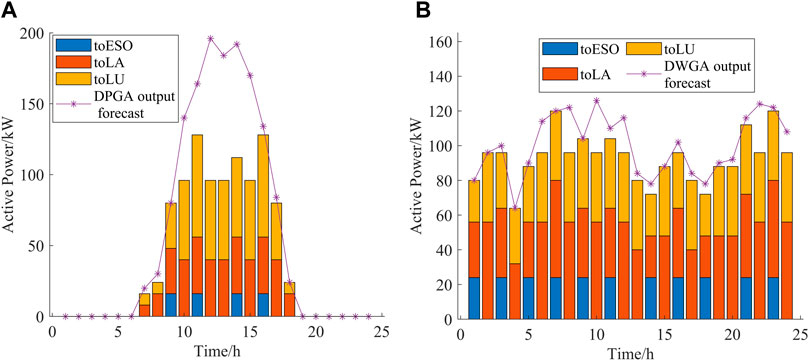
FIGURE 5. Electricity transaction convergence results of DPGA and DWGA.
It can be seen from Figure 5A that DPGA, as a distributed renewable energy aggregator, still has some abandonment cases, but total most of the PV electricity has been effectively consumed. The reason why some of the PV is not consumed is that during the peak period of PV electricity generation, the electricity generated is too much whereas there is not enough load to absorb it. Of the electricity sold, it was mainly traded to small customer aggregators and large customers to meet load demand through direct sales. During the peak PV generation period, a small amount of electricity is sold to ESO to increase their own utility in order to reduce the abandonment of light.
Figure 5B shows the final electricity trading convergence results of DWGA, from which it can be seen that the total consumption of wind power is good, and it is almost completely consumed within the predicted maximum generation. Similar to the DPGA, most of the wind power generation was sold to both large and small users, reflecting the priority of new energy generation in meeting load demand. Compared to PV, wind power generation has a smoother total power generation curve, and thus is able to meet the different demands of loads at different time slots of the day, thus having a higher level of consumption.
Figure 6 illustrates the composition of the electricity sources of the LA after the convergence of the optimization iteration. Since there are many small users within the ADN, their load demand is large, however, the distributed generation capacity within the ADN is relatively small, so they need to purchase a large amount of electricity from the MG to meet their own electricity demand. In the game process, if the cost of purchasing electricity from the rest of the agents is low, LA will purchase electricity from distributed renewable energy aggregators or ESO to reduce their own electricity consumption costs as much as possible. As can be seen from Figure 6, apart from purchasing electricity from the MG, most of LA’s electricity demand is met by wind power generation. From 8:00 to 18:00, when DPGA is generating electricity, the LA also purchases electricity from DPGA, and intermittently purchases electricity from ESO throughout the time slot. In addition, guided by the external tariff, small users within LA play an evolutionary game on the social network, and the final game results in the total electricity demand as a result of the demand response. Compared with the predicted value, the electricity demand in the low load period is increased, while there is a small decrease in the peak load period, indicating that participating in the market game of ADN with small customer aggregators can effectively reduce the peak-to-valley difference and guide small customers to use energy rationally. In addition, more importantly, it reflects that the bounded rationality of small users is more in accordance with the actual demand response compared to the situation without considering the bounded rationality (day-ahead forecast results).

FIGURE 6. La power trading convergence results.
Figure 7 shows the convergence results of the ESO charge state and the charging and discharging electricity of each time slot. It can be seen that the energy storage device is roughly in the alternating charging-discharging mode, which is consistent with the operation mode of ESO to purchase and sell electricity to obtain benefits. At the same time, the discharge electricity of the energy storage device is significantly higher than the charging electricity during the time slots of 12:00–13:00 and 19:00–24:00, corresponding to the two peaks of the small user load in Figure 3. And in the two time slots of 8:00–11:00 and 14:00–16:00, the energy storage devices are charged earlier to cope with the load peaks, which is also consistent with the profitable way of ESO to buy at low prices and sell at high prices.
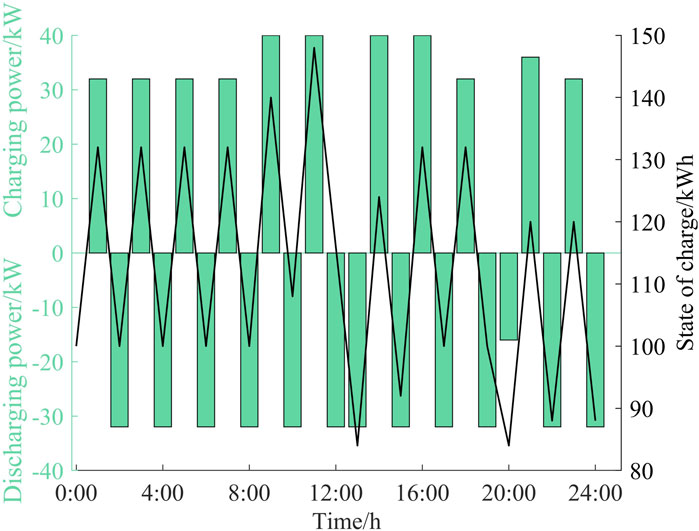
FIGURE 7. State-of-charge and charge-discharge power results of ESO energy storage devices.
Figure 8 shows the final convergence results of the trading tariff. It is obvious from the figure that the energy storage operator adopts the strategy of alternating low and high prices in order to earn revenue through alternate charging and discharging, so that it can achieve the goal of charging at low prices and selling at high prices to optimize its own utility, which is also in perfect agreement with the results of Figure 7. In addition, the price of electricity sold by DPGA is reduced during the peak generation period, thus guiding each demand agent to purchase electricity. Overall, the electricity prices are relatively higher during the two peak load hours (12:00–13:00 and 19:00–24:00). This is consistent with the demand elasticity principle of the electricity market, that is, if demand increases, the price of electricity increases, and if demand decreases, the price decreases.
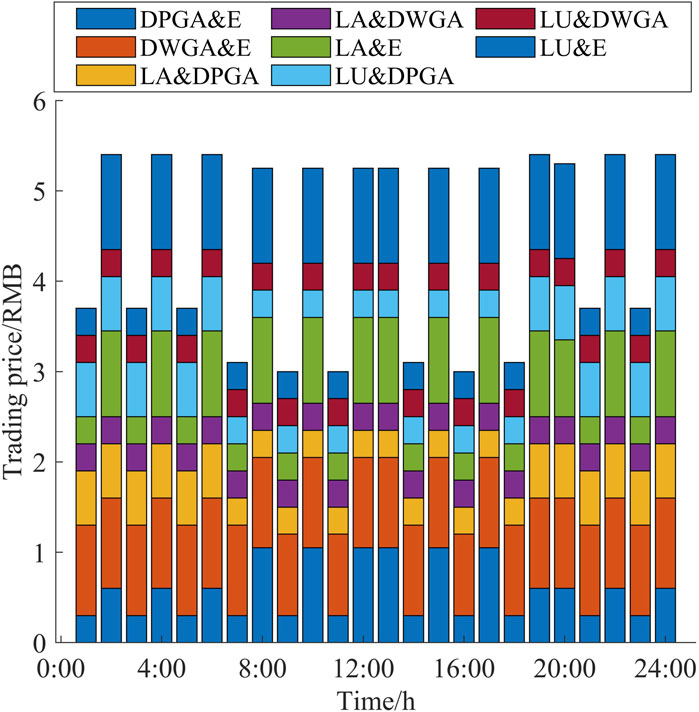
FIGURE 8. Convergence result of transaction price (A&B means the final transaction tariff of A and B after convergence).
Figure 9 shows the convergence process of the algorithm. Due to the large number of convergence criteria of the algorithm (Figure 2), only some of the convergence criteria at time slot 1 are selected for the plot. It can be seen that the algorithm can reach convergence after a relatively short number of iterations.
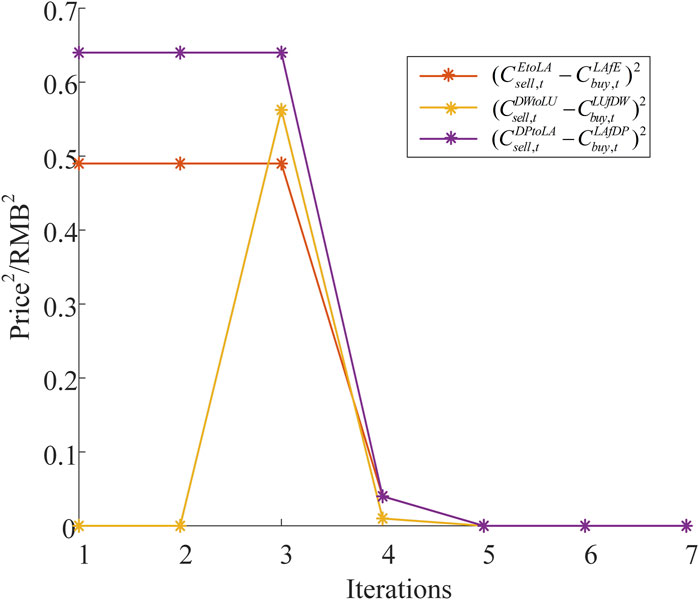
FIGURE 9. Convergence process of proposed algorithm.
7 Discussion
The above analysis of the convergence results of optimization fully proves the practicality and effectiveness of the ADN potential game model established in this paper. Although the model is relatively complicated, it still has an equilibrium and the algorithm can reach convergence after a short number of iterations. This indicates the advantages of modeling with potential game model. Moreover, after considering the bounded rationality of small users, the demand of small users (the power demand of LA in Figure 6) reflects their responsive behavior under different electricity prices. The results of decisions within the upper and lower bounds of schedulable potential show the effect of limited rationality on the overall electricity consumption of small users. The optimization results indicate that each stakeholder takes different decisions in the game process in order to maximize their own interests. In particular, the results of the ESO decision intuitively reflect the game process between the multiple stakeholders. ESO purchases electricity to replenish reserves when prices are low. When prices are high, the ESO sells electricity to obtain the maximum profit. At the same time, the use of social networks makes the demand response results of small users more in line with the actual process of updating electricity consumption strategy. Small customers receive information from other customers who are close to them through social networks. Each customer can continuously adjust its own electricity consumption strategy based on the information obtained. The social network path in Figure 4 corresponds to the users’ information transfer path. In summary, the proposed active distribution network potential game model considering small users with bounded rationality and social networks can reach convergence relatively quickly on the one hand, and simulate the actual transaction and demand response situations well on the other hand. The model is both convergent and effective. The above analysis also illustrates the feasibility of the trading mechanism established in Section 4.4.
8 Conclusion
In this paper, a potential game model of the ADN considering the bounded rationality and the social attributes of the small users is proposed to coordinate the energy transactions among different stakeholders. A distributed algorithm is designed based on the features of the proposed model and corresponding optimization problem. Simulation studies convey the following information:
1) The simulation results show that the potential game model can well simulate the game process among 5 stakeholders in the ADN and ensures the existence of equilibrium. The proposed method can reflect the optimal response of multiple stakeholders in the game process.
2) Small users’ decisions are influenced by other small users through social network. They are individuals with bounded rationality. Therefore, after considering the bounded rationality of small users, the demand response process of small users is more in line with the actual response situation.
Improving the discrete distributed optimization algorithm to improve the operation efficiency of the program and considering the uncertainty of distributed wind power and photovoltaic power are the next research directions of this paper.
Data availability statement
The original contributions presented in the study are included in the article/Supplementary Material, further inquiries can be directed to the corresponding author.
Author contributions
HW is responsible for the investigation, conceptualization and wrote the manuscript. JL contributes to conceptualization, methodology, formal analysis. FW contributes to data curation, formal analysis. JY contributes to investigation and validation. XZ contributes to investigation, data curation, and validation. LW contributes to data curation. KZ contributes to investigation. SY contributes to data curation. SK contributes to revision of the article.
Funding
This study is supported by 1. State Grid Hubei Electric Power CO. Ltd., Research on the Whole Process Safety Control Operation Technology of Distribution Network with Flexible Interactive Resources. 2. The Seed Fund Program for Sino-Foreign Joint Scientific Research Platform of Wuhan University (WHUZZJJ202230). 3. The Fundamental Research Funds for the Central Universities (2042022kf1008).
Conflict of interest
The authors declare that the research was conducted in the absence of any commercial or financial relationships that could be construed as a potential conflict of interest.
Publisher’s note
All claims expressed in this article are solely those of the authors and do not necessarily represent those of their affiliated organizations, or those of the publisher, the editors and the reviewers. Any product that may be evaluated in this article, or claim that may be made by its manufacturer, is not guaranteed or endorsed by the publisher.
References
Aguiar, N., Dubey, A., and Gupta, V. (2021). Network-Constrained Stackelberg game for pricing demand flexibility in power distribution systems. IEEE Trans. Smart Grid 12 (5), 4049–4058. doi:10.1109/TSG.2021.3078905
Bahrami, S., Toulabi, M., Ranjbar, S., Moeini-Aghtaie, M., and Ranjbar, A. M. (2018). A decentralized energy management framework for energy hubs in dynamic pricing markets. IEEE Trans. Smart Grid 9 (6), 6780–6792. doi:10.1109/TSG.2017.2723023
Bandyopadhyay, A., and Kar, S. (2018). Coevolution of cooperation and network structure in social dilemmas in evolutionary dynamic complex network. Appl. Math. Comput. 320, 710–730. doi:10.1016/j.amc.2017.09.048
Chen, S., Chen, Q., and Xu, Y. (2018). Strategic bidding and compensation mechanism for a load aggregator with direct thermostat Control capabilities. IEEE Trans. Smart Grid 9 (3), 1. doi:10.1109/TSG.2016.2611611
Chen, Y., Mei, S. W., Zhou, F. Y., Low, S. H., Wei, W., Liu, F., et al. (2020). An energy sharing game with generalized demand bidding: Model and properties. IEEE Trans. Smart Grid 11 (3), 2055–2066. doi:10.1109/tsg.2019.2946602
Conte, F., D’Agostino, F., and Silvestro, F. (2019). Operational constrained nonlinear modeling and identification of active distribution networks. Electr. Power Syst. Res. 168, 92–104. doi:10.1016/j.epsr.2018.11.014
Contereras-Ocaña, J. E., Wang, Y., Ortega-Vazquez, M. A., and Zhang, B. (2017). “Energy storage: Market power and social welfare,” in 2017 IEEE power & energy society general meeting, 1–5.
Dashti, Z. A., Lotfi, M. M., and Mazidi, M. (2019). “A non-cooperative game theoretic model for energy pricing in smart distribution networks including multiple microgrids,” in 2019 27th Iranian Conference on Electrical Engineering (Yazd, Iran: ICEE), 808–812.
Ghorbanian, M., Dolatabadi, S. H., and Siano, P. (2021). Game theory-based energy-management method considering autonomous demand response and distributed generation interactions in smart distribution systems. IEEE Syst. J. 15 (1), 905–914. doi:10.1109/JSYST.2020.2984730
Huang, W., Wang, Q., and Wang, Y. (2018). “Research on network public opinion propagation mechanism based on sina micro-blog,” in Human centered computing. Editors Q. Zu, and B. Hu (Springer International Publishing), 443–452.
Levenda, A. M., Behrsin, I., and Disano, F. (2021). Renewable energy for whom? A global systematic review of the environmental justice implications of renewable energy technologies. Energy Res. Soc. Sci. 71, 101837. doi:10.1016/j.erss.2020.101837
Lin, Z., Huang, D., Li, D., Yang, X., Wang, Q., Zheng, C., et al. (2021). “Energy trading method of distribution network system with multi-microgrid based on Stackelberg game,” in 2021 IEEE 16th Conference on Industrial Electronics and Applications (Chengdu, China: ICIEA), 333–338.
Lu, J., Chu, W., Ren, H., He, T., and Wang, F. (2019). Coordinated optimal dispatch of multi-stakeholder game based on demand response for active distribution network. IET Renew. Power Gener. 13 (6), 898–904. doi:10.1049/iet-rpg.2018.5589
Maharjan, S., Zhu, Q., Zhang, Y., Gjessing, S., and Basar, T. (2013). Dependable demand response management in the smart grid: A Stackelberg game approach. IEEE Trans. Smart Grid 4 (1), 120–132. doi:10.1109/TSG.2012.2223766
Mazidi, M. R., Aghazadeh, M., Teshnizi, Y. A., and Mohagheghi, E. (2013). Optimal placement of switching devices in distribution networks using multi-objective genetic algorithm NSGAII,” in 2013 21st Iranian Conference on Electrical Engineering (Mashhad, Iran: ICEE), 1–6.
Mirzapour-Kamanaj, A., Majidi, M., Zare, K., and Kazemzadeh, R. (2020). Optimal strategic coordination of distribution networks and interconnected energy hubs: A linear multi-follower bi-level optimization model. Int. J. Electr. Power & Energy Syst. 119, 105925. doi:10.1016/j.ijepes.2020.105925
Monderer, D., and Shapley, L. S. (1996). Potential games. Games Econ. Behav. 14 (1), 124–143. doi:10.1006/game.1996.0044
Pang, H., and Shi, L. (2021). “Active distribution network expansion planning considering demand response and NON-cooperative multi-stakeholder game,” in The 10th Renewable Power Generation Conference (RPG), 515–522.
Qazi, A., Hussain, F., Rahim, N. A., Hardaker, G., Alghazzawi, D., Shaban, K., et al. (2019). Towards sustainable energy: A systematic review of renewable energy sources, technologies, and public opinions. IEEE Access 7, 63837–63851. doi:10.1109/ACCESS.2019.2906402
Samadi, P., Mohsenian-Rad, H., Schober, R., and Wong, V. W. S. (2012). Advanced demand side management for the future smart grid using mechanism design. IEEE Trans. Smart Grid 3 (3), 1170–1180. doi:10.1109/TSG.2012.2203341
Santos, F. C., and Pacheco, J. M. (2005). Scale-free networks provide a unifying framework for the emergence of cooperation. Phys. Rev. Lett. 95 (9), 098104. doi:10.1103/PhysRevLett.95.098104
Shahbaz, M., Raghutla, C., Chittedi, K. R., Jiao, Z., and Vo, X. V. (2020). The effect of renewable energy consumption on economic growth: Evidence from the renewable energy country attractive index. Energy 207, 118162. doi:10.1016/j.energy.2020.118162
Taylor, J. A., and Hover, F. S. (2012). Convex models of distribution system reconfiguration. IEEE Trans. Power Syst. 27 (3), 1407–1413. doi:10.1109/TPWRS.2012.2184307
Wu, F., Yang, J., Zhan, X., Liao, S., and Xu, J. (2021). The online charging and discharging scheduling potential of electric vehicles considering the uncertain responses of users. IEEE Trans. Power Syst. 36 (3), 1794–1806. doi:10.1109/TPWRS.2020.3029836
Yamamoto, K. (2015). A comprehensive survey of potential game approaches to wireless networks. IEICE Trans. Commun. E98 (9), 1804–1823. doi:10.1587/transcom.E98.B.1804
Keywords: bounded rationality, active distribution network, potential game, social networks, distributed optimization algorithm
Citation: Wang H, Ligao J, Wu F, Yang J, Zhu X, Wan L, Zhang K, Yang S and Kamel S (2022) A multi-stakeholder potential game model in active distribution network considering the bounded rationality of small users. Front. Energy Res. 10:946799. doi: 10.3389/fenrg.2022.946799
Received: 18 May 2022; Accepted: 11 July 2022;
Published: 11 August 2022.
Edited by:
Peng Li, Tianjin University, ChinaReviewed by:
Wei Zhou, Dalian University of Technology, ChinaDong Liang, Hebei University of Technology, China
Yuanyuan Chai, Hebei University of Technology, China
Copyright © 2022 Wang, Ligao, Wu, Yang, Zhu, Wan, Zhang, Yang and Kamel. This is an open-access article distributed under the terms of the Creative Commons Attribution License (CC BY). The use, distribution or reproduction in other forums is permitted, provided the original author(s) and the copyright owner(s) are credited and that the original publication in this journal is cited, in accordance with accepted academic practice. No use, distribution or reproduction is permitted which does not comply with these terms.
*Correspondence: Junjie Ligao, anVuamllX2xnQHdodS5lZHUuY24=