 Jinming Zhang
 Xun Zhou
 Wei Du
 Senpei Xu
- School of Energy Science and Engineering, Harbin Institute of Technology, Harbin, China
The effects of film cooling holes on the suction surface and the coolant mass flow were studied in this research, which focused on load distribution and flow characteristics such as shock migration. A high and low degree of reaction scheme (degree of reaction = 0.3, 0.53) is selected to numerically investigate the aerodynamic performance with consideration of air film cooling. The results show that the above factors have different influences on the intensity and the trailing edge shock direction. The reflected shock weakens and then recovers when the coolant ejection position approaches and departs from the reflection point. Altering the coolant ejection position or coolant mass flow rate mainly affects the load at the front and middle of the blade and has some effects on the pressure rise at the trailing edge as well. There is an optimal position (x/Cax = 0.6) and optimal coolant volume (10% mainstream mass flow rate) for flattening the pressure rise and weakening shocks, thereby reducing losses.
1 Introduction
The pursuit of efficiency, light weight, and large thrust results in an ultra-high-load operating condition for aero-engine turbine blades. With the continual increase of load in modern turbines, a higher turbine exit Mach number is acquired owing to a larger turbine pressure ratio. However, the transonic speed condition usually brings up complex shock structures within the transonic turbine blade passage, especially at the trailing edge. The trailing edge shock has two branches. The inner trailing shock impinges on the suction surface of the adjacent blade, and it will have an impact on the flow field and increase losses. The other one, called the outer trailing shock, strikes into the exit of the passage, which will have a great effect on the flow behaviors downstream of the blade cascade and interact with the trailing trace. The trailing edge shock loss accounts for a major part of the loss (Yang, 2014). Therefore, controlling shock loss in transonic turbines can effectively improve the aerodynamic performance.
There are numerous simulations and experiments to clarify various loss mechanisms. Langston et al. (1977) achieved the endwall flow visualization using ink and then investigated crossflows in a turbine cascade passage (Langston 1980). Denton (1993) predicted that trailing edge shock losses were major losses in transonic turbine cascades. Michelassi et al. (1997) predicted that the transition started in this area where the shock impinged on the suction side, and experiments also confirmed that. Bian et al. (2020) found that a separation bubble might lead to reflection, due to the rising incident angle of the oblique shock wave. In particular, it was obtained using a hybrid RANS/LES strategy. Employing experiments in a compression tube and simulations of computational fluid dynamics (CFD), Yasa et al. (2007) demonstrated the decrease of circumferential velocity as a contributor to the rising positive incidence angles. In addition, the increase affected losses associated with the trailing edge. Corriveau and Sjolander (2004) measured and compared the midspan aerodynamic performance with three different airfoils at design incidence. These results indicated the aft-loaded airfoil blade produced the least losses among all airfoil blades around the design Mach number. Nevertheless, when it reached the over-design Mach number, the performance of the aft-loaded airfoil blade would worsen more quickly. For all operating conditions, the front-loaded airfoil blade had the worst performance. Zhou et al. (2020) revealed that shock wave near the trailing edge was largely determined by the scope of the base region. Thus, it was useful to increase the trailing wedge angle to decrease shock losses.
The optimization of the blade profile design is one mainstream method to reduce shock losses in the transonic turbine at present. Ji et al. (2004) pointed out that trailing edge thickness and blade surface velocity distribution near the trailing edge were the substantial factors of overall performance; the reasonable blade design could eliminate or weaken the reflected shock on the suction surface. Sonoda et al. (2006) applied the evolutionary algorithm to optimize the pressure-side profile near the trailing edge; after adjusting, it could induce such a double shock system or multi-shock system to reduce the trailing edge shock losses. Zhao et al. (2016) adopted a negative curvature on the uncooled suction side. This blade delayed the intersection point of the reflected pressure-side (PS) trailing edge shock with the SS trailing edge shock, resulting in lower shock losses. Shelton et al. (1993) combined AI with an inviscid and adaptive grid CFD solver to achieve the optimization of a transonic turbine airfoil. The optimal design successfully dropped the intensity of shock waves near the trailing edge on the suction surface, resulting in a more uniform outlet flow field. Chen et al. (2018) adjusted the curvature of transonic turbine blades and increased the relative length of the diffuser section after the throat region, which constructed a local acceleration region and a series of compression shocks, thereby not only increasing the turbine blade load but also attenuating the strength of the shock within the blade cascade.
It is well known that the performance of a gas turbine can be significantly improved by raising the turbine inlet temperature, which also leads to the severer operating condition for the single-stage transonic turbine. To cope with the components’ extremely high thermal load, it is essential to introduce effective cooling means into the gas turbine. The two mainstream cooling methods in turbines are film cooling and jet cooling. It also has been concluded that coolant from the air film cooling holes or cooling slots on the suction surface can supply a certain amount of energy for the flow within the boundary layer, which is helpful to decrease the adverse pressure gradient in the area where shock waves exist. In addition, trailing edge coolant ejection is enabled to reduce shock losses by increasing the base pressures (Deckers and Denton, 1997).
Day et al. (2000) measured diverse coolant geometries including cylindrical and fan-shaped holes in an annular cascade; the latter had larger increases in aerodynamic losses relative to the uncooled blade. Rehder (2012) found that the central trailing edge ejection configuration obtained the lowest loss level, revealing its superiority over the PS cut-back and slot and PS film cooling configurations. The louver cooling scheme has the best performance, as shown by Zhang and Hassan (2012), who compared different-shaped hole cooling schemes at different blowing ratios, while it should prevent the film cooling hole from this region, where the mainstream flow field became supersonic under the extremely high blowing ratio. Wang and Zhao (2013) numerically and experimentally investigated the performance of the transonic turbine cascade with different trailing edge ejections. The ejection model’s prediction results were validated using experimental data in this study, and the influences on the vortex by symmetry slot ejection and PS cut-back ejection are shown. The adiabatic film cooling effectiveness and heat transfer coefficient were experimentally investigated by Chappell et al. (2008), who compared different-shaped holes and configurations in the suction side grill region. The round radial hole arrangement obtained the best performance, considering the largest coverage of blowing ratios and streamwise locations. Kodzwa and Eaton (2010) measured the two rows of compound-angle round holes on the pressure surface of a transonic rotor blade, and they found that high levels of turbulence motivated the cooling film reattachment on the surface. Andrey et al. (2018) selected the unguided turning angle as a variant to optimize blades, which increased base pressure by raising the unguided turning angle. Based on the aerodynamic flow field measurements, El-Gabry et al. (2015) found that the upstream hub coolant had difficulty reaching the PS because of the second flow. Burdet and Abhari (2006) added the feature-based film cooling jet module as a separate module in the computational mesh using the implicit immersed boundary method and evaluated the prediction of the adiabatic cooling effectiveness on the blade surface. Furthermore, the optimization of the film cooling hole arrangement had been realized using the CFD code. Saha et al. (2013) surveyed a transonic film-cooled NGV with all the cooling air ejections placed on the front part of it before the throat. They found that the aerodynamic losses varied with the cold airflow regardless of the position of the air film holes; moreover, the suction side cooling was more sensitive than the PS cooling to aerodynamic losses caused by the variation of blow ratio. Alameldin et al. (2014) proposed a simplified method of directly introducing the coolant into the vane surface as a boundary condition, and the computational results were in great agreement with the experimental results of Saha et al. (2013). To analyze the film cooling and shock wave interaction, an uncertainty quantification methodology was presented by Carnevale et al. (2014), regarding the variability of geometrical parameters as uniform probability distributions. The downstream of the shock impingement region was where the maximum level of uncertainty was determined. By conducting a series of experiments and computational calculations on a high-pressure turbine blade cascade with trailing edge injection, Gao et al. (2019) explored the aerodynamic loss behaviors of the blade at different exit Mach numbers and mass flow ratios. They summarized that the overall flow angle could be increased with trailing edge ejection at all exit Mach numbers.
It should be noted that most of the above computational and experimental results were obtained regardless of the influence of different degrees of reaction (DORs). However, the DOR has great importance in weighing the degree of gas expansion inside the turbine rotor, which determines the intricate flow field and causes further significant changes in turbine performance. The coolant ejection after mixing with the mainstream interferes with the shock at the trailing edge. The present study numerically investigates the effects of film cooling hole positions and coolant mass flow rates on the aerodynamic characteristics of a transonic turbine with different DORs at high exit Mach number, aiming to summarize the aerodynamic characteristics of such single-stage transonic turbine and provide detailed flow behavior patterns with the movement of cooling hole rows.
2 Computational Setup and Validation
2.1 Computational Model
The public PW-E3 blade profile is adopted in the present work (Thulin et al., 1982). An internal Blade-Editor code independently completed by the Harbin Institute of Technology has been further developed for the blade design of the single-stage cooled transonic turbine. The Blade-Editor code based on the 11-parameter method models the blade using three profiles, which are stacked to form a 3D blade shape. The mass flow rate of a single-stage blade cascade is approximately 29.53 kg/s. To weigh the effect of different DORs, high- and low-DOR designs were employed, with DOR = 0.3, 0.53. The DOR was defined as
A row of uniformly arranged 10 air film holes is set along the spanwise direction on the rotor blades suction surface. Each hole in the same row has identical geometrical parameters. In this work, the round holes with diameters of 0.5 mm are adopted. In addition, the coolant from each hole ejects at 45° downstream of the channel. Figure 1 shows the computational model.
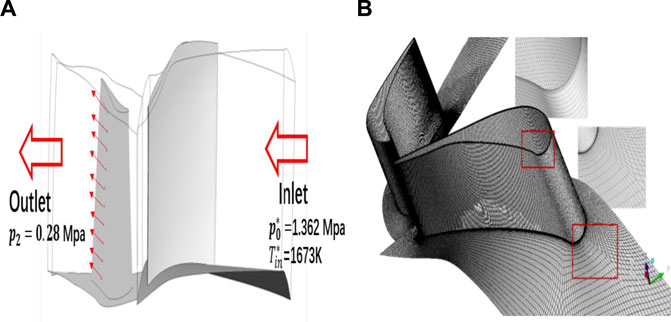
FIGURE 1. Computational model. (A) Geometry. (B) Grid system.
2.2 Boundary Condition and Computational Fluid Dynamics Validation
The CFD problems in this study were solved using CFX. All the walls are set to no-slip condition. The rotational speed is given as 13,232 r/min. The boundary condition includes the inlet total temperature of 1,673 K and the inlet total pressure of 1.362 MPa, and the drop pressure ratio is approximately 4.4. Considering the actual situation, the cooling structure will be set for both rotor and static blades. There are usually multiple rows of air film cooling holes. To simplify the model, the coolant total mass flow rate is set to 5% of the mainstream flow rate; thus, the
The shear stress transport (SST)-γ-θ transition model has higher accuracy in the simulation of the flow structure in the gas turbine and is widely applied to study turbine blade surfaces and film cooling effectiveness (Li et al., 2017; Occhioni et al., 2017). Therefore, the turbulence model is selected as the SST-γ-θ model. The computational mesh generation is realized using the self-developed automatic grid generation codes mentioned in the last section. Moreover, the structured grids are generated using the O-4H topology for the rotor and static blades. The generated mesh is shown in Figure 1B. The mesh quality has been checked using the ICEM CFD, and the results show that the mesh quality is greater than 0.3, which meets the requirements of this research for mesh quality. The y+ values near the wall are all less than 1, which meets the requirements of the turbulence model.
To get an excellent trade-off between the prediction accuracy and computer resources, a mesh independence verification is conducted regarding the exit maximum number as the parameter. It also can be seen from Figure 2 that the maximum Mach number increases with the increase of grid number. When the grid number reaches more than 4 million, the exit maximum Mach number is almost constant. The number of grid elements in the range of 3–4 million is a more stable choice for the calculation results. Therefore, 3.77 million grid elements are selected in this study.
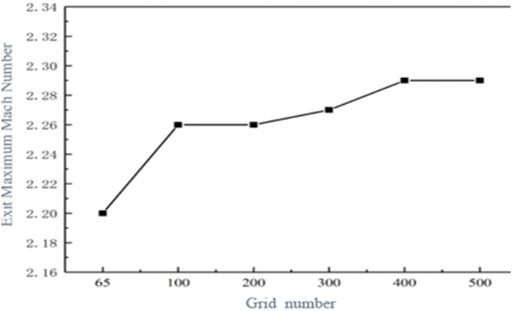
FIGURE 2. Exit maximum Mach number of different gird numbers.
The numerical simulation was compared with Kopper’s experimental data about the midspan pressure distribution of the PW-E3 stator (Kopper et al., 1981). From Figure 3, it can be seen that the numerical result using the SST-γ-θ turbulence model is consistent with the experimental data.
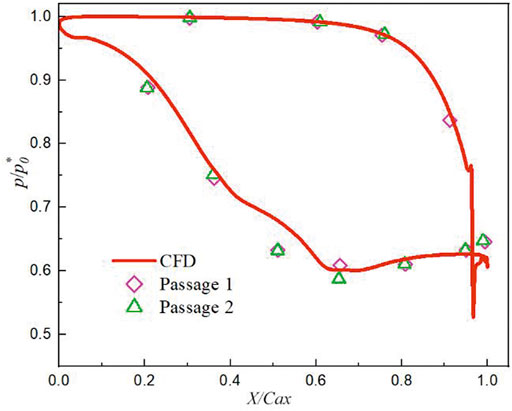
FIGURE 3. Comparison of numerical result with experimental data.
3 Results and Discussion
3.1 Effect of Film Cooling Hole Position on Aerodynamic Performance
3.1.1 Research Program Design
This section aims to investigate the relationships between the trailing edge shock or its reflected shock and the coolant ejection on the suction side. As a result, the film cooling holes are distributed on the SS. The specific study schemes are listed in Table 1. As for low-DOR blade airfoils (DOR = 0.3), the air film cooling holes are located at x/Cax = 0.4, 0.5, 0.6, and 0.7, which are called Cases BL1, BL2, BL3, and BL4, respectively. Besides, Case BL0 without air film holes is set as the baseline. In the high-DOR group (DOR = 0.53), the air film cooling holes are located at x/Cax = 0.4, 0.6, 0.7, and 0.8, which are called Cases BH1, BH2, BH3, and BH4, respectively. Case BH0, which has no film hole, is set as the baseline.
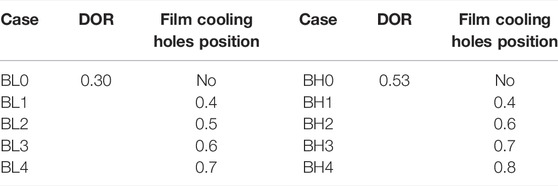
TABLE 1. Research schemes for the effect of film cooling hole position.
3.1.2 The Effect of Film Cooling Hole Position
Figure 4 shows the surface pressure distribution along the spanwise direction for the two DOR blade designs. The addition of coolant affects blade load distribution and shock intensity. At the blade root, there is some pressure rise due to the coolant from the film cooling holes for DOR = 0.53, as shown in Figure 4A, and the load has been reduced slightly. However, the load increases first and then decreases in the low-DOR blade. Figure 4B presents different pressure distributions for two DOR blade designs, the high-DOR blade’s load also reduces modestly at the midspan of the blade, but the addition of coolant does not affect the pressure distribution for the low-DOR blade. In Figure 4C, the high-DOR blade’s load increases at the leading edge (LE) and trailing edge (TE) at the blade tip. As for the low-DOR blade, the overall load has increased.
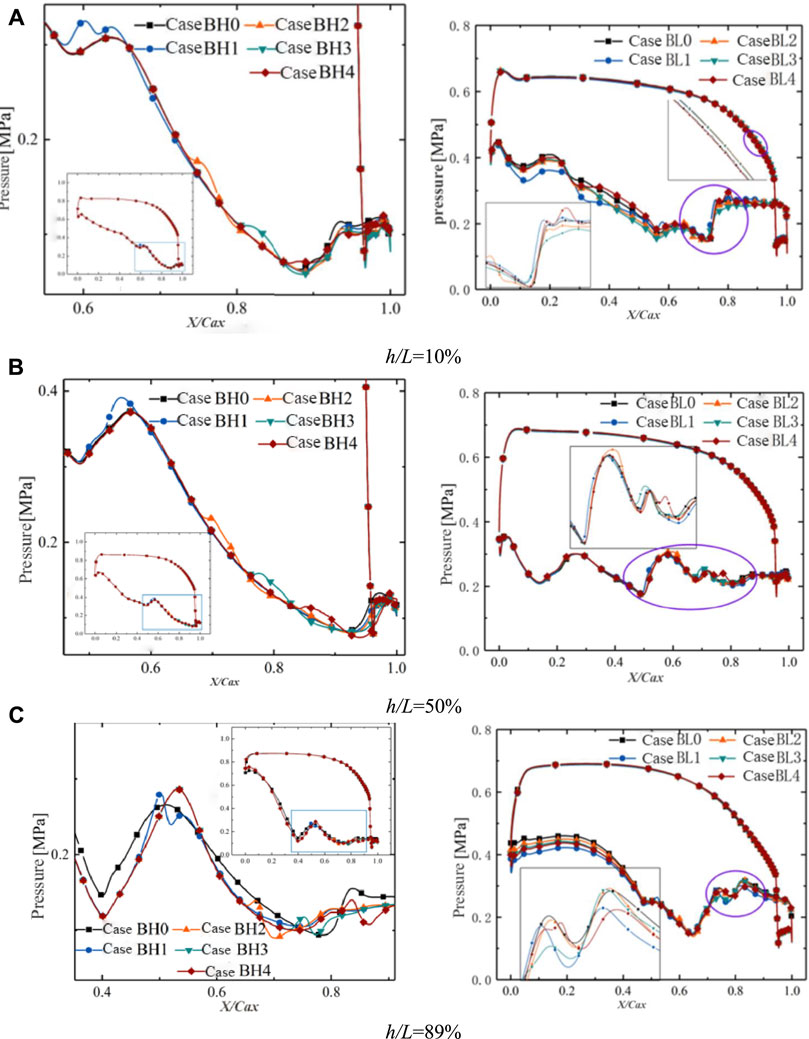
FIGURE 4. The pressure distribution in different height sections for two degrees of reaction (DORs). (A) h/L = 10%, (B) h/L = 50%, and (C) h/L = 89%.
For DOR = 0.53, after introducing the coolant, one large pressure rise still exists at approximately 0.9 of the flow direction range, indicating that the shock at this location has not disappeared. Based on the comparison of different cases for DOR = 0.53, the amplitude and slope of pressure rise decrease as the location of the air film hole moves forward to the TE. In particular at the blade tip, the sharp pressure rise gradually transforms into a flat one and happens in advance. As a result, it can be assumed that the shock is weakening until it disappears.
For DOR = 0.3, the right figures in Figure 4 show that the shock exists at the nondimensional flow position range above 0.5. From Figure 4A, since the coolant ejects before the pressure rise in Case BL3, there is a pressure drop at the blade root before the pressure rise, and the pressure is relatively smaller after a mild rise. It is considered here to be a weaker shock. The same conclusion at the first large pressure rise can be concluded from Figure 4C. It is noted that there is a consequent slighter pressure rise and an adverse pressure gradient. These fluctuations in Cases BL1 and BL2 are the same as those in BL0. In addition, Case BL3 has less pressure after the first big pressure rise, but the pressure raises to this in BL0 after the second pressure rise, which represents an enhanced shock. For Case BL4, the pressure rise is smoother and smaller because of the forward position of the coolant ejection.
Figure 5 shows the density distribution in the 10% and 89% blade span sections. Comparing Case BL2 with Case BL4 in the h/L = 10% section, we found that as the coolant ejection position approaches the reflection point of the shock, which is located on the suction surface of the adjacent blade, the reflected shock is mitigated accordingly. In Figure 5A, when the position of the film cooling holes reaches downstream of the shock reflection point, the reflected shock reappears, and the coolant jet causes a significant disturbance to the flow inside of the passage. The same pattern is observed in the 89% blade span section. It can be concluded that if the row of the cooling hole is next to the reflection point, the shock intensity will suffer undermining.
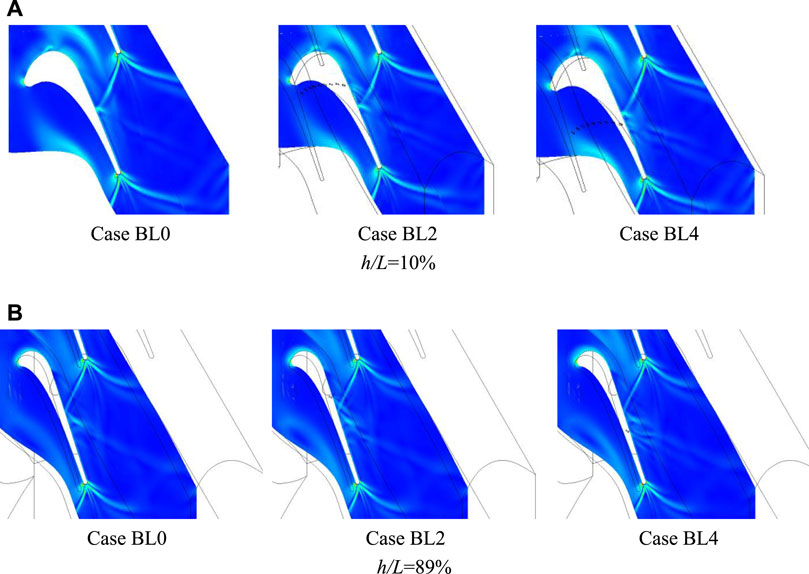
FIGURE 5. Density gradient distribution in the different sections of low-degree-of-reaction (DOR) blade airfoil. (A) h/L = 10% and (B) h/L = 89%.
Figure 6 shows the spanwise single-row cooling effectiveness distribution. The adiabatic film cooling effectiveness was defined (Zeng et al., 2018). As the cooling hole row location reaches the shock reflection point, the direction of coolant ejection into the channel varies. Because the distance between the row and the shock reflection point reaches a minimum, the shock intensity suffers weakening. Case BL2 has the best cooling effectiveness among the cases.
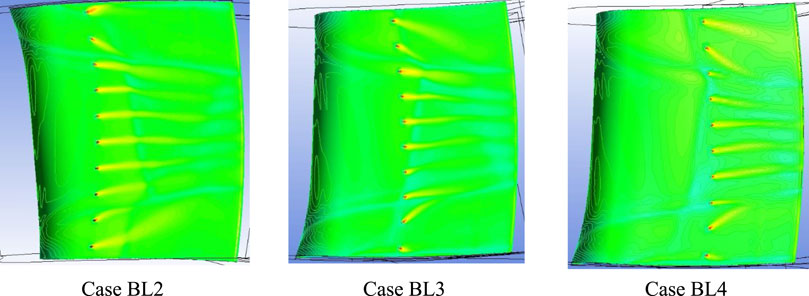
FIGURE 6. Adiabatic film cooling effectiveness η contours of low-degree-of-reaction (DOR) blade airfoil.
There are intricate secondary flow structures after coolant ejection near the blade tip. Because of the low coolant momentum, the coolant might be deflected to the midspan region by the secondary flow shown in Figure 6. As the cooling hole row deviates from the reflection point, the coolant momentum decreases further after more oblique shocks. In particular near the blade tip, the coolant ejects more toward the midspan region and obtains poor cooling effectiveness.
3.2 Effect of Coolant Mass Flow Rate on Aerodynamic Performance
3.2.1 Research Program Design
Compared to other cases, the pressure rise is featured as the smoothest in Case BH2 and the severest in Case BL2, which suggests the intense interference induced by coolant. The row of film cooling holes is located at x/Cax = 0.6, to investigate the effect of various
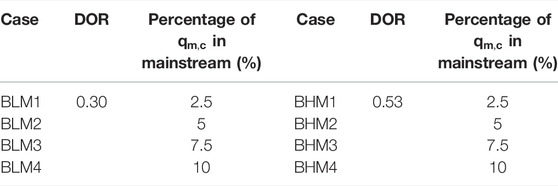
TABLE 2. Research schemes for the effect of various coolant mass flow rates.
3.2.2 Effect of Coolant Mass Flow Rate
Figure 7 shows the pressure distribution in the h/L = 10%, 50%, and 89% sections for two different DORs. The different coolant mass flow rates impact the load distribution and pressure fluctuations to varying degrees. The variation of
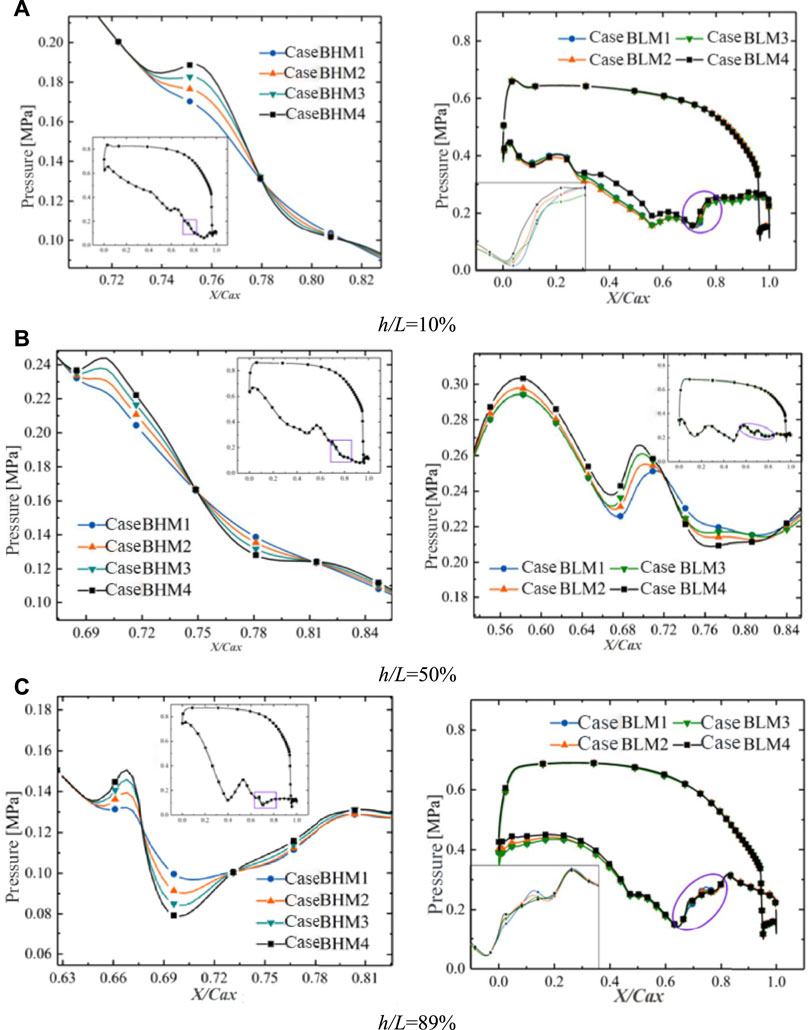
FIGURE 7. The pressure distribution in different height sections for two degrees of reaction (DORs). (A) h/L = 10%, (B) h/L = 50%, and (C) h/L = 89%.
For DOR = 0.53, as the coolant mass flow rate persistently rises, the pressure rise range gradually increases, and the adverse pressure gradient also scales up. There is a trend of pressure rebound at the TE, as shown in Figure 7. The rebound amplitude increases with lifting coolant mass flow rates. The increase is easier to observe at the blade tip (as shown in Figure 7C). As the coolant mass flow rate increases, the influence of coolant ejection expands, and the low Mach number region narrows. The wall boundary layer has been thickened by coolant ejection, and the low Mach number region expands at the coolant ejection position downstream, especially near the blade tip (as shown in Figure 8). The high Mach number region at the upstream of the inner trailing shock is crossed by a strip of low Mach number band formed by the coolant. The mainstream continues to accelerate after mixing with the coolant, which leads to a local high Mach number region appearing near the film cooling holes downstream. Then, the airflow decelerates again because of the thickening boundary layer. The above flow behaviors are consistent with the pressure fluctuations existing at the downstream suction surface in Figure 7C.
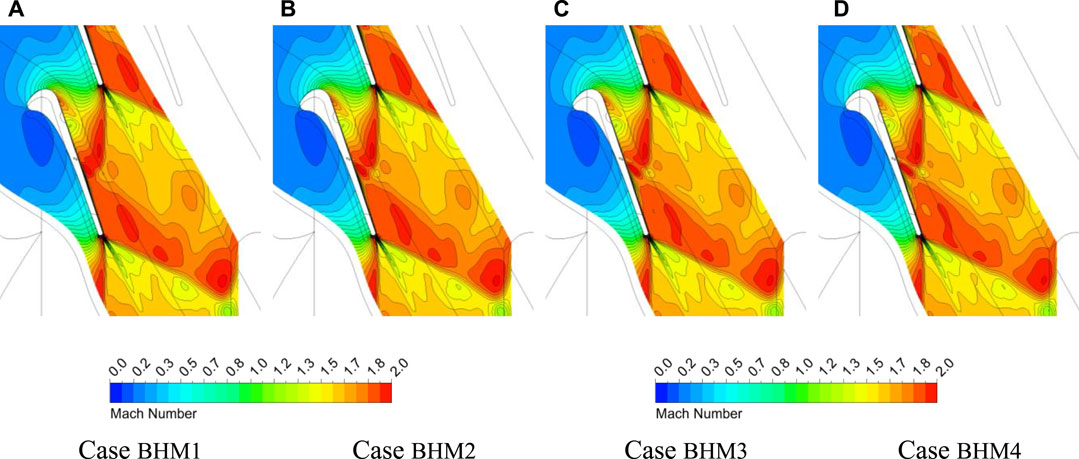
FIGURE 8. Mach number contours in the h/L = 89% section of high-degree-of-reaction (DOR) blade airfoil. (A) Case BHM1, (B) Case BHM2, (C) Case BHM3, and (D) Case BHM4.
Figure 9 shows the density distribution in the h/L = 10% and 50% sections. It is inferred that increasing
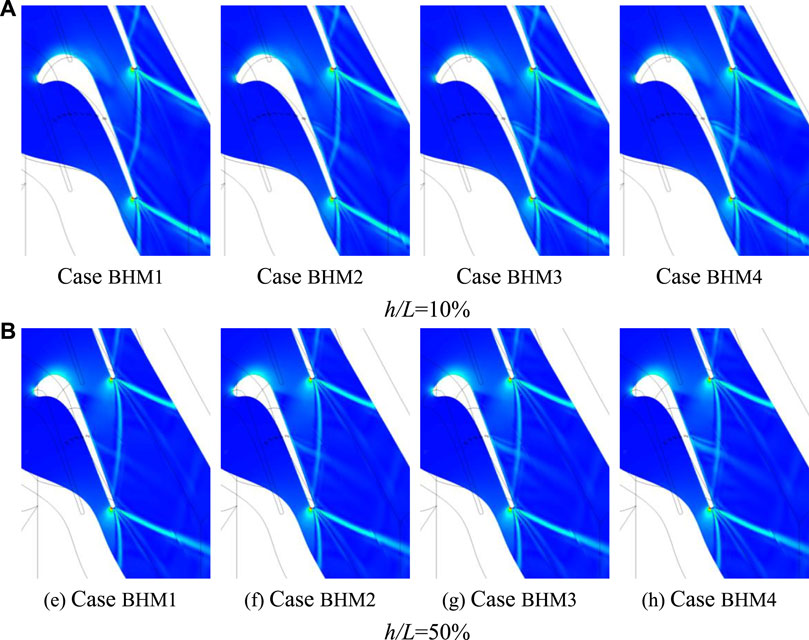
FIGURE 9. Density gradient distribution in the different height sections of high-degree-of-reaction (DOR) blade airfoil. (A) h/L = 10% and (B) h/L = 50%.
Besides the load of the front and middle of the blade, Figure 9 demonstrates that increasing
Figure 10 depicts the Mach number distributions in different spanwise sections. It is found that the low Mach number region in the trailing trace scales up along with
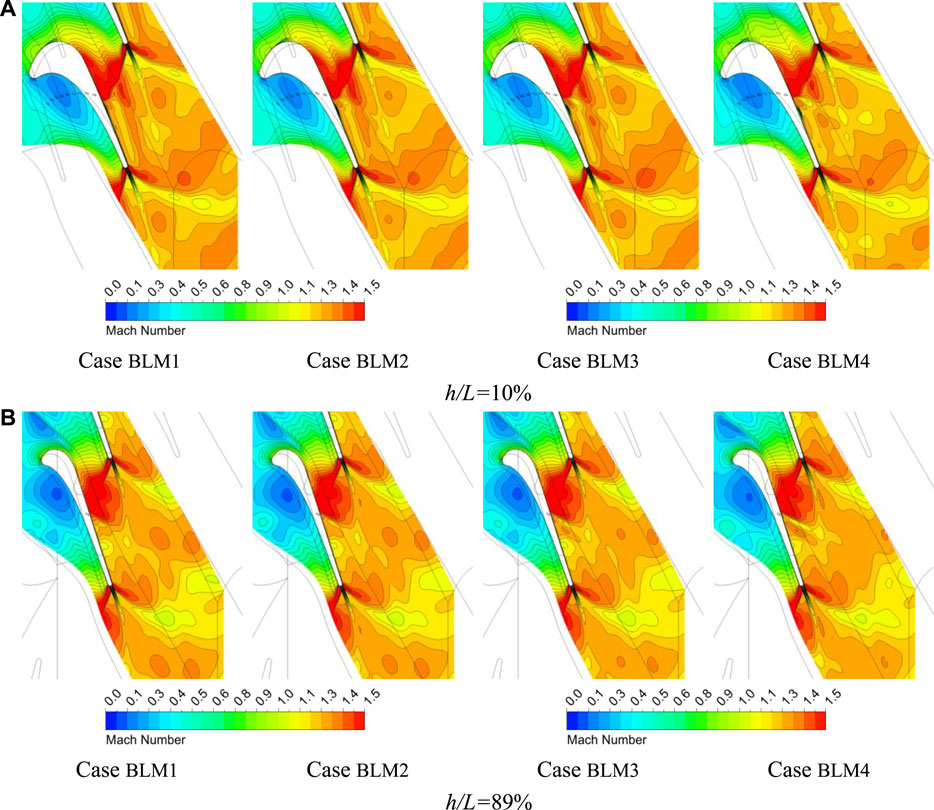
FIGURE 10. Mach number contours in different height sections of low-degree-of-reaction (DOR) blade airfoil. (A) h/L = 10% and (B) h/L = 89%.
The density distributions in different spanwise sections for DOR = 0.3 are given in Figure 11. As
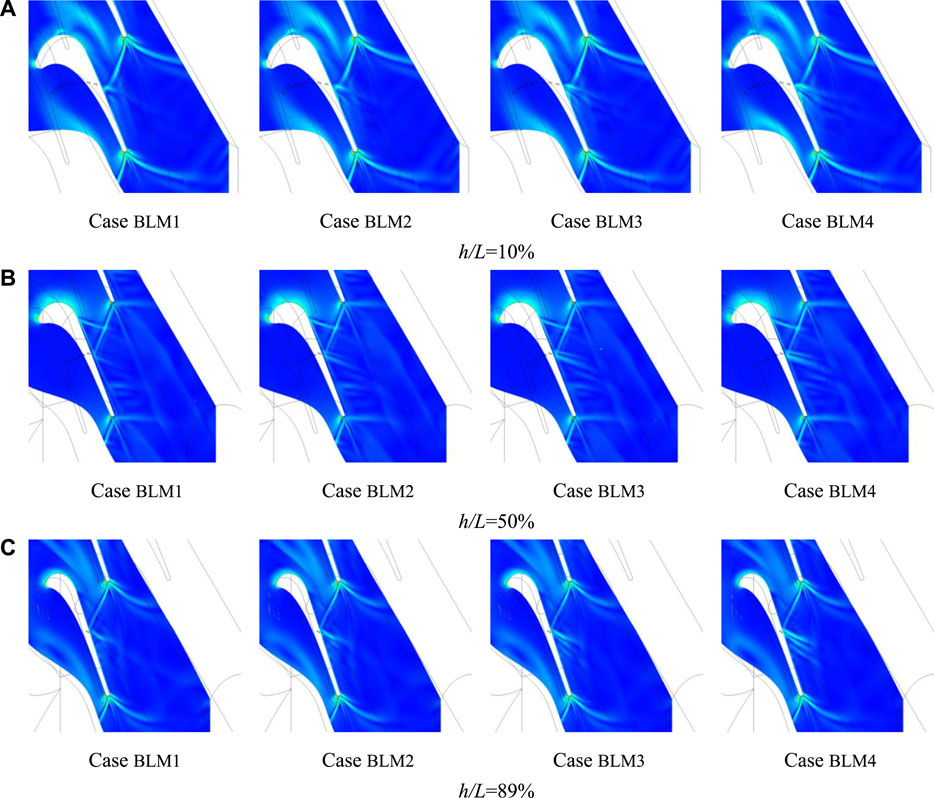
FIGURE 11. Density gradient distribution in the different height sections of low-degree-of-reaction (DOR) blade airfoil. (A) h/L = 10%, (B) h/L = 50%, and (C) h/L = 89%.
4 Conclusion
In this study, the effect of coolant on the aerodynamic performance of the transonic turbine blade cascade is investigated numerically. To understand the aerodynamic flow behaviors within the rotor due to various coolant ejection positions and coolant mass flow rates, two designed high-DOR (=0.53) and low-DOR (=0.3) blade airfoils are compared and analyzed. The main findings are summarized as follows:
1) In the process of film cooling hole position migrating to the TE, the reflected shock is weakened and then recovered when the cooling holes approach and depart from the reflection point of shock. The pressure rise weakens at the TE for the high-DOR blade airfoil. For the low-DOR blade airfoil, it was weak at first and then became stronger. When the row of film cooling holes locates at x/Cax = 0.6, the pressure rise reaches a minimum.
2) The increase of coolant mass flow rates thickens the downstream boundary layer, which is more impactful for the low-DOR blade airfoil. When the coolant mass flow rate is 1% of the mainstream flow, the load reduces to a minimum. As the coolant mass flow rate increases, the inner trailing shock gets enhanced, and the shock incidence point shifts back to the LE at the blade root, but this incidence point is closer to the TE at the midspan and tip of the blade. The outer trailing shock inclines to cover the wall at the blade root and deviates from the wall at the blade tip.
Data Availability Statement
The original contributions presented in the study are included in the article/Supplementary Material, and further inquiries can be directed to the corresponding author.
Author Contributions
XZ is responsible for the overall guidance, JZ is responsible for the main calculation and analysis, WD is responsible for the technical guidance, SX is responsible for writing the original draft.
Conflict of Interest
The authors declare that the research was conducted in the absence of any commercial or financial relationships that could be construed as a potential conflict of interest.
Publisher’s Note
All claims expressed in this article are solely those of the authors and do not necessarily represent those of their affiliated organizations, or those of the publisher, the editors, and the reviewers. Any product that may be evaluated in this article, or claim that may be made by its manufacturer, is not guaranteed or endorsed by the publisher.
Acknowledgments
The authors acknowledge the financial support provided by the National Science and Technology Major Project (No. 2017-II-0007-0021 and No. 2019-II-0010-0030) and the Natural Science Foundation of China (No.52106041 and No.52076053).
References
Alameldin, A., El-Gabry, L. A., Fridh, J., and Saha, R. (2014). “CFD Analysis of Suction and Pressure Side Film Cooling Influence on Vane Aero Performance in a Transonic Annular Cascade,” in Proceedings of the ASME Turbo Expo 2014: Turbine Technical Conference and Exposition. Volume 2C: Turbomachinery (Düsseldorf, Germany: ASME). doi:10.1115/GT2014-26617
Andrey, G., Vladimir, G., and Nikolai, L. (2018). Experimental and Numerical Study of Transonic Cooled Turbine Blades[J]. Int. J. Turbomach. Propuls. Power 3 (2), 16. doi:10.3390/ijtpp3020016
Bian, X., Wang, Q., Su, X., and Yuan, X. (2020). Interaction Mechanisms of Shock Waves with the Boundary Layer and Wakes in a Highly-Loaded NGV Using Hybrid RANS/LES. Chin. J. Aeronautics 33 (1), 149–160. doi:10.1016/j.cja.2019.07.008
Burdet, A., and Abhari, R. S. (2006). Three-Dimensional Flow Prediction and Improvement of Holes Arrangement of a Film-Cooled Turbine Blade Using a Feature-Based Jet Model. J. Turbomach. 129 (2), 258–268. doi:10.1115/1.2437778
Carnevale, M., D’Ammaro, A., Montomoli, F., and Salvadori, S. (2014). “Film Cooling and Shock Interaction: An Uncertainty Quantification Analysis with Transonic Flows,” in Proceedings of the ASME Turbo Expo 2014: Turbine Technical Conference and Exposition. Volume 5B: Heat Transfer (Düsseldorf, Germany: ASME). doi:10.1115/GT2014-25024
Chappell, J., Ligrani, P., Sreekanth, S., and Lucas, T. (2008). “Suction-Side Gill-Region Film Cooling: Effects of Hole Shape and Orientation on Adiabatic Effectiveness and Heat Transfer Coefficient,” in Proceedings of the ASME Turbo Expo 2008: Power for Land, Sea, and Air. Volume 4: Heat Transfer, Parts A and B (Berlin, Germany: ASME), 745–758. doi:10.1115/GT2008-50798
Chen, Y., Wang, L., and Ma, G. J. (2018). Profile Design of High Load Transonic Turbine. Gas. Turbine Exp. Res. 31, 18–37. (in Chinese).
Corriveau, D., and Sjolander, S. A. (2004). Influence of Loading Distribution on the Performance of Transonic High Pressure Turbine Blades. J. Turbomach. 126 (2), 288–296. doi:10.1115/1.1645534
Day, C. R. B., Oldfield, M. L. G., and Lock, G. D. (2000). Aerodynamic Performance of an Annular Cascade of Film Cooled Nozzle Guide Vanes under Engine Representative Conditions. Exp. Fluids 29, 117–129. doi:10.1007/s003489900062
Deckers, M., and Denton, J. D. (1997). “The Aerodynamics of Trailing-Edge-Cooled Transonic Turbine Blades: Part 1 — Experimental Approach,” in Proceedings of the ASME 1997 International Gas Turbine and Aeroengine Congress and Exhibition. Volume 1: Aircraft Engine; Marine; Turbomachinery; Microturbines and Small Turbomachinery (Orlando, Florida, USA: ASME). doi:10.1115/97-GT-518
Denton, J. D. (1993). The 1993 IGTI Scholar Lecture: Loss Mechanisms in Turbomachines. J. Turbomach. 115 (4), 621–656. doi:10.1115/1.2929299
Dixon, S. L., and Hall, C. (2013). Fluid Mechanics and Thermodynamics of Turbomachinery. Oxford: Pergamon Press.
El-Gabry, L. A., Saha, R., Fridh, J., and Fransson, T. (2015). Measurements of Hub Flow Interaction on Film Cooled Nozzle Guide Vane in Transonic Annular Cascade. J. Turbomach. 137 (8), 081004. doi:10.1115/1.4029242
Gao, J., Wei, M., Fu, W., Zheng, Q., and Yue, G. (2019). Experimental and Numerical Investigations of Trailing Edge Injection in a Transonic Turbine Cascade. Aerosp. Sci. Technol. 92, 258–268. doi:10.1016/j.ast.2019.05.069
Gardner, W. (1979). Energy Efficient Engine: High Pressure Turbine Uncooled Rig Technology Report. USA: NASA-Lewis Research Center.
Ji, L., Huang, H., Chen, J., Yu, H. L., and Xu, J. Z. (2004). Design and Test of a Supersonic Cascade Used for the Vaneless Counter-rotating Turbine [J]. J. Eng. Thermophys. 25 (1), 45–48. (in Chinese).
Kodzwa, P. M., and Eaton, J. K. (2010). Film Effectiveness Measurements on the Pressure Surface of a Transonic Airfoil[J]. J. Propuls. Power 26, 837. doi:10.2514/1.46668
Kopper, F., Milano, R., Davis, R., Dring, R., and Stoeffler, R. (1981). Energy Efficient Engine High-Pressure Turbine Supersonic Cascade Technology Report. USA: Lewis Research Center.
Langston, L. S. (1980). Crossflows in a Turbine Cascade Passage. J. Eng. Power. 102 (4), 866–874. doi:10.1115/1.3230352
Langston, L. S., Nice, M. L., and Hooper, R. M. (1977). Three-Dimensional Flow within a Turbine Cascade Passage. J. Eng. Power 99 (1), 21–28. doi:10.1115/1.3446247
Li, X., Ren, J., and Jiang, H. (2017). “On the Reliability of RANS Turbulence Models for Endwall Cooling Prediction,” in Proceedings of the ASME Turbo Expo 2017: Turbomachinery Technical Conference and Exposition. 5A: Heat Transfer (Charlotte, North Carolina, USA: ASME). doi:10.1115/GT2017-65207
Michelassi, V., Rodi, W., and Gieß, P.-A. (1997). “Experimental and Numerical Investigation of Boundary-Layer and Wake Development in a Transonic Turbine Cascade,” in Proceedings of the ASME 1997 International Gas Turbine and Aeroengine Congress and Exhibition. Volume 1: Aircraft Engine; Marine; Turbomachinery; Microturbines and Small Turbomachinery (Orlando, Florida, USA: ASME). doi:10.1115/97-GT-483
Occhioni, G., Shahpar, S., and Li, H. (2017). “Multi-Fidelity Modelling of a Fully-Featured HP Turbine Stage,” in Proceedings of the ASME Turbo Expo 2017: Turbomachinery Technical Conference and Exposition. Volume 2A: Turbomachinery (Charlotte, North Carolina, USA: ASME). doi:10.1115/GT2017-64478
Rehder, H.-J. (2012). Investigation of Trailing Edge Cooling Concepts in a High Pressure Turbine Cascade-Aerodynamic Experiments and Loss Analysis. J. Turbomach. 134 (5), 051029. doi:10.1115/1.4004748
Saha, R., Fridh, J., Fransson, T., Mamaev, B. I., and Annerfeldt, M. (2013). “Suction and Pressure Side Film Cooling Influence on Vane Aero Performance in a Transonic Annular Cascade,” in Proceedings of the ASME Turbo Expo 2013: Turbine Technical Conference and Exposition. Volume 6A: Turbomachinery (San Antonio, Texas, USA: ASME). doi:10.1115/GT2013-94319
Shelton, M. L., Gregory, B. A., Lamson, S. H., Moses, H. L., Doughty, R. L., and Kiss, T. (1993). “Optimization of a Transonic Turbine Airfoil Using Artificial Intelligence, CFD and Cascade Testing,” in Proceedings of the ASME 1993 International Gas Turbine and Aeroengine Congress and Exposition. Volume 3A: General (Cincinnati, Ohio, USA: ASME). doi:10.1115/93-GT-161
Sonoda, T., Arima, T., Olhofer, M., Sendhoff, B., Kost, F., and Giess, P.-A. (2006). A Study of Advanced High-Loaded Transonic Turbine Airfoils. J. Turbomach. 128 (4), 650–657. doi:10.1115/1.2221325
Thulin, R. D., Howe, D. C., and Singer, I. D. (1982). Energy Efficient Engine High-Pressure Turbine Detailed Design Report. Cleveland OH, USA: Lewis Research Center.
Wang, Y., and Zhao, L. (2013). Investigation on the Effect of Trailing Edge Ejection on a Turbine Cascade. Appl. Math. Model. 37 (9), 6254–6265. doi:10.1016/j.apm.2013.01.023
Yang, L. (2014). Numerical Study on Flow Structure and Loss of Large Expansion Ratio Transonic Turbine. J. Propuls. Technol. 35 (5), 632–640.
Yasa, T., Paniagua, G., and Bussolin, A. (2007). Performance Analysis of a Transonic High-Pressure Turbine. Proc. Institution Mech. Eng. Part A J. Power Energy 221 (6), 769–778. doi:10.1243/09576509JPE467
Zeng, L., Chen, P., Li, X., Ren, J., and Jiang, H. (2018). Influence of Simplifications of Blade in Gas Turbine on Film Cooling Performance. Appl. Therm. Eng. 128, 877–886. doi:10.1016/j.applthermaleng.2017.09.008
Zhang, C. X.-Z., and Hassan, I. (2009). Computational Study of the Effects of Shock Waves on Film Cooling Effectiveness. J. Eng. Gas. Turbines Power. 131 (3), 031901. doi:10.1115/1.3026568
Zhao, W., Luo, W., Zhao, Q., and Xu, J. (2016). “Investigation on the Reduction of Trailing Edge Shock Losses for a Highly Loaded Transonic Turbine,” in Proceedings of the ASME Turbo Expo 2016: Turbomachinery Technical Conference and Exposition. Volume 2B: Turbomachinery (Seoul, South Korea: ASME). doi:10.1115/GT2016-56131
Zhou, Z. H., Liu, H. X., Zhou, K., and Li, C. (2020). Shock System Model of Highly Loaded Turbine Cascade[J]. J. Aerosp. Eng. 33 (1), 04019107. doi:10.1061/(asce)as.1943-5525.0001095
Nomenclature
Cax Axial chord length [mm]
h Section height [
L Blade height [
M Torque [
Greek Symbols
η Efficiency [
Abbreviations
PS Pressure-side
SS Suction side
LE Leading edge
TE Trailing edge
CFD Computational fluid dynamics
SST Shear Stress Transport model
Keywords: transonic turbine, coolant mass flow rate, coolant ejection position, trailing edge shock, aerodynamic performance
Citation: Zhang J, Zhou X, Du W and Xu S (2022) Numerical Investigation on Aerodynamic Performances of the Single-Stage Transonic Turbine With Various Coolant Ejection Positions and Coolant Mass Flow Rates. Front. Energy Res. 10:948134. doi: 10.3389/fenrg.2022.948134
Received: 19 May 2022; Accepted: 14 June 2022;
Published: 05 August 2022.
Edited by:
Xiao Liu, Harbin Engineering University, ChinaReviewed by:
Jun Li, Xi’an Jiaotong University, ChinaJingjun Zhong, Shanghai Maritime University, China
Baitao An, Institute of Engineering Thermophysics, (CAS), China
Copyright © 2022 Zhang, Zhou, Du and Xu. This is an open-access article distributed under the terms of the Creative Commons Attribution License (CC BY). The use, distribution or reproduction in other forums is permitted, provided the original author(s) and the copyright owner(s) are credited and that the original publication in this journal is cited, in accordance with accepted academic practice. No use, distribution or reproduction is permitted which does not comply with these terms.
*Correspondence: Xun Zhou, emhvdXh1bkBoaXQuZWR1LmNu