 Xu Bai
 Sujie Yang
 Ping Wei
- School of Naval Architecture and Ocean Engineering, Jiangsu University of Science and Technology, Zhenjiang, China
Icing not only affects the stability and safety of Arctic navigation ships but also damages the facilities on board and endangers the safety of personnel. The icing result on the ship’s surface is closely related to the icing process of water droplets on the surface. In the icing process of supercooled water droplets colliding with the ship surface, the impact and icing are coupled with each other. This process is extremely sensitive. The final ice type and physical parameters will change due to the external disturbance. Therefore, in order to obtain accurate ship icing results, the micro impact icing process of water droplets on the surface needs to be considered. From the microscopic point of view, using the numerical simulation method of solidification/melting model in Fluent, this article analyzes the effects of undercooling, contact angle, and droplet impact on the microscopic solidification process of supercooled droplets, and the results show that 1) droplet impact affects the droplet volume; 2) as the impact velocity increases, the freezing time decreases; 3) in the case of the same impact velocity, the freezing time and cooling time vary very closely even if the degree of undercooling and contact angle are different.
Introduction
The Arctic is rich in natural resources, and according to the assessment report issued by the U.S. Geological Survey, the untapped natural gas in the Arctic accounts for 30% of the world (Nieuwejaar et al., 2019). At the same time, the opening of the Arctic route will greatly shorten the distance between East Asia and Western Europe. Therefore, the navigation of ships in the Arctic waters is of great strategic significance. Arctic container ships, Arctic LNG transport ships, and other transport ships with the capability of Arctic navigation will face huge demand. The oil tanker “Vasily Dinkov” and cargo ships “Fraternity” and “Foresight” are already in operation in the polar regions (Li et al., 2005).
Due to the unique geographical environment of the Arctic region, shipping activities in the region are bound to be affected by the harsh environment of the Arctic region. One of the biggest challenges for Arctic transport ships is icing (Cai and Lin, 2016). When polar ships sail on the Arctic route, ice accumulation occurs due to the influence of low temperature, high humidity, and other meteorological reasons. Ice accumulation will increase the weight of the ship, change the position of the ship’s center of gravity, and affect the stability of the ship (Ma et al., 2019). Ice accumulation on deck, handrail, and the ladder can cause ground sliding and personal injury. Icing also affects the use of communication and navigation equipment on board, making ships more prone to accidents and unable to call for help in time after accidents (Dehghani-Sanij et al., 2017). Therefore, in order to ensure the safety of transport ships and personnel on board, it is necessary to conduct in-depth research on the polar ship icing phenomenon. Figure 1 shows the Polar LNG carrier, and Figure 2 shows the Polar ship superstructure covered with ice.
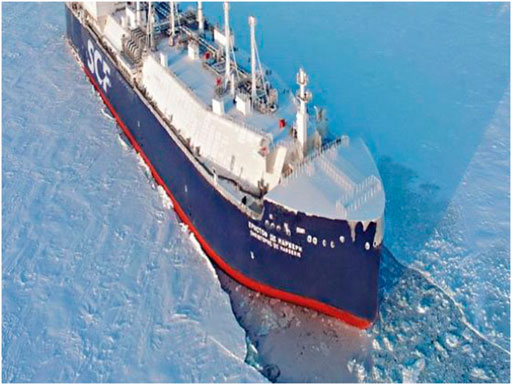
FIGURE 1. Polar LNG carrier (Barisic et al., 2017).

FIGURE 2. Superstructure icing (Mahmood and Revenga, 2006).
At present, scholars have carried out some research on the icing problem on ships. Liu and Dong (2016) proposed a prediction model and forecasting tool for ship icing based on the heat balance of the icing surface and probability theory. Kulyakhtin (2017) proposed the MARICE model, which is a mathematical model for predicting seawater splash and icing. According to the key structural components of ships and offshore platforms, Bai (Bai et al., 2021; Yang et al., 2022) gives a more accurate ice forecasting method and process based on FENSAP-ICE. However, in essence, the formation process of ice on the ship surface can be divided into several stages (Liu and Dong, 2016): the generation of droplets, the impact on the ship surface under the action of the flow field, and the solidification and accumulation of droplets on the ship surface. The existing research on ship icing prediction mainly focuses on the macro perspective, that is, the generation and distribution of droplets and the process of impacting the surface under the influence of the flow field. Usually, the droplet and flow field are calculated by relying on the existing icing data and theoretical formulas, or through the method of numerical simulation, combined with the conservation of energy and mass, to calculate ship icing in different environments. However, there are few studies on the micro icing process of subsequent droplets on the surface (Zhang et al., 2018a).
Using this method, although the ship icing data can be obtained, the icing results are not accurate. On the one hand, the existing ship icing data ara not complete and cannot represent all the environments and ship types, which makes the empirical formula of icing not accurate enough (Deshpande et al., 2021). On the other hand, it is expensive, difficult, and unrealistic to carry out the icing test of the whole ship type. If ship icing is calculated by numerical simulation, the icing models used are also different from each other, and each model has its limitations. Moreover, as the freezing process of droplets is extremely sensitive, any external disturbance will affect the final ice type and physical parameters. At the same time, the surface characteristics of materials will also affect the adhesion and freezing results of icing. The influence mechanism of these factors needs to be studied from the perspective of droplet icing on the micro layer. Therefore, in order to establish a perfect icing prediction method, it is necessary to start from the micro icing process of droplets on the surface and study the micro icing mechanism of droplets on the cold surface so as to provide a theoretical basis for icing prediction.
The freezing process of droplets on a cold surface usually begins with the impact between droplets and the surface. After water droplets impact with the surface, according to the morphological changes in water droplets, they can be divided into four types: stick, rebound, spread, and splash (Bai and Gosman, 1995). The parameters of the water droplet and surface, including impact velocity, water droplet volume, and surface characteristics, will affect the impact type (Mundo et al., 1998).
In polar ship icing, most of the icing phenomenon comes from the impact between the water droplet and the cold surface. In this process, the impact and icing are coupled. Whether icing occurs during the impact depends on the impact time and nucleation and recalescence time. During the solidification process, the temperature (Marín et al., 2014), volume (Hu et al., 2016a), and surface characteristics of the cold surface, such as roughness (Wu et al., 2005) and wettability (Ding et al., 2018), have a great impact on the solidification time of the droplets, and the effects are different in each link of solidification.
For the simulation study of water droplet solidification, due to the very short time of the recalescence stage (Jung et al., 2012), it was mainly concentrated in the freezing stage. Meng and Zhang (2020) used the crystallization dynamic method to simulate the complete solidification process of droplets containing recalescence, which provides a new method for the study of the droplet recalescence process. The simulation of the freezing stage focuses on tracking the change at the solid–liquid interface. Wang et al. (2021) simulated the solidification of water droplets by combining VOF and level-set and enthalpy-porosity methods and obtained the changes in physical parameters inside water droplets. Using these methods, Leng et al. (2016) also numerically simulated the icing of droplets in the impact process. In addition to the conventional CFD method, Bai and Yang (2021) used the phase field method to simulate the solidification of water droplets, which focused on simulating the growth process of crystal nuclei in water droplets.
In the actual sailing process of the ship, water droplets have a certain initial velocity and can collide with the hull surface. Therefore, it is necessary to study the collision freezing of supercooled water droplets. The mechanism of collision freezing of supercooled water droplets has been slowly studied in recent years. The collision freezing process of supercooled water droplets involves both phase transformation freezing and fluid collision, coupled with the thermodynamic problems caused by supercooled water, which is difficult to study. Due to the uncertainty of collision, it is usually based on an experimental study or modified by adding experimental results into a numerical simulation. When supercooled water droplets are on the collision surface, the state of the droplets after the collision should be judged first, and the shape and volume changes in the droplets before and after the collision can be determined according to the collision parameters. Hu et al. (2016b) used a high-speed camera to film the freezing phenomenon when water droplets hit the cold surface and quantitatively analyzed the influence of velocity, cold surface temperature, and thermal conductivity on the droplet impact and freezing process. Dong et al. (2018) used a 3D molecular dynamic method to simulate the freezing process of nano-scale water droplets hitting the cold wall. The results show that the heat transfer level in the droplet is related to the hydrophilicity of the contact surface. The worse the hydrophilicity, the slower is the heat transfer rate, but the internal temperature is more uniform.
The water droplets in ship icing all have a certain initial velocity, which will impact the surface. Therefore, the influence of impact should be considered in the calculation of ship icing. In this article, the impact of water droplets on the surface is introduced, and the collision is regarded as the loss of water droplet mass. The volume and contour of water droplets after the collision are recalculated and combined with the proportion of the ice phase, and the influence of the impact velocity on the freezing stage of water droplets is analyzed.
Droplet cooling characteristics
In this article, the software Ansys Fluent is used in the numerical simulation of the freezing stage of water droplet solidification, and the solidification and melting models in the software are used in the simulation. At the same time, the impact is regarded as the loss of droplet mass, and the droplet profile is calculated by using the droplet mass after the impact loss.
Solidification and melting model
In the solidification and melting model, the enthalpy-porosity method is used to solve the problem of solidification or melting at a certain temperature. By calculating the enthalpy balance of each cell in the calculation domain, the liquid fraction of the fluid is obtained: when the liquid fraction is between 0 and 1, the solid and liquid coexist in the region. When the liquid fraction is 0, the fluid is completely solidified. At this time, the porosity and velocity in the solid–liquid coexisting region are 0 (Voller and Prakash, 1987).
In the system, the total enthalpy of the material
where
where
The latent heat after solid–liquid mixing is as follows:
where
In the formula,
where
The solidification and melting model regard the phase transition zone as a porous medium, and its internal flow conforms to Darcy’s seepage law and Carman–Kozeny hypothesis. Therefore, the source term of the momentum equation of the phase transition process
where
Impact loss model
Splash is a process in which many small secondary droplets are produced after the droplets impact the surface and break up. Before calculating the droplet splash, the critical condition of the splash must be determined first. A large number of experiments show that (Yarin and Weiss, 1995) the critical condition of the splash is related to the diameter
However, the critical condition of the splash cannot be determined by one of the aforementioned dimensionless numbers. The research results show that (Cossali et al., 1997) almost all the critical values of splash
In the droplet collision, it is also necessary to determine the parameter
According to the droplet impact test data by Papadakis et al. (2004), the droplet impact loss
where
Droplet profile
Before calculating the droplet profile, several assumptions should be made:
1) When the water droplet is sessile on the cold surface, it is rotationally symmetrical, and the rotational axis is vertical;
2) The convective heat transfer between water droplets and air is negligible;
3) The volume of water droplets is not affected by evaporation or condensation.
For sessile water droplets, the base radius and droplet height can be calculated by the droplet volume and contact angle (Zhang et al., 2018b):
where
Simulation conditions
In the previous experiment, after obtaining the profile and physical parameters of water droplets after the impact, we used the aforementioned conditions to conduct the numerical simulation for the freezing stage of water droplets to obtain the evolution process at the internal solid–liquid interface and the changes in water droplet physical parameters.
Model parameter setting
Taking the Arc7 ice-breaking LNG carrier designed by COSCO as a reference (Chen, 2020), the ship adopts the winterization (–50) classification given by RS. The minimum design ambient temperature is −50°C, and the minimum internal temperature is −45°C. Therefore, in order to make the simulation results more realistic, the simulation temperature is −30°C ∼ −50°C.
The design speed of this LNG carrier is 19.5 knots, i.e., 10.03167 m/s. The research shows that when the wind speed is lower than 7.9 m/s (Magne et al., 2008), the water droplets will freeze after the impact. Therefore, the impact speeds of water droplets are 1, 3, 5, and 7 m/s.
Since this study is aimed at the superstructure of an LNG carrier, the icing mode at this location is mainly atmospheric icing. The research study shows that the droplet volume of atmospheric icing is 10–1,000
In the freezing stage, due to the limitations to the model, the profile change caused by the volume change in the process of water droplet freezing cannot be reflected. Therefore, the change in density with temperature is added to the physical parameters of the material so as to calculate the volume change in water droplets freezing in the follow-up work.
The change of density in freezing is based on the change in ice density with temperature (Speedy, 1987). In this article, the test results are fitted, and the fitting formula is applied to the setting of material properties in Fluent.
Formula 13 is the density temperature fitting formula, where
Boundary condition
The model adopted this time is shown in Figure 3. The temperature of the cold surface is set to the freezing temperature, and the temperature inside the water droplet is set to the temperature of the ice water mixture. In this article, the water droplet impact ice is simulated by FLUENT software from ANSYS because the reference is 3.5% salinity seawater, so the internal temperature of the water droplet is set to 270.85 K, according to the saltwater freezing point during the simulation. The simulation calculation is a transient calculation, the press-based solver is selected, the velocity and pressure are coupled by the SIMPLE method, the momentum and energy equations are discrete in second-order upwind format, and the time step is set to 0.1.
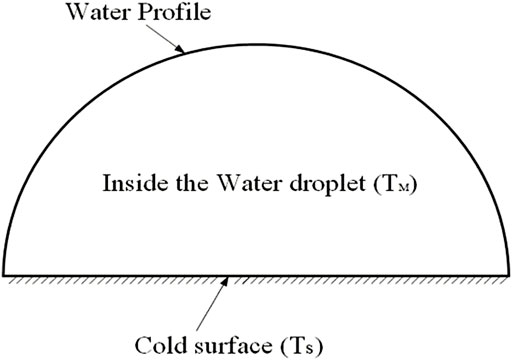
FIGURE 3. Boundaries.
Solution method
In the numerical calculation, the time step is 0.1
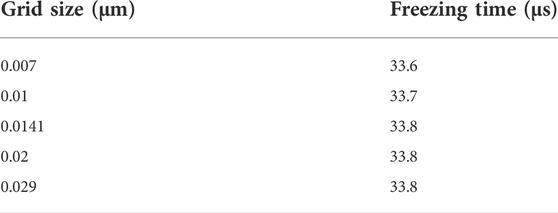
TABLE 1. Calculation time of different mesh sizes.
The mesh size is selected at 0.07μm, 0.01μm, 0.0141μm, 0.02μm and, 0.029
Analysis of impact icing simulation results
Droplet profile after the impact
Since the droplet impact is calculated as a loss in this article, the following assumptions should be made before the calculation:
1) During the impact process, the mass of droplets will not change due to evaporation or other non-impact factors;
2) the droplet will not solidify when it impacts with the cold surface;
3) the droplet remains in a sessile state again after the impact.
Through the velocity and volume of the droplet impact, the impact loss of the droplet at different velocities is calculated, and the volume after the impact loss is used to calculate the profile of the droplet after the impact.
The droplet loss at different velocities is shown in Table 2 and Figure 4. It can be seen that as the impact velocity increases, the droplet loss also increases. The increase in loss is more obvious when the velocity is low, and when the velocity increases, the magnitude of the increase in loss gradually decreases. This is because when the impact velocity increases, the loss caused by the impact will gradually increase to about 100%, but in fact, the impact will not lead to the complete loss of the mass of the droplets. Therefore, the impact loss will have a limit value, which cannot reach 100% that leads to a decrease in the increase of the impact loss after the speed increases.
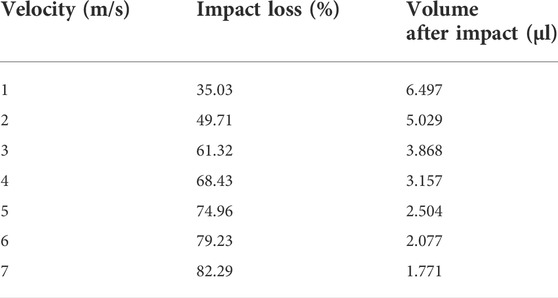
TABLE 2. Droplet impact loss and post-impact volume at different velocities.
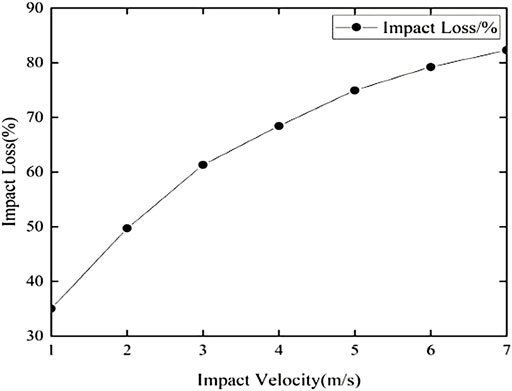
FIGURE 4. Droplet impact loss at different velocities.
Through the aforementioned calculations, the initial conditions of the freezing stage of water droplets are obtained: the physical parameters of the ice–water mixture in the water droplets and the volume and profile of the water droplets. The undercooling temperature is 30 K, and the contact angle is 90o. Under different impact velocities, the height and radius of the droplet after impact loss are calculated. The results are shown in Figure 5. It is greatly affected by the velocity, and when the velocity increases, the loss of the height and radius of the droplet caused by the increase of the velocity will decrease. It can also be seen from the profile figure that when the impact velocity is small, the change in the droplet impact caused by the velocity increase is more obvious, and when the velocity is high, the change of the profile will decrease. The shape of the droplets after impact under different degrees of supercooling is shown in Figure 6.
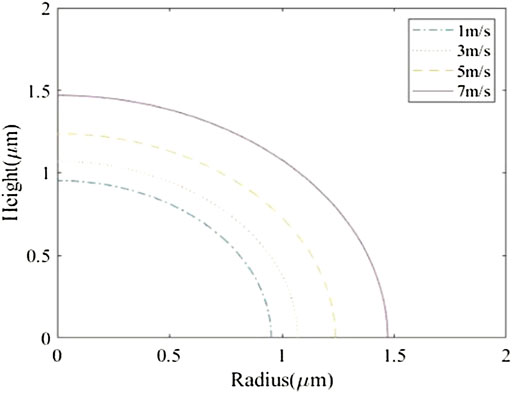
FIGURE 5. Droplet profiles at different velocities.
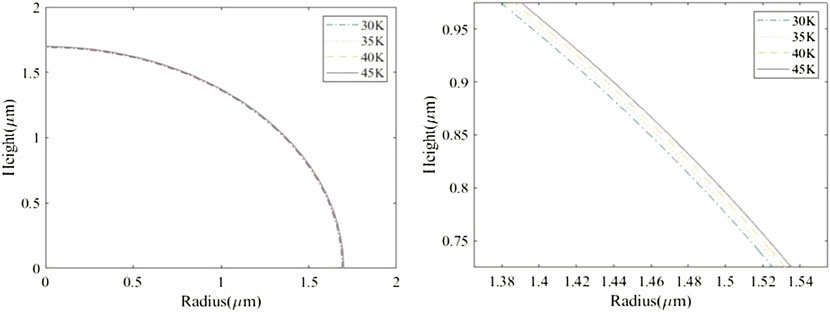
FIGURE 6. Droplet profiles after the impact at different undercooling temperatures.
Select the impact velocity of 3 m/s and the undercooling temperature of 30 K to calculate the droplet height and radius under different contact angles, as shown in Figure 7. After the droplet impacts the surface, the height and radius of the droplet under different contact angles greatly vary. This is because under different contact angles, the contact area between the droplet and the surface is different from each other. Under the same volume, the height of the droplet will change accordingly, which makes the outline of the droplet greatly different.
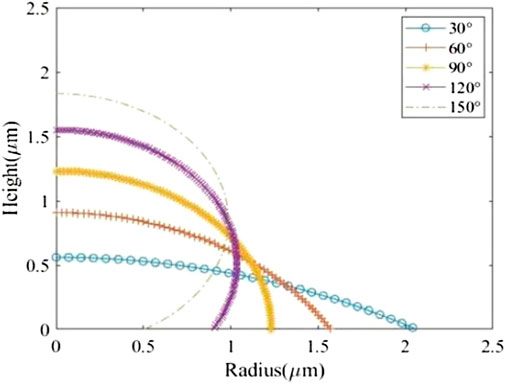
FIGURE 7. Droplet profiles after the impact at different contact angles.
Effect of the impact velocity on icing
The undercooling temperature of 30 K and the contact angle of 90° were selected to simulate the freezing stage of the droplet at the impact velocities of 1, 3, 5, and 7 m/sFigure 8 shows the duration of the freezing stage under different impact velocities. It can be seen that with the increase of impact velocity, the time required for droplet freezing gradually decreases. This is because the droplet will produce loss after hitting the surface. The greater the impact velocity, the greater is the loss mass, and the smaller is the droplet mass finally participating in the solidification. When the droplet mass decreases, the less latent heat needs to be released for droplet’s complete freezing. When the undercooling temperature and contact angle are unchanged, that is, the cold source and contact area are unchanged, less time is required for freezing.
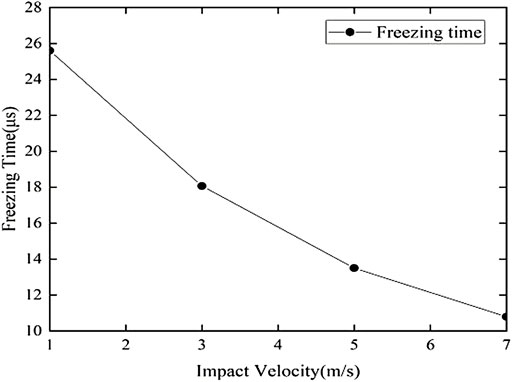
FIGURE 8. Droplet freezing time at different velocities.
Figure 9 shows the complete cooling time of different impact velocities. The greater the impact velocity, the shorter is the time required for complete cooling. This is also due to the change in the droplet volume after the impact. After increasing the impact velocity and reducing the droplet volume, the heat conditions required for complete cooling of droplets are reduced. At the same temperature of the cold surface, although there are slight differences in the contact area between droplets and the cold surface, these differences have little effect. Thus, the cooling time is reduced accordingly.
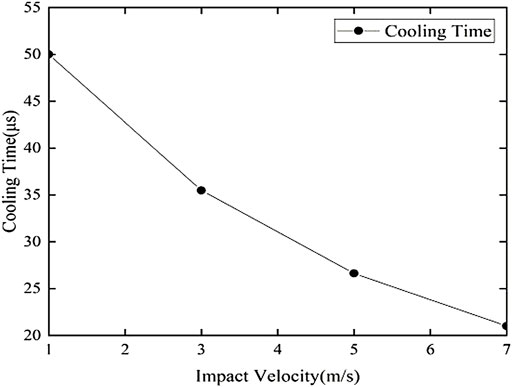
FIGURE 9. Droplet cooling time at different velocities.
Effect of undercooling on icing after the impact is considered
In order to further study the impact of droplet collision on the freezing stage of supercooled droplets, the impact velocity was introduced into the freezing stage with different undercooling temperatures. The impact velocity was set at 3 m/s, and the contact angle was 90°. The influence of the droplet impact on the freezing stage was observed under different undercooling temperatures.
Figure 10 shows the freezing time of different undercooling temperatures under the two conditions of considering the impact and not considering the impact. It can be seen that even if undercooling is different, the reduction of freezing time caused by the impact is basically the same, somewhere between 46% and 47%. This is because when the impact velocity is the same, the influence of the impact on the droplet volume is the same. Therefore, even if undercooling changes, the impact proportion caused by the impact will not be much different.
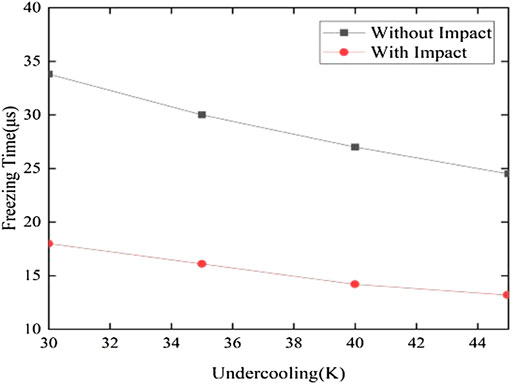
FIGURE 10. Droplet freezing time with or without impact at different undercooling temperatures.
Figure 11 shows the droplet cooling time with and without impact under different undercooling conditions. The influence of impact on droplet cooling time is basically the same as that on freezing time, but the difference in shortening time proportion between different undercooling temperatures is smaller than that between freezing time. This is because the time required for droplet cooling is longer than that for droplet freezing, which weakens the influence of the impact.
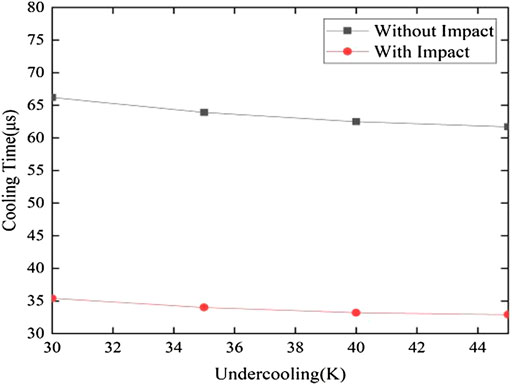
FIGURE 11. Droplet cooling time with or without impact at different undercooling temperatures.
Effect of the contact angle on icing after the impact is considered
The impact velocity is introduced into the droplet freezing stage with different contact angles. The impact velocity is set at 3 m/s, and the undercooling degree is 30 K. The influence of the impact on the freezing stage under different contact angles is observed.
Figure 12 shows the freezing time of droplets with or without the impact. When the contact angle is different, the influence of the impact is basically the same as that in different undercooling temperatures, but the influence proportion between different contact angles fluctuates greatly. The reason for this phenomenon may be that the freezing time difference between different contact angles is large. When the impact is introduced, the time difference caused by the impact is amplified so that the results are different.
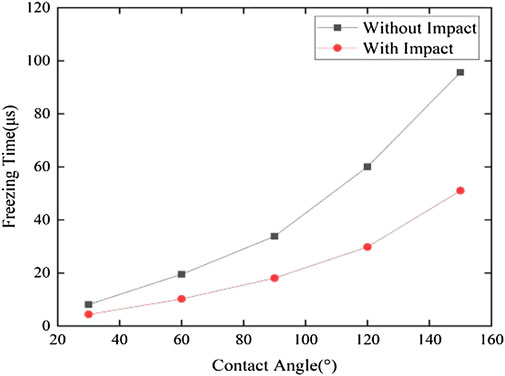
FIGURE 12. Droplet freezing time with or without impact at different contact angles.
Figure 13 shows the droplet cooling time with and without the impact at different contact angles. Compared with the cooling stage, the fluctuation of time effect caused by the impact is reduced, which is consistent with the previous calculation results of different undercooling degrees.
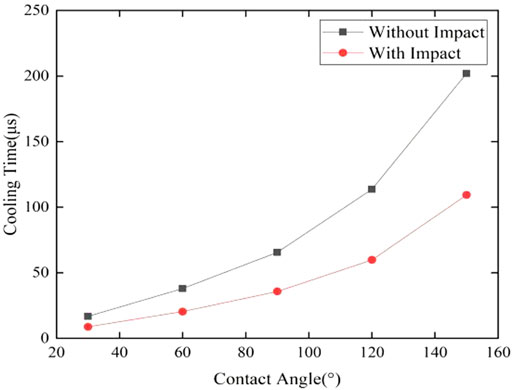
FIGURE 13. Droplet cooling time with or without impact at different contact angles.
Conclusion
For the freezing stage of droplet solidification, the influence of the droplet impact is introduced by considering the impact as the loss of the droplet mass. The height, radius, and profile of the droplet after the impact are calculated by the volume of the droplet after impact loss. Using the droplet profile after the impact, the influence of impact on the droplet freezing stage is calculated. The conclusions are as follows:
1) The droplet impact will affect the volume of droplets, and the influence proportion is related to the impact velocity. The greater the impact velocity, the greater is the influence proportion. With the increase in the impact velocity, the change range of the influence ratio will decrease.
2) When the velocity increases from 1 to 7 m/s, the freezing time decreases from 25.6μs to 10.8
3) When the impact velocity is the same, even if the undercooling and contact angle are different, the changes in freezing time and cooling time are very close. When the collision velocity is 3 m/s, 46%–47% of the freezing time and cooling time are lost.
The impact and freezing of the droplet on the structure surface are one of the key factors affecting the type of ice body. Based on the calculation of the impact of the collision of droplets’ freezing stage, because the limitation of the model as a whole cannot be collision and solidification calculation, we will use collision simulation calculation as the quality loss. This method will crash and freeze in two phases, but this method has some shortages. Water droplet collision with ice is a coupling process, and both influence each other. If the whole process is divided into two stages, the results obtained will have a certain gap with the real results. Therefore, in future research, we need to consider and develop better computational methods for coupling droplet collision with icing.
Data availability statement
The original contributions presented in the study are included in the article/supplementary material; further inquiries can be directed to the corresponding author.
Author contributions
XB: conceptualization, methodology, and funding acquistion. SY: data curation and writing—original draft. PW: supervision, software, validation, and writing—review. LZ: writing—editing.
Acknowledgments
The authors would like to thank the National Natural Science Foundation of China (No. 51879125), the Jiangsu Provincial Higher Education Natural Science Research Major Project (No. 18KJA580003), the Postgraduate Research and Practice Innovation Program of Jiangsu Province (No. SJCX21-1782), the Natural Science Foundation of Jiangsu Province (No. BK20211342 and BK 20190962), and the Jiangsu Province “Six Talents Peak” High-level Talents Support Project (No. 2018-KTHY-033) for their financial supports. The authors wish to express their gratitude to the reviewers for their useful and constructive comments.
Conflict of interest
The authors declare that the research was conducted in the absence of any commercial or financial relationships that could be construed as a potential conflict of interest.
Publisher’s note
All claims expressed in this article are solely those of the authors and do not necessarily represent those of their affiliated organizations, or those of the publisher, the editors, and the reviewers. Any product that may be evaluated in this article, or claim that may be made by its manufacturer, is not guaranteed or endorsed by the publisher.
References
Bai, C., and Gosman, A. D. (1995). Development of methodology for spray impingement simulation, 950283. Sae Transactions. doi:10.4271/950283
Bai, X., Shen, J., Xue, Y., and Shu, Y. (2021). Numerical forecasting of icing on structural components of offshore platforms in polar regions. China Ocean. Eng. 35 (4), 588–597. doi:10.1007/s13344-021-0053-9
Bai, X., and Yang, S. (2021). Simulation of undercooling influence on shape and velocity of seawater freezing process using phase field method. J. Shanghai Jiao Tong Univ. 55 (5), 513–520.
Barisic, M., Lee, B., Robenek, M., and Knappskog, H. (2017). Ice mode encounters in kara sea on-board christophe de Margerie, 124–129.
Cai, W., and Lin, J. (2016). Navigation practice and Prospect of normalized navigation in the Northeast Arctic channel. ZhongGuoShuiYun 37 (2), 21–24.
Cossali, G. E., Coghe, A., and Marengo, M. (1997). The impact of a single drop on a wetted solid surface. Exp. fluids 22 (6), 463–472. doi:10.1007/s003480050073
Dehghani-Sanij, A. R., Dehghani, S. R., Naterer, G. F., and Muzychka, Y. S. (2017). Marine icing phenomena on vessels and offshore structures: Prediction and analysis. Ocean. Eng. 143, 1–23. doi:10.1016/j.oceaneng.2017.07.049
Deshpande, S., Sterdal, A., and Sundsb, P. A. (2021). Sea spray icing: The physical process and review of prediction models and winterization techniques. J. Offshore Mech. Arct. Eng. 143 (6), 1–26. doi:10.1115/1.4050892
Ding, B., Wang, H., Zhu, X., Chen, R., and Liao, Q. (2018). How supercooled superhydrophobic surfaces affect dynamic behaviors of impacting water droplets. Int. J. Heat Mass Transf. 124, 1025–1032. doi:10.1016/j.ijheatmasstransfer.2018.03.112
Dong, Q., Hu, H., and Chen, S. (2018). Molecular dynamics simulation of water droplet icing process. Acta Phys. Sin. 67 (05), 194–199.
Honsek, R., Habashi, W. G., and Aubé, M. S. (2008). Eulerian modeling of in-flight icing due to supercooled large droplets. J. Aircr. 45 (4), 1290–1296. doi:10.2514/1.34541
Hu, H., He, Q., Yu, S., Zhang, S., and Song, D. (2016). Low temperature smooth wall surface water droplet impact icing behavior. Acta Phys. Sin. 65 (10), 196–201.
Hu, H., He, Q., Yu, S., Zhang, Z., and Song, D. (2016). Freezing behavior of droplet impacting on cold surfaces. Acta Phys. Sin. 65 (10), 196–201.
Jung, S., Tiwari, M. K., Doan, N. V., and Poulikakos, D. (2012). Mechanism of supercooled droplet freezing on surfaces. Nat. Commun. 3 (1), 615–618. doi:10.1038/ncomms1630
Kulyakhtin, A. (2017). Numerical modelling and experiments on sea spray icing. Trondheim, Norway: Norwegian University of Science and Technology. Ph.D. Thesis.
Leng, M., Chang, S., and Ding, L. (2016). Numerical simulation of droplet impinging and freezing on cold surfaces with different wettability. CIESC J. 67 (07), 2784–2792.
Li, Z., You, X., Wang, Y., and Ting, C. (2005). Economic analysis of container transportation in north East Arctic Route. J. Jimei Univ. 18 (01), 34–40.
Liu, Y., and Dong, J. (2016). Forecast methods for ship icing. Equip. Environ. Eng., 13 (3), 140–146.
Ma, K., Hu, G. Y., and Liang, S. F. (2019). Calculation of ice accretion of polar ships and its impact on parametric rolling. Chin. J. Ship Res. 14 (1), 61–65.
Magne, A., Drage, A. B., and Gard, H. C. (2008). Atmospheric icing in a coastal mountainous terrain. Measurements and numerical simulations, a case study. Cold Regions Sci. Technol. 53, 150–161. doi:10.1016/j.coldregions.2007.12.003
Mahmood, M., and Revenga, A. (2006). Design aspects of winterized and arctic LNG carriers: A classification perspective. Int. Conf. Offshore Mech. Arct. Eng. 47470, 765–772.
Makkonen, L. (1984). Atmospheric icing on sea structures. Hanover: Cold Regions Research and Engineering Lab Hanover Nh.
Marín, Á. G., Enríquez, O. R., Brunet, P., Colinet, P., and Snoeijer, J. H. (2014). Universality of tip singularity formation in freezing water drops. Phys. Rev. Lett. 113 (5), 054301–054305. doi:10.1103/physrevlett.113.054301
Meng, Z., and Zhang, P. (2020). Dynamic propagation of ice-water phase front in a supercooled water droplet. Int. J. Heat Mass Transf. 152, 119468. doi:10.1016/j.ijheatmasstransfer.2020.119468
Mundo, C., Sommerfeld, M., and Tropea, C. (1995). Droplet-wall collisions: Experimental studies of the deformation and breakup process. Int. J. Multiph. flow 21 (2), 151–173. doi:10.1016/0301-9322(94)00069-v
Mundo, C., Sommerfeld, M., and Tropea, C. (1998). On the modeling of liquid sprays impinging on surfaces. At. Spr. 8 (6), 625–652. doi:10.1615/atomizspr.v8.i6.20
Nieuwejaar, P., Mazauric, V., Betzler, C., Carapuco, M., Cattrijsse, A., Coren, F., et al. (2019). Next generation European research vessels: Current status and foreseeable evolution. Oostende: European Marine Board IVZW.
Papadakis, M., Rachman, A., Wong, S. C., Yeong, H. W., and Bidwell, C. (2004). “Water impingement experiments on a NACA 23012 airfoil with simulated glaze ice shapes,” in 42nd AIAA aerospace sciences meeting and exhibit. doi:10.2514/6.2004-565
Speedy, R. J. (1987). Thermodynamic properties of supercooled water at 1 atm. J. Phys. Chem. 91 (12), 3354–3358. doi:10.1021/j100296a049
Voller, V. R., and Prakash, C. (1987). A fixed grid numerical modelling methodology for convection-diffusion mushy region phase-change problems. Int. J. Heat Mass Transf. 30 (8), 1709–1719. doi:10.1016/0017-9310(87)90317-6
Wang, Y., Ju, L., Han, D., and Wang, Q. (2021). Numerical investigation of the impacting and freezing process of a single supercooled water droplet. Phys. Fluids 2021 (4), 042114. doi:10.1063/5.0048206
Wu, X., Xu, W., Wang, W., and Tang, L. (2005). Experimental study on super-cooled drop freezing on cold surfaces. J. Eng. Thermophys. 26 (1), 104–106.
Yang, X., Bai, X., and Cao, H. (2022). Influence analysis of rime icing on aerodynamic performance and output power of offshore floating wind turbine. Ocean. Eng. 258, 111725. doi:10.1016/j.oceaneng.2022.111725
Yarin, A. L., and Weiss, D. A. (1995). Impact of drops on solid surfaces: Self-similar capillary waves, and splashing as a new type of kinematic discontinuity. J. Fluid Mech. 283, 141–173. doi:10.1017/s0022112095002266
Zhang, M., Wang, S., and Zhao, Z. (2018). Research progress of ship icing prediction in polar waters. Ship Ocean Eng. 47 (A01), 113–120.
Keywords: ship’s icing, supercooled water droplets, freezing, impact, undercooling, contact angle
Citation: Bai X, Yang S, Wei P and Zhou L (2022) Numerical simulation of the impact and freezing stage of supercooled droplets on the ship superstructure surface in the Arctic route. Front. Energy Res. 10:950649. doi: 10.3389/fenrg.2022.950649
Received: 23 May 2022; Accepted: 29 July 2022;
Published: 30 August 2022.
Edited by:
Umberto Desideri, University of Pisa, ItalyReviewed by:
Wei Shi, Dalian University of Technology, ChinaXujian Lyu, Nanjing University of Science and Technology, China
Xiandong Ma, Lancaster University, United Kingdom
Copyright © 2022 Bai, Yang, Wei and Zhou. This is an open-access article distributed under the terms of the Creative Commons Attribution License (CC BY). The use, distribution or reproduction in other forums is permitted, provided the original author(s) and the copyright owner(s) are credited and that the original publication in this journal is cited, in accordance with accepted academic practice. No use, distribution or reproduction is permitted which does not comply with these terms.
*Correspondence: Xu Bai, YmFpeHVAanVzdC5lZHUuY24=