 Guobin Huang1
 Guoqin Zhao
- 1School of Economics and Statistics, Guangzhou University, Guangzhou, China
- 2Research Institute of Finance and Economics, Central University of Finance and Economics, Beijing, China
- 3School of International Programs, Guangdong University of Finance, Guangzhou, China
Based on the theory of “Non-Economic Promotion Championship,” this paper takes Appraisal-And-Commendation (AAC) policy of National Civilised City (NCC) program in China as the research object, and analyses the influence and mechanism of the NCC on carbon emissions from the perspective of energy demand. We find that NCC reduces carbon emissions significantly, and this reduction effect continues to expand over time. Furthermore, the NCC reduces carbon emissions through two mechanisms: First, the NCC reduces carbon emissions by slowing urbanisation. This mechanism mainly functions in big cities, megacities, and super cities, and does not function in small and medium cities. Second, the NCC reduces carbon emissions by promoting industrial restructuring from secondary industry to tertiary industry. This carbon reduction effect is a pure structural adjustment effect, regardless of any effects on technological level and productivity. Moreover, there are regional differences in the reduction of carbon emissions by NCC through industrial restructuring in two dimensions: In the first dimension, compared with the western region and the northeast region, the eastern and central regions are more able and willing to reduce carbon emissions through industrial restructuring. In the second dimension, compared with the northern region, the southern region is more likely to reduce carbon emissions through industrial restructuring.
1 Introduction
In recent years, with the increasing impacts of global heating, such as rising sea levels and increasing frequency of extreme weather, on economic and social life, emissions of greenhouse gases including carbon dioxide and methane, have received unprecedented attention. In response to the negative impact of global heating caused by excessive emissions of these gases, countries have issued emission reduction plans, in particular since the Paris Agreement. To date, more than 70 countries have set net-zero emissions targets, covering about 76% of global emissions.1 As one of the world’s largest carbon emitters, China similarly announced in 2020 the “dual carbon” goals of striving to ensure its carbon dioxide emissions peak by 2030 and to achieve carbon neutrality by 2060.
Achieving carbon emission reduction targets requires relevant policy tools. To sum up, the existing literature focuses on traditional command-and-control (CAC) policies such as air and water environmental quality standards, pollutant discharge standards, and sustainable development goals (Greenstone and Hanna, 2014; Harrison et al., 2015; Singhal, 2018; Liu et al., 2021; Yu et al., 2021), as well as price incentive (PI) policies2 such as carbon taxes, resource taxes, emission trading schemes, and marginal abatement costs (Pearce, 1991; Wang and Qi, 2016; Jia and Lin, 2020; An et al., 2021; Xian et al., 2022). However, a new type of policy tool, which is different from CAC policy and PI policy but popularly used in China, so-called “appraisal and commendation” (AAC) policy, have not yet received effective attention.
Appraisal and commendation refers to the system design of an appraisal conducted by the higher-level government of the behaviour and effectiveness of lower-level government according to certain standards (Liu, 2019). This policy adheres to the principle of voluntary participation. Local governments that do not participate will not be punished, and local governments that participate will not receive any direct economic benefits, but the winning cities can receive corresponding commendation and honour. This is the most important difference between the AAC policy and the traditional CAC and PI policies. As it is quite different from the other two traditional policies, we may wonder, can the AAC policy better reduce carbon emissions? If yes, what is the influencing mechanism of AAC policy on carbon emissions? This paper focus on the National Civilised City (NCC) program, the most typical of AAC policy in China, and tries to give theoretical answers to these questions at the city level. The reason why the NCC program was selected is that the NCC program is the most influential AAC policy in China and is regarded as the “golden signboard” of the winning cities (Liu, 2019; Lin, 2022). On the one hand, this paper can help China improve relevant policy design, achieve its “double carbon” targets as soon as possible, and make due contributions to the world’s response to global heating; on the other hand, the AAC policy such as NCC program can provide a reference for the carbon reduction policies of other countries in the world. In summary, the issues discussed in this paper are not only of theoretical importance but also of great practical significance.
Based on the theory of the “Non-Economic Promotion Championship,” this study analyses and tests the influence and mechanism of the NCC on carbon emissions from the perspective of energy demand. The analysis results indicate that:
First, the NCC can reduce carbon emissions effectively. Moreover, the reduction effect of the NCC on carbon emissions has been expanding over time, indicating that the NCC is a far-reaching policy. Once awarded, the NCC can generate a steady stream of endogenous power and reduce carbon emissions continuously.
Second, the NCC reduces carbon emissions by slowing urbanisation. Since China’s urbanisation is mainly composed of population flow from small and medium to big cities, especially super cities, the mechanism of reducing carbon emissions by slowing urbanisation mainly functions in big cities, megacities, and super cities, and not in small and medium cities.3
Third, the NCC also reduces carbon emissions by promoting industrial restructuring from secondary to tertiary industry. This reduction effect is a pure structural adjustment effect, regardless of any effects on technological level and productivity. Moreover, there are regional differences in the reduction of carbon emissions by the NCC through industrial restructuring in two dimensions: In the first dimension, compared with the western region and the northeast region of China, the eastern and central regions, with a higher level of economic development, especially the eastern region, are more capable and willing to commend this opportunity to reduce carbon emissions through industrial restructuring. In the second dimension, compared with the northern region, the southern region, which has a more market-oriented economic system, is more likely to reduce carbon emissions through industrial restructuring.
The main contributions of this paper are threefold. First, the NCC program is selected for the evaluation of the carbon emission reduction effect of AAC policy, which is a important supplement to the research on traditional CAC policy and PI policy. Second, based on the theory of the “Non-Economic Promotion Championship,” the influence of the NCC on carbon emissions is analysed and tested, in an extension of the existing NCC program evaluation literature (Lu et al., 2020; Xu, 2020; Li et al., 2021; Shen et al., 2021; Zhang et al., 2021). Finally, the influence mechanism of the NCC on carbon emissions through urbanisation and industrial restructuring is examined from the perspective of energy demand, which provides a new perspective for the evaluation of the NCC policies.
The rest of this article is arranged as follows: the second part is the literature review, the third part is theoretical analysis, the fourth part introduces the econometric model and data, the fifth part is the empirical test results, and the sixth part is the conclusions and policy recommendations.
2 Literature review
To sum up, the existing literature focuses on the policy effects of traditional CAC policies and PI policies; in contrast, new policy tools popularly used in China so-called “appraisal and commendation” (AAC) policies have not yet received effective attention. The three policy tools mentioned here are introduced below.
2.1 CAC policy and its effects
CAC policy generally refers to a policy of setting environmental goals or standards for target subjects such as enterprises, residents, and local governments, under which those who violate environmental goals or standards will be punished accordingly, in a relatively straightforward regulatory approach (Singhal, 2018). Compared with PI policy and AAC policy, CAC policy is older, traceable back to the “Alkali Works Regulation Act” introduced in 1906 by the United Kingdom, which directly limits pollutant discharge from highly polluting industries such as the heavy chemical industry (Longhurst et al., 2009). The “Clean Air Act” introduced in the United States in 1970 are a typical CAC policy, which control the emission of air pollutants and improve air quality by clarifying the responsibilities of state governments. Relevant studies have shown that the “Clean Air Act” effectively control and reduce the emission of related pollutants and greatly improve air quality (Henderson, 1996; Becker and Henderson, 2000; Chay and Greenstone, 2003; Greenstone, 2004). CAC policies implemented by developing countries such as India and China have gradually attracted the attention of scholars; these include the “Supreme Court Action Plans” and the “Mandated Catalytic Converters” in India (Greenstone and Hanna, 2014; Harrison et al., 2015), and the “Two Control Zone” (Tanaka et al., 2014; Sun et al., 2019), the “Atmosphere Ten Articles” (Li, 2021) and the “Sustainable Development Goals” (Liu et al., 2021) in China. Although PI policies are increasingly favoured by economists due to their low economic costs, governments still make extensive use of traditional CAC policy tools, which have the advantages of short policy effect cycles and clear policy goals (Singhal, 2018).
2.2 PI policy and its effects
Price incentive policy refers to the provision of economic incentives for target entities such as enterprises and residents through policy design, thereby achieving the purpose of reducing pollution emissions and improving environmental quality, which is a relatively indirect regulatory method (Singhal, 2018). From the perspective of economic theory, PI policy can not only achieve emission reduction targets at a lower economic cost but also incentivise target subjects to adopt more advanced technologies (Porter and Linde, 1995), and improve overall economic efficiency, in the so-called “double dividend” (Pearce, 1991). Overall, existing research generally indicates that PI policy tools such as carbon taxes, resource taxes, emissions trading schemes, and marginal abatement costs can effectively reduce emissions (Andersson, 2019; Lin and Jia., 2019; Dorsey-Palmateer and Niu, 2020; Liu et al., 2020; An et al., 2021; Xian et al., 2022). The focus of the debate is on which price incentive tool has the lowest cost and/or best emission reduction effect (Strand, 2013; Wang and Qi, 2016; Barragán-Beaud et al., 2018; Hu et al., 2021). Due to the vast differences in political systems, cultural systems, levels of economic development, industrial and market structures, and policy objectives among various countries, it is impossible to have a single optimal policy tool (Goulder and parry, 2008). Thus, the combined use of multiple policy tools such as the PI tool and the CAC tool will be a major direction for future policy design (Singhal, 2018).
2.3 The NCC program and its effects
Appraisal and commendation policy refers to the system design of an appraisal of the behaviour and effectiveness of lower levels of government conducted by higher-level government according to certain standards (Liu, 2019). AAC policy adheres to the principle of voluntary participation, with neither direct economic incentives nor relevant penalties; instead the winning cities can receive corresponding recognition and honour. The National Civilised City program is the most typical of AAC policy in China. Scholars have studied the environmental effects of this policy from the macro (city) and micro (enterprise) levels. At the macro (city) level, Lu et al. (2020) were the first to discover that the NCC can effectively promote technological innovation and industrial structure upgrading, thereby significantly reducing PM2.5 concentration, industrial sulphur dioxide emissions, industrial soot emissions, and industrial wastewater emissions. Xu (2020) believes that the NCC has significantly reduced industrial sewage and industrial carbon dioxide emission intensity in given cities and their neighbouring cities by increasing investment in environmental pollution control and environmental infrastructure as well as by attracting public participation, which is also found by Li et al. (2021). At the micro (enterprise) level, Zhang et al. (2021) find that the NCC promotes the environmental performance of listed companies. Shen et al. (2021) also find that the NCC has reduced the chemical oxygen demand (COD) emissions of industrial enterprises by strengthening source control, improving clean production technology, and attracting high-quality green enterprises. It can be seen that whether it is at the macro (city) or micro (enterprise) level, the NCC can effectively reduce pollution emissions and improve the ecological environment.
The existing literature focuses on traditional CAC policies such as air and water environmental quality standards and pollutant emission standards, as well as PI policies such as carbon tax, resource tax, and emissions trading. As a third type of policy tool that is different from the CAC policy and PI policy, new policy tools popularly used in China so-called AAC policy are currently receiving less attention. A small amount of literature (Lu et al., 2020; Xu, 2020; Li et al., 2021; Shen et al., 2021; Zhang et al., 2021) has studied the environmental effects of the NCC program, a typical policy of AAC policy. However, only the impacts of the NCC on air pollution and water pollution, such as PM2.5, industrial sulphur dioxide emissions, industrial soot emissions, and industrial wastewater emissions, were investigated; no literature specifically examines the carbon emission reduction effect of the NCC, especially the mechanism of its influence on carbon emissions, which leaves the decision on what role the AAC policy should play in the process of carbon emission reduction lacking a theoretical basis. This study attempts to remedy this deficiency.
3 Theoretical analysis
3.1 Background
The NCC program originated from the “Five lectures, four beauties, and three loves”4 of the 1980s (Li et al., 2021). In 2003, the Central Commission for Guiding Cultural and Ethical Progress (referred to as the “Central Civilisation Commission,”5 CCC), directly under the Central Committee of the Communist Party of China (CCCPC), issued the “Interim Measures for Appraising and Commending National Civilised Cities, Civilized Villages or Towns, and Civilized Units” officially opening this influential and comprehensive appraisal program of cities. At the first appraisal in 2005, a total of nine civilised cities and three civilised urban areas within municipalities have been selected. Since 2005, six appraisals have been held so far, to a total of 146 national civilised cities (including 25 provincial capital cities and sub-provincial cities, and 121 prefecture-level cities), 163 national civilised urban areas and counties (including 29 municipal urban areas, 134 county-level cities and counties) have been selected, with an increase in the number of commendations year over year (Figure 1).
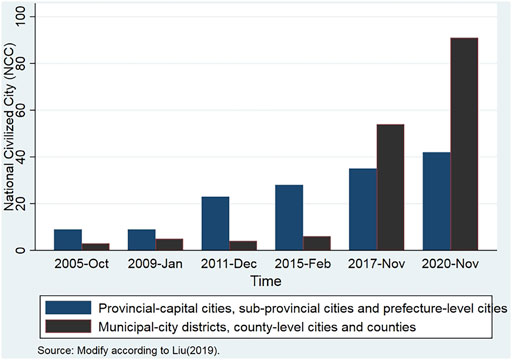
FIGURE 1. The number of national civilized cities commended over the years.
The NCC is carried out every 3 years following the procedure of “voluntary declaration, level-by-level recommendation, advance publicity, and merit-based selection.”6 The specific selection process is as follows. First, the Central Civilisation Commission assigns the quotas of national civilised cities to the provinces. Second, according to the voluntary principle, city apply to the provincial civilisation committee to become a National Civilised City. Ordinary city apply to become the Advanced Civilised City earlier on, after become the Advanced Civilised City, the Advanced Civilised City apply to become the National Civilised City. In other words, only the Advanced Civilised City is eligible to apply for National Civilised City. A “one-vote veto” mechanism is set up in this regard. If there is a serious violation of discipline or crime by the top party committee or government leaders in the 12 months before the application for the evaluation, or occurrence of major or catastrophic environmental events, eligibility to participate in the evaluation will be directly revoked. Third, the provincial civilisation committee reviews and evaluates each city according to the “National Civilised City Appraisal System” (referred to as the “Appraisal System,” AS), and selects the best cities to recommend to the Central Civilisation Commission. Finally, after confirming the list of participants, the Central Civilisation Commission commissions a professional consultancy and assigns staff of the Central Civilisation Commission to evaluate the participating cities, and selected the best ones in strict accordance with their scores. Once selected, the title of the National Civilised City would be awarded. For cities that entered the evaluation but had not been awarded the title of the National Civilised City, the title of the Advanced Civilised City will be awarded, and qualification for the next evaluation will be automatic. Cities that have been awarded the title of the National Civilised City need to be reviewed in each subsequent evaluation. If they fail to pass the re-examination, the title will be cancelled. The basic process of selection can be seen in Figure 2.
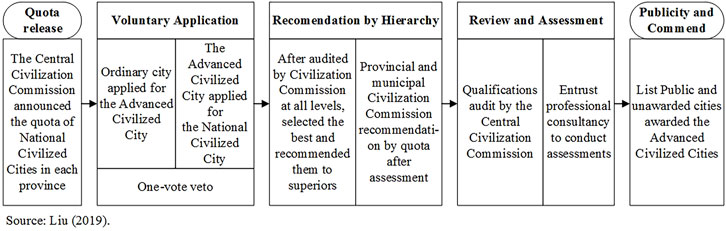
FIGURE 2. The basic process of the national civilized city selection.
As has been stated above, the key to get the title of the National Civilised City is the score in the Appraisal System, which covers economic construction, political construction, cultural construction, social construction, ecological civilisation construction, party construction, and other aspects of urban governance. However, there is not much evaluation content related to the economic field, and much of it is related to the ecological environment. Take the 2015 edition of the “National Civilised City (Above the Prefecture Level) Appraisal System” as an example: it contains 3 modules, 12 indicators, 90 subindicators, and 188 criteria. Among them, in the 9th indicators “comfortable and convenient living environment,” the subindicator of “energy consumption per unit of GDP” is set, and three criteria are set up to be “lower than the provincial (regional) annual control target,” “equal to the provincial (regional) annual control target,” and “higher than the provincial (regional) annual control target.” The greater the degree to which the energy consumption per unit of GDP is lower than the annual control target of the province (region), the higher the score, and the closer the city is to being rated a National Civilised City. The 11th indicator of the 2015 edition of the “Appraisal System” is “ecological environment for sustainable development,” which sets nine green and low-carbon subindicators such as “urban air quality,” “urban water environment quality,” and “public participation,” accounting for 10% of the 90 subindicators. In addition, the Appraisal System conducts a “one-vote veto” for the occurrence of major and extraordinary environmental events. Once major and extraordinary environmental events occurred, the city will be disqualified from participating if those events occurred within 12 months before the application for the appraisal.
3.2 Hypotheses
As an appraisal and commendation policy, the NCC has neither direct economic incentives nor corresponding punishment measures. Why then are local governments always enthusiastic about participating in the NCC, and why do they wish to mobilise all possible resources to obtain the title of “national civilised city”? Liu (2019) finds that from half to all of mayors or municipal party committee secretaries have been promoted at their next transfer to new position after receiving the title of the National Civilised City. In other words, the NCC is a “Non-Economic Promotion Championship” (Huang and Zhou, 2020). Different from the traditional “Economic Promotion Championship” (Zhou, 2007), which emphasizes the promotions based on economic performance, whoever can gain the NCC certification will have a higher probability of promotion. Empirical studies by Zhang and Wang (2020), Li et al. (2021), and Zhang et al. (2021) have confirmed this theory.
It can be seen that although there is no public incentive in the NCC program, the personal incentive for mayors and municipal party secretaries is enough to attract local governments to compete fiercely and even set off a campaign so-called “creating NCC in the whole city” (Liu, 2019).
As the ecological environment occupies the key position in the NCC program, if local governments want to win the title of NCC, they must strive to build a good ecological environment and achieve the ecological environment goals required by the Appraisal System. Existing literature has also confirmed that whether at the macro (city) level or the micro (enterprise) level, the NCC can effectively reduce pollution emissions and improve the ecological environment (Lu et al., 2020; Xu, 2020; Shen et al., 2021; Zhang et al., 2021). Whether it is the goal of “energy consumption per unit of GDP” or the other green and low-carbon goals of “urban air quality,” “urban water environment quality,” and “public participation,” they are all closely related to carbon emission reduction. To achieve the various ecological environment goals in the Appraisal System, local governments will inevitably need to directly or indirectly carry out substantial carbon emission reductions. From this, the first research hypothesis of this paper is obtained:
HYPOTHESIS 1. The NCC can induce local governments’ incentives for carbon emissions reductions, then reduce carbon emissions.If the NCC can induce local governments’ incentives for carbon emissions reductions, how can local governments achieve their carbon emission reduction goals? This paper analyses this issue from the perspective of energy demand. At present, the analysis of low-carbon transition policies such as the CAC policies and PI policies mainly focuses on supply and less on demand. The ultimate purpose of production is consumption, and the fundamental source of carbon emissions is also consumption. Therefore, changes in demand can largely determine the future carbon peak value (Lin, 2022). Electricity demand is mainly composed of residential electricity, commercial electricity, and industrial electricity. In 2019, China’s residential and commercial electricity consumption accounted for about 30% of the total, while industrial electricity consumption accounted for about 70% (Lin, 2022). Hence, the most intuitive approach for local governments is to limit demand across these sectors, in most cases with a focus on industry.In China, the main source of current demand for residential and commercial electricity is urbanisation. Due to the huge difference in lifestyles between rural and urban areas, urban residents consume much more energy and generate much more carbon emissions than rural residents. Urban lighting, heating and cooling, and large shopping malls for urban residents will generate a lot of energy consumption. In other words, urbanisation will lead to a significant increase in electricity demand and energy consumption of residents and businesses. Therefore, to limit the substantial increase in carbon emissions brought about by residential and commercial electricity demand, a feasible method for local governments is to limit the transfer of rural population to urban areas, that is, to achieve carbon emission reduction by slowing down the urbanisation of the population.Furthermore, in order to limit the carbon emissions of commercial and industrial electricity, local governments will inevitably increase the intensity of regulation, which will undoubtedly in turn increase the production cost of electricity companies, reducing their profits (Zheng and Zhang, 2016), inhibit economic growth (Huang and Zhou, 2020; Li et al., 2021), and reduce jobs. All of these will further slow urbanisation, which in turn will slow the growth of carbon emissions. Since cities and towns will lack jobs that can provide higher incomes, there will be less need for the rural population to move to cities and towns.Besides, in the process of urbanisation in China, the population mainly flows from small cities to big cities, especially super cities, for big and super cities can provide more job opportunities and higher income. Hence, if the mechanism that local governments achieve the goal of reducing carbon emissions by suppressing the urbanisation during the NCC program is true, then this reduction effect would be grater in big and super cities than in small cities. Therefore, the second research hypothesis of this paper is as follows:
HYPOTHESIS 2. The NCC promotes the reduction of carbon emissions by slowing urbanisation, furthermore, the reduction effect that the NCC upon carbon emissions would be greater in big and super cities than in small cities.The most important source of carbon emission demand is electricity consumption in secondary industry, especially in heavy chemical industries such as chemical raw material manufacturing and steel smelting. To achieve the goal of emission reduction, local governments will inevitably increase the intensity of regulation of high-carbon emission enterprises in secondary industry, such as by restricting new investment and expansion of high-carbon emission enterprises, setting carbon emission limits, etc., and at the same time increase investment in environmental pollution control and environmental infrastructure (Xu, 2020). In this way, it will push up the production costs of high-carbon-emitting enterprises, reduce the profits of these enterprises (Zheng and Zhang, 2016), and slow down the growth of secondary industry. To cope with this drag on overall economic growth, a feasible way is to vigorously develop tertiary industry, such as tourism, etc., which has relatively low carbon emissions, and to guide resources released by secondary industry to tertiary industry. Correspondingly, studies have found that the NCC has contributed to the growth of tourism (Chen and Mao, 2021). In other words, under the NCC, carbon emission reduction targets are achieved by promoting industrial restructuring from secondary to tertiary industry.However, local governments’ development goals are sometimes in conflict, such as developing the economy and protecting the environment. Theoretically, in local governance in China, the non-economic promotion race may have a higher threshold compared to the economic promotion race, and only those cities that are relatively economically developed will be more environment-oriented in carbon emission reduction.Compared with the western and north-eastern regions, cities in the eastern and central regions7 have higher levels of economic development in China. Cities in the eastern and central regions have achieved industrialisation after more than 40 years of rapid economic development since the “Reform and Opening-Up” in 1980s. In particular, the eastern region, which has entered the post-industrial era, is vigorously developing tertiary industry such as producer services. Cities in the western and northeast regions, in contrast, has a relatively low level of economic development. Their industries are dominated by primary and secondary industries, and industrialisation has not yet been completed. Most cities in the western and northern regions have a high proportion of heavy industry and energy industry such as petroleum, natural gas, and especially coal. It would be difficult for the cities in the western and northern regions to promote industrial restructuring to meet the target of carbon emissions reduction set up by the NCC. To sum up, compared with cities in the western and north-eastern regions, cities in the eastern and central regions, especially the eastern region, are more capable and willing to take the NCC program as an opportunity to reduce carbon emissions through industrial restructuring.Hence, the third research hypothesis of this paper is as follows:
HYPOTHESIS 3. The NCC promotes the reduction of carbon emissions by industrial restructuring, moreover, the reduction effect that the NCC upon carbon emissions would be greater in the cities of eastern and central regions than in the cities of western and north-eastern regions.
4 Research design
4.1 Model settings
To test the impact of the NCC on carbon emissions (Hypothesis 1), the asymptotic double-difference method, that is, time-varying difference-in-differences (DID), is used, and the following benchmark model is set for causal identification:
Here, the explanatory variable
To ensure the correctness of the model (1) settings, Beck et al. (2010) are referred to in setting the following model for the parallel trend test:
where
In order to test the influence mechanism of the NCC on carbon emissions through urbanisation and industrial restructuring respectively (Hypotheses 2 and Hypotheses 3), based on model (1) and referring to Wen et al. (2004), the following mediation effect model is set:
where
4.2 Data description
The sample used is the 19-years unbalanced panel data of 287 cities in China, from 1999 to 2017. The data indicators used for the respective variables are as follows:
4.2.1 Explained variable
The explained variable
4.2.2 Explanatory variable
The data for the explanatory variable
4.2.3 Mediating variable
Urbanisation is measured by the proportion of the non-agricultural population in the total population at the end of the year, and the industrial structure is measured by the ratio of the output value of tertiary industry to that of secondary industry.
4.2.4 Control variable
Economic development level is represented by per capita GDP, foreign direct investment is measured by the proportion of actual foreign investment in GDP (converted using exchange rates), science and technology level is represented by per capita financial expenditure in science and technology, total population is measured by the total population at the end of the year, and the per capita consumption level is the per capita retail sales of social consumer goods.
All nominal data are deflated by the provincial consumer price index (CPI) based on 1999, and the non-proportional data are in logarithmic form. Exchange rate data and provincial CPI data are from the “China Statistical Yearbook” (2000–2018), and the rest of the data are from the “China Urban Statistical Yearbook” (2000–2018). Descriptive statistics of variables are shown in Table 1.
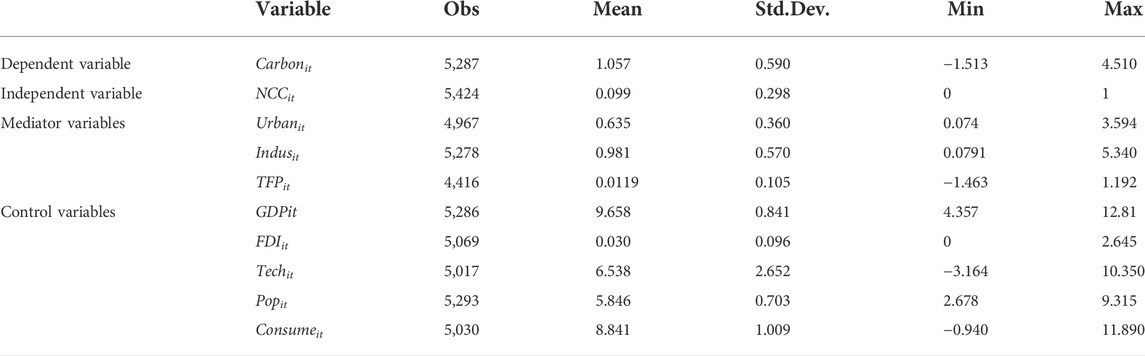
TABLE 1. Descriptive statistics of variables.
5 Empirical results
5.1 The benchmark model
To test the influence of the NCC on carbon emissions, the benchmark model (1) is estimated; the estimated results are shown in Table 2. Among them, columns (1) and (2) do not add the control variable, while columns (3) and (4) do; columns (1) and (3) are the results without clustering robust standard errors, while columns (2) and column (4) are the results further adopting clustering for the city-level robust standard errors.9 As seen in the table, no matter whether the control variable is added or not or whether the clustering robust standard error is used, the estimated coefficients of the variable NCC are highly significantly negative, indicating that the NCC can significantly reduce carbon emission intensity. Hypothesis 1 is verified.
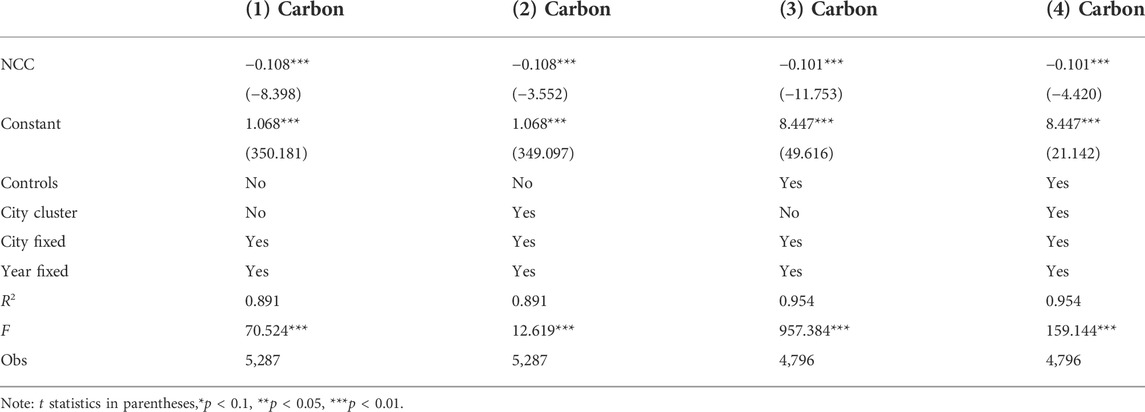
TABLE 2. The estimated results of the benchmark model.
5.2 Robustness tests
5.2.1 Parallel trend test
This article refers to Beck et al. (2010) and uses model (2) to test for parallel trends. The estimated results of model (2) are shown in Figure 3, and the confidence interval is set to 90%. Figure 3A is the estimated result without the control variable, while Figure 3B is the result with the control variable. It can be seen that no matter whether with or without the control variable, the 90% confidence interval of the estimated coefficients of the dummy variable
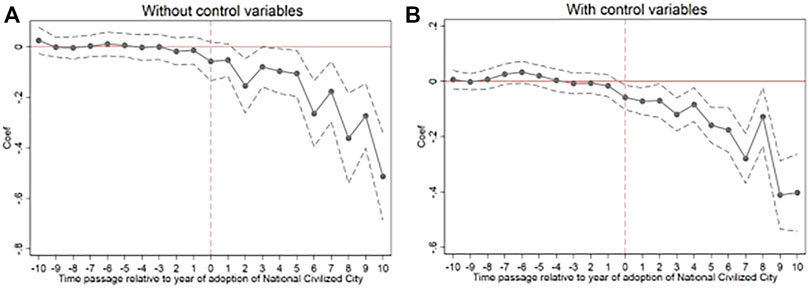
FIGURE 3. Parallel trend test. (A) Without control variables, (B) With control variables.
Figure 3 also provides the dynamic influence of the NCC on carbon emissions. In Figure 3A, the current period and the first period where the city is rated as a national civilised city do not show a significant impact on carbon emissions; the policy effect begins to appear from the second period. These show that there may be a time lag in the impact of the NCC on carbon emissions, that is, it will take some time for the implementation of the policy to achieve real results. In Figures 3A,B the influence of NCC on carbon emissions is constantly expanding, and even in the 10th year after certification as a national civilised city, the policy effect still shows no sign of weakening. This shows that the NCC is a far-reaching policy, and that once awarded, the designation can generate a steady stream of endogenous power and continuously reduce carbon emissions.
5.2.2 PSM-DID
To avoid systematic variation trend differences between the treatment group and the control group due to selection bias, and thus prevent failure to meet the parallel trend assumption, this paper further uses the PSM-DID method for robustness testing (Lu et al., 2020). Specifically, the control variable is used to represent the covariate variable, and the dummy variable
Table 3 shows the results of the balance test for the matched data in 2017. It can be seen that before matching, except for the variable of scientific and technical level (Tech), the covariates are significantly different between the treatment group and the control group. The t-statistics of all covariates after matching are not significant, that is, there is no systematically significant difference between the treatment group and the control group after matching. In the meantime, the absolute value of the standard deviation of most covariates after matching is less than 10%, indicating that the matching process is valid.
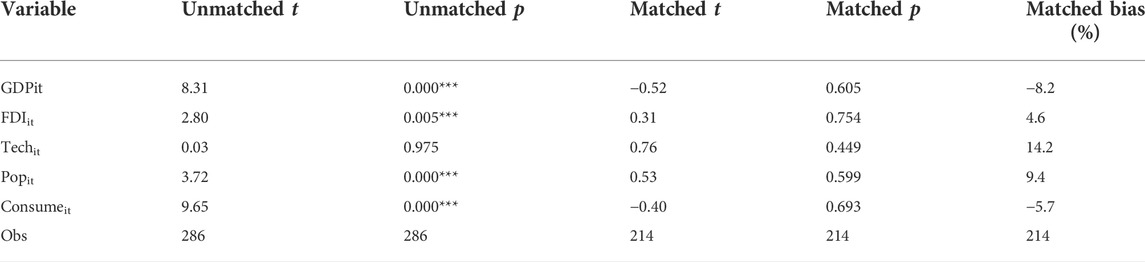
TABLE 3. The results of the PSM balance test (2017).
The above matching data exclude the systematic variation trend differences between the treatment group and the control group due to selectivity bias. In other words, these data satisfy the parallel trend assumption. Based on the above matching data, model (1) is estimated again; the estimated results are shown in Table 4. As seen, the estimated coefficients of the NCC are highly significantly negative in all results, which is consistent with the results in Table 1, although the estimated coefficients are smaller than those in Table 1. This again illustrates the robustness of the estimated results in Table 1.
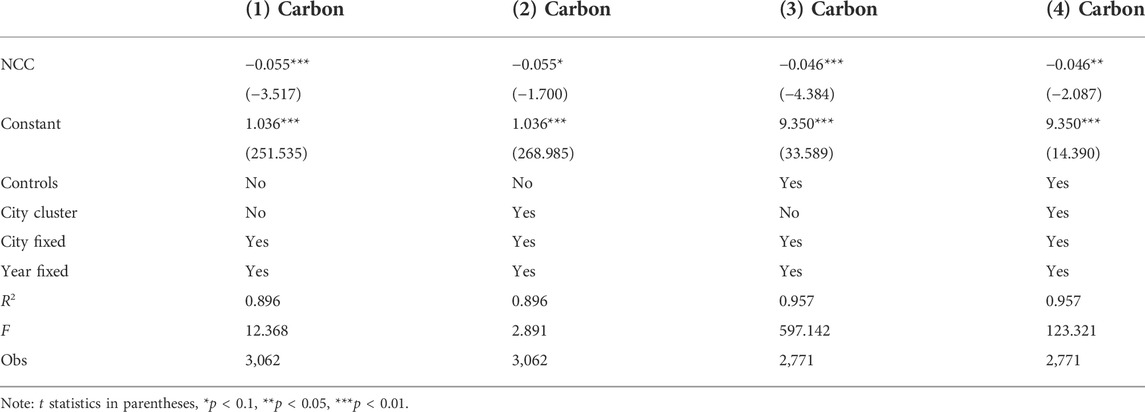
TABLE 4. The results of PSM-DID.
5.3 Mechanism analysis
The estimated results of the benchmark model in Section 5.1 and the robustness test in Section 5.2 above verify the reduction effect of the NCC on carbon emissions. Given these results, what is the mechanism behind the carbon emissions reduction? Hypothesis 2 and Hypothesis 3 in the theoretical mechanism analysis in Section 3.2 above show that in the process of the NCC program, local governments are very likely to reduce carbon emissions by inhibiting urbanisation and promoting industrial restructuring. This section will empirically test and Hypothesis 2 and Hypothesis 3 through a mediating effect model.
5.3.1 Mechanism analysis based on urbanisation
When using urbanisation as the mediating variable, the estimated results of model (3) and model (4) are shown in Table 5. As seen in columns (2) and (5), the estimated coefficients of the NCC variable are significantly negative, indicating that the NCC has indeed slowed down urbanisation. In columns (3) and (6), the estimated coefficients of urbanisation are significantly positive, indicating that urbanisation will increase carbon emissions. Meanwhile, the estimated coefficients of the NCC variable are still significantly negative, and the values are lower than those in columns (1) and (4). The above-estimated results show that urbanisation plays a partial mediating effect in the NCC’s effect on carbon emissions and that the NCC does effectively reduce carbon emissions by slowing urbanisation. Hypothesis 2 is thus partial verified.
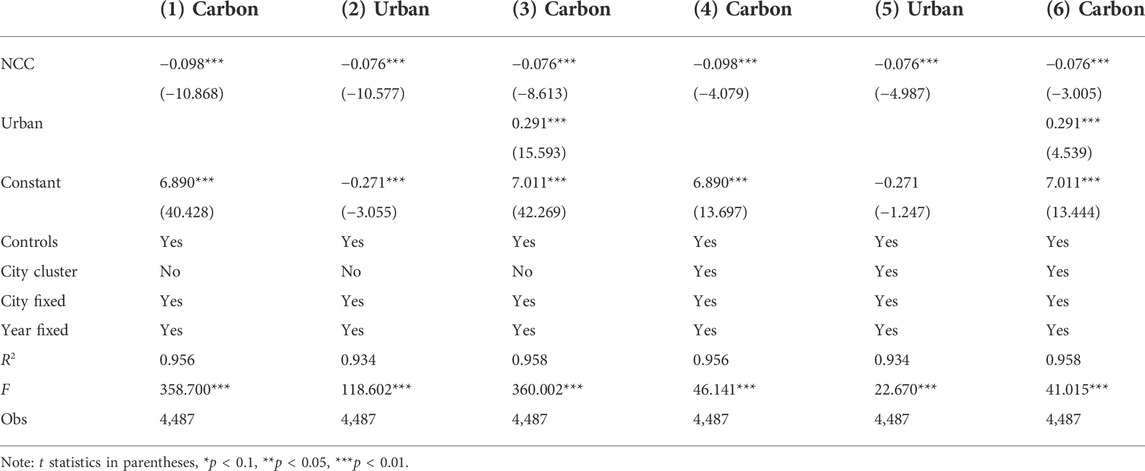
TABLE 5. Mechanism analysis based on urbanisation.
5.3.2 Mechanism analysis based on industrial restructuring
When using industrial structure as the mediating variable, the estimated results of model (3) and model (4) are shown in Table 6. As seen in columns (2) and (5), the estimated coefficients of the NCC variable are significantly positive, indicating that the NCC has indeed promoted industrial restructuring from secondary to tertiary industry. In columns (3) and (6), the estimated coefficients of industrial structure are significantly negative, suggesting that the industrial restructuring from the secondary industry to the tertiary industry can reduce carbon emissions. Meantime, the estimated coefficients of the NCC variable are still significantly negative, and their values are lower than those in columns (1) and (4). The above-estimated results thus show that the industrial restructuring plays a partial mediating effect in the NCC’s effect on carbon emissions. The NCC has indeed effectively reduced carbon emissions by promoting industrial restructuring from the secondary industry to the tertiary industry, and Hypothesis 3 is verified.
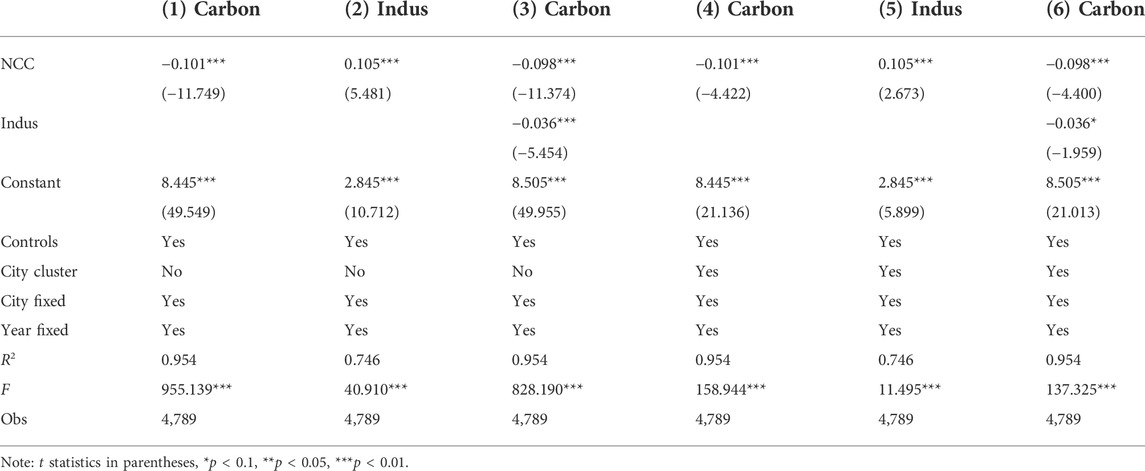
TABLE 6. Mechanism analysis based on industrial restructuring.
Liu and Liu (2021) discover that the NCC mainly promotes the upgrading of industrial structure by promoting urban technological innovation and green total factor productivity (TFP). Combined with the conclusion above that “the NCC has effectively reduced carbon emissions through industrial restructuring,” a question worthy of further exploration is: during the NCC’s reduction of carbon emissions through industrial restructuring, have the city’s technological level and productivity improved? Or is this carbon reduction effect of the NCC just a pure industrial restructuring effect, regardless of any effects on technological level and productivity? To answer these questions, models (3) and (4) are re-estimated with total factor productivity (TFP) as the mediating variable, and the estimated results are shown in Table 7.
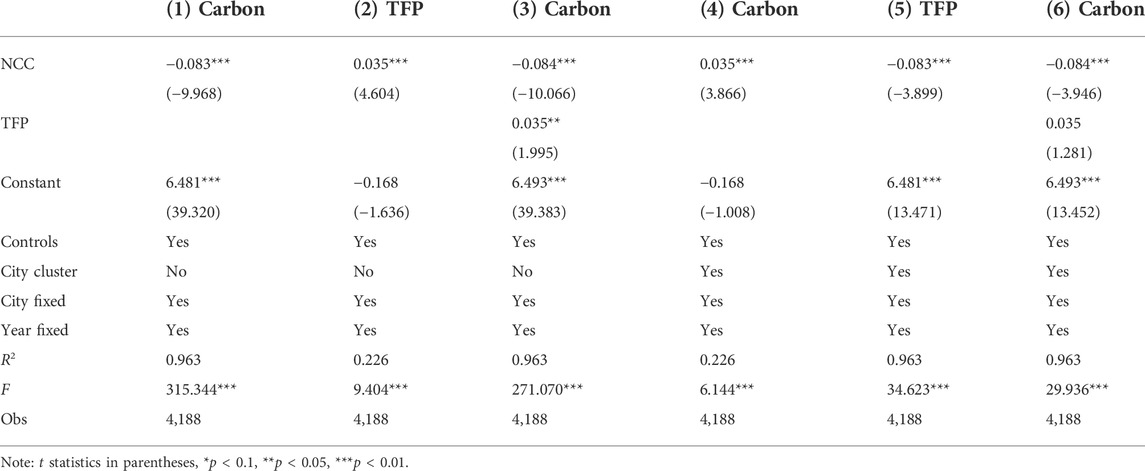
TABLE 7. Mechanism analysis based on TFP.
Clearly, in columns (2) and (5), the estimated coefficients of the NCC variable are significantly positive, indicating that the NCC does promote the productivity of urban. However, in columns (3) and (6), the estimated coefficients of the TFP variable are positive and that in column (6) is not significant, indicating that although the NCC has effectively improved urban productivity, it has not produced further carbon reduction effect. This also means that the carbon emission reduction effect of the NCC through industrial restructuring is only a pure industrial restructuring effect, regardless of any effects on technological level and productivity.
5.4 Heterogeneity analysis
The baseline model results in Section 5.1 show that, on average, the NCC can effectively curb carbon emissions. The parallel trend test in Section 5.2.1 manifests that the inhibitory effect of the NCC on carbon emissions expands over time, which suggests that there is heterogeneity in the effect of the NCC on carbon emissions in different periods. As the country with the largest population and the third-largest land area in the world, China shows enormous variation in terms of its cities’ population size and geographical location (Liu and Liu, 2021). So, does the NCC’s impact on carbon emissions also show heterogeneity with these differences across cities? In response to this question, the section combines the two influencing mechanisms of urbanisation and industrial restructuring to examine the heterogeneous impact of the NCC on carbon emissions from the perspectives of urban population size and geographical location (respectively).
5.4.1 Heterogeneity of urban population size
The “notice on adjusting the criteria for dividing urban size” issued by the State Council of the People’s Republic of China in 2014 divides cities into five categories based on the permanent population of urban areas. Cities with a permanent population of less than 500,000 in urban areas are defined small cities; cities with a permanent population of more than 500,000 but less than 1 million in urban areas are medium cities; cities with a permanent population of more than one million but less than five million in urban areas are big cities; cities with a permanent population of more than five million but less than 10 million in urban areas are megacities; cities with a permanent population of more than 10 million in urban areas are super cities. Since the sample size for small cities and medium cities is small (75 and 163, accounting for 1.4% and 3.0% respectively), they are pooled, resulting in four groups of city samples with different population sizes. The four groups of samples are estimated, and the estimated results are shown in Table 8.
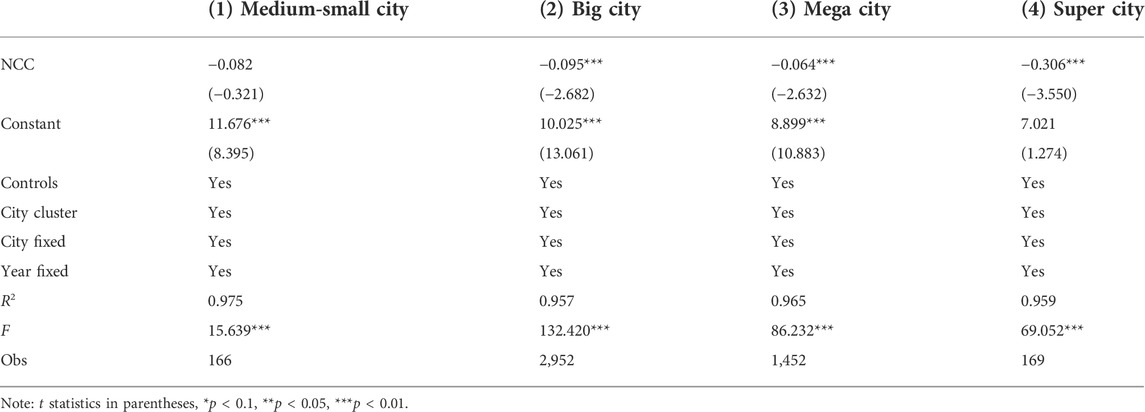
TABLE 8. Heterogeneity of urban population size.
It can be seen that in the small and medium city group in column (1), the estimated coefficient of the NCC variable is not significant, while in the large city group in column (2), the megacity group of column (3), and the super-city group of column (4), the estimated coefficients of the NCC variable are significantly negative. These results show that the inhibitory effect of the NCC on carbon emissions mainly exists in large cities, megacities, and super cities, and is faint or absent in small and medium cities.
The mechanism analysis based on urbanisation in the above Section 5.3.1 shows that local governments achieve the goal of reducing carbon emissions by suppressing the urbanisation during the NCC program. In the process of urbanisation in China, the population mainly flows from small and medium cities to big cities, megacities, and especially super cities, for big cities, megacities, and super cities can provide more job opportunities and higher income. Hence, the logic under which local governments achieve carbon emission reduction targets by inhibiting urbanisation only holds in large cities, megacities, and super cities. The estimated results in Table 8 also show that compared with columns (2) and (3), the estimated coefficient of the NCC variable in column (4) is the largest, indicating that the NCC has the greatest reduction effect on carbon emissions in the super city group.
In order to test the different reduction effects between the super cities and the other cities, we pooled the small and medium city group, the large city group and the megacity group, and conducted a SUR (Seemingly Unrelated Regression) test between the super city group and the pooled group. The result shows that the p value is 0.0057 [Chi2(1) = 7.63]. This result reject the null hypothesis that the reduction effects between the super city group and the pooled group are the same, which means the reduction effect in the super city group is greater. Thus, Hypotheses 2 is completely verified.
5.4.2 Heterogeneity of geography
In the newsletter “National Real Estate Development Investment Increased by 0.7% in January–March 2022”10 released by the National Bureau of Statistics of China on 18 April 2022, China is divided into four regions: eastern, central, western, and north-eastern.11 The eastern region includes 10 provinces (including province-level cities): the cities of Beijing, Tianjin, and Shanghai, and the provinces of Hebei, Jiangsu, Zhejiang, Fujian, Shandong, Guangdong, and Hainan; the central region includes the six provinces of Shanxi, Anhui, Jiangxi, Henan, Hubei, and Hunan; the western region includes Inner Mongolia Autonomous Region, Guangxi Zhuang Autonomous Region, the city of Chongqing, Sichuan, Guizhou, Yunnan, Tibet Autonomous Region, Shaanxi, Gansu, Qinghai, Ningxia Hui Autonomous Region, and Xinjiang Uygur Autonomous Region, a total of twelve provinces (cities and autonomous regions); the northeast region includes three provinces: Liaoning, Jilin, and Heilongjiang. Based on this division standard, the four groups of city samples in different regions are estimated, and the estimated results are shown in columns (1)–(4) in Table 9.
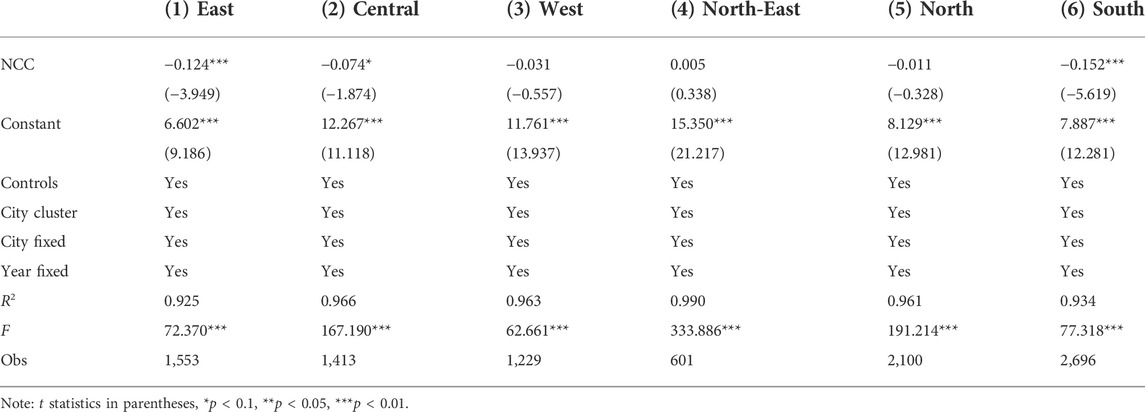
TABLE 9. Heterogeneity of city location.
The estimated coefficients of the NCC variable are significantly negative in the eastern region city group of column (1) and the central region city group of column (2); the estimated coefficients of the NCC variable are not significant in the western region city group of column (3) and the northeast region city group of column (4). These show that the reduction effect of the NCC on carbon emissions mainly exists in the eastern and central cities, and not in the western and north-eastern cities.
The mechanism analysis based on the industrial restructuring in Section 5.3.2 above shows that local governments achieve the goal of reducing carbon emissions via industrial restructuring during the NCC program. Specifically, local governments achieve the goal of reducing carbon emissions by increasing the proportion of tertiary industry, with lower carbon emission intensity, and decreasing the proportion of secondary industry, with higher carbon emission intensity. The eastern and central regions are regions with higher levels of economic development in China. After more than 40 years of rapid development under the “Reform and Opening-Up” policy, they have achieved industrialisation and are moving towards a higher stage of development. In particular, the eastern region, which has entered the post-industrial era, is vigorously developing producer services. The western region, in contrast, has a relatively low level of economic development. Its industries are dominated by primary and secondary industries, and industrialisation has not yet been completed. The northeast region is China’s traditional heavy industry base, and secondary industry accounts for an especially high proportion here. In recent years, the northeast region has faced the problems of stagnant economic growth and massive population outflow caused by the difficulty of industrial transformation and upgrading. To sum up, compared with the western and north-eastern regions, the eastern and central regions, especially the eastern region, are more capable and willing to take the NCC program as an opportunity to reduce carbon emissions through industrial restructuring. The estimated results in Table 9 also show that the estimated coefficient of the NCC variable in column (1) is the largest, indicating that the NCC has the greatest reduction effect on carbon emissions in the eastern region.
Besides, we pooled the eastern and central regions, then pooled the western and north-eastern regions. The result of SUR test shows that the p value is 0.0271 [Chi2(1) = 4.88]. This result means the reduction effect in the eastern and central regions is greater than in the western and north-eastern regions.
In addition to the traditional regional division of the eastern, central, western, and north-eastern regions, the gap between the northern and southern regions of China has increasingly become a new concern in recent years (Xu et al., 2021). On one hand, the difficult of economic transition in the northern region, insufficient innovation ability, and the obvious downward trend of human capital have led to a widening gap in the economic between the northern and the southern regions year over year. On the other hand, the wide gap between air, water, and soil quality in the northern and southern regions has led to a high disparity in the ecological environment. To address this difference, this paper further explores the heterogeneity of the northern and southern regions. According to Xu et al. (2021), the southern region includes Shanghai, Jiangsu, Zhejiang, Anhui, Fujian, Jiangxi, Hubei, Hunan, Guangdong, Guangxi, Hainan, Chongqing, Sichuan, Guizhou, Yunnan, and Tibet, while the northern region includes Beijing, Tianjin, Hebei, Shanxi, Inner Mongolia, Liaoning, Jilin, Heilongjiang, Shandong, Henan, Shaanxi, Gansu, Qinghai, Ningxia, and Xinjiang Uygur. Following this division, this paper divides all city samples into two groups, the southern and northern groups, and estimates them respectively. The estimated results are shown in columns (5) and (6) of Table 9.
The estimated coefficient of the NCC variable is significantly negative in the southern region city group in column (6), while that in the northern region city group in column (5) is not significant, which suggests that the reduction effect of the NCC on carbon emissions mainly exists in southern cities, not in northern cities.
Most cities in the northern region have a high proportion of heavy industry and energy industry such as petroleum, natural gas, and especially coal (Xu et al., 2021), resulting in relatively high carbon emissions. Therefore, it is difficult for northern cities to reduce carbon emissions through industrial restructuring. Most cities in the southern region have successfully achieved industrialisation, meaning it is less difficult to further reduce carbon emissions through industrial restructuring. In addition, compared with physical-capital-intensive secondary industry, human-capital-intensive tertiary industry is more prominent, which requires construction of a more market-oriented system. The market-oriented transformation in the southern region thus occurred earlier, and its economic system is more market-oriented, which is conducive to the development of tertiary industry. The more market-oriented system in the southern region is helpful in promoting industrial restructuring, thereby reducing carbon emissions. The result of SUR test also shows that the reduction effect in the southern region is different from that in the northern region [p = 0.0009, Chi2(1) = 11.06].
6 Conclusion
The “Appraisal-and-Commendation” policy is a new type of policy with Chinese characteristics, which is different from traditional CAC policy and PI policy. How the AAC policy affects carbon emissions is an important question to be investigated. This paper takes the National Civilised City program, a typical AAC policy, as the research object, and adopts the unbalanced panel data and asymptotic double-difference method of 287 cities in China from 1999 to 2017. Based on the theoretical basis of the “Non-Economic Promotion Championship,” the influence and mechanism of the NCC on carbon emissions are deeply analysed from the perspective of energy demand. The following conclusions are drawn:
First, the NCC can reduce carbon emissions effectively. Moreover, the reduction effect of the NCC on carbon emissions has been expanding over time, indicating that the NCC is a far-reaching policy. Once awarded, the NCC can generate a steady stream of endogenous power and reduce carbon emissions continuously.
Second, the NCC reduces carbon emissions by slowing urbanisation. Since China’s urbanisation is mainly composed of population flow from small and medium to big cities, especially super cities, the mechanism of reducing carbon emissions by slowing urbanisation mainly functions in big cities, megacities, and super cities, and not in small and medium cities.
Third, the NCC also reduces carbon emissions by promoting industrial restructuring from secondary to tertiary industry. This reduction effect is a pure structural adjustment effect, regardless of any effects on technological level and productivity. Moreover, there are regional differences in the reduction of carbon emissions by the NCC through industrial restructuring in two dimensions: In the first dimension, compared with the western region and the northeast region of China, the eastern and central regions, with a higher level of economic development, especially the eastern region, are more capable and willing to commend this opportunity to reduce carbon emissions through industrial restructuring. In the second dimension, compared with the northern region, the southern region, which has a more market-oriented economic system, is more likely to reduce carbon emissions through industrial restructuring.
Based on the above conclusions, this paper puts forward the following policy recommendations:
First, actively use AAC policies such as the NCC to help achieve the “dual carbon” goals of carbon peaking and carbon neutrality. The conclusions of this paper indicate that the NCC policy can effectively reduce carbon emissions and that this reduction effect continues to expand over time. Therefore, when achieving the “double carbon” targets of carbon peaking and carbon neutrality, countries can make full use of AAC policies such as the NCC to build the endogenous driving force for continuous carbon reduction.
Second, in designing and refining policies such as the NCC, the opportunity cost of policy effects should be considered. The conclusions of the paper show that although the NCC policy can effectively reduce carbon emissions, it will also slow down urbanisation; although the NCC can reduce carbon emissions by promoting industrial restructuring from the secondary industry to the tertiary industry, the carbon emission reduction effect is a pure structural adjustment effect, which is not related to the improvement of technological level and productivity. Therefore, in addition to paying attention to policy effects, the opportunity cost caused by policies should be minimised in the process of designing and improving policies.
Data availability statement
The original contributions presented in the study are included in the article/Supplementary Material, further inquiries can be directed to the corresponding author.
Author contributions
GH: conceptualization, methodology, formal analysis, data curation, supervision, and writing. GZ: methodology, supervision, and writing. NH: investigation, data curation, and writing.
Funding
GH gratefully acknowledges financial support from the National Social Science Foundation of China (Grant No. 16CJL010). GZ gratefully acknowledges financial support from the National Social Science Foundation of China (Grant No. 19CGL048) and the Program for Innovation Research in Central University of Finance and Economics.
Conflict of interest
The authors declare that the research was conducted in the absence of any commercial or financial relationships that could be construed as a potential conflict of interest.
Publisher’s note
All claims expressed in this article are solely those of the authors and do not necessarily represent those of their affiliated organizations, or those of the publisher, the editors and the reviewers. Any product that may be evaluated in this article, or claim that may be made by its manufacturer, is not guaranteed or endorsed by the publisher.
Footnotes
1UN Climate Action website: https://www.un.org/zh/climatechange/net-zero-coalition.
2This is also known as economic incentive policy or market-based instrument (Singhal, 2018).
3According to the definition by State Council of the People’s Republic of China in 2014, cities with a permanent population of less than 500,000 in urban areas are defined small cities; cities with a permanent population of more than 500,000 but less than one million in urban areas are medium cities; cities with a permanent population of more than one million but less than five million in urban areas are big cities; cities with a permanent population of more than five million but less than 10 million in urban areas are megacities; cities with a permanent population of more than 10 million in urban areas are super cities.
4Five emphases: “emphases on civilization, courtesy, hygiene, order, and morality;” four beauties: “spiritualbeauty, language beauty, behavior beauty, and environment beauty;” three loves: “love the motherland, lovesocialism, and love the Communist Party of China”.
5The Central Civilisation Commission is a consultative body set up by the CCCPC to guide the country’s cultural and ethical progress. The director of the CCC is usually a member of the Standing Committee of the Political Bureau of the CCCPC, which is the highest-ranking official in China.
6For the detailed selection process, see Liu (2019) and Li et al. (2021).
7See the detail division in “5.4.2 Heterogeneity of Geography”.
8Once an urban area of a municipality is rated as a civilised urban area, the municipality will be classified into the treatment group.
9The estimated results clustered to the provincial level are also consistent with the above and will not be listed due to space limitations.
10URL: http://www.stats.gov.cn/tjsj/zxfb/202204/t20220418_1829680.html.
11The analysis in this article does not cover Hong Kong, Macau, or Taiwan, and the same below.
References
Abadie, A., Drukker, D., Herr, J. L., and Imbens, G. W. (2004). Implementing matching estimators for average treatment effects in stata. Stata J. 4 (3), 290–311. doi:10.1177/1536867X0400400307
An, Y., Zhou, D., Yu, J., Shi, X., and Wang, Q. (2021). Carbon emission reduction characteristics for China's manufacturing firms: Implications for formulating carbon policies. J. Environ. Manag. 284, 112055. doi:10.1016/j.jenvman.2021.112055
Andersson, J. J. (2019). Carbon taxes and CO2 emissions: Sweden as a case study. Am. Econ. J. Econ. Policy 11 (4), 1–30. doi:10.1257/pol.20170144
Barragán-Beaud, C., Pizarro-Alonso, A., Xylia, M., Syri, S., and Silveira, S. (2018). Carbon tax or emissions trading? An analysis of economic and political feasibility of policy mechanisms for greenhouse gas emissions reduction in the Mexican power sector. Energy Policy 122, 287–299. doi:10.1016/j.enpol.2018.07.010
Beck, T., Levine, R., and Levkov, A. (2010). Big bad banks? The winners and losers from bank deregulation in the United States. J. Finance 65 (5), 1637–1667. doi:10.1111/j.1540-6261.2010.01589.x
Becker, R., and Henderson, V. (2000). Effects of air quality regulations on polluting industries. J. Political Econ. 108 (2), 379–421. doi:10.1086/262123
Chay, K., and Greenstone, M. (2003). Air quality, infant mortality, and the clean air Act of 1970. NBER Working Paper. No.10053. doi:10.3386/w10053
Chen, Q., and Mao, Y. (2021). Do city honors increase tourism economic growth? A quasi-natural experimental research study based on "civilized city" selection in China. Sustainability 13 (22), 12545. doi:10.3390/su132212545
Dorsey-Palmateer, R., and Niu, B. (2020). The effect of carbon taxation on cross-border competition and energy efficiency investments. Energy Econ. 85, 104602. doi:10.1016/j.eneco.2019.104602
Goulder, L. H., and Parry, I. W. H. (2008). Instrument choice in environmental policy. Rev. Environ. Econ. Policy 2 (2), 152–174. doi:10.1093/reep/ren005
Greenstone, M. (2004). Did the clean air Act cause the remarkable decline in sulfur dioxide concentrations? J. Environ. Econ. Manag. 47 (3), 585–611. doi:10.1016/j.jeem.2003.12.001
Greenstone, M., and Hanna, R. (2014). Environmental regulations, air and water pollution, and infant mortality in India. Am. Econ. Rev. 104 (10), 3038–3072. doi:10.1257/aer.104.10.3038
Harrison, A., Hyman, B., Martin, L., and Nataraj, S. (2015). When do firms go green?: Comparing price incentives with command and control regulations in India. Environ. Pollut. 33, 47. NBER Working Paper. No.21763. doi:10.7249/WR1133
Henderson, V. (1996). Effects of air quality regulation. Am. Econ. Rev. 86 (4), 789–813. Available at: https://www.jstor.org/stable/2118305.
Hu, H., Dong, W., and Zhou, Q. (2021). A comparative study on the environmental and economic effects of a resource tax and carbon tax in China: Analysis based on the computable general equilibrium model. Energy Policy 156, 112460. doi:10.1016/j.enpol.2021.112460
Huang, S., and Zhou, Z. (2020). Championships and economic growth in non-economic—fields based on the analysis of "five consecutive championships" of national civilized cities. Res. Financial Econ. Issues 42 (7), 3–13. (in Chinese). doi:10.19654/j.cnki.cjwtyj.2020.07.001
Jia, Z., and Lin, B. (2020). Rethinking the choice of carbon tax and carbon trading in China. Technol. Forecast. Soc. Change 159, 120187. doi:10.1016/j.techfore.2020.120187
Li, D., Xiao, H., Ding, J., and Ma, S. (2021). Impact of performance contest on local transformation and development in China: Empirical study of the National Civilized City program. Growth Change 53 (00), 559–592. doi:10.1111/grow.12598
Li, S. (2021). Corporate performance under air pollution control evidence from “Atmosphere ten articles” policy. MPRA Working Paper. No.110974, Available at: https://mpra.ub.uni-muenchen.de/110974/.
Lin, B. (2022). China’s high-quality economic growth in the process of carbon neutrality. Econ. Res. J. 57 (1), 56–71. (in Chinese) Available at: https://kns.cnki.net/kcms/detail/detail.aspx?FileName=JJYJ202201006&DbName=CJFQ2022.
Lin, B., and Jia, Z. (2019). What will China's carbon emission trading market affect with only electricity sector involvement? A cge based study. Energy Econ. 78, 301–311. doi:10.1016/j.eneco.2018.11.030
Liu, C., Ma, C., and Xie, R. (2020). Structural, innovation and efficiency effects of environmental regulation: Evidence from China's carbon emissions trading pilot. Environ. Resour. Econ. 75 (4), 741–768. doi:10.1007/s10640-020-00406-3
Liu, S. (2019). The incentive of “commendation” in policy implementation—taking the establishment of A civilized city in China as an example. Chin. Public Adm. 26 (2), 72–78. (in Chinese). doi:10.19735/j.issn.1006-0863.2019.02.10
Liu, X., Ji, Q., and Yu, J. (2021). Sustainable development goals and firm carbon emissions: Evidence from A quasi-natural experiment in China. Energy Econ. 103, 105627. doi:10.1016/j.eneco.2021.105627
Liu, Z., and Liu, C. (2021). Research on the effect of civilized city on the upgrading of industrial structure: A quasi-natural experiment from the selection of civilized city. Industrial Econ. Res. (1), 43–55+85. (in Chinese). doi:10.13269/j.cnki.ier.2021.01.004
Longhurst, J. W. S., Irwin, J. G., Chatterton, T. J., Hayes, E. T., Leksmono, N. S., and Symons, J. K. (2009). The development of effects-based air quality management regimes. Atmos. Environ. 43 (1), 64–78. doi:10.1016/j.atmosenv.2008.09.050
Lu, J., Zhao, Y., and Su, Y. (2020). Civilized city” selection and environmental pollution control:A quasi-natural experiment. J. Finance Econ. 46 (4), 109–124. (in Chinese). doi:10.16538/j.cnki.jfe.2020.04.008
Pearce, D. (1991). The role of carbon taxes in adjusting to global warming. Econ. J. 101 (407), 938–948. doi:10.2307/2233865
Porter, M. E., and Linde, C. v. d. (1995). Toward A new conception of the environment-competitiveness relationship. J. Econ. Perspect. 9 (4), 97–118. doi:10.1257/jep.9.4.97
Shen, R., Yang, J., Dai, C., and Wang, Z. (2021). The power of honor: Can the title of “national civilized city” promote enterprise emissions reduction? Industrial Econ. Res. (2), 71–84. (in Chinese). doi:10.13269/j.cnki.ier.2021.02.006
Singhal, P. (2018). Environmental regulations: Lessons from the command-and-control approach. DIW Roundup, Polit. Im. Fokus. Working Paper. No.124. available at: https://www.econstor.eu/handle/10419/182229.
Strand, J. (2013). Strategic climate policy with offsets and incomplete abatement: Carbon taxes versus cap-and-trade. J. Environ. Econ. Manag. 66 (2), 202–218. doi:10.1016/j.jeem.2013.03.002
Sun, W., Yang, Q., Ni, Q., and Kim, Y. (2019). The impact of environmental regulation on employment: An empirical study of China's two control Zone policy. Environ. Sci. Pollut. Res. 26 (26), 26472–26487. doi:10.1007/s11356-019-05840-5
Tanaka, S., Yin, W., and Jefferson, G. H. (2014). Environmental regulation and industrial performance: Evidence from China. China: Tufts University Working Paper. Available at: https://www.aeaweb.org/conference/2015/retrieve.php?pdfid=880&tk=52B6HF76.
Wang, B., and Qi, S. (2016). The effect of market-oriented and command-and-control policy tools on emissions reduction innovation—an empirical analysis based on China’s industrial patents data. China Ind. Econ. (6), 91–108. (in Chinese). doi:10.19581/j.cnki.ciejournal.2016.06.008
Wen, Z., Chang, L., Hau, K., and Liu, H. (2004). Testing and Application of the Mediating Effects. Acta Psychol. Sin. 36 (5), 614–620. (in Chinese) Available at: https://journal.psych.ac.cn/acps/EN/Y2004/V36/I05/614.
Xian, Y., Yu, D., Wang, K., Yu, J., and Huang, Z. (2022). Capturing the least costly measure of CO2 emission abatement: Evidence from the iron and steel industry in China. Energy Econ. 106, 105812. doi:10.1016/j.eneco.2022.105812
Xu, H. (2020). How dose evaluation and recognition promote pollution control? Empirical evidence from the evaluation of civilized cities. J. Public Adm. 13 (6), 151–169+213. (in Chinese) Available at: https://kns.cnki.net/kcms/detail/detail.aspx? FileName=GGXZ202006010&DbName=CJFQ2020.
Xu, X., Lei, Z., Dou, Y., and Liu, S. (2021). Research on gap of balanced development between the north and the south of China—analysis based on “China balanced development index”. China Ind. Econ. (2), 5–22. (in Chinese). doi:10.19581/j.cnki.ciejournal.2021.02.011
Yu, J., Shi, X., Guo, D., and Yang, L. (2021). Economic policy uncertainty (epu) and firm carbon emissions: Evidence using A China provincial epu index. Energy Econ. 94, 105071. doi:10.1016/j.eneco.2020.105071
Zhang, C., Liu, Q., Ge, G., Hao, Y., and Hao, H. (2021). The impact of government intervention on corporate environmental performance: Evidence from China's national civilized city award. Finance Res. Lett. 39, 101624. doi:10.1016/j.frl.2020.101624
Zhang, T., and Wang, Z. (2020). A study on the signaling mechanism of honorary titles affecting the promotion of officials: Evidence from the national civilized cities. Chin. Public Adm. (9), 121–127. (in Chinese). doi:10.19735/j.issn.1006-0863.2020.09.18
Zheng, W., and Zhang, D. (2016). National civilized city and enterprise performance: Micro evidence based on PSM-DID method. Industrial Econ. Res. (5), 37–46. (in Chinese). doi:10.13269/j.cnki.ier.2016.05.004
Zhou, L. (2007). Governing China’s local officials:an analysis of promotion tournament model. Econ. Res. J. 42 (7), 36–50. (in Chinese) Available at: https://kns.cnki.net/kcms/detail/detail.aspx?FileName=JJYJ200707006&DbName=CJFQ2007.
Keywords: national civilised city, carbon emissions, urbanisation, industrial restructuring, non-economic promotion championship
Citation: Huang G, Zhao G and Huang N (2022) Appraisal-and-commendation policy and carbon emissions: Evidence from the national civilised city program in China. Front. Energy Res. 10:955910. doi: 10.3389/fenrg.2022.955910
Received: 29 May 2022; Accepted: 27 June 2022;
Published: 18 July 2022.
Edited by:
Tsun Se Cheong, Hang Seng University of Hong Kong, Hong Kong SAR, ChinaReviewed by:
Ling Gao, Xiamen University, ChinaFang Wan, Guangdong University of Finance and Economics, China
Copyright © 2022 Huang, Zhao and Huang. This is an open-access article distributed under the terms of the Creative Commons Attribution License (CC BY). The use, distribution or reproduction in other forums is permitted, provided the original author(s) and the copyright owner(s) are credited and that the original publication in this journal is cited, in accordance with accepted academic practice. No use, distribution or reproduction is permitted which does not comply with these terms.
*Correspondence: Guoqin Zhao, Ym51emdxQDEyNi5jb20=