 Connor Duggan
 Xueqin Amy Liu
 Robert Best
- School of Electronics, Electrical Engineering and Computer Science, Queen’s University Belfast, Belfast, United Kingdom
Timely remote activation of frequency response, provided by converter-based generation, can improve the damping of very low-frequency (VLF) oscillations. The research presented is based on both power system models and actual data from phasor measurement units (PMU) on the Irish power system. The performance of active power control (APC) is investigated, and variations in wind speed, droop, time lag and resource capacity demonstrate their effectiveness at damping wide-spectrum VLF modes. PMU data that captures the activation and deactivation of APC at wind farms is presented and analyzed; it demonstrates how APC control effectively dampens VLF modes on the Irish system. These observations are supported by sensitivity analysis carried out a power system model in DIgSILENT PowerFactory. These results demonstrate the improvement in VLF mode stability that APC can provide at wind generation. It is demonstrated that minimal amounts of generation curtailment and modest droop settings are sufficient to see substantial VLF mode damping. Index Terms—Active Power Control, Oscillation damping, Very Low-Frequency Oscillations, PMU.
1 Introduction
The increasing penetration of renewables and displacement of fossil-fuel-based synchronous generation pose challenges to the security of supply, increasing the likelihood and severity of extreme power system events (National Grid, 2019). Converter Interfaced Generation (CIG) has displaced the synchronous inertia and frequency regulation historically provided by governor controlled synchronous generators (Milano et al., 2018). The reduction in inertia and frequency regulation caused by high share of CIG increases the severity of the rate of change of frequency and frequency deviation, following a generation load imbalance. If the rate of change of frequency and frequency deviation exceeds certain parameters, fines may be levied on power system operators, generators, or service providers, as they can result in catastrophic cascade tripping.
Another challenge is very low-frequency oscillations (VLFOs), first observed on isolated or low inertia power systems. On these systems, renewable generation displaces synchronous generation, reduces power system inertia, and alters inertia distribution. These oscillations were noted on smaller islanded systems, such as Ireland (Wall et al., 2020), (Wall et al., 2019), before being observed on the much larger, islanded Great Britain power system (Clark et al., 2016) and the geographically large Australian power system (AEMO, 2017). Historically VLFOs have been observed on power systems with a high concentration of hydro generation, such as Colombia (Arango and Sanchez, 2010), where VLFO arose from hydro governor parameters.
VLFO can be a background characteristic in power system frequency, causing limited damage that may be classified as wear and tear. However, in recent years on the Irish power system, VLFO has occasionally, suddenly, and unexpectedly grown to peak-to-peak magnitudes in the region of 450 mHz (Wall et al., 2020) and have persisted for minutes as shown in Figure 1. The sustained oscillations could cause increased probability of equipment failure, degraded power quality and potentially uncontrolled cascading blackout (Wall et al., 2020). These events have threatened system security and required emergency control center intervention to suppress, with associated market costs.
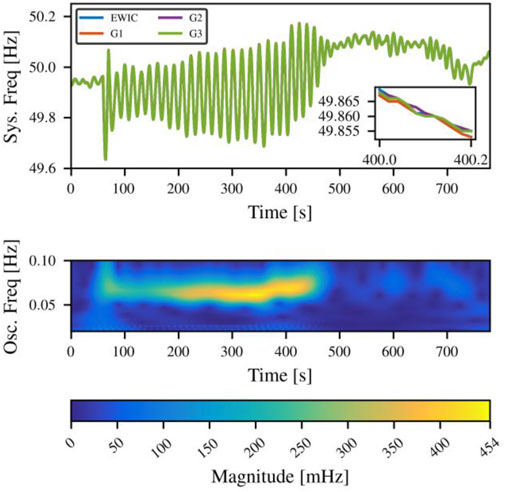
FIGURE 1. (A) 454 mHz VLFO showing system frequency measurements from four PMU locations on Ireland’s power grid (B) Continuous Wavelet Transfrom (CWT) of system frequency shown in (A).
The problem of displacement of governor control systems, coupled with a greater need for more sensitive governor control due to the integration of more stochastic generation, contributes to the increase in the severity and occurrence of VLFOS. Hence, new frequency response services, such as the dynamic frequency regulation in Great Britain (Homan and Brown, 2021), will be required to manage VLFOs. This paper demonstrates the effect of varying performance factors, such as droop, delay, and capacity, on VLFO damping.
VLFOs commonly occur between 0.01-0.1 Hz and are often related to governor frequency dynamics. VLFOs have a lower oscillation frequency when compared to ‘low frequency’ electromechanical oscillation modes, usually 0.1–2 Hz (Clark et al., 2016). VLFO, in contrast to electromechanical oscillations, are also observed to have similar magnitude and phase across large geographical areas and often entire power systems. This similar mode shape characteristic has been referred to as a coherent mode shape (Xie et al., 2018).
VLFOs are easily detected and monitored with Phasor Measurement Units (PMU) due to the very low frequency and long period; VLFOs are therefore visually evident to control centers with modern monitoring infrastructure. Although the relative changes in phase are small across a network and difficult to interpret visually, it has been demonstrated that variation in voltage phase angle between PMU monitored locations can indicate the source region (Clark et al., 2016).
2 Literature review
Previous mechanism analysis has attributed VLFOs to negatively damped governors (Chen et al., 2017), backlash (De Marco et al., 2018) and time delays (Duggan et al., 2021) within governor control systems. Several mitigation measures have been proposed to increase the damping of the VLFOs. Since governor control systems provide the most substantial interaction with the VLF mode, a method has been proposed to optimize governor parameters to increase the damping of the VLF mode in hydro governor control systems (Chen et al., 2018). In Colombia (Arango and Sanchez, 2010), the authors found that the integral component of a PI controller within a hydro based governor was the most prominent participating feature with the VLF mode. Another common approach for VLF damping is using multi-band power system stabilizers tuned with particular attention to VLF mode damping (Grondin et al., 2000). While damping a VLF mode with CIG or another technology may not remove the oscillation source, it reduces the oscillation’s severity, buys time, and potentially prevents operational parameters from being infringed or cascade tripping.
In (Xie et al., 2020) the authors proposed a wide area control strategy based on distributed CIG resources to damp VLF and electromechanical modes. (Zhu et al., 2018) analytically derives how battery energy storage systems placed at generator buses can damp a target oscillation mode of choice. (Chen et al., 2017) outlines an emergency control procedure where the governor frequency response is switched off at governors that provided a salient negative dissipating energy response, calculated through the well-known energy flow theory for oscillation location in power systems (Chen et al., 2013).
Renewable generation such as wind and solar can provide damping of VLFO if power export can be curtailed. (Wilches-Bernal et al., 2016) investigates the small-signal impact that curtailing type-3 wind turbines have on primary frequency response and VLFOs. Many authors (Singh et al., 2015; Lin Zhou et al., 2017; Saadatmand et al., 2021) have studied non-synchronous generation such as wind and solar for damping electromechanical oscillations. (Wilches-Bernal et al., 2016) provides a comprehensive survey using the Western Electricity Coordinating Councils (WECC) model for small-signal stability of electromechanical oscillations. Frequency response from wind farms was investigated in (Ruttledge and Flynn, 2012), (Mele et al., 2020), they outline frequency response on Ireland’s power system. A data-based system study using power system metric data and longitudinal power system frequency data found Active Power Control (APC) activation highly correlated with a reduced magnitude in VLFOs (Wall et al., 2020) on the Irish power system. Narrowing the deadband, as shown in Figure 2 from 200 to 15 mHz at the APC controls increases the frequency response interaction at wind farms and subsequently provides power out of phase with the measured bus frequency. APC control actively dissipates oscillation energy and reduces oscillation magnitude (Xie et al., 2020).
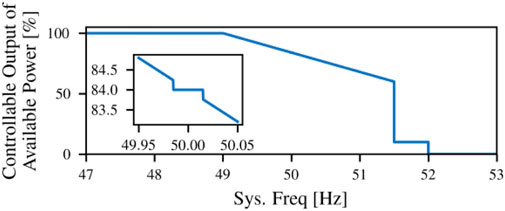
FIGURE 2. Power-Frequency response curve of APC in Ireland with 15 mHz deadband.
This paper is organized as follows: Section 3 presents background on APC control and the WECC models used for dynamic analysis. In Section 4, the performance and effectiveness of APC for damping VLFOs is presented, concerning wind speed, time-lag, droop setting, and amount of APC enabled wind. In Section 5 a case study employing PMU data from Ireland’s power system demonstrates the real impact of APC on VLFO magnitude.
The contributions of this paper are based on small-signal and time domain simulations in DIgSILENT PowerFactory, including generalized VLFO events observed in the Irish power system. The contributions of this paper include validation of 1) a comprehensive method for VLFO damping; 2) damping VLF mode amplitude during a recreated frequency oscillation; 3) damping provided by APC at wind sites and the associated reduction in VLF mode magnitude; and sensitivity analysis of APC parameters for VLFO damping.
3 Background
APC is primarily used to provide an additional fast-acting reserve for over-frequency events on Ireland’s power system. During an over frequency event, wind farms with an active APC system will ramp down their generation. Dangerous over frequency events occur in Ireland when a trip occurs on a high voltage direct current interconnection while exporting power to Great Britain.
APC can only provide a positive power response during under-frequency events if the CIG operates below its maximum potential power output, as shown in Figure 3. This is available when the system operator has curtailed generation and is an expense to the asset owner, power system operator and ultimately the consumer and the environment. It appears that curtailment is automatically implemented once APC is initiated at wind farms on the Irish power system.
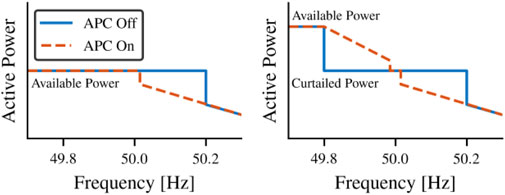
FIGURE 3. Droop curves for APC (A) first column shows uncurtailed wind (B) second column shows wind when it is curtailed.
The wind farms that can provide APC in Ireland are divided into six groups of approximately equal capacity (SEMO, 2020). Each of these groups can be turned on and off separately by the control center. Usually, three of the six APC groups are available for activation at any one point in time, spreading the potential impact of lost revenue due to curtailment. The “odd” APC groups (1,3 and 5) can be utilized on odd weeks, and groups (2, four and 6) can be utilized on even weeks. Curtailment for APC control is not constantly in operation but is implemented when the TSO deems it is necessary for system stability.
Figure 4 shows the dynamic response of the Irelands power system following the loss of 460 MW when EWIC was exporting power to Great Britain. This loss of load represented 12% of total system demand, and the high frequency event triggered the APC control at the wind farms in Figure 4B, reducing its output in response to the event.
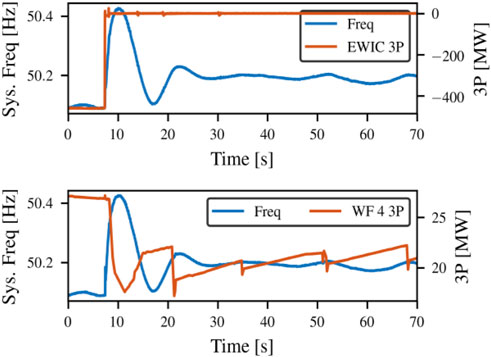
FIGURE 4. High frequency event on the Ireland’s power system following the loss -460 MW on the HVDC interconnector (A) Presents the loss of 460 MW of load and the resulting frequency deviation (B) Presents the dynamics response from a wind farm reducing its power output.
Shown in Figure 5. is the overall design of the control system for active power control for a wind farm participating in frequency response. The APC control behaves as a single unit and controls the active power production. The APC will default to wind following mode, where the objective is maximum power export, as dictated by wind speed. The control center at the TSO can send power setpoints to the wind farm, remotely reducing power output by a specified fraction below maximum power output. In the simulations in this investigation, a value of 85% of the maximum available generation was employed.
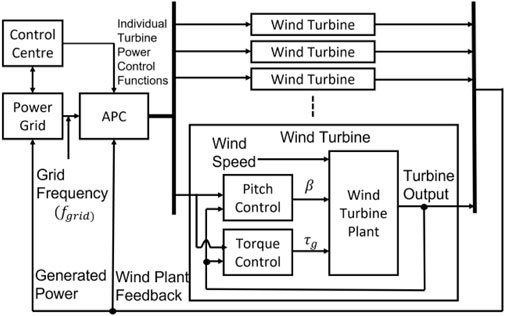
FIGURE 5. Active power control of wind power plants modelling.
3.1 Dynamic modelling
3.1.1 System Generation Generic Model representation
The lack of access to comprehensive and generic dynamic models has been a problem when studying power system dynamics and stability from the beginning of renewable power plant development.
In response to a lack of resources, the Western Electricity Coordinating Councils (WECC) developed renewable energy models based on generic models proposed by a renewable energy modelling task force. Since 2010 the WECC has developed models to investigate a wide range of control strategies for wind generation, photovoltaics, and battery energy storage systems. The result was a second-generation generic model presented in 2012 that is well suited to representing a large power park module with multiple components coordinated through the complex remote-controlled plant controller and the provision of frequency response (Ellis et al., 2012).
The modular approach of renewable energy system models, using the second generation WECC model, ensures that individual models for various components are available. They can be combined in different ways to model various renewable energy and non-traditional power sources. The modular structure is represented in Figure 7, and these models consist of three essential components.
1. Renewable Energy Plant Control (REPC)
2. Renewable Energy Eclectic Control (REEC)
3. Renewable Energy Generator/Converter (REGC)
Since this paper is based on sensitivity analysis of active power control systems, this paper will focus on variations of (REPC) components.
3.1.2 REPC_A model for power control at wind farms
The plant controller REPC_A is an essential part of active power control at wind farms as the plant controller allows frequency control functionality, as shown in Figure 6. The inputs include plant reference for active power set remotely by the TSO and Pbranch the measured power output from the wind farm. Likewise, the frequency measurement includes a frequency reference set to nominal frequency and the system frequency measured at the bus terminal of the wind farm. The outputs of this active power control path are then fed into the P control block, shown in Figure 7.
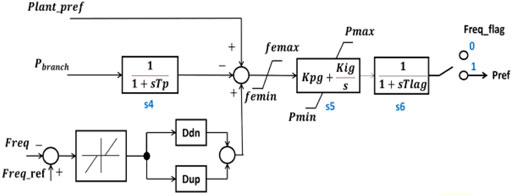
FIGURE 6. APC for plant controller configuration for REPC_A (Ellis et al., 2012)
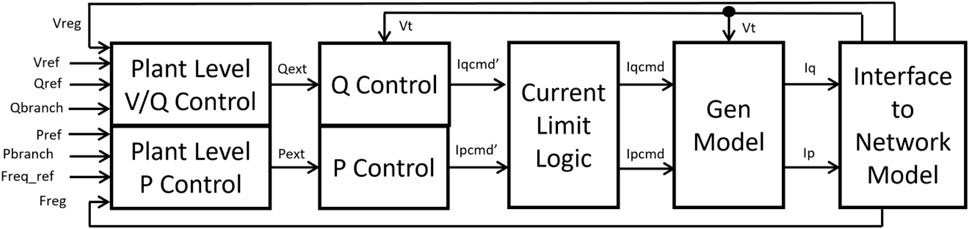
FIGURE 7. Modular representation of System Generation Generic Model.
4 Model development and simulations
The Kundur 2-area system (Kundur et al., 1994) shown in Figure 8 is used to conduct sensitivity analysis of APC at a wind farm using a dynamic simulation of VLFOs. Simulations are performed both using the time-domain and small-signal capability within DIgSILENT PowerFactory.
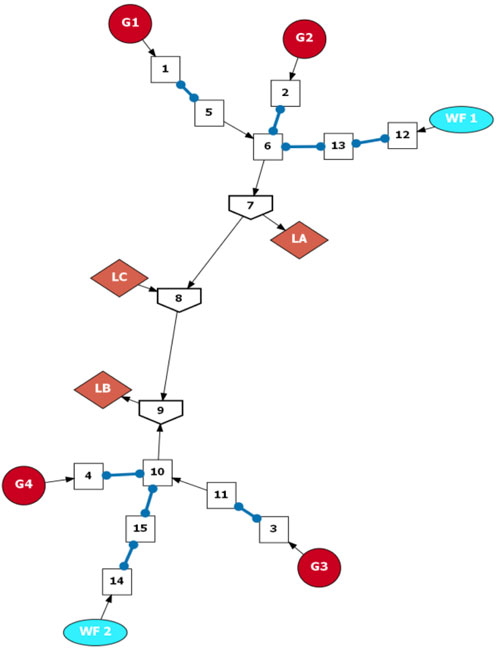
FIGURE 8. Graph Layout of Kundur two Area system. G1, G2 and WF are in area 1. G3 and G4 are in area 2. Blue dotted line signal transformer. Square boxes are transmission buses. Inverse houses are load buses.
The four synchronous generators are modelled using a detailed sub-transient model with inertia constants of 5 s. All generators are equipped with an IEESGO governor (IEEE standard turbine-governor model), SEXS (Simplified excitation system) automatic voltage regulator and PSS2A (IEEE Dual-Input Stabilizer Model) Power System Stabilizer (Kundur et al., 1994).
The wind farms are composed of type 4, 2 MW wind turbines. The wind farms are added to transmission buses 6 and 15 with APC control functionality. The presence of wind generation is offset by an increase in demand at LA and LB at busses seven and 9. These loads are adjusted to match wind generation resulting from variations in installed capacity and wind speed. When APC is active, power export from the wind farms is reduced to 85% of the available wind resource, allowing similar symmetric droop provision in this study.
A negative load is attached to Bus eight and is used to initiate a generation load imbalance in the time-domain simulations. This negative or positive load is disconnected using the out of service event in DIgSILENT, simulating a generation loss or loss of load after 10 s. This disturbance is sufficient to trigger the VLF mode that is identified in the small-signal analysis.
The simulations are used for sensitivity analysis of the following parameters.
1. Gain/droop delay time
2. Gain/droop setting
3. wind speed
4. wind farm capacity (number of turbines)
4.1 Wind generation modelling
In this paper, multiple real wind farms are simulated by aggregating them into an individual large wind farm; like the APC control groups employed on the Irish system. Figure 9, shows the power curve used for the wind farm. Three wind speeds of 7 ms-1 (9% of total installed capacity), 12 ms-1 (70%) and 16 ms-1 (100%) are used to simulate the effect different wind speeds have on damping. These speeds are chosen to reflect the damping at low and maximum wind speeds on the real power system, as faced by power system operators.
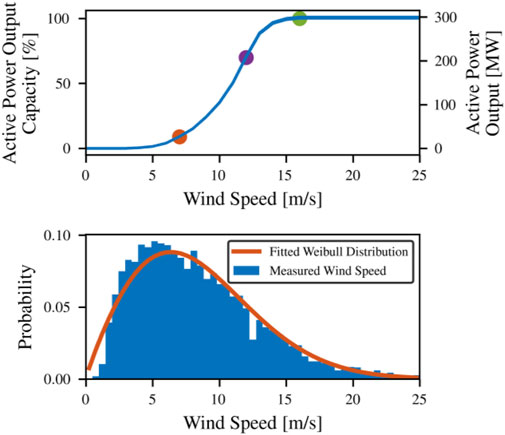
FIGURE 9. (A) Wind Power curve used in study (B) Cumulative frequency graph with the average of four wind sites recorded over the calendar year of 2015 with a fitted Weibull distribution.
The wind turbines that are added to the model have a curtailment setpoint of 85% of maximum potential wind power dispatch; therefore, each turbine will dispatch 1.7 MW at full output, reduced from 2MW, it will then provide 300 kW of under frequency response and effectively unconstrained over frequency response. As wind speed drops the under-frequency oscillation response of the turbines will drop to a minimum of 27 kW per turbine, with an output of 153 kW. This change in power response magnitude will contribute to a general improvement in oscillation damping at high wind speeds but can be overcome with increased generation capacity.
4.2 Small-signal analysis
For small-signal analysis, the deadband on the controllers that provide frequency response was set to zero. A deadband of zero accurately models VLFO damping outside the deadband, as demonstrated in Section 5 with PMU data from wind sites on the Irish power system. At present a deadband of ±15 mHz is employed on the Irish power system (also demonstrated in Section 5), which is sufficiently small to be relatively well approximated by a deadband of zero, especially when dealing with high amplitude VLFO. It is argued that operators should minimize deadbands for VLFO damping based on the simulation work in this section and the PMU data.
Three different scenarios are examined to determine the effect of parameters within the APC model on VLF mode damping.
4.3 Base case
This base case is used as a benchmark for changes in damping resulting from APC at the wind sites.
No wind generation is added for the base case, and the standard load profile is employed. Table 1 shows the damping of the critical modes. The damping ratio describes how oscillations in a system decay after a disturbance. A negative damping ratio means it is not damping but driving oscillations. The VLF mode has negative damping of -6.70%, meaning the system is sensitized to an oscillation of 0.0729 Hz or an oscillation with a period of 13.7 s. In the time domain simulations this VLF mode is triggered with a generation/load imbalance, after which it is self-sustaining.
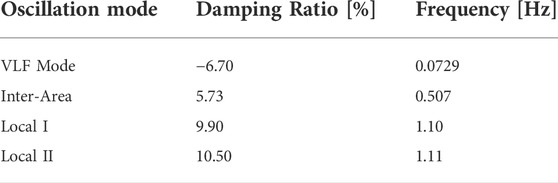
TABLE 1. Base case.
The electromechanical modes, such as the inter-area and local mode, show relatively good damping of 5.13, 9.90 and 10.50%, respectively. Although these modes are not investigated further, it was noted that APC consistently increased the damping of these modes.
4.4 Scenario 1—Time lag
The
It can be inferred from Table 2 that VLF mode damping is not sensitive to changes within the time lag (sTlag) parameter in the control system. There is a small improvement in damping as the time lag increases, but the improvement is minor and counter-intuitive.
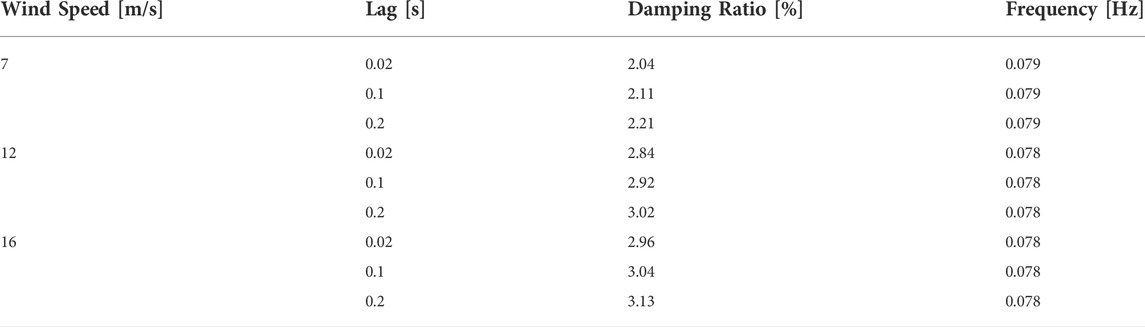
TABLE 2. Variation in delay time.
The damping times considered, 20–200 m s, covers the spectrum of possible real-world delay times in APC systems. However, these times are small compared to the period of the specific VLFO (0.078 Hz or 12.8 s) or general VLFO that may have a period in the region of 5–40 s. Consequently, the effect of delay time is minor and has only been included in the analysis to demonstrate that it is not a significant factor for the oscillations under investigation. Moving forward a time delay of 0.1s is employed for the forthcoming scenarios.
4.5 Scenario 2—Droop setting sensitivities
Table 3 summarizes the results for droop settings of 10–50 (equivalent to a 10–2% droop). The time lag was set at 0.1s with 50 wind turbines in total placed at WF1 and WF2, wind speeds of 7, 12 and 16 m/s are investigated, with curtailment of 15% for APC. Substantial improvements in VLFO damping are observed for increased gain; however, even a weak frequency response gain of 10 (10% droop) still improves the damping ratio from -6.7% to between -3.7% and -3.0%. A gain of 20 (5% droop) was sufficient to achieve positive damping of the VLFO for all the wind speeds considered. At a gain of 50 (2% droop), the VLF mode was no longer apparent in the small-signal studies as it was so well damped.
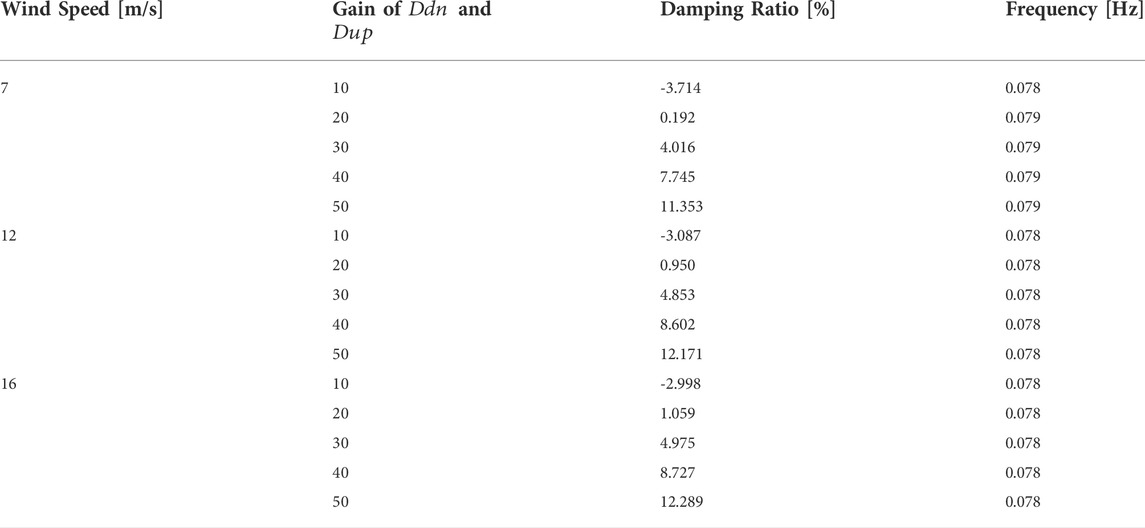
TABLE 3. Variation in grain/droop, delay time of 100 m s.
Increases in wind speed, resulting in increased wind generation and therefore available power response, provides a small improvement in damping. Damping VLFOs does not require substantial amounts of power; consequently, even at a low wind speed of 7 ms-1 (9% of capacity), sufficient droop response is available. In this circumstance, only ±1.35 MW of symmetric APC control was available. Judging from the relative sensitivity to gain and insensitivity to wind speed, much less than ±1.35 MW was required to achieve substantial damping of the VLF modes.
It is noteworthy that improvements in damping observed in Table 3 were also observed in all electromechanical modes; this is consistent with previous studies on the frequency response provided by wind generation.
4.6 Scenario 3—Number of turbines
The dampening power from the wind farms increases linearly with the number of wind turbines with active APC; therefore, a significant increase in dampening ratio is observed as the number of turbines increases, as shown in Table 4. The incremental increase in damping is not quite linear as the active wind turbines reduce the VLF mode when positive damping in excess of 10% is achieved.
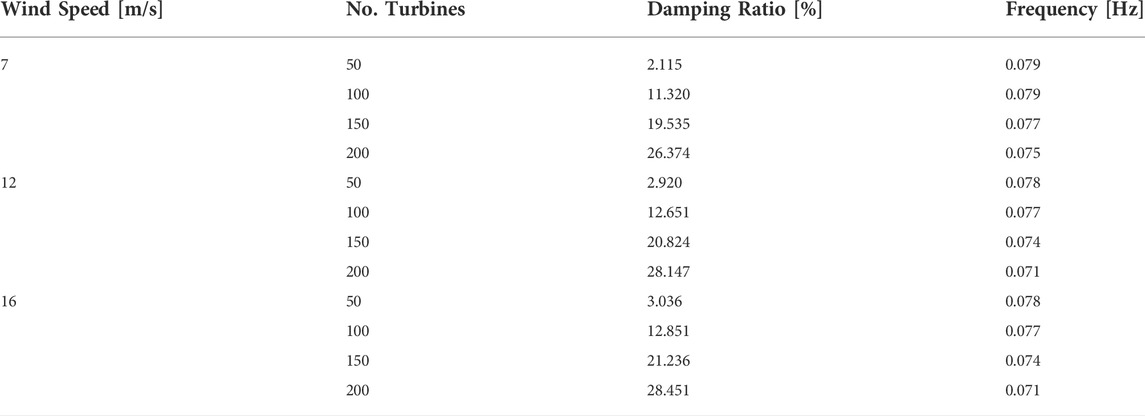
TABLE 4. Variation in number of turbines, delay time of 100 m s, gain of 25.
These results are similar to observations from sensitivity analysis for gain, whereby wind speed was not a significant factor in mode dampening. A similar interpretation is made, that even at low wind speeds sufficient power is available to achieve substantial dampening. The damping improvement from more wind turbines is evident; therefore, reductions in gain can easily be offset by increases in the number of turbines participating in APC. This type of operation may be more acceptable to asset owners and system operators while achieving the same VLF mode dampening.
4.7 Time domain analysis
Figure 10. shows time-domain simulations for a generation load imbalance at load LC. A positive and negative 40 MW load is disconnected at t = 10s, initiating the VLFO that the system is sensitive to (Table 1, 0.0729 Hz, 13.7 s). As the load is positively damped, it will grow if not sufficiently damped by the APC. A total of 100 wind turbines were deployed at WF1 and WF2, the time lag (sTlag) is set to 0.1s, and the gain is varied between 10 (10% droop) and 50 (2%). The results in this section can be compared to the damping coefficients in Table 3 for a wind speed of 16 ms-1.
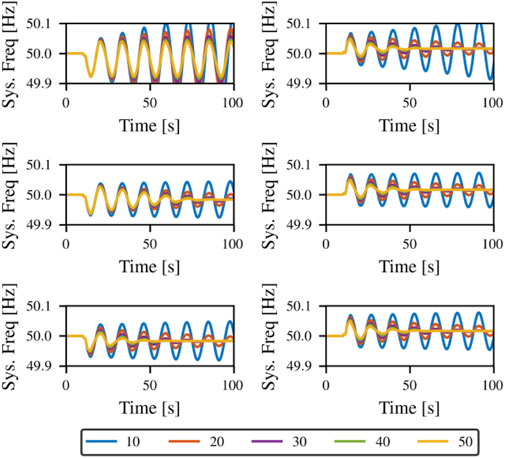
FIGURE 10. (A) Curtailment is 0% and loss of generation (B) Curtailment is 0% and loss of load (C) Curtailment is 1.5% and loss of generation (D) Curtailment is 1.5% and loss of load (E) Curtailment is 15% and loss of generation (F) Curtailment is 15% and loss of load.
The disconnection of negative load results in a VLFO below nominal frequency (plots on the left, Figures 10A, C, E while the disconnection of positive load results in a VLFO above nominal frequency (plots on the right, Figures 9D, F. Curtailment is required to provide under frequency response and dampen oscillations below nominal frequency. Three curtailment settings are investigated, no curtailment (Figures 10A, B), 1.5% curtailment (Figures 10B, C) and 15% curtailment (Figures 10D, E). A curtailment of 15%, or 85% of potential generation, is standard on the Irish system when APC is active, in this scenario, 60 MW are provisioned for droop response. A curtailment of 1.5% provisions 6 MW of power for damping, as such a power response from such a large resource (200 MW) can hardly be considered a droop response.
Figures 10A, B demonstrate that zero curtailments seriously reduces damping potential, particularly in VLFO below nominal frequency. In Figure 10A, APC cannot remove the VLFO as a substantial proportion of the oscillation occurs below the nominal frequency. Therefore APC can only reduce the VLFO damping ratio to zero in this generation scenario, a frequency response gain of greater than 30 (3.33% droop) is required. Although APC does not eliminate the VLFO, the APC response would still provide an incredibly valuable service to system operators, preventing the onset of a catastrophic VLFO or buying time for remedial action. Figure 10B demonstrates that the same control strategy will move the system into positive damping with a frequency response gain between 10 and 20 (10 and 5% droop).
Curtailment of power at renewable sites is undesirable as it represents wasted energy, therefore a minimal curtailment of 1.5% was investigated. It can be noted from Figures 10A, D that the VLFO is moved out of negative damping, even with the lowest frequency gain investigated. Low gain settings of 10 and 20 appear to perform similarly in under and over frequency VLFO scenarios. VLFO damping is more effective at higher gains in over frequency conditions; this is because, under frequency conditions, the power response is clipped as the availability from curtailed power is used up. When APC is activated on the Irish power system, a curtailment of 15% is initiated. Figures 10D, F demonstrate little to no difference between APC performance above or below the nominal frequency when damping VLFO. It can be noted that even at a low gain setting of 10, the system is moved from negative to positive dampening. The results in this section demonstrate that a small provision of curtailed power is sufficient to damp VLFO above and below nominal frequency actively. It is also demonstrated that relatively modest frequency response gains (>20 or >5%) are sufficient to achieve appreciable VLFO damping. It is argued that curtailment for an under-frequency APC droop response and curtailment for an APC VLFO service could be separated. It would be anticipated that the VLFO damping service could be in continual operation and droop response enabled when necessary. This problem could be overcome through centralized or local adjustment of frequency setpoint, whereby the minimum frequency recorded over a period of perhaps 100 s was targeted. This would provide a full VLFO response, regardless of curtailment or ambient frequency conditions.
5 Very low-frequency oscillations and active power control on Ireland's power system
Wind farm APC is used on Ireland’s power system for frequency regulation. The details of when APC is enabled are not public and seem to be decided in the control room, however some tendencies can be inferred. As a general guide, APC is on when Ireland is exporting more than 300 MW to Great Britain, and this provides additional security in the event of an over frequency transient. Currently, there is no automated system in place, and APC is turned on manually from the control center.
Three oscillatory events are presented in this section. Measurements are from PMU data, this data is used to qualitatively assess the damping effect of wind farms with active APC. Damping is provided when the MW output of a wind farm is in anti-phase to the system frequency. PMU data is available from five wind farms with APC, data from two wind farms are presented. APC response is remarkably consistent between sites, and general performance can be inferred from specific sites.
5.1 Variability of wind generation possibly exciting VLFOs
In our research, CIG infrastructure has not been implicated as a source for VLFO; however it can strongly influence system parameters that appear to sensitize the power systems to VLF modes, these parameters include generator dispatch, active governor control systems, system configuration and line flows. The purpose of installing renewable generation is to displace conventional generators, which reduces synchronous inertia on a power system, changing VLF modes and making the system more sensitive to perturbations such as transient generation/load imbalances and short circuits. Stochastic generation can also be a trigger that exposes sensitized oscillatory modes (Adeen and Milano, 2021).
Displayed in Figure 11 is a fluctuation that moved the system frequency. While the observed 7.5 MW power perturbation was small, a similar fluctuation at wind farms within the region could have contributed to the deflection of system frequency. The exact cause of the variation is unknown and may arise from wind gusts or the control room releasing curtailments before turning them back on. Similar frequency deviations in the following analysis are observed due to curtailment being added or released as APC is switched into and out of service.
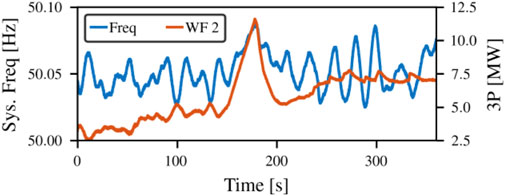
FIGURE 11. VLF Oscillation corresponding to 7.5 MW perturbation at a wind farm on Ireland’s power system.
Due to the lack of PMU measurements, it is hard to discount possible causes and consequences of the minor transient event in Figure 11. Whatever the cause, the wind farm fluctuation coincides with an increase in the VLF mode magnitude to 50mHz, before being damped. Due to governors providing the majority of pseudo steady-state frequency regulation, interactions between governors and wind farms likely caused an increase in mode magnitude.
5.2 APC activation to decrease oscillation magnitude
Figure 12 captures the effect of activation of APC at wind farms. Shown in Figure 12A is PMU data that recorded the 60-70 mHz oscillation that took place as system frequency transitions above 50 Hz, this persisted for approximately 250 s. The activation of APC controls reduced power output from multiple wind sites, reducing the power system frequency by approximately 50 mHz. This curtailed power was then employed by the APC to successfully dampen the oscillation to below 10 mHz. The dampening effect is seen in the continuous wavelet transform in Figure 12B, with a clear generalized oscillation pre-450s. Once APC is initiated, the period of the VLFO increases as its magnitude drops to zero.
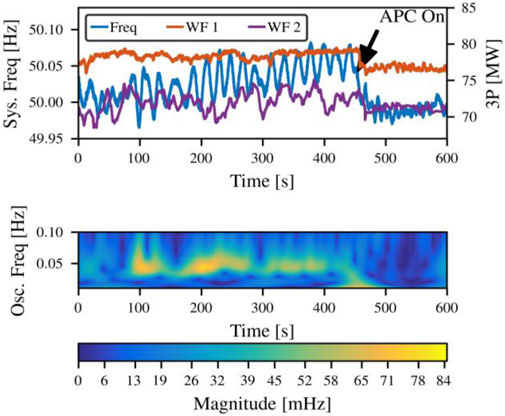
FIGURE 12. (A) System frequency and active power output from WF1 and WF2 when APC is switched on after 450 s (B) continuous wavelet transform showing the reduction in oscillation magnitude in system frequency for oscillation frequencies between 0.02 and 0.1 Hz.
These data demonstrate that APC can be used in an emergency control situation or ambient conditions to reduce background oscillations. It is worth noting that the oscillation magnitude of the power response at the wind farm will be proportional to the oscillation magnitude of the system frequency and that only a small proportion of the curtailed power was required to dampen the VLFO. This observation supports the findings in Section 4 that small power provision and low droop settings can quickly and effectively move the power system into positive damping. Therefore, TSOs may not need to employ costly curtailment to achieve significant dampening of VLFOs.
5.3 APC turned off and increase in oscillation magnitude
Figure 13A shows the active power output of WF1, alongside system frequency. Wind curtailment for APC was possibly discontinued to increase system frequency. Switching off curtailment resulted in a 15 MW rise in output from WF1; presumably, similar increases would be observed at other wind farms with active APC. The additional power resulted in a frequency increase of approximately 12 mHz. The removal of APC control also coincides with an immediate onset of a VLFO apparent in the frequency trace in Figure 13A. The magnitude of background oscillations increased from approximately 10–50 mHz. The continuous wavelet transform plot of the frequency data is presented in Figure 13B and decomposes the VLFO into its constituent parts. It is noteworthy that VLFOs operate across multiple bands and emerge and dissipate multiple times. It is probable that the sources of the VLFO were active while the APC was on but that they were so well damped that they were virtually undetectable due to positive dampening. This supposition is supported by the observation from small-signal analysis in Section 4, where high positive dampening made the study of VLFO almost impossible as they did not emerge.
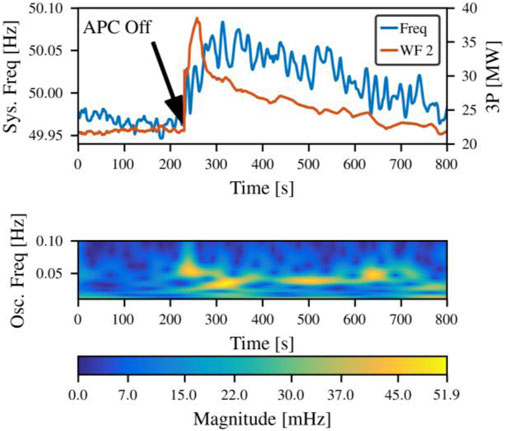
FIGURE 13. (A) System frequency and active power output fromWF2 when APC is switched off after 200 s (B) continuous wavelet transform showing the increase in oscillation magnitude in system frequency for oscillation frequencies between 0.02 and 0.1 Hz.
5.4 APC interaction with deadband
Figure 14 shows the active power output from WF1 as the system frequency passes through the ±15 mHz APC deadband typically set on the Irish power system.
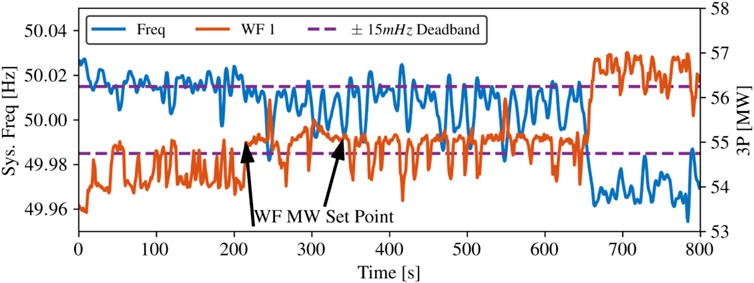
FIGURE 14. Wind Farm power response and interaction with reduced
During the time 0-200 s, the frequency is above the deadband, and WF1 modulates its power output in anti-phase to frequency oscillations. Similarly, from 650 s onwards, system frequency is below the deadband, and the windfarm responds with a similar anti-phase power/frequency response. However, while the frequency is within the deadband the power output from the wind farm remains relatively constant, with perturbations in power output arising primarily from infringements of the deadband. It is noteworthy that the magnitude of background frequency oscillations are markedly higher while system frequency is in the deadband and wide-area APC is effectively discontinued. In the simulations in Section 4 a deadband of zero was employed, this allowed for analysis of fundamental oscillatory interactions but also demonstrated the maximum potential for oscillation damping. A deadband was historically employed in control systems for a synchronous generator to reduce wear, hunting and undesirable interactions between electromechanical systems; however, CIG does not suffer as much from these issues.
Consequently, a deadband of zero might reduce wear, hunting and oscillatory coupling on power systems. That said, a deadband ±15 mHz is relatively small and VLFO magnitudes of 30 mHz are tolerated on the Irish power system. Finally, a not insignificant drop in power system frequency is observed around the 650 s point in Figure 14, this results in an appreciable droop response of 2 MW from WF1. This 2 MW power response indicates the extent of the curtailment on WF1, which may be carrying a reserve of 9.7 MW. Such a droop response is desirable for frequency stability resulting from generation/load imbalance but is unnecessary for VLFO dampening. Therefore, as demonstrated in Section 3 a VLFO dampening service would require vastly less curtailment than is currently implemented in the APC control scheme.
6 Conclusion
This work investigated the damping provided by APC controls for VLFOs using small-signal and time-domain simulations and PMU data from the Irish power system. It is demonstrated that APC control is incredibly effective for increasing the damping of VLFOs, often mitigating them beyond the point of observation or study. APC time delays were found to have minimal effect on APC performance; while increased droop settings, wind speed, curtailment and resource capacity can have a substantial impact when damping the VLF mode. Simulations demonstrated that even very conservative APC settings move the power system model from negatively damped VLFO to positive damping. PMU data from wind farms engaging in APC were investigated, and the ameliorating effect of APC is particularly apparent when APC is switched in or out of service or when power response stops while in the deadband. While APC was damping VLFO, beyond the point of observation, only a tiny proportion of the curtailed power was being utilized. A major cost of APC operation is the curtailment of active power generation from wind sites. Observations from PMU data and simulations indicate that very little curtailment is required for VLFO dampening. On the Irish system, curtailment of 15% is initiated once APC is activated, from the observations in this paper, curtailment of 1.5% should be sufficient for dampening VLFO. Alternatively, adjusting the target frequency for APC would more efficiently damp VLF modes. APC is observed to be inhibited by deadbands. The deadband on the Irish power system is small, at ±15 mHz, but an objective of zero for improving performance should be sought. There is no indication from power system models or available PMU data that this would result in deleterious system effects. While APC successfully eliminated VLFO in simulations and from PMU data, it is not suspected that CIG was the cause. Rather, it mitigated undesirable operation on conventional assets, particularly poorly tuned governors at synchronous generators. To summarize, effective VLFO damping can be achieved with low curtailment, low droop, and low wind speeds; system operators should continuously employ less aggressive APC at CIG to dampen VLFO.
Data availability statement
All simulated data created during this research is openly available from Zenodo open data repository at DOI: 10.5281/zenodo.6805574. PMU Data supporting this study cannot be made available due to NDA agreement.
Author contributions
CD contributed to conception and design of the study, performed analysis, wrote the first draft of the manuscript. XL, RB, and JM contributed to supervision, all authors contributed to manuscript revision, read, and approved the submitted version.
Acknowledgments
The authors would like to thank SONI/EirGrid for providing PMU data. The authors would also like to thank DIgSILENT for granting a thesis license to continue research off-campus during COVID-19. The authors would like to acknowledge the financial support from the SPIRE2 project (Storage Platform for the integration of Renewable Energy). The SPIRE two project is supported by the European Union’s INTERREG VA Programme, managed by the Special EU Programmes Body (SEUPB). The views and opinions expressed in this paper do not necessarily reflect those of SEUPB. This work is alo supported by EPSRC Supergen Networks Hub (EP/S00078X/2) - SEN Hub Sub-Project Award for a project entitled “Challenges and Opportunities of Machine Learning and BESS for Oscillations Mitigation in Low Inertia Power Networks’. All simulated data created during this research is openly available. The names of the repository and accession number can be found in the article upon publication.
Conflict of interest
The authors declare that the research was conducted in the absence of any commercial or financial relationships that could be construed as a potential conflict of interest.
Publisher’s note
All claims expressed in this article are solely those of the authors and do not necessarily represent those of their affiliated organizations, or those of the publisher, the editors and the reviewers. Any product that may be evaluated in this article, or claim that may be made by its manufacturer, is not guaranteed or endorsed by the publisher.
References
Adeen, M., and Milano, F. (2021). On the impact of auto-correlation of stochastic processes on the transient behavior of power systems. IEEE Trans. Power Syst. 36 (5), 4832–4835. doi:10.1109/tpwrs.2021.3068038
AEMO (2017). Review of frequency control performance in the NEM under normal operating conditions. Brisbane: DIgSILENT Pacific.
Arango, O. J., and Sanchez, H. M. (2010). Low frequency oscillations in the Colombian power system – identification and remedial actions. CIGRE 2010 Paris, 1–12.
Chen, G., Tang, F., Shi, H., Yu, R., Wang, G., Ding, L., et al. (2018). Optimization strategy of hydrogovernors for eliminating ultralow-frequency oscillations in hydrodominant power systems. IEEE J. Emerg. Sel. Top. Power Electron. 6 (3), 1086–1094. doi:10.1109/jestpe.2017.2788004
Chen, L., Min, Y., and Hu, W. (2013). An energy-based method for location of power system oscillation source. IEEE Trans. Power Syst. 28 (2), 828–836. doi:10.1109/tpwrs.2012.2211627
Chen, L., Min, Y., Lu, X., Xu, X., Li, Y., Zhang, Y., et al. (2017). Online emergency control to suppress frequency oscillations based on damping evaluation using dissipation energy flow. Int. J. Electr. Power & Energy Syst. 103, 414–420. doi:10.1016/j.ijepes.2018.06.022
Clark, S., Wilson, D., Al-Ashwal, N., Macleod, F., Mohapatra, P., Yu, J., et al. (2016). “Addressing emerging network management needs with enhanced WAMS in the GB VISOR project,” in 19th 2016 Power Systems Computation Conference (PSCC), Genoa, Italy, 20-24 June 2016. doi:10.1109/PSCC.2016.7540948
De Marco, F., Martins, N., Pellanda, P. C., and E Silva, A. S. (2018). Simulating sustained oscillations and ambient data in a large nonlinear power system model. IEEE Power Energy Soc. Gen. Meet., 1–5. doi:10.1109/PESGM.2017.8274268
Duggan, C., Brogan, P., Liu, X., Best, R., and Morrow, J. (2021). “Synchronisation control action for very low-frequency oscillations,” in 2021 32nd Irish Signals and Systems Conference (ISSC), Athlone, Ireland, 10-11 June 2021, 1–7. doi:10.1109/ISSC52156.2021.9467843
Ellis, A., Behnke, M., and Elliott, R. (2012). Generic solar photovoltaic system dynamic simulation model specificationElectr. Coord. Counc. Model. Valid. Work Group, Sandia Contract, 1–32. doi:10.2172/1177082
Grondin, R., Kamwa, G., Trudel, J., Taborda, R., Lenstroem, H., Baumberger, L., et al. (2000). The multi-band PSS: A flexible technology designed to meet opening markets. CIGRE 2000 Paris Pap. (September), 1–12.
Homan, S., and Brown, S. (2021). The future of frequency response in Great Britain. Energy Rep. 7, 56–62. doi:10.1016/j.egyr.2021.02.055
Kundur, P., Balu, N. J., and Lauby, M. G. (1994). Power system stability and control, 7. New York: McGraw-Hill.
Lin Zhou, K. G., Yu, Xirui, Li, Bin, Zheng, Chen, Liu, Jinhong, and Liu, Qiang (2017). Damping inter-area oscillations with large-scale PV plant by modified multiple-model adaptive control strategy. Ieee Trans. Sustain. Energy 8 (4), 1629–1636. doi:10.1109/tste.2017.2697905
Mele, F. M., Wall, P., Qazi, H., Cunniffe, N., Keane, A., and Osullivan, J. (2020). Mitigating extreme over-frequency events using dynamic response from wind farms. IEEE Trans. Power Syst. 8950 (c), 1. doi:10.1109/TPWRS.2020.3011268
Milano, F., Dorfler, F., Hug, G., Hill, D. J., and Verbič, G. (2018). “Foundations and challenges of low-inertia systems,” in 2018 Power Systems Computation Conference (PSCC), Dublin, Ireland, 11-15 June 2018, 1–25. doi:10.23919/PSCC.2018.8450880
National Grid (2019). Technical report on the events of 9 august 2019. Available at: https://www.ofgem.gov.uk/system/files/docs/2019/09/eso_technical_report_-_final.pdf (Accessed Apr. 25, 2021).
Ruttledge, L., and Flynn, D. (2012). System-wide contribution to frequency response from variable speed wind turbines. IEEE Power Energy Soc. Gen. Meet. (09), 1–8. doi:10.1109/PESGM.2012.6345684
Saadatmand, M., Gharehpetian, G. B., Member, S., and Siano, P. (2021). PMU-Based FOPID controller of large-scale wind-PV farms for LFO damping in Smart grid. IEEE Access, 1. doi:10.1109/ACCESS.2021.3094170
SEMO (2020). Active power control groups. Available at: https://www.sem-o.com/documents/general-publications/Active_Power_Control_Groups_Information_Note (Accessed Mar. 11, 2021).
Singh, M., Allen, A. J., Muljadi, E., Gevorgian, V., Zhang, Y., Santoso, S., et al. (2015). Interarea oscillation damping controls for wind power plants. IEEE Trans. Sustain. Energy 6 (3), 967–975. doi:10.1109/tste.2014.2348491
Wall, P., Bowen, A., Geaney, C., and O’Connell, B. (2019). Common mode oscillations on the power system of Ireland and northern Ireland. 18th Int’l Wind Integr. Work.
Wall, P., Bowen, A., O’Connell, B., Cunniffe, N., Geaney, C., Doyle, R., et al. (2020). Analysis, monitoring and mitigation of the common mode oscillations on the power systems of Ireland and northern Ireland. CIGRE 2020 Paris, 1–14.
Wilches-Bernal, F., Chow, J. H., and Sanchez-Gasca, J. J. (2016). A fundamental study of applying wind turbines for power system frequency control. IEEE Trans. Power Syst. 31 (2), 1496–1505. doi:10.1109/tpwrs.2015.2433932
Xie, R., Kamwa, I., and Chung, C. Y. (2020). A novel wide-area control strategy for damping of critical frequency oscillations via modulation of active power injections. IEEE Trans. Power Syst, 485–494. doi:10.1109/TPWRS.2020.3006438
Xie, R., Kamwa, I., Rimorov, D., and Moeini, A. (2018). Fundamental study of common mode small-signal frequency oscillations in power systems. Int. J. Electr. Power & Energy Syst. 106, 201–209. doi:10.1016/j.ijepes.2018.09.042
Keywords: active power control, oscillation damping, very low-frequency oscillations, PMU, wind farm
Citation: Duggan C, Liu XA, Best R, Brogan P and Morrow J (2022) Active power control from wind farms for damping very low-frequency oscillations. Front. Energy Res. 10:962524. doi: 10.3389/fenrg.2022.962524
Received: 06 June 2022; Accepted: 04 July 2022;
Published: 11 August 2022.
Edited by:
Siqi Bu, Hong Kong Polytechnic University, Hong Kong SAR, ChinaReviewed by:
Jianwu Zeng, Minnesota State University, United StatesDong Chen, Scottish and Southern Energy, United Kingdom
Copyright © 2022 Duggan, Liu, Best, Brogan and Morrow. This is an open-access article distributed under the terms of the Creative Commons Attribution License (CC BY). The use, distribution or reproduction in other forums is permitted, provided the original author(s) and the copyright owner(s) are credited and that the original publication in this journal is cited, in accordance with accepted academic practice. No use, distribution or reproduction is permitted which does not comply with these terms.
*Correspondence: Connor Duggan, Y2R1Z2dhbjExQHF1Yi5hYy51aw==; Xueqin Amy Liu, eC5saXVAcXViLmFjLnVr