 Yuanren Xiu
 Zhijun Li
 Qingkai Wang1
- 1State Key Laboratory of Coastal and Offshore Engineering, Dalian University of Technology, Dalian, China
- 2School of Water Conservancy and Civil Engineering, Northeast Agricultural University, Harbin, China
- 3State Key Laboratory of Structural Analysis for Industrial Equipment, School of Naval Architecture Engineering, Dalian University of Technology, Dalian, China
In the ice-infested Bohai Sea, ice-breaking cones are generally installed on offshore wind turbine towers for ice resistance. Bending failure is a frequent ice failure mode occurring when ice interacts with ice-breaking cones. Global warming prolongs the ice formation period in the Bohai Sea, inducing an increasing trend of granular ice fraction in ice sheets. To better understand the bending mechanical behaviors of granular sea ice in the Bohai Sea, laboratory three-point bending tests were conducted using granular sea ice collected in the Bohai Sea during the winter of 2010–2011. A total of 42 ice samples were tested at −5, −10, and −15°C with strain rates of 1 × 10⁻⁶–6×10⁻⁴ s−1 in the downward direction vertical to the original ice surface. During tests, the salinity and density of each ice specimen were measured to calculate the porosity. Based on the results, negative exponential relationships were proposed between flexural strength and the square root of porosity and between effective elastic modulus and porosity. After normalization, the flexural strength showed no rate dependence at the whole strain rate range. In contrast, the effective elastic modulus increased with the strain rate. The effective elastic modulus of the ice samples was further parameterized based on the porosity and strain rate.
1 Introduction
To curb global warming forced by a great deal of greenhouse gases emission, the central government of China pledged to peak carbon emissions by 2030 and achieve carbon neutrality by 2060 (Cao et al., 2022; Zhu et al., 2022). The Bohai Economic Rim, a key economic zone in China seriously threatened by sea-level rises due to global warming, is actively seeking transformation and upgrading its energy structure (Zeng et al., 2008; Chang et al., 2020). Wind energy, a clean and sustainable energy source, is an essential alternative to fossil fuels (Wang et al., 2010). The wind power resources are abundant in the Bohai Sea (Li et al., 2016). Recently, offshore wind farms have been booming in the Bohai Sea in China (Zhu et al., 2021).
In the Bohai Sea, floating ice present in winter, inducing additional loads on structures, threatens the safety of offshore wind farms (Wang et al., 2021). Bending failure is a frequent ice failure mode occurring when ice interacts with conical offshore structures (Schulson, 2001; Qu et al., 2006). Ice loads on marine structures in bending failure are usually much lower than in other failure modes (Aly et al., 2019). Therefore, this low-load advantage of ice bending failure is utilized widely in ice-resistant designs, such as ice-breaking cones, usually installed on the tower at the mean sea level to reduce ice loads on offshore wind turbines (Ye et al., 2018; Long et al., 2020). The flexural strength and effective elastic modulus of sea ice are two crucial mechanical parameters in bending failure; thus, it is essential to study them to understand the sea ice bending mechanical behaviors (Ji et al., 2011).
Two bending test types determine the flexural strength and effective elastic modulus of sea ice: cantilever beam tests and simple beam tests (Timco and O'Brien, 1994; Timco and Weeks, 2010). The cantilever beam tests are mostly performed in the field with the full thickness of the ice sheet. They make it feasible to directly determine the ice flexural strength and effective elastic modulus across the full thickness of the ice sheet under the actual in-situ temperature gradient, preventing the problem of brine drainage and especially including the effect of the elastic foundation of water beneath the ice cover (Schwarz et al., 1981). The simple beam tests include three-point and four-point bending tests performed in the field or a laboratory, often with small sizes (Ji et al., 2011). Full-scale in-situ tests can provide the actual mechanical properties of the whole natural ice sheets in practical applications, but they are usually highly time- and labor-consuming (Aly et al., 2019; Wang et al., 2022). Small-scale laboratory tests are easier to conduct with accurate testing machines and flexible settings of test conditions (Cox and Weeks, 1986).
Because sea ice is a multiphase material consisting of pure ice, brine, gas, and solid salts, its mechanical properties largely depend on physical properties (Cox and Weeks, 1983; Timco and Weeks, 2010). Many studies proved that brine volume is an essential factor influencing flexural strength and effective elastic modulus of sea ice (Timco and Frederking, 1983; Blanchet et al., 1997; Barrette et al., 1999; Ji et al., 2011). The negative exponential equation of sea ice flexural strength depending on the square root of brine volume fraction proposed by Timco and O'Brien (1994), based on 939 measurements of ice beams from most ice-covered waters worldwide, is widely used by academia and industry. Karulina et al. (2019) conducted full-scale bending tests and presented negative exponential equations of sea ice flexural strength and effective elastic modulus relying on the square root of brine volume fraction. Given brine and gas in sea ice cannot bear loads, the mechanical properties of sea ice should depend more on the total porosity (i.e., brine volume plus gas volume) than the brine volume, especially for the warm ice that gas within sea ice may occupy more volume than brine (Timco and Weeks, 2010; Frantz et al., 2019; Wang et al., 2020). However, rare studies quantitated the effects of porosity on flexural strength and effective elastic modulus of sea ice (Wang et al., 2022).
Sea ice is a material whose mechanical properties are susceptible to strain rates. Sea ice uniaxial compression failure shows ductile and brittle behaviors under low and high strain rates (Li et al., 2011; Ji et al., 2020). Nevertheless, on the rate dependence of the sea ice flexural strength, the results from previous studies were inconsistent (Lainey and Tinawi, 1984; Blanchet et al., 1997; Ji et al., 2011). Whether the bending failure of sea ice has the same rate dependence as the compression failure still requires sufficient test verification.
Previous studies reported that granular sea ice showed higher flexural strength values than columnar sea ice (Timco and Frederking, 1983; Blanchet et al., 1997). Therefore, engineering designs should pay attention to the bending mechanical behaviors of granular sea ice. Global warming prolongs the ice formation period in the Bohai Sea, inducing an increasing trend of granular ice fraction in ice sheets (Yang et al., 2000; Wang et al., 2021; Ma et al., 2022). However, studies on flexural strength and effective elastic modulus of granular sea ice are still scarce. As a result, studies on the bending mechanical behaviors of granular sea ice in the Bohai Sea are required.
To better understand the bending mechanical behaviors of granular sea ice, three-point bending tests of granular sea ice sampled from the Bohai Sea during the winter of 2010–2011 were conducted in a cold laboratory in the current study. The physical properties of the ice samples were measured, and the influence of the porosity and strain rate on ice flexural strength and effective elastic modulus were analyzed. The paper is arranged as the following: Section 2 contains the study area, field sampling method, laboratory test method, and formulas for sea ice physical and mechanical parameters. Section 3 presents the results and relevant analysis of the physical and mechanical properties of granular sea ice specimens. A brief discussion is given in Section 4 and conclusions are drawn in Section 5.
2 Materials and methods
2.1 Study area and field sampling
The Bohai Sea is an inland sea in the north of China, spaning between 37°N and 41°N. The wind power resources in the Bohai Sea are abundant. Li et al. (2016) reported that the average wind power density in the Bohai Sea derived from the 100-m wind conditions from 1979 to 2013 was mainly 300–500 W/m2. To achieve the strategic objective of carbon neutrality, offshore wind farms in the Bohai Sea have been flourishing in recent years (Figure 1).
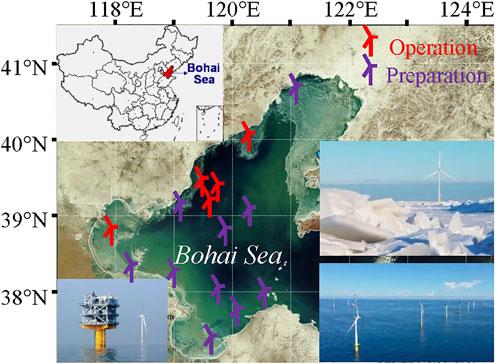
FIGURE 1. Overview of offshore wind farm development in the Bohai Sea (modified from Li et al., 2022, doi: 10.3389/fenrg.2022.947153).
The Bohai Sea is the southernmost frozen sea area in the Northern Hemisphere, and there is about a 4-month ice period every winter in the nearshore waters of the Bohai Sea (Yang et al., 2000). Sea ice is a major marine hazard in the winter Bohai Sea. In the winter of 2009–2010, a severe sea-ice hazard with a return period of 30 years in the Bohai Sea blocked ports and waterways, destroyed vessels, damaged offshore platforms, and caused a serious loss to fisheries (Li et al., 2011). Therefore, the offshore wind farms in the Bohai Sea require ice-resistant designs. Utilizing the low-load advantage of ice bending failure in ice-resistant designs, ice-breaking cones are generally installed on the wind turbine tower at the mean sea level to reduce ice forces and ice-induced vibrations (Figure 2). Owing to the tide in the Bohai Sea, the sea level fluctuation is up to 4 m (Qu et al., 2006). Therefore, double-sided ice-breaking cones (i.e., upward-downward breaking cones) were designed to cover the tidal range, and the ice sheet will interact with the upward-breaking cone at high tides and the downward-breaking cone at low tides. To estimate the ice force in this scenario for ice-resistant designs, the flexural strength and effective elastic modulus of sea ice are indispensable parameters.
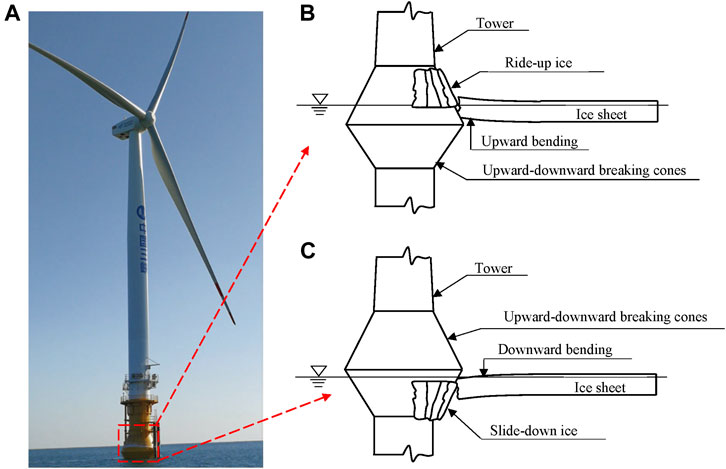
FIGURE 2. Ice-breaking cone on the wind turbine tower. (A) an offshore wind turbine with upward-downward breaking cones in the Bohai Sea; (B) a schematic diagram of a floating ice sheet interacting with the upward breaking cone at a high tide; (C) a schematic diagram of a floating ice sheet interacting with the downward breaking cone at a low tide.
To better understand the natural sea ice mechanical properties in bending failure in the Bohai Sea, ice block specimens were sampled from the nearshore area in the Liaodong Bay of the Bohai Sea (39°55.21′N, 121°40.54′E) on 25 January 2011 (Figure 3). The average air temperature at the sampling site on the day was −13.1°C. The offshore ice sheets were in the growth period, with a thickness of approximately 34 cm. A level ice sheet was selected for sampling. A total of six ice blocks, with a cross-section of 80 cm × 25 cm, were retrieved from the ice sheet using an electric chain saw. One was used for ice-crystal texture observations and the remaining for bending tests. The ice blocks were either grey or white, except the surface was slightly yellowish due to some sediment. No layered structure in the ice blocks was observed from a side view. The top and bottom of the ice blocks were marked in the field to ensure correct directions for the crystal structure observations and bending samples machining in the laboratory (Schwarz et al., 1981). Afterward, the ice blocks were wrapped in plastic cloth, transported carefully to the cold laboratory, and stored at −15°C.
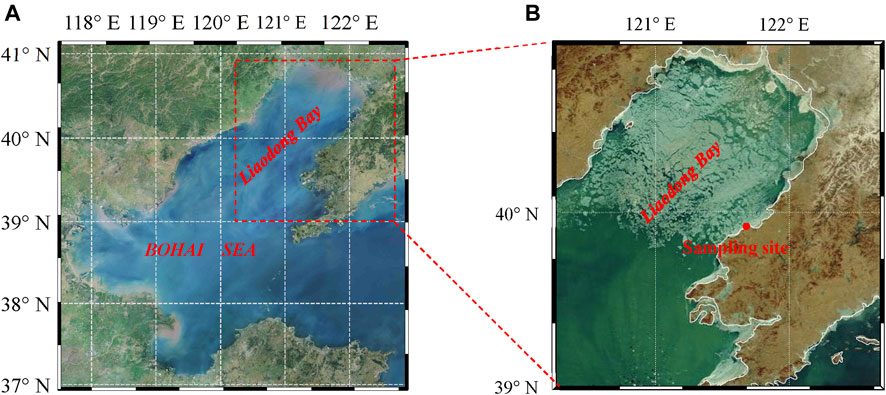
FIGURE 3. (A) Map of the location of Liaodong Bay and (B) satellite image of ice condition in Liaodong Bay on 25 January 2011 (satellite image from China Centre for Resources Satellite Data and Application).
In-situ measurements of sea ice salinity and temperature were conducted during sampling. Immediately after the first ice block was extracted, the ice temperature was measured to avoid ambient air interference (Wang et al., 2018). Using an electric drill, holes were drilled at 8 cm intervals across the ice block thickness. A temperature probe sensor (with a ± 0.1°C accuracy) was placed into the holes to measure the ice temperatures. Ice salinity was measured using a full-thickness specimen (10 × 10 cm cross-section) cut from the second ice block, which was cut into small segments according to the same location of holes drilled in the first ice block from top to bottom with a handsaw immediately after extraction. These ice segments were then separately preserved in plastic bags and taken back to the laboratory. A salimeter with an accuracy of 0.01‰ was used to measure salinity after the ice sections melted. The ice temperature and salinity profiles in the field are shown in Figure 4. The whole ice sheet showed a positive-gradient ice temperature distribution with a mean of −8.0 ± 3.6°C. Salinity measurements showed a “C-shaped” depth profile with a bulk value of 4.79‰ ± 0.32‰.
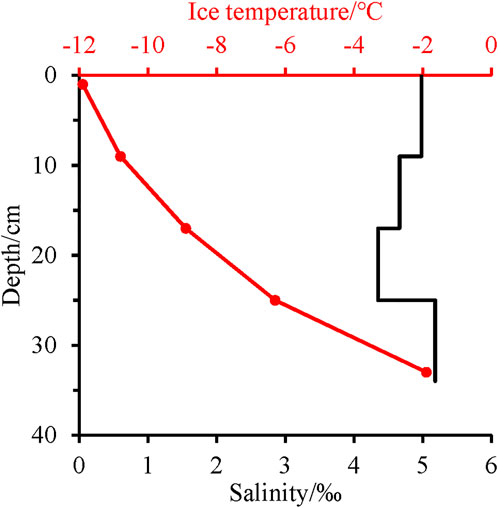
FIGURE 4. Vertical profiles of temperature and salinity of the sea ice in the field.
2.2 Laboratory test procedure
Sea ice crystal texture determines whether mechanical properties are isotropic. Therefore, the ice crystal texture observations were carried out in the cold laboratory at −18°C before machining bending samples. Two specimens (10 × 10 cm cross-section), cut from an ice block, were used for vertical and horizontal thin-section observations. The vertical specimen was cut into rectangular sections of 5–10 cm in length and 1 cm in thickness from top to bottom with a band saw. The horizontal specimen was cut at 5–10 cm intervals across the ice thickness and machined into 1 cm thickness sections. Then, the sections were attached firmly to glass plates and shaved to a thickness of about 0.5 mm using a planer (Schwarz et al., 1981). Finally, the slices were placed on a universal stage to observe the crystal structure using crossed-polarized light (Wang et al., 2018). The results of ice crystal texture observations are shown in Figure 5. There was a granular layer in the top 29 cm of the ice sheet where a large number of fine-grained crystals were in the shape of small polygons. The granular grain sizes were approximately 1 mm and showed no obvious variance along with ice depth. Below the top granular layer, the grains elongated perpendicularly with respect to the ice surface and transformed into the columnar texture with grain sizes of 2–8 mm.
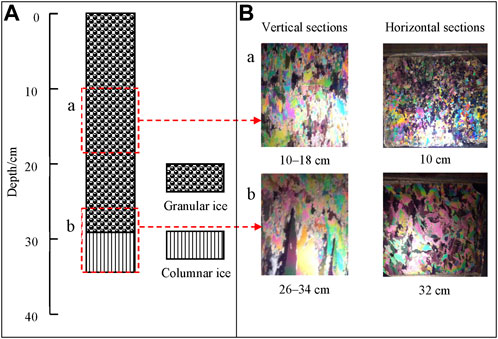
FIGURE 5. (A) The stratigraphy diagram of the ice crystal structure profile, and (B) typical photos of grain types. The ice depth of each vertical or horizontal thin section is also depicted on the lower side. The actual size of each photo of a horizontal thin section is 8 cm × 8 cm.
Previous literature reported that the sea ice in the Bohai Sea was mainly columnar texture (Li et al., 2002; Li et al., 2011). The dominant granular texture of the ice sheet (Figure 5) meant that the ice likely grew under a long-time turbulent condition in the early growth stage (Toyota et al., 2004). In the initial phase of ice formation, the frazil crystals on the water surface are linked to form the grease ice and thicken to form pancake ice as the air temperature decreases. Global warming prolongs the time for grease ice to grow into pancake ice (Wang et al., 2021; Ma et al., 2022). Under the action of wind, waves, and currents, the grease ice will undergo the repeated process of freezing-breaking-refreezing until forming the pancake ice. The longer the time for grease ice to form pancake ice, the crystal structure of the ice layer tends to be granular. Previous studies have widely studied the flexural strength and effective elastic modulus of columnar but not granular sea ice (Ji et al., 2011). Under global warming, the proportion of granular ice in the entire ice sheet increases in the Bohai Sea, requiring a better understanding of the bending mechanical properties of granular ice. In the current study, the bending mechanical properties of granular sea ice in the Bohai Sea were taken as the research object.
Three-point bending tests were adopted in this study. According to the granular-columnar ice layer interface observed by the vertical thin sections, the ice blocks were separated by a chain saw. Using a band saw, the granular-ice blocks were cut into 650 × 70 × 70 mm rectangular parallelepiped beams with a long axis parallel to the original ice sheet surface. In general, the top 3 cm of each ice block (porous ice with some sediment) was cut off and discarded (Timco and Frederking, 1983). The ice block was then cut into three layers (the upper, middle, and lower layers approximately corresponding to depths of approximately 3–11, 11–19, and 19–27 cm in the ice sheet, respectively). The layer of each ice beam was marked. The surfaces of ice beams perpendicular to the growth direction of the ice were also marked. Then, each sample was put into a plastic bag (to prevent sublimation) and stored in the thermotank at the test temperature for at least 24 h before tests were carried out (Schwarz et al., 1981).
The bending tests were conducted in the cold laboratory, as shown in Figure 6. The test conditions are summarized in Table 1. Ice specimens were loaded in the downward direction vertical to the original ice surface in the present study (ice bottom in tension). The loading direction vertical to the original ice surface was used in most previous studies, corresponding to the loading direction of flexural breaking by an icebreaking vessel, or a conical offshore structure (Timco and O'Brien, 1994). With a maximum capacity of 10 kN and linearity of 0.20%, a force sensor was used to measure the force applied to the midspan of the beam. A laser displacement sensor with a maximum measurement range of 25 mm and linearity of 0.05% was used to measure the displacement of the ice beam midspan. Both the force and displacement signals were collected synchronously at a 200 Hz frequency. Strain rates with a wide range of 1 × 10⁻⁶–6×10⁻⁴ s−1, estimated by the method given in Han et al. (2016), were selected to study the effects of strain rate on the flexural strength and effective elastic modulus of granular sea ice. Once the peak force Pmax was reached during the bending test, the test was terminated, and the data were recorded.
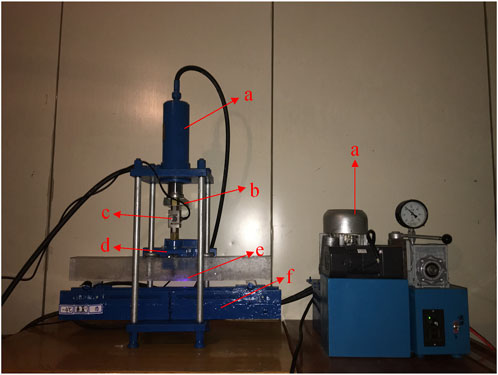
FIGURE 6. Experiment equipment for the three-point bending test: (A) hydraulic system; (B) aluminum plate; (C) force sensor; (D) line-load pressing plate; (E) laser displacement sensor (behind the ice sample); and (F) simply supported frame.
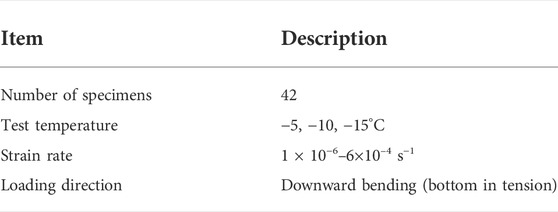
TABLE 1. Overview of the three-point bending test conditions.
The weight and size of each sample were measured at ± 0.01 g and ± 1 mm accuracy, respectively, before bending to calculate the density using the mass-volume method (Cox and Weeks, 1983; Wang et al., 2018). After each test, fragments of the ice sample were collected and put into a plastic bag to melt at room temperature. The salinity was measured by a salimeter (accuracy of ± 0.01‰) after the sample had melted completely (Moslet, 2007). Because the bending test only took a short time, the brine drainage rarely occurred during the test.
2.3 Calculating sea ice physical and mechanical parameters
As the sum of brine volume and gas volume, the total porosity integrates the influence of ice temperature, salinity, and density. This property is significant for interpreting the physical properties of sea ice. Cox and Weeks (1983) developed equations to determine the porosity at −2 to −30°C. The equations to calculate the porosity in the temperature range between −2 and −22.9°C are as follows:
where vT is the porosity (volume fraction); va is the gas volume (volume fraction); vb is the brine volume (volume fraction); Ti is the temperature of the ice specimen (°C); Si is the salinity of the ice specimen (‰); ρ is the density of the ice specimen (g·cm−3); ρi is the pure ice density (g·cm−3).
According to Timco and Weeks (2010), any ice modulus obtained mechanically is not genuinely elastic because of the inherent delayed elastic strain. Han et al. (2016) also pointed out that the total strain of the ice beam consists of elastic strain and viscous strain. As a result, the modulus obtained by mechanical tests is lower than the true elastic modulus for sea ice, expressed as the effective elastic modulus. Nevertheless, the effective elastic modulus obtained by mechanical tests is more realistic and practical because it represents the natural characteristics of sea ice.
The flexural strength and effective elastic modulus were calculated according to the linear elastic beam theory expressed as Eqs 7,8, respectively (Schwarz et al., 1981; Kermani et al., 2008):
where σf is the flexural strength (MPa); Ef is the effective elastic modulus (MPa); Pmax is the peak force (N); L = 595 mm is the span of the beam in this study; w is the width of the ice specimen (mm); h is the height of the ice specimen (mm); δ is the deflection of the ice beam midspan (mm).
The strain rate at the bottom of the ice beam midspan was calculated according to the beam-bending theory for three-point loading as follows (Kermani et al., 2008; Han et al., 2016):
where
In the present study, the determination coefficient R2 and significance level p were employed together to evaluate the reliability of the parameterized relationship characterizing the ice mechanical properties. The determination coefficient R2 is a statistical index used to reflect the reliability of the regression model to explain the variation of dependent variables. The value of the determination coefficient R2 is between 0 and 1 and the closer it is to 1, the higher the reliability of the result. The significance level p is a concept in hypothesis testing, which refers to the probability or risk that the original hypothesis is rejected when it is correct. The higher the value of significance level, the greater the risk that the original hypothesis is true but denied. A general significance level of p > 0.1 indicates that the regression model is unreliable, and the correlation between dependent variables and independent variables is not significant.
3 Results and analysis
3.1 Physical properties of sea ice
The detailed data for all beams and test results are summarized in Table 2. The salinity of ice specimens ranged from 2.48‰ to 5.35‰, with an average of 3.69‰ ± 0.74‰. The density of ice specimens ranged from 0.826 g·cm−3 to 0.922 g·cm−3, with an average of 0.890 ± 0.018 g·cm−3. Figure 7 shows the gas and brine volume fraction of each three-point bending sea ice specimen. The brine volume of ice specimens was 11.07‰–49.68‰, with an average of 23.84‰ ± 10.46‰; the gas volume was 0.96‰–104.9‰, with an average of 35.94‰ ± 19.45‰; the total porosity was 25.25‰–118.28‰, with an average of 59.79‰ ± 19.13‰. Most samples had a larger gas volume fraction than the brine volume fraction. This result was probably related to the warm climate conditions in winter in the Bohai Sea and the brine leakage of ice samples during sampling, transportation, and storage (Cox and Weeks, 1986). The gas volume fractions of upper-layer ice samples were significantly larger than those of middle- and lower-layer ice samples. As shown in Figure 7, Sample No. 34 had a brine volume much larger than the gas volume, and its gas volume was basically invisible. The particularity exhibited by sample No. 34 can be attributed to natural ice inhomogeneity. Moreover, Sample No. 34 was located at the lower layer (19–27 cm) in the ice. Under the gravity effect, the liquid brine from the upper or middle ice layers may flow to the lower layer and accumulate here to fill cavities.
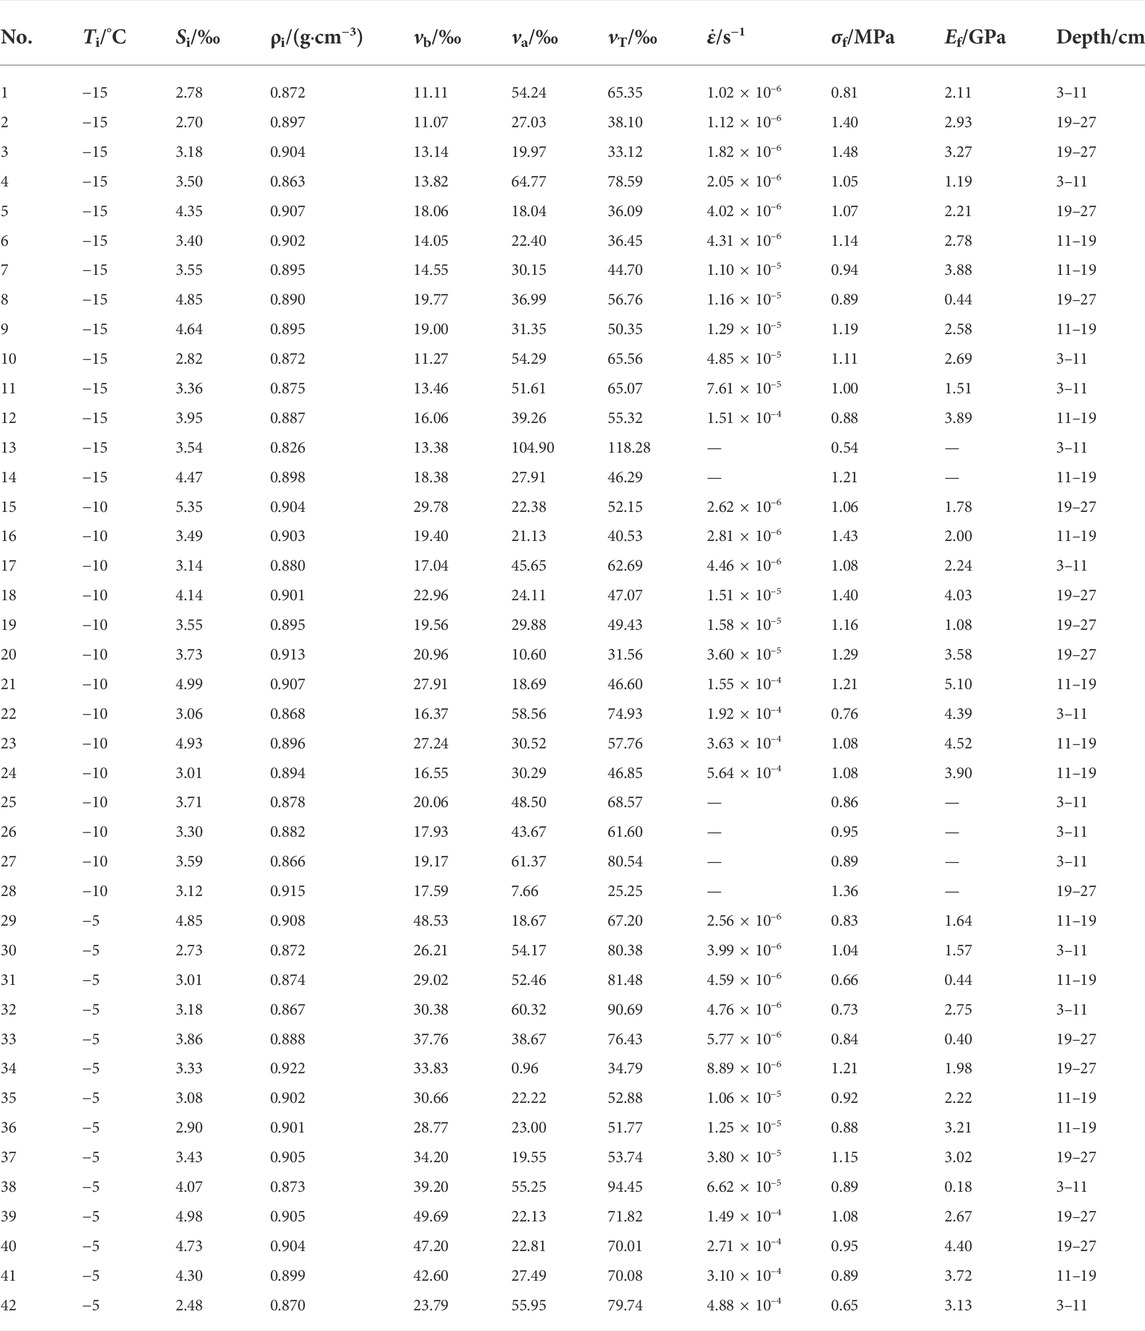
TABLE 2. Detailed data for all beams and test results.
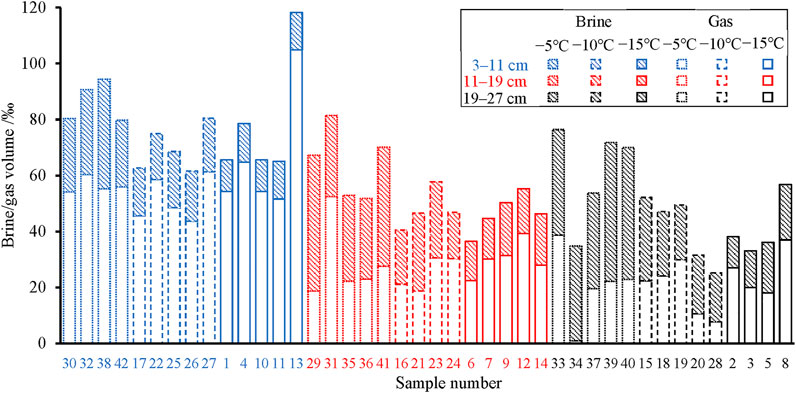
FIGURE 7. Gas and brine volume of each three-point bending sea ice specimen. The sample number corresponds to No. of ice specimens in Table 2. Colors of blue, red, and black represent the ice samples in depths of approximately 3–11, 11–19, and 19–27 cm, respectively. Short dashed, long dashed, and solid lines respect the ice temperatures of −5, −10, and −15°C, respectively.
Figure 7 shows that for specimens from each layer, the trend that the brine volume of specimens reduces with decreasing ice temperature is obvious. In contrast, for specimens from each layer, the variation of gas volume with ice temperature does not show a significant trend. The influence of ice temperature on the brine volume fraction was stronger than on the gas volume fraction, and the gas volume fraction depended more on ice density (Cox and Weeks, 1983).
3.2 Effects of porosity and strain rate on flexural strength of granular sea ice
3.2.1 Porosity
Sea ice flexural strength variations have been widely analyzed, taking the brine volume as a representative physical property (Timco and Weeks, 2010). Here the relationship between the flexural strength and brine volume was first determined. Figure 8A is a plot of flexural strength σf against the square root of the brine volume fraction. The flexural strength of granular sea ice specimens was in the range of 0.54–1.48 MPa, with an average of 1.02 ± 0.22 MPa. Referring to the formula forms of the flexural strength as a function of the square root of the brine volume fraction given in most previous studies (Timco and O'Brien, 1994; Ji et al., 2011; Karulina et al., 2019), a negative exponential relationship was used to fit the test data. The fitted result was insignificant at the significance level of p = 0.1. Regression analysis using other commonly used functions (linear, logarithmic, and power) was also conducted, but all results were insignificant.
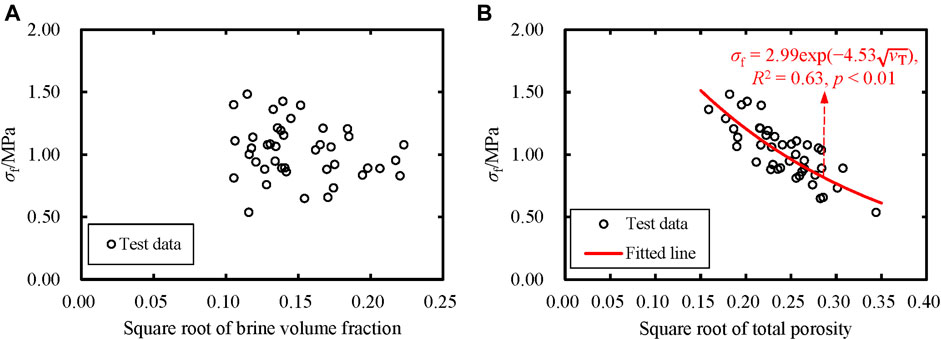
FIGURE 8. (A) Flexural strength σf versus the square root of brine volume fraction and (B) the square root of porosity for ice samples. Also shown are the equations, coefficient of determination R2, and significance level p of the fitted line.
The gas volume in most specimens was significantly larger than the brine volume. In sea ice, both brine and gas cannot bear loads. Therefore, the gas volume should be considered when analyzing the physical factors affecting its mechanical properties, especially for laboratory small-scale ice specimens tested at relatively high ambient temperatures. However, rare studies have quantitatively examined porosity’s influence on sea ice flexural strength (Wang et al., 2022). Figure 8B shows the results of flexural strength σf versus the square root of porosity obtained in this study. Also, a negative exponential relationship for the flexural strength (MPa) as a function of the square root of porosity (volume fraction) was proposed (Eq. 10):
with a determination coefficient R2 = 0.63 at a significance level of p < 0.01. The results indicated that the flexural strength of granular sea ice depended on sea ice porosity more than the brine volume fraction.
Figure 8A shows the flexural strength of granular ice specimens in the present study was almost independent of the brine volume. As a rule, ice strength measurements on small specimens feature a scatter of data. It can be due to the natural ice inhomogeneity and the presence of defects, which can be smoothed over in large-scale in-situ beam tests. In addition, characteristics of warm ice in the Bohai Sea and the brine leakage of ice samples during sampling, transportation, and storage reduced the proportion of brine volume in total porosity (Cox and Weeks, 1986). Furthermore, the square root of the brine volume fraction of ice specimens in the present study was in a narrow range of 0.10–0.22, making the flexural strength not sensitive to brine volume fraction. As a result, it wasn’t easy to draw a firm conclusion on whether the flexural strength of granular sea ice was independent of the brine volume. Still, it could be inferred from Figure 8 that the total porosity was more appropriately used as a comprehensive physical-evaluation index than the brine volume for estimating the flexural strength of granular sea ice.
3.2.2 Strain rate
To examine the influence of strain rates on the sea ice flexural strength clearly, the effects of the porosity on the flexural strength were excluded. Referring to the normalization method given by Aly et al. (2019), the flexural strength σf was normalized against a reference porosity using Eq. 11:
where σn, T is the flexural strength normalized to the reference porosity; σm, T is the flexural strength calculated by Eq. 10 using the measured porosity; σr, T is the flexural strength calculated by Eq. 10 using the reference porosity. Here, the mean porosity of 59.79‰ was selected as the reference porosity, thereby σr, T = 0.99 MPa. Eq. 11 actually transforms the flexural strength with different porosity to that with the same porosity (average porosity of ice specimens in the current study), excluding the influence of total porosity on the flexural strength.
Figure 9 depicts the plots of the normalized flexural strength value σn, T versus strain rate
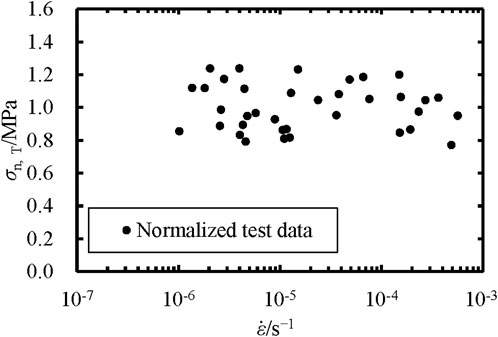
FIGURE 9. Normalized flexural strength σn, T versus strain rate
The strain rates do not appear to influence the flexural strength of ice samples. There is a ductile-to-brittle transition with increasing strain rates for sea ice under compression but not under tension (Schulson, 2001; Ji et al., 2020). The bending failure of sea ice is essentially a tensile failure because the tensile stress governs the bending failures of sea ice (Lainey and Tinawi, 1984). Timco and Weeks (2010) summarized that the tensile strength of sea ice showed little rate dependence, which corresponds to the rate independence of flexural strength demonstrated in the current study.
3.3 Effects of porosity and strain rate on effective elastic modulus of granular sea ice
3.3.1 Porosity
To clarify the relation between effective elastic modulus and porosity, both porosity values and effective elastic modulus values of test data were averaged in every porosity interval of 10‰ (The test data of 80‰–95‰ porosity were averaged because of much fewer data points than those in other porosity intervals). Figure 10 shows the plot of the effective elastic modulus Ef versus porosity νT after the average processing. The negative exponential relationship (Eq. 12) characterized the effective elastic modulus Ef (GPa) in terms of the porosity νT (‰) shown in Figure 10:
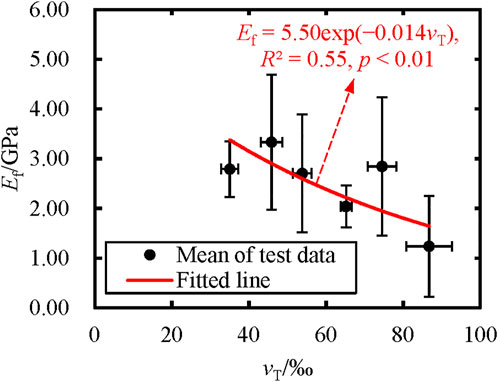
FIGURE 10. Effective elastic modulus Ef versus porosity νT from the three-point bending tests. Solid circles represent the mean of test results (the error bars represent the standard deviations). Also shown are the equation, coefficient of determination R2, and significance level p of the fitted line.
There is a concordant opinion that the effective elastic modulus decreases with increasing brine volume or porosity (Timco and Weeks, 2010; Ji et al., 2011; Karulina et al., 2019). More brine pockets and bubbles in sea ice reduce the solid ice content, making the sea ice more viscous and ductile with more delayed elastic and inelastic deformation under the same load. Moreover, the flexural strength of sea ice decreases with increasing total porosity. Therefore, the effective elastic modulus decreases as the total porosity increases because the effective elastic modulus is the ratio of the peak stress to the maximum strain.
3.3.2 Strain rate
To examine the influence of strain rates on the sea ice effective elastic modulus clearly, effective elastic modulus Ef was also normalized against the mean of porosity of 59.79‰ using the normalization method (Eq. 11) to exclude the effects of the porosity on the effective elastic modulus. Eq. 12 calculated the effective elastic modulus values used for normalization. Figure 11 is a plot of the normalized effective elastic modulus En, T against the strain rate
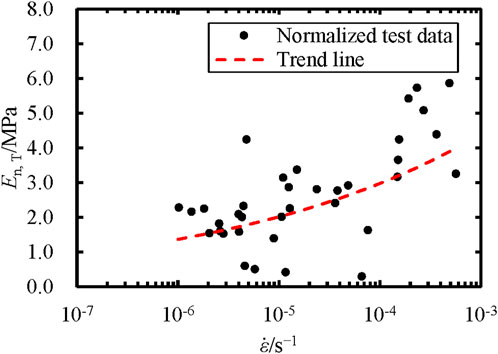
FIGURE 11. Normalized effective elastic modulus En, T versus strain rate
Sea ice is an elasto-viscoplastic material, and its mechanical behaviors are susceptible to the strain rate (Schwarz et al., 1981). The inelastic and delayed elastic strain decrease as the strain rate increases (Ji et al., 2020). Furthermore, the flexural strength shows rate independence (Figure 9). As a result, the effective elastic modulus increases with increasing strain rates because the effective elastic modulus is the ratio of the peak stress to the maximum strain, becoming closer to the true elastic modulus.
Here, the coupled influence of the porosity and the strain rate on the effective elastic modulus of sea ice were further examined. It could be assumed that the effective elastic modulus Ef (GPa) was a two-factor function of the porosity νT (‰) and strain rate
where a = 33.31, b = −1.14 × 10⁻², and c = 0.17 are the empirical coefficients obtained from all original test data points using the least-squares regression, with the coefficient of determination R2 = 0.52 and significance level of p < 0.01. Figure 12 shows the three-dimensional surface, corresponding to Eq. 13, that characterizes the effective elastic modulus versus porosity and strain rate.
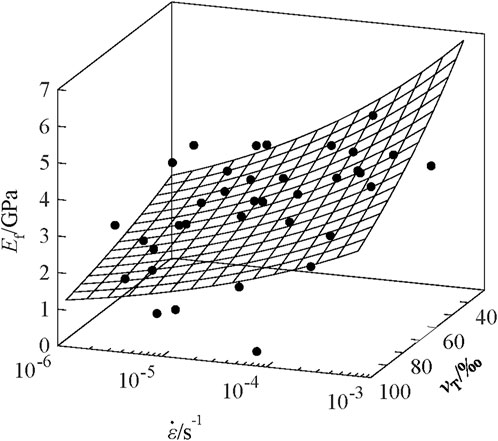
FIGURE 12. Three-dimensional surface of the effective elastic modulus Ef regarding porosity νT and strain rate
4 Discussion
Previous studies have shown sea ice flexural strength as a function of brine volume. The empirical equations for sea ice flexural strength in terms of brine volume proposed by Timco and O'Brien (1994) and Karulina et al. (2019) were given as Eqs 14,15, respectively:
Eq. 14 was determined by data compiled from sea ice worldwide including results from both in-situ cantilever beam tests and laboratory simple beam tests, whereas no distinction was made for the crystal structures. Eq. 15 was obtained from columnar-ice results by in-situ cantilever beam tests in the Arctic. Figure 13 compares the results of the present study with those of Timco and O'Brien (1994) and Karulina et al. (2019). Results of all studies show decreasing trends of sea ice flexural strength with increasing brine volume. Data points of the current study are distributed mainly above the two curves given by Timco and O'Brien (1994) and Karulina et al. (2019). The difference may be attributed to multiple factors.
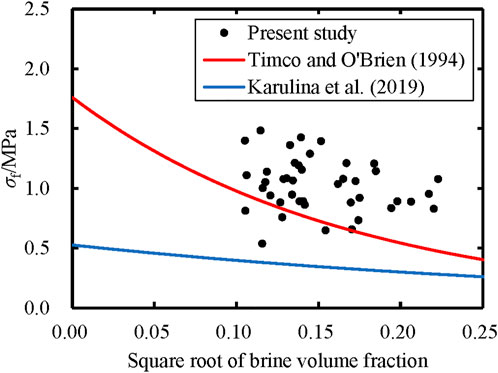
FIGURE 13. Comparisons of sea ice flexural strength σf versus square root of brine volume fraction between different studies.
Results in previous studies showed that the stress concentration in root sections of cantilever beams significantly reduces the flexural strength measured for freshwater ice, but not significantly for sea ice because the brine pockets in sea ice contain liquid brine inducing more plastic behaviors mitigating the effects of stress concentration (Schwarz et al., 1981; Karulina et al., 2019). In addition, there is not a large size effect on the flexural strength of sea ice (Parsons et al., 1992). Therefore, the test types (in-situ cantilever beam or laboratory simple beam tests) have no significant influence on the flexural strength values of sea ice (Timco and O'Brien, 1994).
According to the loading direction, ice bending tests can be divided into the top in tension tests and the bottom in tension tests (Timco and O'Brien, 1994). In the present study, all ice specimens were machined into a small thickness of 7 cm and had no temperature gradient and obvious grain-size variations along the thickness. As a result, the influence of load direction on flexural strength values was not investigated in the current study. Meanwhile, Timco and O'Brien (1994) and Karulina et al. (2019) also reported that the bending strength of sea ice loaded with top and bottom in tension is fairly close. Thus, the influence of loading direction can be ignored. Furthermore, it has been verified that there is not a strong functional dependence of the flexural strength of ice on strain rates. Therefore, the main factor resulting in differences in strength values from different studies should be the microstructures of sea ice that depend on meteorological and hydrological conditions during ice formation.
Eq. 14 was determined by data including both granular and columnar sea ice. Eq. 15 was determined only by columnar sea ice. Our results were obtained from only granular sea ice. Timco and Frederking (1982) reported that the flexural strength of granular ice in the upper part of the ice sheet was higher than that of columnar ice in the lower part, even though the granular ice layer had a higher salinity. Blanchet et al. (1997) attributed these higher flexural strength values of granular sea ice to smaller grain sizes than columnar sea ice. Earlier (Tabata et al., 1966), explained this phenomenon by the difference in the line density of the hole on the failure line between granular and columnar sea ice in bending. Therefore, the flexural strength in the present study (granular ice with grain sizes of about 1 mm) is the highest, followed by Timco and O'Brien (1994) (columnar and granular ice), and Karulina et al. (2019) (columnar ice with grain sizes of several millimeters) is the lowest.
5 Conclusion
To better understand the bending mechanical behaviors of granular sea ice in the Bohai Sea, bending tests of 42 ice specimens were conducted, along with physical properties measurements. The influences of porosity and strain rate on ice flexural strength and effective elastic modulus were analyzed.
(1) The total porosity is more appropriately used as a comprehensive physical-evaluation index than the brine volume for estimating the sea ice flexural strength. A negative exponential relationship is proposed between the flexural strength and the square root of porosity (Eq. 10).
(2) The strain rates do not influence the flexural strength of ice samples in the strain rate range of 1 × 10⁻⁶ to 6 × 10⁻⁴ s−1.
(3) The effective elastic modulus decreases as the porosity increases. A negative exponential function is proposed between effective elastic modulus and porosity (Eq. 12).
(4) After normalization, the effective elastic modulus values increase with the strain rate. The effective elastic modulus of ice samples is further parametrized as a two-parameter equation in terms of porosity and strain rate (Eq. 13).
The mechanical properties of sea ice are dependent on not only its physical properties but also crystal characteristics. Eqs 10,12,13 were derived using sea ice in the Bohai Sea and can be extended conditionally to granular ice in other regions if the meteorological and hydrological conditions and crystal characteristics of sea ice are similar.
Data availability statement
The original contributions presented in the study are included in the article/Supplementary Material, further inquiries can be directed to the corresponding author.
Author contributions
YX: conceptualization, investigation, data curation, methodology, formal analysis, visualization, validation, writing—original draft; ZL: conceptualization, project administration, supervision, resources, writing—review and editing, funding acquisition; QW: methodology, validation, writing—review and editing, funding acquisition; HH: investigation, writing—review and editing; ZZ: writing—review and editing, funding acquisition; YZu: writing—review and editing; YZh: writing—review and editing.
Funding
This work was supported by the Fundamental Research Funds for the Central Universities (DUT21RC3086), the National Natural Science Foundation of China (41906198, 51979024), and the Liaoning Revitalization Talents Program (XLYC2007033).
Acknowledgments
We are thankful for the comments and advice that the reviewers and editors gave. They helped improve the quality of this manuscript.
Conflict of interest
The authors declare that the research was conducted in the absence of any commercial or financial relationships that could be construed as a potential conflict of interest.
The reviewer DZ declared a shared affiliation, with no collaboration, with the authors YX, ZL, QW, ZZ, YZu, and YZh to the handling editor at the time of the review.
Publisher’s note
All claims expressed in this article are solely those of the authors and do not necessarily represent those of their affiliated organizations, or those of the publisher, the editors and the reviewers. Any product that may be evaluated in this article, or claim that may be made by its manufacturer, is not guaranteed or endorsed by the publisher.
Abbreviations
Ef, Effective elastic modulus; h, Height of ice specimens; L, Span of ice beams; p, Significance level; Pmax, Peak force; R2, Determination coefficient; Si, Salinity of ice specimens; Ti, Temperature of ice specimens; va, Gas volume; vb, Brine volume; vT, Porosity; w, Width of ice specimens; δ, Deflection of the ice beam midspan;
References
Aly, M., Taylor, R., Dudley, E. B., and Turnbull, I. (2019). Scale effect in ice flexural strength. J. Offshore Mech. Arct. 141 (5), 051501. doi:10.1115/1.4042388
Barrette, P. D., Phillips, R., Clark, J. I., Crocker, G., and Jones, S. J. (1999). Flexural behavior of model sea ice in a centrifuge. J. Cold Reg. Eng. 13 (3), 122–138. doi:10.1061/(asce)0887-381x
Blanchet, D., Abdelnour, R., and Comfort, G. (1997). Mechanical properties of first-year sea ice at Tarsiut Island. J. Cold Reg. Eng. 11 (1), 59–83. doi:10.1061/(asce)0887-381x
Cao, L., Lei, S., Guan, Y., Wang, Y., Zhang, Y., Tian, J., et al. (2022). CCUS industry under target of Carbon-Peak and Carbon-Neutrality: Progress and challenges. Front. Energy Res. 10, 860665. doi:10.3389/fenrg.2022.860665
Chang, L., Hao, X., Song, M., Wu, J., Feng, Y., Qiao, Y., et al. (2020). Carbon emission performance and quota allocation in the Bohai Rim economic circle. J. Clean. Prod. 258, 120722. doi:10.1016/j.jclepro.2020.120722
Cox, G. F. N., and Weeks, W. F. (1986). Changes in the salinity and porosity of sea-ice samples during shipping and storage. J. Glaciol. 32 (112), 371–375. doi:10.3189/S0022143000012065
Cox, G. F. N., and Weeks, W. F. (1983). Equations for determining the gas and brine volumes in sea-ice samples. J. Glaciol. 29 (102), 306–316. doi:10.3189/S0022143000008364
Frantz, C. M., Light, B., Farley, S. M., Carpenter, S., Lieblappen, R., Courville, Z., et al. (2019). Physical and optical characteristics of heavily melted "rotten" Arctic sea ice. Cryosphere 13 (3), 775–793. doi:10.5194/tc-13-775-2019
Han, H., Jia, Q., Huang, W., and Li, Z. (2016). Flexural strength and effective modulus of large columnar-grained freshwater ice. J. Cold Reg. Eng. 30 (2), 04015005. doi:10.1061/(ASCE)CR.1943-5495.0000098
Ji, S., Chen, X., and Wang, A. (2020). Influence of the loading direction on the uniaxial compressive strength of sea ice based on field measurements. Ann. Glaciol. 61 (82), 86–96. doi:10.1017/aog.2020.14
Ji, S., Wang, A., Su, J., and Yue, Q. (2011). Experimental studies on elastic modulus and flexural strength of sea ice in the Bohai Sea. J. Cold Reg. Eng. 25 (4), 182–195. doi:10.1061/(ASCE)CR.1943-5495.0000035
Karulina, M., Marchenko, A., Karulin, E., Sodhi, D., Sakharov, A., and Chistyakov, P. (2019). Full-scale flexural strength of sea ice and freshwater ice in Spitsbergen Fjords and North-West Barents Sea. Appl. Ocean Res. 90, 101853. doi:10.1016/j.apor.2019.101853
Kermani, M., Farzaneh, M., and Gagnon, R. (2008). Bending strength and effective modulus of atmospheric ice. Cold Reg. Sci. Technol. 53 (2), 162–169. doi:10.1016/j.coldregions.2007.08.006
Lainey, L., and Tinawi, R. (1984). The mechanical properties of sea ice — A compilation of available data. Can. J. Civ. Eng. 11 (4), 884–923. doi:10.1139/l84-106
Li, D., Geyer, B., and Bisling, P. (2016). A model-based climatology analysis of wind power resources at 100-m height over the Bohai Sea and the Yellow Sea. Appl. Energy 179, 575–589. doi:10.1016/j.apenergy.2016.07.010
Li, Z., Kang, J., and Pu, Y. (2002). Fabric and crystal characteristics of Bohai and Arctic sea ice. Chin. J. Polar Sci. Sci. 13 (1), 23–28. doi:10.3969/j.issn.1674-9928.2002.01.004
Li, Z., Zhang, L., Lu, P., Leppäranta, M., and Li, G. (2011). Experimental study on the effect of porosity on the uniaxial compressive strength of sea ice in Bohai Sea. Sci. China Technol. Sci. 54 (9), 2429–2436. doi:10.1007/s11431-011-4482-1
Li, Z., Xiu, Y., Wang, Q., Li, G., Lu, P., Zhong, S., et al. (2022). On the method of design drift-ice concentration and floe area for new-energy structures in ice-infested nearshore areas of the Bohai Sea, China. Front. Energy Res. 10, 947153. doi:10.3389/fenrg.2022.947153
Long, X., Liu, S., and Ji, S. (2020). Discrete element modelling of relationship between ice breaking length and ice load on conical structure. Ocean. Eng. 201, 107152. doi:10.1016/j.oceaneng.2020.107152
Ma, Y., Cheng, B., Xu, N., Yuan, S., Shi, H., and Shi, W. (2022). Long-term ice conditions in Yingkou, a coastal region northeast of the Bohai Sea, between 1951/1952 and 2017/2018: Modeling and observations. Remote Sens. (Basel). 14 (1), 182. doi:10.3390/rs14010182
Moslet, P. O. (2007). Field testing of uniaxial compression strength of columnar sea ice. Cold Reg. Sci. Technol. 48 (1), 1–14. doi:10.1016/j.coldregions.2006.08.025
Parsons, B. L., Lal, M., Williams, F. M., Dempsey, J. P., Snellen, J. B., Everard, J., et al. (1992). The influence of beam size on the flexural strength of sea ice, freshwater ice and iceberg ice. Philos. Mag. A 66 (6), 1017–1036. doi:10.1080/01418619208248004
Qu, Y., Yue, Q., Bi, X., and Kärnä, T. (2006). A random ice force model for narrow conical structures. Cold Reg. Sci. Technol. 45 (3), 148–157. doi:10.1016/j.coldregions.2006.05.008
Schulson, E. M. (2001). Brittle failure of ice. Eng. Fract. Mech. 68 (17–18), 1839–1887. doi:10.1016/S0013-7944(01)00037-6
Schwarz, J., Frederking, R., Gavrillo, V., Petrov, I. G., Hirayama, K.-I., Mellor, M., et al. (1981). Standardized testing methods for measuring mechanical properties of ice. Cold Reg. Sci. Technol. 4 (3), 245–253. doi:10.1016/0165-232X(81)90007-0
Tabata, T., Fujino, K., and Aota, M. (1966). Studies of the mechanical properties of sea ice XI: The flexural strength of sea ice in situ, International Conference on Low Temperature Science. I. Conference on Physics of Snow and Ice Sapporo, Japan, 14–19 August 1966. Available online at: http://hdl.handle.net/2115/20323.
Timco, G. W., and Frederking, R. M. W. (1983). Flexural strength and fracture toughness of sea ice. Cold Reg. Sci. Technol. 8 (1), 35–41. doi:10.1016/0165-232X(83)90015-0
Timco, G. W., and O'Brien, S. (1994). Flexural strength equation for sea ice. Cold Reg. Sci. Technol. 22 (3), 285–298. doi:10.1016/0165-232X(94)90006-X
Timco, G. W., and Weeks, W. F. (2010). A review of the engineering properties of sea ice. Cold Reg. Sci. Technol. 60 (2), 107–129. doi:10.1016/j.coldregions.2009.10.003
Toyota, T., Kawamura, T., Ohshima, K. I., Shimoda, H., and Wakatsuchi, M. (2004). Thickness distribution, texture and stratigraphy, and a simple probabilistic model for dynamical thickening of sea ice in the southern Sea of Okhotsk. J. Geophys. Res. 109 (C6), C06001. doi:10.1029/2003JC002090
Wang, A., Tang, M., Zhao, Q., Liu, Y., Li, B., Shi, Y., et al. (2021). Analysis of sea ice parameters for the design of an offshore wind farm in the Bohai Sea. Ocean. Eng. 239, 109902. doi:10.1016/j.oceaneng.2021.109902
Wang, Q. (2010). Effective policies for renewable energy-the example of China's wind power-lessons for China's photovoltaic power. Renew. Sustain. Energy Rev. 14 (2), 702–712. doi:10.1016/j.rser.2009.08.013
Wang, Q., Li, Z., Lei, R., Lu, P., and Han, H. (2018). Estimation of the uniaxial compressive strength of Arctic sea ice during melt season. Cold Reg. Sci. Technol. 151, 9–18. doi:10.1016/j.coldregions.2018.03.002
Wang, Q., Li, Z., Lu, P., Xu, Y., and Li, Z. (2022). Flexural and compressive strength of the landfast sea ice in the Prydz Bay, East Antarctic. Cryosphere 16 (5), 1941–1961. doi:10.5194/tc-16-1941-2022
Wang, Q., Lu, P., Leppäranta, M., Cheng, B., Zhang, G., and Li, Z. (2020). Physical properties of summer sea ice in the Pacific Sector of the Arctic during 2008–2018. J. Geophys. Res. Oceans 125 (9), e2020JC016371. doi:10.1029/2020JC016371
Yang, G. (2000). Bohai Sea ice conditions. J. Cold Reg. Eng. 14 (2), 54–67. doi:10.1061/(asce)0887-381x
Ye, K., Li, C., Chen, F., Xu, Z., Zhang, W., Zhang, J., et al. (2018). Floating ice load reduction of offshore wind turbines by two approaches. Int. J. Str. Stab. Dyn. 18 (10), 1850129. doi:10.1142/S0219455418501298
Zeng, N., Ding, Y., Pan, J., Wang, H., and Gregg, J. (2008). Climate change--the Chinese challenge. Science 319 (5864), 730–731. doi:10.1126/science.1153368
Zhu, B., Sun, C., and Jahangiri, V. (2021). Characterizing and mitigating ice-induced vibration of monopile offshore wind turbines. Ocean. Eng. 219, 108406. doi:10.1016/j.oceaneng.2020.108406
Keywords: offshore wind turbine, ice-breaking cone, granular sea ice, flexural strength, effective elastic modulus, Bohai Sea
Citation: Xiu Y, Li Z, Wang Q, Han H, Zong Z, Zu Y and Zhang Y (2022) Experimental study on flexural strength and effective elastic modulus of granular ice in the Bohai Sea, China. Front. Energy Res. 10:970051. doi: 10.3389/fenrg.2022.970051
Received: 15 June 2022; Accepted: 15 August 2022;
Published: 07 September 2022.
Edited by:
Xiaohu Yang, Xi’an Jiaotong University, ChinaReviewed by:
Koichi Ichimiya, University of Yamanashi, JapanDayong Zhang, Dalian University of Technology, China
Shifeng Ding, Jiangsu University of Science and Technology, China
Jianqiao Sun, Tianjin University, China
Copyright © 2022 Xiu, Li, Wang, Han, Zong, Zu and Zhang. This is an open-access article distributed under the terms of the Creative Commons Attribution License (CC BY). The use, distribution or reproduction in other forums is permitted, provided the original author(s) and the copyright owner(s) are credited and that the original publication in this journal is cited, in accordance with accepted academic practice. No use, distribution or reproduction is permitted which does not comply with these terms.
*Correspondence: Zhijun Li, bGl6aGlqdW5AZGx1dC5lZHUuY24=