 Hajer Gaied1
 Mohamed Naoui1
 Habib Kraiem2*
 B. Srikanth Goud3*
 Aymen Flah1
 Mamdouh L. Alghaythi4
 Hossam Kotb5Samia G. Ali6
 Kareem Aboras5
- 1Processes, Energy, Environment and Electrical Systems, National Engineering School of Gabès, University of Gabès, Gabès, Tunisia
- 2Department of Electrical Engineering, College of Engineering, Northern Border University, Arar, Saudi Arabia
- 3Department of Electrical and Electronics Engineering, Anurag University, Ghatkesar, Telangana, India
- 4Department of Electrical Engineering, College of Engineering, Jouf University, Sakaka, Aljouf, Saudi Arabia
- 5Department of Electrical Power and Machines, Faculty of Engineering, Alexandria University, Alexandria, Egypt
- 6Department of Electrical Power and Machines, Kafr el-Sheikh University, Kafr el-Sheikh, Egypt
One of the most reliable and advanced renewable energy sources is wind energy. It is critical to harness as much wind energy as possible and maintain wind turbines operating at full capacity. Maximum power point tracking (MPPT) is a cutting-edge study that incorporates a variety of approaches. Because each MPPT technique has its own set of advantages and disadvantages, developing an accurate maximum power point tracking methodology for a certain case necessitates understanding. As a result, they must be checked thoroughly. This research tries to examine many algorithms that can be used to improve the wind energy system’s global MPPT performance. The traditional “Perturb and Observe” tool, the optimization method based on the “particle swarm optimization algorithm,” the neural network, and the “fuzzy logics” as intelligent tools are these techniques. The main objective of this research is to define and evaluate four different flexible algorithms that achieve the fundamental objective of this optimization. The advantages, drawbacks, and thorough analysis of MPPT systems are highlighted in terms of initial investment, responsiveness, and capacity to create maximum energy output. All of this comparison was made through simulation software, which is the MATLAB Simulink tool. The conclusions are supported by a comprehensive discussion and presentation of the results for a variety of situations and tests that reflect real-world behavior in any wind system.
Introduction
Wind system: State of art
Despite several concerns such as international energy crises, pollution, global warming, and so on, the world’s electrical energy consumption continues to increase (Reddy et al., 2021). All energy produced directly or indirectly from the Sun, wind, water, and biosystems is classified as renewable energy (Kuang et al., 2016). In a particular location and at a given time, these energies are limitless. These energies can be classified into three main types of renewable energy: mechanical (wave and wind), electromagnetic (photovoltaic modules), and thermal (heat pumps) (geothermal, solar thermal, etc.). In particular, wind energy can be converted into mechanical energy to pump water or into electrical energy using appropriate electrical generators. Because of the home and industrial purposes related to the energy grid, this second type of conversion has grown in popularity around the world (Kou et al., 2018).
Renewable energy sources (RES) are a viable alternative. Wind energy is one of the most environmentally favorable and commercially beneficial renewable energy sources. Furthermore, until 2030, it is expected to contribute 20% of global energy production.
Wind energy has developed dramatically in recent years as a result of technological advancements, and it is now the most cost-effective kind of renewable energy, especially after the introduction of wind energy conversion to variable speed (VS-WECS). Because they have various advantages over fixed-speed systems, these systems have become the dominant technologies in today’s wind sector. Wind turbines, whether on land or off, have exceptional production capacities and are a feasible solution for the most isolated areas with limited access to electricity (Kazmi et al., 2011).
Wind power has proven to be the most reliable and established renewable energy source over the previous few decades (Lahfaoui et al., 2015). With the rising penetration of wind generators into the power system grid, it is vital to utilize all available wind power and run the wind turbine (WT) at its optimum energy conversion output. For this to happen, the wind energy conversion system (WECS) must track or function at maximum power (MPP) (Gasmi and Ben Hamed, 2017), (Saihi and Boutera, 2017). There are many publications on various maximum power point tracking (MPPT) strategies for a WECS. Making an exact MPPT strategy choice for a specific case, however, requires substantial skill as each algorithm has its own set of advantages and disadvantages. As a result, the algorithms must be thoroughly examined. However, just a few attempts have been made in this field (Khodayar et al., 2012).
MPPT control methods in literature
Based on the sensor required for computing WS, MPPT control methods can be divided into two categories: sensor-based MPPT control methods and sensorless MPPT algorithms. Sensor-based MPPT algorithms include MPPT strategies that use an anemometer to determine the true wind velocity at any given time, such as the wind velocity measuring method or tip-speed-ratio (TSR) control. Sensorless MPPT algorithms are strategies that do not rely on any equipment, such as an anemometer, to monitor wind velocity in order to extract MP. These control methods are indirect or may use techniques that do not require WT system information or knowledge, such as fuzzy logic (FL), neural network (NN), and ANFIS-based strategies.
There are several reviews (Esram and Chapman, 2007; Reza Reisi et al., 2013; Abo-Sennah et al., 2021) of MPPT methods for power generation systems (PGSs) in the present literature. Most of the reviews (Bhatnagar and Nema, 2013; Hameed et al., 2019) explored just traditional MPPT methods, but Ishaque and Salam (Ishaque and Salam, 2013) and Salam et al. (Salam et al., 2013) were focused on both traditional and PSC-suitable approaches. When PSC happens, the power-voltage (P-V) of the PV module’s characteristic curve becomes complex, with several peak values. As a result, typical MPPT approaches are inapplicable, not PSC.
The optimum power point in the WT system is determined using the MPPT control approach. Kazmi et al. (Kazmi et al., 2010) created an MPPT algorithm specifically for wind turbine systems. It analyzed numerous MPPT for WT techniques and concluded that the two control methods exposed in Kazmi et al. (Kazmi et al., 2011) and Hui and Bakhshai (Hussain and Mishra, 2016) provide the best solution with self-tuning capabilities and adaptable tracking. Some MPPT approaches for the WT system, particularly those utilized for PMSG, have been compared (Xie et al., 2013), and each specification was cited and used in a comparison work. Researchers in (Abdullah et al., 2012a) divided current approaches into nine groups based on measuring criteria and performance specifications. The MPPT control, which supposes that the pitch angle is fixed, can be used to maximize power at low and high wind speeds (Saihi and Boutera, 2017). Theoretical and experimental studies for a low-cost stand-alone WT system used in rural and urban locations, developing the MPPT technique by hill climb seeking via perturbing and observation (Gomez et al., 2016). The authors concentrated on PMSG-based wind energy systems that used various MPPT control algorithms (Sarkar and Khule, 2016). Lahfaoui et al. (Lahfaoui et al., 2015; Mohamed et al., 2020) introduced dSPACE 1104 experimental optimization based on the perturb and observe MPPT approach. In the study by Kraiem et al. (2022), the authors used a specific combination of fuzzy techniques and optimized and compared it with Newton’s search algorithm.
Main study goal
This work presents a comparative examination of MPPT approaches in wind production systems, which will help researchers improve the efficiency of wind energy systems using the DC–DC power electronic converters (Engineering et al., 2014). Basically, the standard perturb and observe control topology, the optimized MPPT, using the particle swarm optimization tool is compared (Hussain and Mishra, 2016). However, and in a second position, the intelligent solution, the fuzzy and neural controllers were adapted to this option to make the comparison more attractive. The choice of these controllers was based on the literature, which has proven the efficiency of these tools in many problems to be resolved or optimized (Kou et al., 2018). The proposed analysis was based on the power measurement, by a direct power controller. The pros and demerits of the various MPPT algorithms are also highlighted in terms of complexity, wind speed requirement, prior training, speed responses, and the capacity to obtain the maximum energy production (Dikshit and Tripathi, 2012).
Normally, even if the ambient conditions change, maximum power point tracking (MPPT) algorithms seek to offer maximum power for each time. It is critical to collect the most available power from the wind energy conversion system (WECS) at all times in order for investors to recoup the system’s capital cost quickly. But, it is clear that this quantity of power is proportional to the control MPPT chosen method. So, the suggested method’s performance was tested in a variety of wind conditions, including rapid changes in wind speed and a stochastic wind profile.
Study organization
This study is divided into five subsections. First, the introduction section is formatted and presents four subsections. Second, the wind energy conversion system is explained, by showing and discussing all the mathematical models and main blocks. In the third section, the maximum power point tracking principle is explained, and the selected control algorithms are explained and discussed. Four subsections were included inside, each one having the nomination of the corresponding used controller. In the next section, the results are shown and discussed. Finally, the conclusion, explains the study and shows the possible future endeavors of this work.
Description of the wind energy conversion system
Wind energy conversion system: Mechanical part
There are different WECS topologies according to the generator and power converter unit used (Kraiem et al., 2022). The used WECS architecture is given in Figure 1. It comprises basically the mechanical wind system that is in contact directly with the wind speed variable and moves it to the electrical motor. This one is in connection directly with the converter system that basically consists of a controller rectifier and a boost converter for generating the DC power that can be used in an isolated firm or saved into a battery pack (Lahfaoui et al., 2015) or to be reused with a DC/AC inverter to reuse the energy in sinusoidal form.
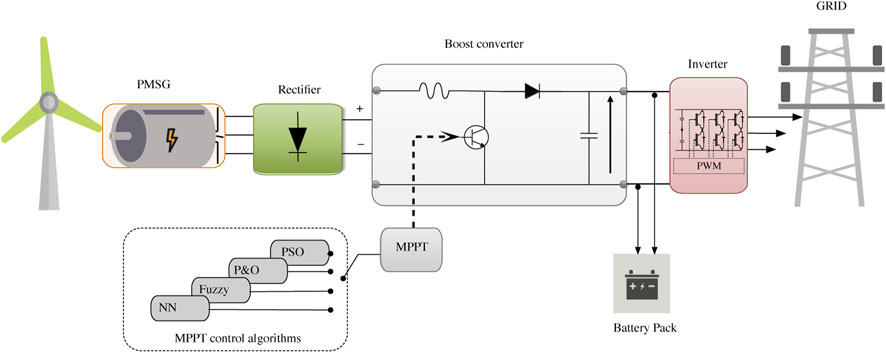
FIGURE 1. WECS topology.
The wind power
The tip speed ratio is expressed in Eq. 3.
Wind energy conversion system: Electrical part
Based on the relation between the electrical torque and the mechanical torque comprising the mass of the generator and the turbine, the mechanical angular speed of the turbine is expressed by Eq. 4.
The rotor reference frame can be used to characterize the PMSG’s dynamic model. On the d and q axes, the voltage is given by Eqs 5, 6.
where Vd; Vq; Id; iq; Ld, and Lq are two-axis machine voltages, currents, and inductances, Rs is machine resistance per phase, km is the amplitude of the flux linkages provided by the permanent magnet, and ѡe = p ѡm is the electrical angular velocity for p is pole pairs. The electromagnetic torque of PMSG excited by the wind turbine can be written as given below.
Operation and design of converters
The generator’s return electromotive force (EMF) is made up of a three-phase sinusoidal voltage that is transformed to DC voltage (Vin) by a diode rectifier. On the DC side, the MPPT is controlled by altering the duty ratio of the DC boost converter (Jeong et al., 2012). The voltages generated by the three-phase generator are denoted as standard sinusoidal functions.
After the PMSG generates electricity, the used boost converter (BC) will take care of the electric signal and try to control its variation (Abdullah et al., 2012a; Mohamed et al., 2022).
Figure 2 depicts the boost converter equivalent circuit for generator control. Vin is regulated by the boost converter via current or voltage regulation. A grid-connected inverter controls the DC-link voltage Vdc.
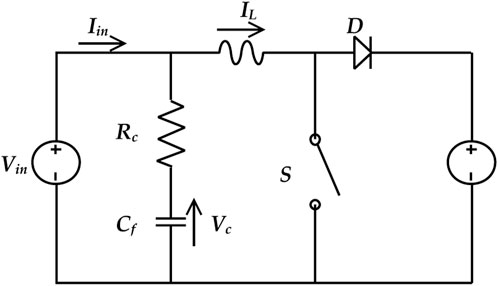
FIGURE 2. Equivalent circuit of the used DC–DC converter.
In this diagram, L and Cf denote the converter’s filter and Rc denotes the equivalent series resistance of the filter capacitor. To investigate the nonlinear system, the state-space model can be obtained. The state vector and input vectors for the DC–DC circuit analysis are derived from Eq. 8.
Eq. 8 can be used to calculate the voltage and current state equations, resulting in the system of Eq. 9.
If the switch is turned on, the circuit’s state matrix is obtained by Eq. 10.
where
Furthermore, if the switch is turned off, the circuit’s state matrix is defined as it is in Eq. 11.
where
So, it is possible to express the result of these two in Eq. 12.
Eq. 12 is converted using Laplace’s equation and then stated as a state variable becoming as it is in Eq. 13.
Eq. 13 is then used to get the equation for IL, which is it is in Eq. 14
Assuming
MPPT algorithms: Designs and specifications
To maximize the power of a wind power system, an MPPT (maximum power point tracking) controller or regulator must be used to manage the chopper. There are numerous techniques of MPPT control.
The different MPPT algorithms mentioned in the study will be summarized and discussed in this section. Each of these algorithms will be examined in terms of interior architecture design and interior running algorithm steps. Those MPPT algorithms will be cited in four subsections as follows.
Perturbation and observation (P&O)–based MPPT algorithms
This method, based on a relatively simple algorithm, allows us to search for the maximum power point without using the wind speed sensor and without knowing the curve of the aerodynamic characteristics. Despite its advantages, this control algorithm is not effective in medium- and high-power wind systems (Murthy and Rahi, 2017; Mohamed et al., 2018).
Disturbance–Perturbation and Observation (P&O) is one of the MPPT algorithms that can be used to track maximum system power. It is defined by the system disturbance algorithm and the observation of the wind turbine’s output power. When it is reaches the pinnacle of the power, it will oscillate about the optimal output voltage after the maximum power point is reached. The principle of this algorithm can be visualized in the flowchart steps as shown in Table 1. This algorithm needs fixing by adjusting the P&O step size, which is mentioned as “D” in this algorithm (Nousek et al., 2006). The used value has no fixed rules for choosing, but even if the value is minimum, the precession will be better; however, the rapidity factor will decrease. This is the inverse if the chosen value is larger (Lenzen and Wachsmann, 2004).
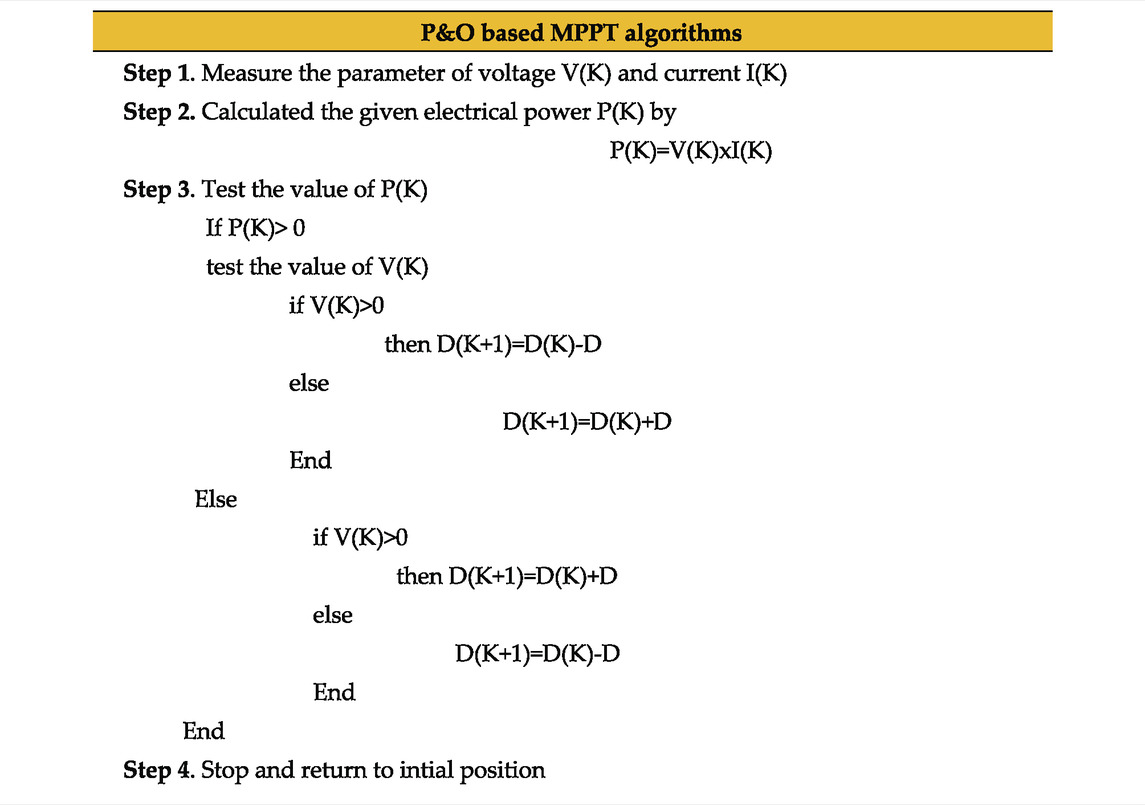
TABLE 1. P&O algorithm implementation steps.
Fuzzy logic MPPT algorithms
The fuzzy logic-based MPPT methodology was recently established as one of the intelligent ways used in wind systems to detect and track the operating point corresponding to the greatest power regardless of wind speed (Hui et al., 2011). When compared to traditional control techniques, this control is more robust and does not require a precise understanding of the system’s mathematical model. Fuzzification, inference engine, and defuzzification are the main three functional blocks of a fuzzy logic supervisor. As a result, it is distinguished by input variables, output variables, membership functions, and fuzzy rules. The success of any fuzzy controller depends on variable information, such as the number and the significance of any chosen input, the fuzzification method, and the number of rules.
For this case of application and based on numerous tests applied before in the study by Zerouali et al. (2019) and Elaissaoui et al. (2020) and in our previous works, the chosen variables are related to these three signals.
The maximum power point tracking principle if using the fuzzy controller is illustrated in the different steps in Table 2.
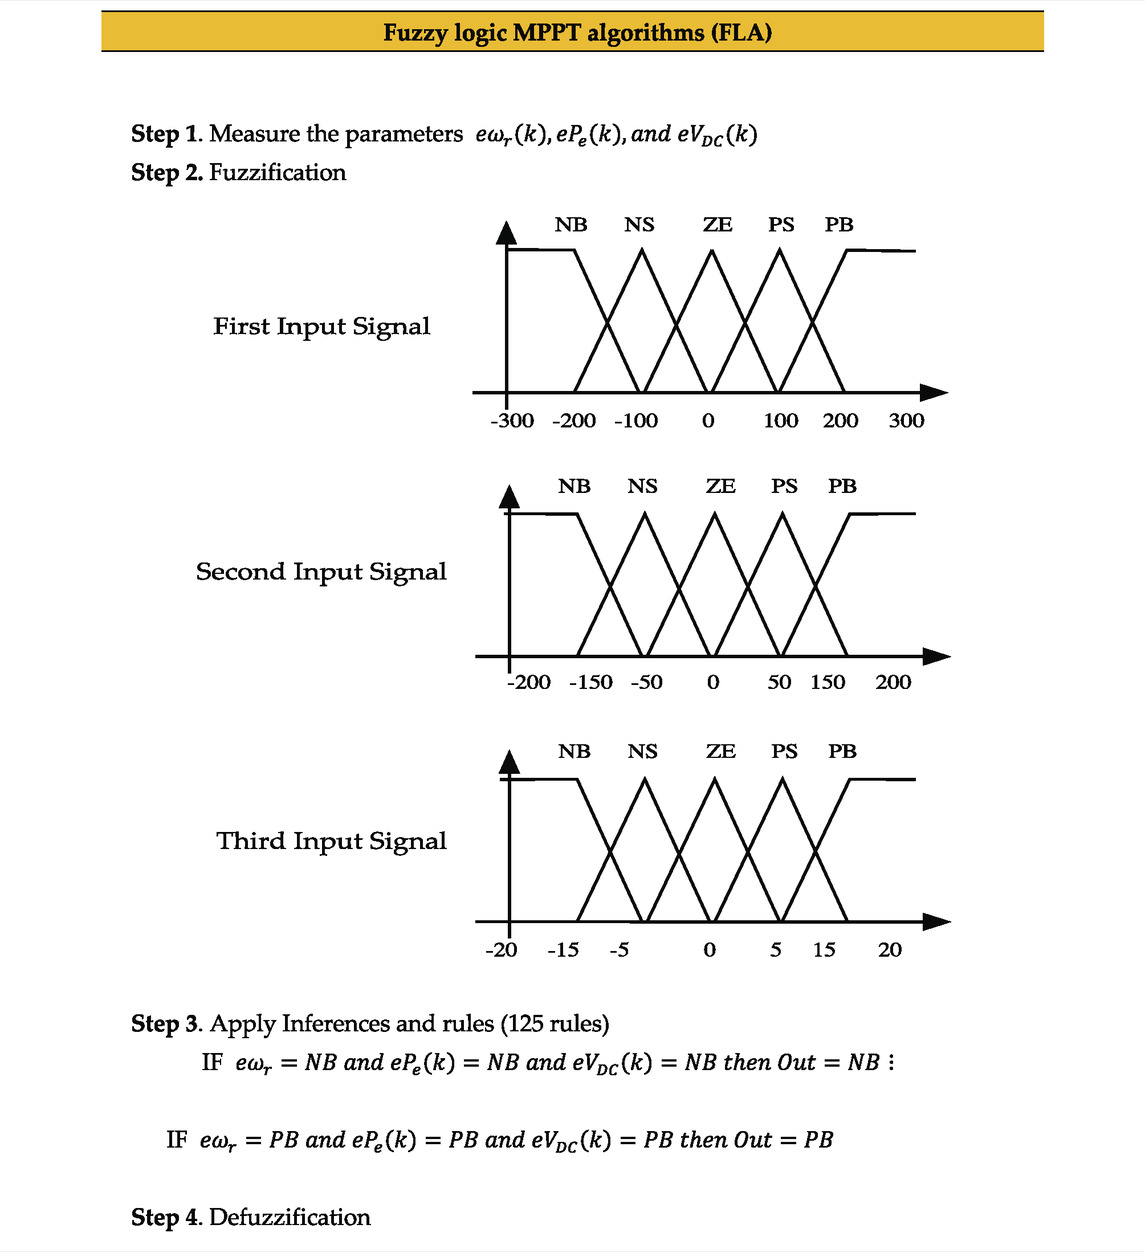
TABLE 2. Fuzzy algorithm implementation steps.
PSO-based MPPT algorithm
The PSO is a computer method for solving problems by iteratively enhancing a candidate solution in terms of a quality metric (Cheng et al., 2014). This begins with a collection of random potential solutions known as particles. In order to find the best answer, these particles are pushed around in a multidimensional search space (Abdullah et al., 2012b).
The next position is determined by the best-known position of each particle as well as the best-known position of all other particles combined (the swarm). The following two Eqs 16, 17 are used to update the particle position and velocity iteratively (Abdullah et al., 2018).
where ѡ is the inertia weight,
The position (
The designed PSO-based MPPT algorithm is to maximize the converter input power and by assuring the minimum variation inside these essential parameters to assuring the stability of the given power. So, the built objective function is illustrated in Eq. 18.
Table 3, depicts the flow chart rules for the PSO-based MPPT algorithm used in the WECS system.

TABLE 3. PSO-MPPT algorithm implementation steps.
Neural network MPPT algorithm
The neural network solution is classified as an intelligent control solution, which can learn from an existing database for making the best decision for any condition (Villegas-Mier et al., 2021). The performance of any kind of neural network controller depends basically on the database size and events. But essentially, the neural network architecture has an impact on the global performance of this intelligent supervisor (Messalti et al., 2017). Even the complex architecture not only has a good impact on the performance but also has a bad impact on the learning phase and the overall algorithm rapidly. Various architectures exist in the literature, and the choice of the input variable can make this controller successful or not.
The overall steps for making a neural network controller adaptable for any control application can be seen in the steps mentioned in Table 4. The output value of the NN-MPPT is attached directly to the inverter duty cycle (Messalti et al., 2017; Zečevič and Rolevski, 2020).
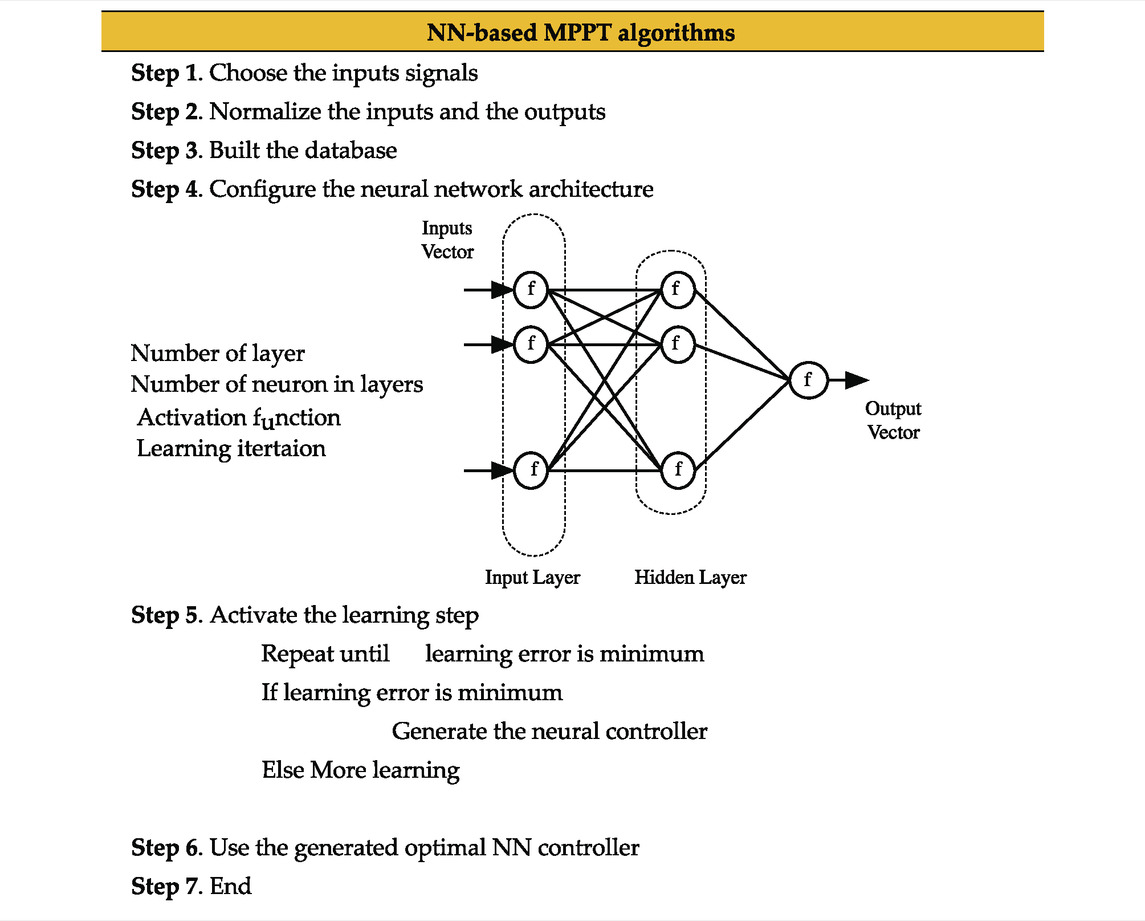
TABLE 4. NN-MPPT algorithm implementation steps.
Results and discussion
As mentioned in the study objective, the simulation results try to show the efficiency of each MPPT algorithm and prove what benefit can be obtained if each one of these were optimized. The conventional MPPT method is used first, and then the optimization solution that is related to ant colony birds is implemented. In a third test, the artificial intelligence solutions based on fuzzy technology or the neural network method are implemented and tested. The performance analysis is based on the possible obtained power that can appear even using any of these methods. On the other side, the form of the power signal sharpness is a performance factor that is used for classifying the best option for MPPT control.
Simulation conditions
For a total simulation time equal to 5 s, the given wind speed form has three different levels. For the first 1.5 s, the wind speed is equivalent to 8 m/s, and until 3.5 s, the wind speed increases to 11 m/s. Next, and for the rest of the simulation time, the wind speed is equivalent to 12 m/s.
The used algorithms’ specifications are illustrated in Table 5. This table shows the configuration of each MPPT algorithm.
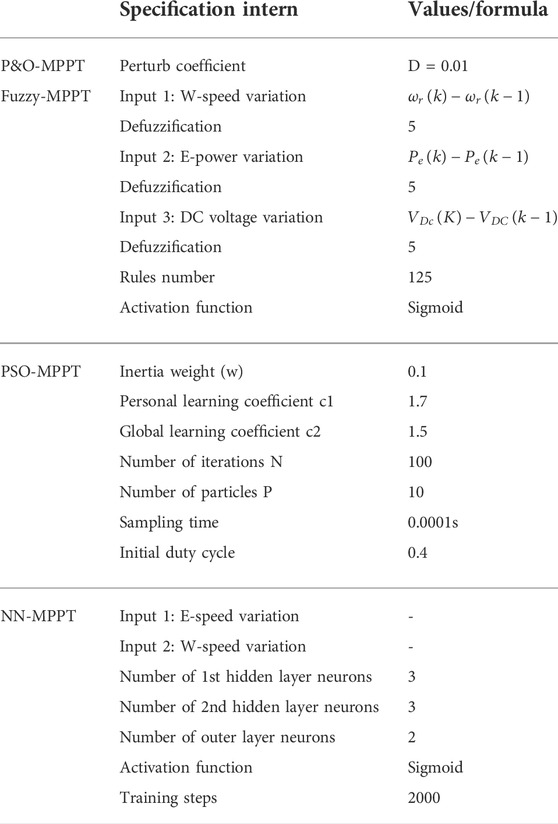
TABLE 5. Different MPPT algorithm specifications.
It is mandatory to mention the specifications of the wind system design, performance, and its power electronic parameters. All of this is mentioned in Table 6. The coefficient of performance Cp is maintained at its largest value and the pitch angle 0 when the WECS operates under the MPPT control.
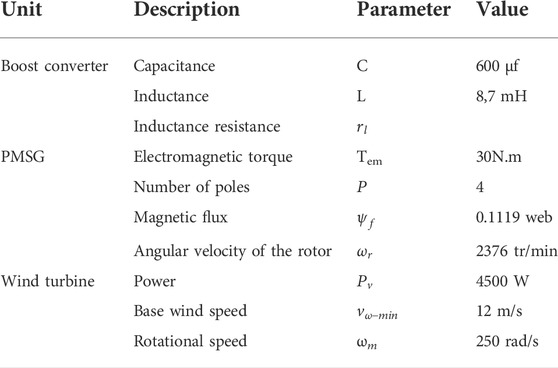
TABLE 6. Wind system specifications.
So based on these specifications, in relation to the wind system or the used controllers, the results were built using the MATLAB Simulink application. This simulation was implemented on an I7, 16 Go laptop and for a simulation period equivalent to 5 s. The given wind speed form has three different levels. The wind speed starts at 8 m/s, then it moves to 11 m/s, and then it increases to 12 m/s.
Figure 3 shows the wind speed form for the simulation time allowed. The speed change forms were chosen as a step form in order to make the excited MPPT controller and supervise the feedback in terms of rapidity and stability.
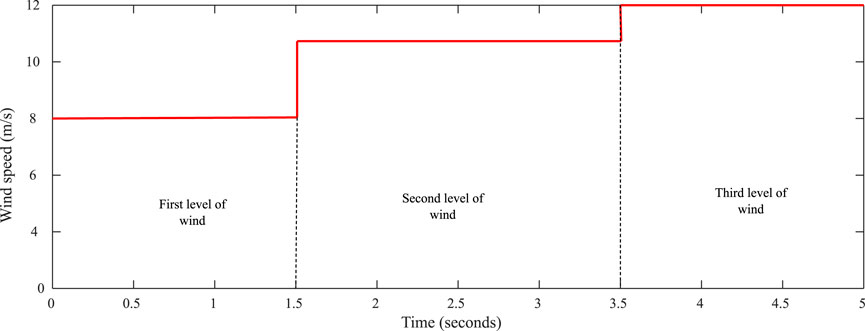
FIGURE 3. Wind speed form, used for the simulation step.
The corresponding electrical generator speed will have the same form as the complement is mechanical between the main shaft of the wind block and the rotor block. Figure 4 shows the corresponding rotor speed. Some perturbation exists on the rotor speed as some defaults were applied on the motor parameters at instance 3.8 s and 2.5 s. This was made in order to test the MPPT regulator’s efficiency and robustness next. In order to present the electrical generator specifications, Figure 5 gives a clear view of the electromagnetic torque that exists inside the motor. Even the faults made have an impact on the machine torque performances.
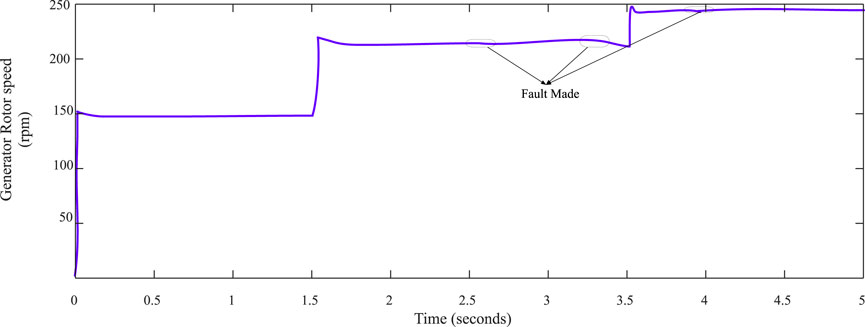
FIGURE 4. Electrical generator rotor speed (rpm).
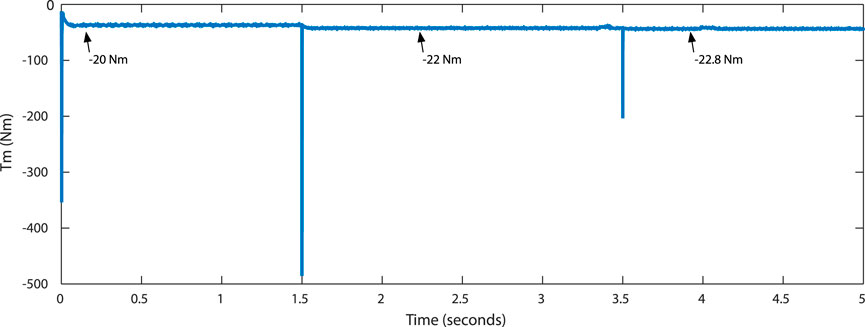
FIGURE 5. Electromagnet torque (N.m).
So, for these specifications inside the electrical generator, obtained from the wind speed, in the allowed simulation period, the electrical signals outputted from the machine are shown in Figure 6.
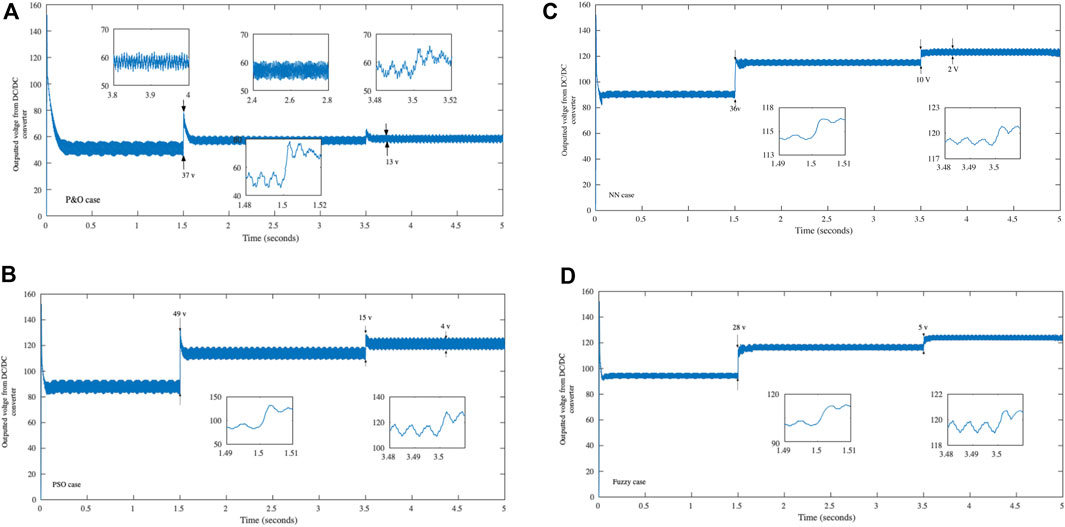
FIGURE 6. Outputted voltage from the DC/DC converter side, with the different control MPPT tools. (A) P&O MPPT case, (B) PSO MPPT case, (C) neural network MPPT case, and (D) fuzzy MPPT case.
Cost saving and performance of each MPPT technique
Based on the outputted results from the DC/DC converter after applying the different MPPT control topologies, it is clear that the performances of the MPPT are different and each method has its benefits. Table 7 resumes the statistics regarding the DC/DC voltage outputted if using each of these MPPT control topologies.
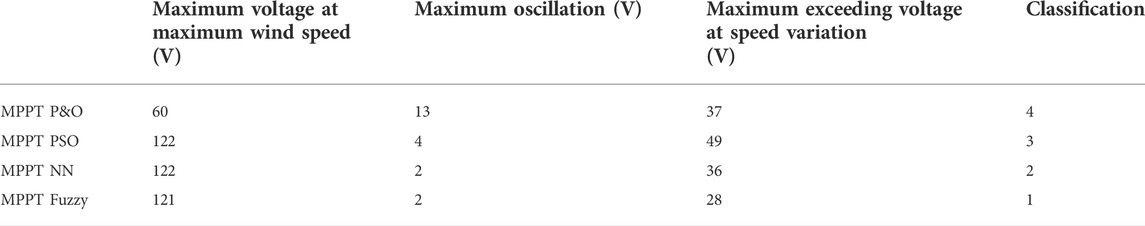
TABLE 7. Different MPPT control algorithms influence outputted voltage specification.
The influence of these different output voltages from the DC/DC converter on the output inverter side will be as it is in Figure 7. In this figure, just the best and the worst results were slated in order to clarify the difference between the two extreme cases. The different cases were then classified, based on the level of outputted power and the given signal oscillation rank, and possible maximum exceeding voltage. The results show that the fuzzy MPPT is the best solution. Therefore, the three-phase voltages were examined only for the case of MPPT P&O and MPPT FUZZY.
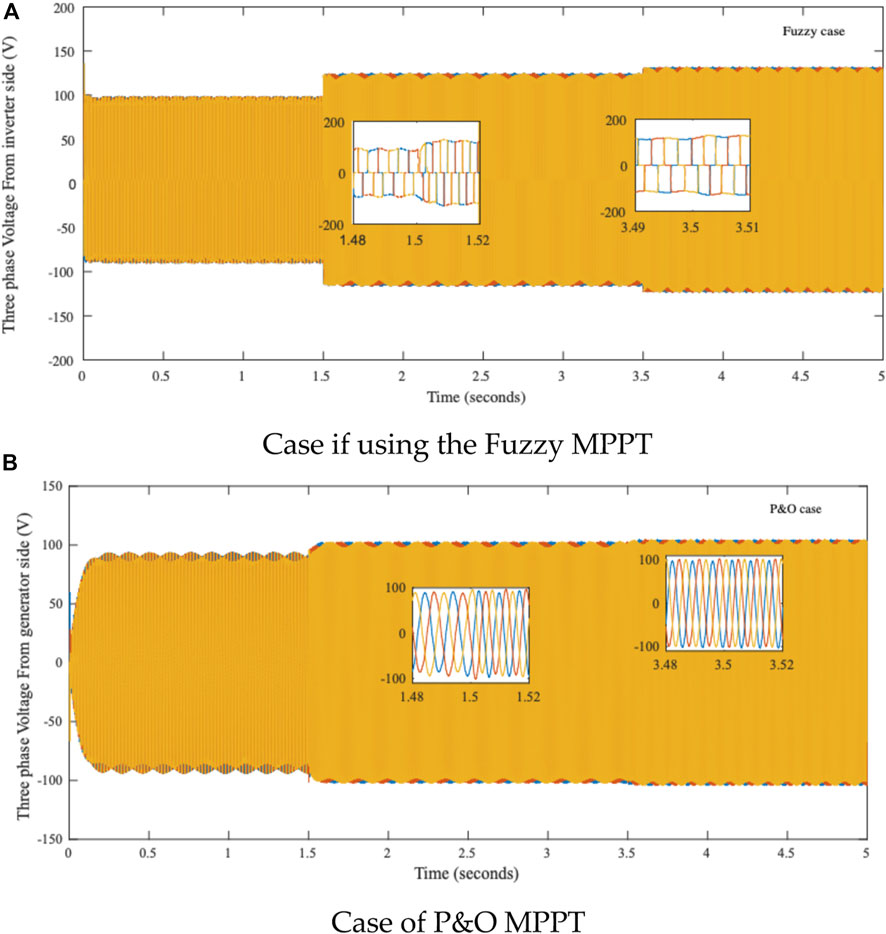
FIGURE 7. Outputted three-phase voltage from the inverter side to the grid. (A) In the case of using the fuzzy MPPT, and (B) P&O MPPT
Future endeavors
Future trends will mostly concern the extensive use of optimization techniques and hybrid methodologies for MPO-based algorithms. Optimizing produced step sizes using simpler MPO methods appears to be a potential study subject. Other new algorithms as the Mexican AXOLOTL (Rao et al., 2022) can be a useful tool and can be also tested as an optimization algorithm for the MPPT control method. More techniques can be tested and evaluated based on the newly discovered optimization tools.
In addition, we will investigate hybrid systems, in which the control system is used by integrating more than one algorithm in order to make the control lucrative and efficient. On the other hand, and in relation to the government policy, which encourages using photovoltaic systems for producing energy from small microgrids, the test of these MPPT techniques for this kind of generators can help increase the grid stability and improve the energy yield. Actually, the specification of the PV systems is a more complicated face of the wind systems, as a possible shading phenomenon can appear on the panels and a factor of radiation is very active, making the stability of the given power not satisfactory. Therefore, one of the future endeavors of this work is to test those techniques on the photovoltaic generators and get feedback on each solution and then make a decision about the best control method that can improve the global yield.
Conclusion
In this study, the wind system efficiency was examined. The efficiency of this wind generator was tested under various maximum power point tracking topologies, where the given electrical signal form was evaluated from the DC/DC converter side and after the DC/AC inverter side to be connected to the grid. The different control topologies were evaluated based on the possible given voltage level and signal specification for different wind speed forms. Basically, the P&O, the PSO, the fuzzy, and the neural network solution were formed to be adapted to control the MPPT block of the DC/DC converter. The given results show that the fuzzy MPPT topology was found more suitable as it comes with the maximum output voltage (122 V) and with less voltage variation (28 V), for the same simulation conditions. This control model has influenced positively the given outputted three-phase voltage. Therefore, fuzzy control topology seems more efficient for such applications. However, the proposed system still has more points to be adapted and ameliorated. The inverter side needs to be controlled too. On the other hand, working on the pitch angle control still has many drawbacks and maybe if integrated, the proposed control topologies can open some perspectives for this studied system.
Data availability statement
The original contributions presented in the study are included in the article/Supplementary Material; further inquiries can be directed to the corresponding authors.
Author contributions
Conceptualization: AF and MN; methodology: BG; software: HG and HKr; validation: HKr, HK, and AF; formal analysis: MA and SA; investigation: SA; resources: SA and BG; data curation: HKr and HK; writing—original draft preparation: AF, MN, and HKr; writing—review and editing: SA; visualization: BG; supervision: HK and MA; project administration: MA and HK; funding acquisition: MA and HK. All authors have read and agreed to the published version of the manuscript.
Acknowledgments
The authors extend their appreciation to the Deputyship for Research & Innovation, Ministry of Education in Saudi Arabia for funding this research work through the project number “IF_2020_NBU_439.” The authors gratefully thank the Prince Faisal bin Khalid bin Sultan Research Chair in Renewable Energy Studies and Applications (PFCRE) at Northern Border University for their support and assistance. Also authors acknowledge the support provided by the Deanship of Scientific Research at Jouf University under grant No. (DSR-2021-02-0302).
Conflict of interest
The authors declare that the research was conducted in the absence of any commercial or financial relationships that could be construed as a potential conflict of interest.
Publisher’s note
All claims expressed in this article are solely those of the authors and do not necessarily represent those of their affiliated organizations, or those of the publisher, the editors, and the reviewers. Any product that may be evaluated in this article, or claim that may be made by its manufacturer, is not guaranteed or endorsed by the publisher.
Abbreviations
References
Abdullah, M. A., Al-Hadhrami, T., Tan, C. W., and Yatim, A. H. (2018). Towards green energy for smart cities: Particle swarm optimization based MPPT approach. IEEE Access 6, 58427–58438. doi:10.1109/access.2018.2874525
Abdullah, M. A., Yatim, A. H. M., Tan, C. W., and Saidur, R. (2012). A review of maximum power point tracking algorithms for wind energy systems. Renew. Sustain. Energy Rev. 16, 3220–3227. doi:10.1016/j.rser.2012.02.016
Abdullah, M. A., Yatim, A. H. M., Tan, C. W., and Samosir, A. S. (2012). “Particle swarm optimization-based maximum power point tracking algorithm for wind energy conversion system,” in PECon 2012 - 2012 IEEE Int. Conf. Power Energy, 65–70.
Abo-Sennah, M. A., El-Dabah, M. A., and Mansour, A. E. B. (2021). Maximum power point tracking techniques for photovoltaic systems: A comparative study. Int. J. Electr. Comput. Eng. 11, 57–73. doi:10.11591/ijece.v11i1.pp57-73
Bhatnagar, P., and Nema, R. K. (2013). Maximum power point tracking control techniques: State-of-the-art in photovoltaic applications. Renew. Sustain. Energy Rev. 23, 224–241. doi:10.1016/j.rser.2013.02.011
Cheng, Z., Zhou, H., and Yang, H. (2014). Comparison between the conventional methods and PSO based MPPT algorithm for photovoltaic systems. Int. J. Electr. Robot. Electron. Commun. Eng. 8, 887–892.
Dikshit, U. C., and Tripathi, R. K. (2012). “Direct torque control for dual three-phase induction motor drives,” in 2012 Students Conf. Eng. Syst. SCES.
Elaissaoui, H., Zerouali, M., Ougli, A. El, and Tidhaf, B. (2020). “MPPT algorithm based on fuzzy logic and artificial neural network (ANN) for a hybrid solar/wind power generation system,” in 4th Int. Conf. Intell. Comput. Data Sci. ICDS 2020.
Engineering, E., Exigence, C., La, P. D. E., Azzoug, Y. A., La, C. D. E., Une, C. D., et al. (2014). Etude et modélisation d’un générateur photovoltaïque. IEEE Trans. Ind. Electron. 11, 104–108.
Esram, T., and Chapman, P. L. (2007). Comparison of photovoltaic array maximum power point tracking techniques. IEEE Trans. Energy Convers. 22, 439–449. doi:10.1109/tec.2006.874230
Gasmi, N., and Ben Hamed, M. (2017). MPPT based on torque control of wind generation. Int. Conf. Green Energy Convers. Syst. GECS.
Gomez, M., Ribeiro, E., Estima, J., Boccaletti, C., and Cardoso, A. J. M. (2016). Development of an effective MPPT method suitable to a stand-alone, low-cost wind turbine system. IECON Proc. Ind. Electron. Conf., 5550–5555.
Hameed, W. I., Saleh, A. L., Sawadi, B. A., Al-Yasir, Y. I. A., and Abd-Alhameed, R. A. (2019). Maximum power point tracking for photovoltaic system by using fuzzy neural network. Inventions 4, 33. doi:10.3390/inventions4030033
Hui, J., Bakhshai, A., and Jain, P. K. (2011). “An adaptive approximation method for maximum power point tracking (MPPT) in wind energy systems,” in IEEE Energy Convers. Congr. Expo. Energy Convers. Innov. a Clean Energy Futur. ECCE 2011, Proc, 2664–2669.
Hussain, J., and Mishra, M. K. (2016). Adaptive maximum power point tracking control algorithm for wind energy conversion systems. IEEE Trans. Energy Convers. 31, 697–705. doi:10.1109/tec.2016.2520460
Ishaque, K., and Salam, Z. (2013). A review of maximum power point tracking techniques of PV system for uniform insolation and partial shading condition. Renew. Sustain. Energy Rev. 19, 475–488. doi:10.1016/j.rser.2012.11.032
Jeong, H. G., Seung, R. H., and Lee, K. B. (2012). An improved maximum power point tracking method for: Wind power systems. Energies 5, 1339–1354. doi:10.3390/en5051339
Kazmi, S. M. R., Goto, H., Guo, H. J., and Ichinokura, O. (2011). A novel algorithm for fast and efficient speed-sensorless maximum power point tracking in wind energy conversion systems. IEEE Trans. Ind. Electron. 58, 29–36. doi:10.1109/tie.2010.2044732
Kazmi, S. M. R., Goto, H., Guo, H. J., and Ichinokura, O. (2010). “Review and critical analysis of the research papers published till date on maximum power point tracking in wind energy conversion system,” in 2010 IEEE Energy Convers. Congr. Expo. ECCE 2010 - Proc, 4075–4082.
Khodayar, M. E., Wu, L., and Shahidehpour, M. (2012). Hourly coordination of electric vehicle operation and volatile wind power generation in SCUC. IEEE Trans. Smart Grid 3, 1271–1279. doi:10.1109/tsg.2012.2186642
Kou, P., Liang, D., Li, J., Gao, L., and Ze, Q. (2018). Finite-control-set model predictive control for DFIG wind turbines. IEEE Trans. Autom. Sci. Eng. 15, 1004–1013. doi:10.1109/tase.2017.2682559
Kraiem, H., Flah, A., Mohamed, N., Messaoud, M. H. B., Al-ammar, E. A., Ahmed, A., et al. (2022). Decreasing the battery recharge time if using a fuzzy based power management loop for an isolated micro-grid farm. Sustainability 14, 2870. doi:10.3390/su14052870
Kuang, Y., Zhang, Y., Zhou, B., Li, C., Cao, Y., Li, L., et al. (2016). A review of renewable energy utilization in islands. Renew. Sustain. Energy Rev. 59, 504–513. doi:10.1016/j.rser.2016.01.014
Lahfaoui, B., Zouggar, S., Elhafyani, M. L., and Seddik, M. (2015). “Experimental study of PandO MPPT control for wind PMSG turbine,”, 6–11.Proc. 2015 IEEE Int. Renew. Sustain. Energy Conf. IRSEC2016
Lenzen, M., and Wachsmann, U. (2004). Wind turbines in Brazil and Germany: An example of geographical variability in life-cycle assessment. Appl. Energy 77, 119–130. doi:10.1016/s0306-2619(03)00105-3
Messalti, S., Harrag, A., and Loukriz, A. (2017). A new variable step size neural networks MPPT controller: Review, simulation and hardware implementation. Renew. Sustain. Energy Rev. 68, 221–233. doi:10.1016/j.rser.2016.09.131
Mohamed, N., Aymen, F., Alharbi, T. E. A., El-Bayeh, C. Z., Lassaad, S., Ghoneim, S. S. M., et al. (2022). A comprehensive analysis of wireless charging systems for electric vehicles. IEEE Access 10, 43865–43881. doi:10.1109/access.2022.3168727
Mohamed, N., Aymen, F., and Mouna, B. H. (2018). “Wireless charging system for a mobile hybrid electric vehicle,” in Proceedings of the 2018 International Symposium on Advanced Electrical and Communication Technologies, marroco (Rabat: ISAECT), 1–5.
Mohamed, N., Flah, A., and Mouna, B. H. (2020). “Influences of photovoltaics cells number for the charging system electric vehicle,” in Proceedings of the International Multi-Conference on Systems, Signals & Devices (SSD’20); tunisia, 244–248.
Murthy, K. S. R., and Rahi, O. P. (2017). A comprehensive review of wind resource assessment. Renew. Sustain. Energy Rev. 72, 1320–1342. doi:10.1016/j.rser.2016.10.038
Nousek, J. A., Kouveliotou, C., Grupe, D., Page, K. L., Granot, J., Ramirez‐Ruiz, E., et al. (2006). Evidence for a canonical gamma‐ray burst afterglow light curve in the swift XRT data. Astrophys. J. 642, 389–400. doi:10.1086/500724
Rao, C. S. V. P., Pandian, A., Reddy, C. R., Flah, A., Alqarni, M., and Alharthi, M. M. (2022). Location determination of electric vehicles parking lot with distribution system by Mexican AXOLOTL optimization and wild horse optimizer. IEEE Access 10, 55408–55427. doi:10.1109/access.2022.3176370
Reddy, C. R., Reddy, K. H., Aymen, F., Goud, B. S., Bajaj, M., Abdulaal, M. J., et al. (2021). Hybrid ROCOF relay for islanding detection. J. Electr. Eng. Technol. 17, 51–60. doi:10.1007/s42835-021-00856-9
Reza Reisi, A., Hassan Moradi, M., and Jamasb, S. (2013). Classification and comparison of maximum power point tracking techniques for photovoltaic system: A review. Renew. Sustain. Energy Rev. 19, 433–443. doi:10.1016/j.rser.2012.11.052
Saihi, L., and Boutera, A. (2017). “Robust control of a variable-speed wind turbine with fixed pitch angle and strategy MPPT control associated on a PMSG,” in Proc. 2016 8th Int. Conf. Model. Identif. Control (Algiers: ICMIC), 326–331.
Salam, Z., Ahmed, J., and Merugu, B. S. (2013). The application of soft computing methods for MPPT of PV system: A technological and status review. Appl. Energy 107, 135–148. doi:10.1016/j.apenergy.2013.02.008
Sarkar, J., and Khule, S. S. (2016). “A study of MPPT schemes in PMSG based wind turbine system,” in Int. Conf. Electr. Electron. Optim. Tech. ICEEOT 2016, 100–105.
Villegas-Mier, C. G., Rodriguez-Resendiz, J., Álvarez-Alvarado, J. M., Rodriguez-Resendiz, H., Herrera-Navarro, A. M., and Rodríguez-Abreo, O. (2021). Artificial neural networks in mppt algorithms for optimization of photovoltaic power systems: A review. Micromachines 12 (10), 1260. doi:10.3390/mi12101260
Xie, S., Wang, X., Qu, C., Wang, X., and Guo, J. (2013). Impacts of different wind speed simulation methods on conditional reliability indices. Int. Trans. Electr. energy Syst. 20, 1–6.
Zečevič, Ž., and Rolevski, M. (2020). Neural network approach to MPPT control and irradiance estimation. Appl. Sci. 10, 5051. doi:10.3390/app10155051
Keywords: renewable energy, wind energy, maximum power point tracking, fuzzy, neural network, perturb and observe, particle swarm optimization
Citation: Gaied H, Naoui M, Kraiem H, Goud BS, Flah A, Alghaythi ML, Kotb H, Ali SG and Aboras K (2022) Comparative analysis of MPPT techniques for enhancing a wind energy conversion system. Front. Energy Res. 10:975134. doi: 10.3389/fenrg.2022.975134
Received: 21 June 2022; Accepted: 07 July 2022;
Published: 10 August 2022.
Edited by:
Ziad M. Ali, Aswan University, EgyptReviewed by:
Baseem Khan, Hawassa University, EthiopiaImran Khan, University of Engineering and Technology, Pakistan
Copyright © 2022 Gaied, Naoui, Kraiem, Goud, Flah, Alghaythi, Kotb, Ali and Aboras. This is an open-access article distributed under the terms of the Creative Commons Attribution License (CC BY). The use, distribution or reproduction in other forums is permitted, provided the original author(s) and the copyright owner(s) are credited and that the original publication in this journal is cited, in accordance with accepted academic practice. No use, distribution or reproduction is permitted which does not comply with these terms.
*Correspondence: B. Srikanth Goud, c3Jpa2FudGguYkBhbnVyYWdoeWQuYWMuaW4=; Habib Kraiem, aGFiaWIua3JhaWVtQHlhaG9vLmZy