 ZiWei Liu
 QiongYao Xie*Lu DaiHaiLiang WangLing DengChun WangYu ZhangXiaoXia ZhouChuYuan YangChuan XiangSiYu Qin
- State Grid Yichang Power Supply Company, Yichang, China
In the context of smart grid planning and construction, how to tackle the future distribution network, a comprehensive evaluation of smart distribution network planning has become an urgent problem to be solved. To address this issue, this research provides a method for comprehensive evaluation that combines subjective and objective weighing approaches. Firstly, a set of evaluation index system is constructed and quantified based on the characteristics of the future distribution network; after that a comprehensive evaluation model is established and a subjective and objective weighting method combining AHP-entropy weighting method is used to weight the indicators; Finally, the actual data from the distribution network is evaluated and scored. Based on the scoring verification results, the correctness and effectiveness of the method proposed in this paper are verified.
Introduction
Smart grid offers unrivaled capabilities, making it an unavoidable trend in the evolution of modern electricity grids. The smart distribution network is especially important in a smart power grid (Zhang et al., 2014; Liu et al., 2015; Wang et al., 2015). The comprehensive evaluation of smart distribution networks is critical in the context of smart power grid design and development (Zeng et al., 2018; Yang et al., 2021a). The current comprehensive examination has yielded many benefits, but it is insufficient for the future distribution network’s quick growth. Therefore, it is of far-reaching practical significance to establish a set of distribution network evaluation index system and evaluation method in line with China’s national conditions (Yang et al., 2021b; Yang et al., 2021c; Yang et al., 2022a).
Nowadays, there are many literatures on comprehensive evaluation. Comprehensive evaluation includes two aspects: analysis and evaluation index system and evaluation method based on existing index system. Practical experience is frequently used in the examination and evaluation of the index system. Subjective considerations have far too much influence, despite the fact that it is practical and intuitive. The other kind of evaluation approach examines a specific metric, such as economy, reliability, environmental protection, etc. (Zhang et al., 2015; Dong et al., 2016; Boutaba et al., 2018; Chen et al., 2018; He et al., 2018; Wei et al., 2018; Huang et al., 2019; Yang et al., 2021b; Yang et al., 2021c; Yang et al., 2022a; Yang et al., 2022b).
Literature (Wei et al., 2018) establishes an evaluation index system from five aspects: power supply capability, power supply reliability, power quality, economy and abundance, and then uses analytic hierarchy approach to create an evaluation model. Based on the evaluation method of analytic hierarchy Process, literature (Huang et al., 2019) analyses the technical, economic, and environmental aspects of distribution networks. Literature (He et al., 2018) is based on the construction of the evaluation system of the target grid, and quantitative evaluation of the distribution network is carried out with the comprehensive evaluation method of fuzzy mathematics. Chen B et al. used network analysis method with anti-entropy method to determine index weight and scoring function, and tackled the problem of cross and mutual influence among indicators caused by inaccurate weight (Chen et al., 2018). In the evaluation of distribution network, literature (Zhang et al., 2015; Dong et al., 2016) builds a comprehensive evaluation index system including economy, sociality and environment. Different from the previous literature that only studied a single user group, the traditional variable weight calculation method in literature (Yang et al., 2022b) is characterized by difficult selection of state variable weight vector and weak operability. As a result, this research provides a shape similarity-based variable weight computation method. In order to reduce disparities caused by artificial subjective selection and improve the credibility of evaluation results, literature (Boutaba et al., 2018) proposed the combinatorial fuzzy comprehensive evaluation method. Literature (Zhang and Lv, 2018) determined the weight assignment of each indicator based on analytic hierarchy process and enhanced entropy weight method, and established VIKOR multi-criteria evaluation system. Literature (Tian et al., 2019) provided a discrete energy flow calculation approach and an energy efficiency evaluation method based on a weighted directed graph equivalent model of the system. Literature (Yu et al., 2016) makes an overall review of distribution network evaluation. On the whole, the evaluation system cannot be studied solely from the subjective or objective standpoint. As a result, it is vital to investigate an evaluation precess that incorporates both subjective and objective components in order to conduct a full evaluation that is more comprehensive and complete, as well as more accurate and compelling evaluation outcomes.
To sum up, this research presents a comprehensive weight assignment mechanism based on AHP-entropy weighting method for future distribution network system (Xiong et al., 2022). The combination of subjective and objective weights makes the evaluation method more scientific, which makes up for the problems of too subjective and unstable weights in traditional AHP method. Firstly, a system of evaluation indexes is created, with the first level indexes being economy, dependability, environmental protection, and interactivity. Then, the comprehensive weighting method is used to assign weights to the indexes. Finally, the distribution network of Yichang city is selected to substitute the actual data to score and calculate the indexes. The results of an example verify the effectiveness of the proposed method, and the relevant research can provide an auxiliary decision-making basis for the construction and transformation of distribution network.
Comprehensive evaluation system construction
Comprehensive evaluation index
The establishment of a comprehensive evaluation index system is the basis of regional smart grid evaluation. It is necessary to cover all aspects of smart grid based on the development situation and objectives of China’s smart grid and reflect the planning benefits and technical characteristics of regional smart grid (Ma et al., 2022). It mainly includes the following four indicators, Figure 1 shows the evaluation index system:
(1) Economic index

FIGURE 1. Evaluation index system diagram.
Economic index can reflect the interdependence of various technological and economic phenomena and processes. Also, it reflects the technical level, management level and economic results of production and management activities.
1) Investment Cost: It can be broken down into three categories: initial investment, operation and maintenance, and failure costs. The initial investment cost includes design and planning cost, equipment purchase cost and building installation cost. The design and planning cost and equipment purchase cost will vary substantially between regions, reflecting regional differentiation according to different coefficients. Operation and maintenance costs are made up of three components: operation, maintenance, and other charges, all of which are influenced by the line loss rate. Failure cost mainly includes outage loss cost and failure loss cost.
In the equation:
2) Comprehensive line loss rate: represents the percentage of the power lost on the line to the power output of the first section of the line.
In the equation,
3) Increased load of unit investment: refers to the ratio of increased load to investment cost.
In the equation:
(2) Reliability index
Power system reliability is measured by quantitative reliability indexes, which can be the probability, frequency and duration of unfavorable impacts caused by faults on power users, as well as the expected power loss and expected power energy loss caused by faults.
1) Total pass rate: refers to the ratio of the number of lines satisfying N-1 to the total number of lines.
In the equation,
2) Total main transformer overload rate: refers to the proportion of the number of overload main transformer stations in the total number of main transformer stations. Overload main transformer refers to a transformer that has a maximum load ratio of more than 80% and a single duration of more than 2 hours.
In the equation,
3) Average user outage time: refers to the ratio of the total user outage duration to total number of users in a unit of time.
In the equation:
(3) environmental protection index
Under the influence of global warming and energy crisis, various governments n the world are vigorously advocating a low-carbon economy and building green power grid. The so-called development of green power grid refers to the construction of resource-saving and environment-friendly power grid based on the principles of “security, economy, green and harmony” (Guo and Xiang, 2022).
1) Distributed power permeability: refers to the ratio of distributed power installed capacity to 110 kV public substation capacity.
In the equation,
2) Percentage of installed renewable energy: refers to the percentage of installed renewable energy power generation capacity in the total installed regional power generation capacity.
In the equation:
3) Proportion of renewable energy generation in electricity generation: refers to the proportion of renewable energy generation in electricity generation.
In the equation:
(4) interactive index
Interaction is another crucial feature of intelligent distribution network (Li et al., 2021a). The interaction of distribution networks not only alters the traditional distribution network’s single direction of source-load and enables power distribution to be connected to the grid, but also alters the traditional distribution network’s monogeneity of power flow, and increases the network frame’s flexibility.
1) Power distribution information collection rate: refers to the ratio of the number of distribution transformers that collect information to the total number of distribution transformers.
In the equation,
2) Effective coverage rate of distribution automation: refers to the ratio of the number of 10 kV lines effectively covered by distribution automation in a region to the total number of 10 kV lines in a region.
In the equation,
3) Smart meter coverage rate: refers to the proportion of smart meters installed in the total number of installed meters.
In the equation:
Comprehensive evaluation method
The first step in a complete evaluation of a system is to weight the index, and then use the weight analysis method to obtain the final result of the evaluation. The selection of weight method and weight evaluation method is particularly important in the process (Li et al., 2021b). Typical systematic evaluation methods are mainly weighted by subjective analysis or objective data. When either of them is used alone, the evaluation results will be overly subjective or too objective. Therefore, the complete weighting approach, which combines subjective and objective weighting methods, can be applied.
The analytic hierarchy process is commonly used in the subjective weighting method. The weighting of each tier in the analytic hierarchy process will eventually effect the result, either directly or indirectly, and the degree of influence of each component in each layer on the result is quantifiable and extremely evident. This method can be used especially for the system evaluation of unstructured characteristics and the system evaluation of multi - objective, multi - criteria and multi—period (Li, 2022a). The analytic hierarchy process is focused mainly on the evaluator’s understanding of the essence and elements of the evaluation problem, and focuses on qualitative analysis and judgment more than general quantitative methods.
The entropy weight technique is commonly used in objective weighting method, which can profoundly reflect the ability to distinguish indicators, determine better weight, weighting is more objective, has theoretical basis, and has higher credibility.
As a result, the index weight adopts the method of combining subjective and objective weights. The analytic hierarchy process is used to calculate the subjective weight, and the entropy weight method is used to evaluate the objective weight. In this way, the subjective error can be minimized as much as possible, resulting in more scientific and fair outcomes (Li, 2022b).
(1) Basic steps of analytic hierarchy process
1) Build a hierarchy model. A clear hierarchy structure is established for the evaluation target. Then, an evaluation index system is formed.
2) Construct the judgment matrix and form the comparative judgment matrix of every two indexes layer by layer.
Construct the judgment matrix X, and its expression is denoted as:
In the equation,
3) Take consistency test, the calculation equation of consistency index CR is as follows:
In the equation, when CR is less than 0.1, the judgment matrix satisfies the consistency requirements, CI stands for the consistency index, RI is the average random consistency index, and the consistency index CI is calculated as follows:
4) After passing the consistency test, the vector of the maximum characteristic root of
(2) Basic steps of entropy weight method
1) The original data matrix is selected and the calculation equation is as follows:
In the equation,
2) Calculate the characteristic proportion of the evaluation object i under jth index, and the calculation equation is as follows:
3) Calculate the entropy value of jth index, and the calculation equation is as follows:
4) To calculate the difference coefficient of jth index, the equation is as follows:
5) Determine the weight coefficient of jth index, and the calculation equation is as follows:
(3) Comprehensive weighting method
According to their own experience and subjective assessment of the scenario, experts determine the subjective weighting technique. The weight of indicators is directly given by experts, and the rationality of the weight is affected by their subjective understanding. Combination weighting method is the combination of subjective weighting method and objective weighting method, which can ensure not only the important index judgment of experts, but also the value of data information, resulting in a more appropriate weight obtained by combination weighting.
If the subjective weight obtained by analytic hierarchy process is:
If the objective weight obtained by the entropy weight method is:
Then, the calculation equation of combination weighting is:
In Eq 23,
(4) Comprehensive evaluation model
In order to obtain the final comprehensive evaluation results, a comprehensive evaluation model is established, as shown below:
In the equation,
According to the comprehensive evaluation index system of smart distribution network established above, a two-layer index system of economy, reliability, environmental protection and interaction is established. The comprehensive evaluation model of smart distribution network planning is shown as follows:
In the equation,
In the equation,
Index weight determination and criterion selection
According to Eqs 13–15, the weight of economy, reliability, environmental protection and interaction of the first-level index can be obtained:
In the same way, the weight of investment cost, comprehensive line loss rate and power supply increment per unit investment for second-level index under economy of first-level index is:
Under the reliability of the first-level index, the weights of the second-level index, such as total pass rate, total main transformer overload rate and average user outage time, are as follows:
The weight of distributed power permeability, installed proportion of renewable energy, and proportion of renewable energy power in electricity generation under environmental protection are as follows:
Through analytic hierarchy process, the initial weight of the 12 indexes are 0.1782.0.099.0.0528.0.1128.0.0658.0.2914.0.065.0.0325.0.0325.0.065.0.0325.0.0325.
According to Eq 18, the index entropy value
According to the entropy value
According to Equation 20, the weight coefficient
According to Eq 23, the initial weight obtained by analytic hierarchy process is modified by weight coefficient, and the combined weight of 12 indexs is finally calculated as follows: 0.1361.0.0835.0.0769.0.1004.0.0784.0.1852.0.084.0.04975,0.05075,0.051.0.06125,0.04275.
Because the index value is in a certain range, the distribution network can ensure proper operation. In combination with the values specified in some indicators in technical Guidelines for Distribution Network Planning and Design of State Grid, and the experience of several experts in existing studies, the evaluation criteria of indicators are finally determined. The Table 1 shows the specific standard setting.
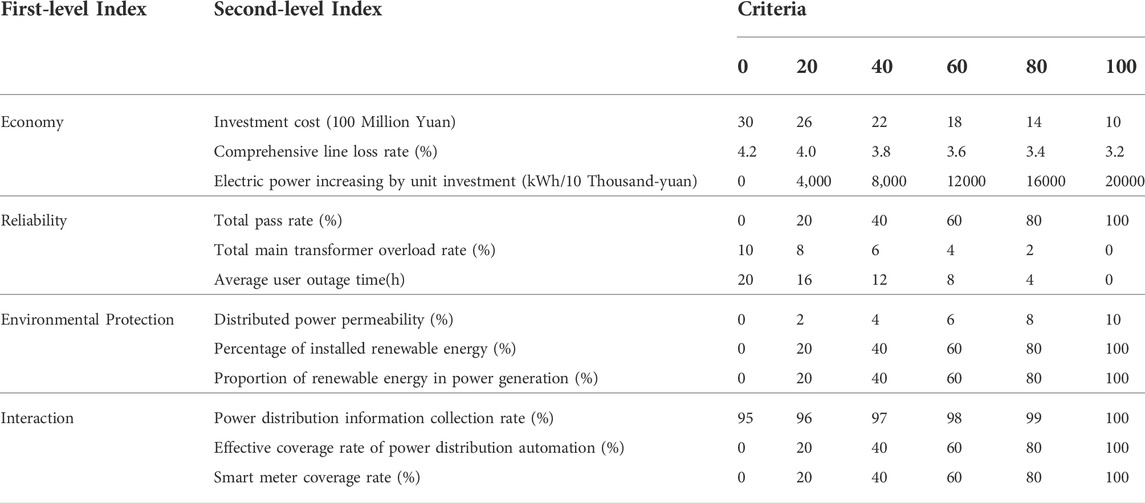
TABLE 1. Evaluation criteria of comprehensive evaluation indexes.
Example analysis
This paper takes the actual data of urban distribution network planning in Yichang, Hubei Province in 2021 as an example and compares it with the planning data in 2025. The data comes from the city power company. The comprehensive evaluation index system and comprehensive evaluation model method established in this research are used to analyze the urban distribution network of the city and validate the rationality and practicality of this study.
From the four aspects of distribution network economy, reliability, environmental protection and interaction, the actual situation of distribution network operation in Yichang city is described. According to the indexes established above, the situation of power grid in Yichang region in 2021 is completely assessed, and the specific work is as follows. The Table 2 shows the Distribution network comprehensive score of Yichang in 2021.
(1) Economic analysis
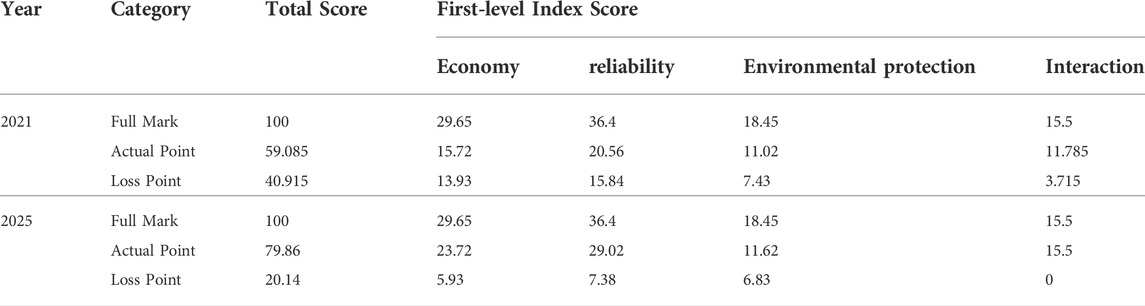
TABLE 2. Distribution network comprehensive score of Yichang in 2021.
1) Investment cost: The investment cost of Yichang Power grid in 2021 is 1996.004 million yuan, and the score calculated according to the weight is 6.83 points (full mark 13.61 points);
2) Comprehensive line loss rate: the comprehensive line loss rate of Yichang power grid is 3.6% in 2021, and the score calculated according to the weight is 5.01 points (full mark 8.35 points);
3) Electric power increasing by unit investment: electric power increasing by unit investment of Yichang Power grid is 10100 (kWh/ten thousand yuan) in 2021, and the score calculated according to the weight is 3.88 points (full mark 7.69 points).
(2) Reliability analysis
1) Total pass rate: In 2021, the total pass rate of Yichang Power grid is 59.8%, and the score calculated based on weight is 6.00 points (full mark 10.04 points);
2) Total main transformer overload rate: In 2021, the total main transformer overload rate of Yichang power grid is 4.4%, the score calculated according to the weight is 4.39 points (full mark 7.84 points);
3) Average user outage time: In 2021, the average power outage time of Yichang power grid users is 9.02 h, and the score calculated according to the weight is 10.17 points (full mark 18.52 points).
(3) Environmental protection analysis
1) Distributed power permeability: the distributed power permeability of Yichang power grid in 2021 is 3.55%, with a score of 2.98 points (full mark 8.4 points) calculated based on weights;
2) Percentage of installed renewable energy: the percentage of installed renewable energy in Yichang power grid in 2021 will be 80%, with a score of 3.98 points (full mark 4.975 points) calculated based on weights;
3) Proportion of renewable energy in power generation: the proportion of renewable energy in power generation of Yichang power grid in 2021 will be 80%, with a score of 4.06 points (full mark 5.075 points) calculated according to the weight.
(4) Interactive analysis
1) Power distribution information collection rate: the power distribution information collection rate of Yichang power grid in 2021 is 100%, with a score of 5.1 points (full mark 5.1 points) calculated based on weights;
2) Effective coverage rate of power distribution automation: the effective coverage rate of power distribution automation of Yichang power grid in 2011 is 39.35%, and the score calculated based on weight is 2.41 points (full amrk 6.125 points);
3) Smart meter coverage rate: The coverage rate of smart meters in Yichang power grid will be 100% in 2021. The score calculated based on weights is 4.275 points (full mark 4.275 point).
Similarly, from four aspects of distribution network economy, reliability, environmental protection and interaction, the planning data of Yichang power distribution network in 2025 are comprehensively scored, and the specific work is as follows.
(1) Economic analysis
1) Investment cost: The investment cost of Yichang Power grid in 2025 is 1,400 million yuan, and the score calculated according to the weight is 10.89 points (full mark 13.61 points);
2) Comprehensive line loss rate: the comprehensive line loss rate of Yichang power grid is 3.4% in 2025, and the score calculated according to the weight is 6.68 points (full mark 8.35 points);
3) Electric power increasing by unit investment: electric power increasing by unit investment of Yichang Power grid is 16000 (kWh/ten thousand yuan) in 2025, and the score calculated according to the weight is 6.15 points (full mark 7.69 points).
(2) Reliability analysis
1) Total pass rate: In 2025, the total pass rate of Yichang Power grid is 75%, and the score calculated based on weight is 7.53 points (full mark 10.04 points);
2) Total main transformer overload rate: In 2025, the total main transformer overload rate of Yichang power grid is 0%, the score calculated according to the weight is 7.84 points (full mark 7.84 points);
3) Average user outage time: In 2021, the average power outage time of Yichang power grid users is 5.26 h, and the score calculated according to the weight is 13.65 points (full mark 18.52 points).
(3) Environmental protection analysis
1) Distributed power permeability: the distributed power permeability of Yichang power grid in 2025 is 7%, with a score of 3.48 points (full mark 8.4 points) calculated based on weights;
2)Percentage of installed renewable energy: the percentage of installed renewable energy in Yichang power grid in 2025 will be 80%, with a score of 3.98 points (full mark 4.975 points) calculated based on weights;
3)Proportion of renewable energy in power generation: the proportion of renewable energy in power generation of Yichang power grid in 2025 will be 82%, with a score of 4.16 points (full mark 5.075 points) calculated according to the weight.
(4) Interactive analysis
1) Power distribution information collection rate: the power distribution information collection rate of Yichang power grid in 2025 is 100%, with a score of 5.1 points (full mark 5.1 points) calculated based on weights;
2) Effective coverage rate of power distribution automation: the effective coverage rate of power distribution automation of Yichang power grid in 2011 is 100%, and the score calculated based on weight is 6.125 points (full amrk 6.125 points);
3) Smart meter coverage rate: The coverage rate of smart meters in Yichang power grid will be 100% in 2025. The score calculated based on weights is 4.275 points (full mark 4.275 point).
Conclusion
In this paper, a comprehensive weight assignment method based on AHP-entropy weight method is proposed for future distribution network system. According to the simulation example, after comparing the actual data in 2021 with the planned data in 2025, the conclusions are as follows:
Following the implementation of the evaluation system in Yichang, the comprehensive evaluation results can clearly reflect the overall development level of the future distribution network in Yichang, and are essentially consistent with Yichang’s economic and social positioning, which verifies the feasibility and rationality of the comprehensive evaluation system and evaluation method proposed in this paper.
1) In terms of economy, the power grid investment in 2021 is excessive, resulting in a low value of increased power per unit investment, and a high comprehensive line loss rate due to the influence of the management system, resulting in a negative economic score.
2) In terms of reliability in 2021, the line with heavy load is not properly distributed and the load rate of the line is not balanced. A low total pass rate is caused by an invalid connection and a high line load rate. Meanwhile, the average power outage time of users is long, resulting in a low final reliability score.
3) In 2021, The poor score of distributed power permeability owing to the little amount of distributed power is the key element impacting the environmental protection score.
4) In 2021, The main element effecting the score of interactive index is that at least two “three-remote” switches are configured on the main line, as well as a low number of 10 kV lines with at least three sections, resulting in a low effective coverage rate of distribution automation.
In this paper, only a few representative indicators are selected in the selection of indicators, and more indicators can be selected for subsequent calculation to make the evaluation system more complete and scientific. In the present and the future integrated energy system is the development trend of future energy field, with the emergence of integrated energy system, various forms of energy can replace, mutual transformation and ensure the operation of power system great changes have taken place, its running state will be more complex, not only at this time to study distribution network from the distribution network more extended to evaluate the whole integrated energy system.
Data availability statement
The original contributions presented in the study are included in the article/supplementary material further inquiries can be directed to the corresponding author.
Author contributions
ZL: Conceptualization, Software, Investigation, Formal Analysis, Writing—Original Draft; QX: Data Curation, Methodology, Writing—Original Draft; LuD: Visualization; HW: Visualization; LiD: Investigation; CW: Investigation; YZ: Supervision; XZ: Supervision; CY: Visualization; CX: Writing—Review and Editing; SQ: Writing—Review and; Editing.
Conflict of interest
The authors declare that the research was conducted in the absence of any commercial or financial relationships that could be construed as a potential conflict of interest.
Publisher’s note
All claims expressed in this article are solely those of the authors and do not necessarily represent those of their affiliated organizations, or those of the publisher, the editors and the reviewers. Any product that may be evaluated in this article, or claim that may be made by its manufacturer, is not guaranteed or endorsed by the publisher.
References
Boutaba, R., Salahuddin, M. A., Limam, N., Ayoubi, S., Shahriar, N., Estrada-Solano, F., et al. (2018). A comprehensive survey on machine learning for networking: Evolution, applications and research opportunities. J. Internet Serv. Appl. 9 (1), 16–99. doi:10.1186/s13174-018-0087-2
Chen, B., Liao, Q., Liu, D., and Wang, W. (2018). Comprehensive evaluation indices and methods for regional integrated energy system. Automation Electr. Power 42 (4), 174–182. doi:10.7500/AEPS20170605005
Dong, F., Zhang, Y., and Shang, M. (2016). Research on multi-index comprehensive evaluation of distributed energy system [J]. Proc. CSEE 36 (12), 3214–3223. doi:10.13334/j.0258-8013.pcsee.152536
Guo, Y., and Xiang, Y. (2022). Low-carbon strategic planning of integrated energy systems. Front. Energy Res. 10, 858119. doi:10.3389/fenrg.2022.858119
He, Y., Chen, Y., Yang, Z., He, H., and Liu, L. (2018). A review on the influence of intelligent power consumption technologies on the utilization rate of distribution network equipment. Prot. Control Mod. Power Syst. 3, 18. doi:10.1186/s41601-018-0092-2
Huang, W., Zhang, N., Kang, C., Li, M., and Huo, M. (2019). From demand response to integrated demand response: Review and prospect of research and application. Prot. Control Mod. Power Syst. 4, 12. doi:10.1186/s41601-019-0126-4
Li, H., Deng, J., Yuan, S., Feng, P., and Arachchige, D. D. (2021a). Monitoring and identifying wind turbine generator bearing faults using deep belief network and EWMA control charts. Front. Energy Res. 9, 770. doi:10.3389/fenrg.2021.799039
Li, H., Deng, J., Feng, P., Pu, C., Arachchige, D. D., and Cheng, Q. (2021b). Short-term nacelle orientation forecasting using bilinear transformation and ICEEMDAN framework. Front. Energy Res. 697. doi:10.3389/fenrg.2021.780928
Li, H. (2022a). Short-term wind power prediction via spatial temporal analysis and deep residual networks. Front. Energy Res. 10, 920407. doi:10.3389/fenrg.2022.920407
Li, H. (2022b). SCADA data based wind power interval prediction using LUBE-based deep residual networks. Front. Energy Res. 10, 920837. doi:10.3389/fenrg.2022.920837
Liu, K., Sheng, W., Zhang, D., Jia, D., Hu, L., and He, K. (2015). Research on application requirements and scenario analysis of big data in smart distribution network. Proc. CSEE 35 (02), 287–293. doi:10.13334/j.0258-8013.pcsee.2015.02.004
Ma, W., Deng, W., Pei, W., Yang, H., Wang, Y., Wang, L., et al. (2022). Operation optimization of electric power - hot water - steam integrated energy system. Energy Rep. 8 (S5), 475–482. doi:10.1016/j.egyr.2022.02.218
Tian, L., Cheng, L., Li, R., Sun, S., Shi, C., and Gao, W. (2019). A multi-scenario energy efficiency evaluation method for the integrated energy system in the park based on a weighted directed graph. Proc. CSEE 39 (22), 6471–6483. doi:10.13334/j.0258-8013.pcsee.181552
Wang, J., Ji, Z., Shi, M., Huang, F., Zhu, C., and Zhang, D. (2015). Research on demand analysis and application of big data for intelligent power distribution. Proc. CSEE 35 (08), 1829–1836. doi:10.13334/j.0258-8013.pcsee.2015.08.001
Wei, X., Yu, K., Chen, X., Yan, Y., Zhang, S., Jing, W., et al. (2018). Analysis of power large user segmentation based on Affinity propagation and K-means algorithm. Power Demand Side Manag. 20 (01), 15–19. doi:10.3969/j.issn.1009-1831.2018.01.005
Xiong, J., Sun, Y., Wang, J., Li, Z., Xu, Z., and Zhai, S. (2022). Multi-stage equipment optimal configuration of park-level integrated energy system considering flexible loads. Int. J. Electr. Power Energy Syst. 140, 108050. doi:10.1016/j.ijepes.2022.108050
Yang, N., Qin, T., Wu, L., Huang, Y., Huang, Y., Xing, C., et al. (2021a). A multi-agent game based joint planning approach for electricity-gas integrated energy systems considering wind power uncertainty. Electr. Power Syst. Res. 204, 107673. doi:10.1016/j.epsr.2021.107673
Yang, N., Dong, Z., Wu, L., et al. (2021b). A comprehensive review of security-constrained unit commitment. J. Mod. Power Syst. Clean Energy 10 (3), 562–576. doi:10.35833/MPCE.2021.000255
Yang, N., Yang, C., Xing, C., Ye, D., Jia, J., Chen, Y. W., et al. (2021c). Deep learning based SCUC decision-making: An intelligent data-driven approach with selflearning capabilities. IET Generation Trans. Dist. 16, 629–640. doi:10.1049/gtd2.12315
Yang, N., Yang, C., Wu, L., Shen, X., Jia, J., Li, Z., et al. (2022a). Intelligent data-driven decision-making method for dynamic multi-sequence: An E-Seq2Seq based SCUC expert system. IEEE Trans. Ind. Inf. 18, 3126–3137. doi:10.1109/TII.2021.3107406
Yang, N., He, Y., Dong, B., Qin, T., Ding, L., Yang, X., et al. (2022b). A multi-agent game-based incremental distribution network source–load–storage collaborative planning method considering uncertainties. Front. Energy Res. 10, 803716. doi:10.3389/fenrg.2022.803716
Yu, X., Xu, X., Chen, S., and Wu, J. (2016). A brief review to integrated energy system and energy internet. Trans. China Electrotech. Soc. 31 (01), 1–13. doi:10.19595/j.cnki.1000-6753.tces.2016.01.002
Zeng, M., Liu, Y., Zhou, P., et al. (2018). Review and prospects of integrated energy system modeling and benefit evaluation. Power Syst. Technol. 42 (6), 1697–1708. doi:10.13335/j.1000-3673.pst.2018.0150
Zhang, S., and Lv, S. (2018). Comprehensive energy system evaluation method for park microgrid. Power Syst. Technol. 42 (08), 2431–2439. doi:10.13335/j.1000-3673.pst.2018.0693
Zhang, T., Zhu, T., Gao, N., and Wu, Z. (2015). Research on optimal design and multi-index comprehensive evaluation method of distributed cooling, heating and power energy system [J]. Proc. CSEE 35 (14), 3706–3713. doi:10.13334/j.0258-8013.pcsee.2015.14.027
Keywords: future distribution, smart grid planning and construction, overview, a method combining subjective and objective weighting methods, AHP-entropy weight method
Citation: Liu Z, Xie Q, Dai L, Wang H, Deng L, Wang C, Zhang Y, Zhou X, Yang C, Xiang C and Qin S (2022) Research on comprehensive evaluation method of distribution network based on AHP-entropy weighting method. Front. Energy Res. 10:975462. doi: 10.3389/fenrg.2022.975462
Received: 22 June 2022; Accepted: 20 July 2022;
Published: 23 August 2022.
Edited by:
Tinghui Ouyang, National Institute of Advanced Industrial Science and Technology (AIST), JapanCopyright © 2022 Liu, Xie, Dai, Wang, Deng, Wang, Zhang, Zhou, Yang, Xiang and Qin. This is an open-access article distributed under the terms of the Creative Commons Attribution License (CC BY). The use, distribution or reproduction in other forums is permitted, provided the original author(s) and the copyright owner(s) are credited and that the original publication in this journal is cited, in accordance with accepted academic practice. No use, distribution or reproduction is permitted which does not comply with these terms.
*Correspondence: QiongYao Xie, NDU2NTkxOUBxcS5jb20=