 Qinwei Duan1
 Xiangyang Su
- 1Electric Power Dispatching Control Center of Guangdong Power Grid Co, Ltd, Guangzhou, China
- 2Beijing Tsintergy Technology Co, Ltd, Guangzhou Branch, Guangzhou, China
With the advancement of China’s carbon policy, the proportion of renewable energy, mainly wind and solar, has increased, which brings greater challenges to the reservation of power systems. Due to the complexity of China’s power systems, adopting the method of the zonal reserve to ensure stable system operation is very difficult. Among the existing clearing results for calculating reservation, the unit reservation will be restricted by the network security constraints, leading to system operation risks. To obtain the unit reservations efficiently without breaking the security constraints, this paper proposes an effective reserve calculation method for engineering implementation. A box robust optimization is further utilized for Security Constrained Unit Commitment in the method to ensure the consumption of renewable energy, and the stability and clearing efficiency of the power system. Furthermore, a data-driven robust random optimization is employed for Security Constrained Economic Dispatch optimizing the economy of power systems. This multi-stage robust optimization model, which has good extensibility, is in line with China’s clearing process. The simulation analysis based on the actual operation data of a province in China and the IEEE 300-bus system verifies the correctness and feasibility of the proposed model and theory.
1 Introduction
With the promotion of China’s policy and the task of carbon peaking and carbon neutralization and the continuous promotion of power system reform (Lu et al., 2022), the development of clean and renewable energy is imperative (Farhani, 2015), and its access proportion in the power system will gradually rise. Although renewable energy such as wind and solar energy is environmentally friendly, the volatility and randomness of output lead to the phenomenon of abandoning wind power and photovoltaic power to ensure the safe operation of the system when the electricity market is cleared. To cope with the challenges brought by the large-scale access of renewable energy to the safe and stable operation of China’s power system, more system operation reserves need to be reserved in the power system dispatching optimization. Therefore, it is of great significance to put forward a set of reasonable reserve calculation methods based on absorbing renewable energy as much as possible.
The positive and reserve capacity of the unit is usually determined by the unit capacity and the current output of the unit. However, in actual operation, if the positive and reserve capacity of the unit is called, it may cause an overload of the relevant transmission lines, and this part of the reserve is usually considered an invalid reserve. To solve this problem, the common method is to determine the reserve demand by using the method of partition reserve (Ma et al., 2007; Ahmadi-Khatir et al., 2013; Zhou, 2017) but the method of partition reserve is only limited to the case where the power supply and load distribution are relatively concentrated. The network structure of China’s power system is complex, and the resources are scattered. It is difficult to ensure the safe and stable operation of the power system through zoning (Wenhuan, 2022) analyzes the existing engineering reserve deduction methods and puts forward a reserve evaluation algorithm, but it still fails to solve the problem of limited reserve in essence.
On the other hand, there are two main methods to deal with the uncertainty of renewable energy in power systems, robust optimization (Ben-Tal and Nemirovski, 1998; Bertsimas and Sim, 2004; Bertsimas et al., 2013) and stochastic optimization (Papavasiliou et al., 2011; Sahin et al., 2013; Ramezanzade et al., 2018; Zhao and Guan, 2018; Zhao, 2021). Stochastic optimization depends on the probability information of renewable energy output. Robust optimization only needs to describe the uncertainty interval of renewable energy output. Although the mathematical model of stochastic optimization is simple, it needs many calculations and is difficult to accurately obtain the probability information of renewable energy output. Although robust optimization has better robustness, it is difficult to convert the model. Different uncertainty sets have different robust equations (Ben-Tal, Ghaoui, Nemirovski), and it is difficult to solve the model. Some scholars proposed to combine robust optimization with stochastic optimization (Su, 2018; Xu et al., 2018; Su, 2019; Zhu et al., 2019), but the transformation theory of such models is often difficult to apply to SCUC problems. (Bertsimas et al., 2013). proposed a two-stage robust optimization problem for SCUC called Benders Decomposition to solve the model, but the convergence and solution speed of the model is difficult to guarantee.
Based on the clearing process of China’s electricity market, this paper adopts different optimization models at different stages to ensure the economy and security of the power system. The highlights of the article are as follows:
1. In the SCUC and SCED models, the operation reserve variables of the unit are introduced, and the operating reserve of the unit can be accurately obtained.
2. Generation shift distribution factor (GSDF) is used to construct network security constraints. In this way, the binary variables generated when the unit operation reserve variable is coupled with the network security constraint can be avoided. The modeling methods in extreme and conventional scenarios are given.
3. According to the clearing process of China’s electricity market, a multi-stage robust optimization model for promoting energy consumption is proposed, which effectively avoids the disadvantage that the decomposition algorithm cannot converge, and takes into account the efficiency, economy, and security of the model.
The rest of this article is organized as follows: In section 2, the model of effective reserve calculation in the electricity market is proposed. In section 3, the multi-stage robust optimization model is proposed. In section 4, the parity of the multi-stage robust optimization model is given. Section 5 is numerical simulation. The conclusion is given in section 6.
2 SCUC model for modeling effective reserve of unit
2.1 SCUC model
The objective function of day-ahead electricity market clearing SCUC is to minimize the system operation cost:
The objective function 1) represents the minimum generation cost of the power system. Where
2.2 Modeling considering effective reserve variables of units
At present, the calculation formula for the positive reserve of the power system is (3), but the section of the unit may be out of limit due to the provision of the reserve, that is:
Where
When the unit is shut down, the reserve cannot be provided, so
In addition, the upper limit constraint of
Considering the constraints (12) (13), there is
If considering the startup and shutdown curve of the unit, the unit cannot provide reserve during startup and shutdown, the formula should be modified as follows:
2.3 Coupling constraints of unit effective reserve and network security constraints
To ensure that the reserve of the unit associated with the section out of limit is 0, it is usually necessary to introduce the if-then constraint. However, for the linearization of logical constraints, binary variables of
When the positive/negative section exceeds the limit, the corresponding units with positive/negative sensitivity cannot provide the corresponding reserve at this time. Therefore, it has the following forms:
(17) needs to be linearized as follows:
When considering the reserve network security constraints, the units with positive sensitivity and the units with negative sensitivity are added respectively. Use the following formula:
Where
When considering the reserve network security constraints of the above formula, the reserve variables associated with the positive and negative reach bounds of the section will only aggravate the forward or negative power flow of the current section. Therefore, there is no need to add the original network security constraints (10) in this case.
In the above formula 19 (20), the influence components of standby variables above the forward and reverse thresholds on section power flow are added respectively, which will reduce the feasible region of the model to a certain extent. If the influence of correlation between reserve variables is considered, the following conditions may occur when the units higher than the positive sensitivity threshold and the units with negative sensitivity threshold are adjusted at the same time:
At this time, the network security constraint of the system needs to be rewritten into the following form:
The influence component of reserve on section power flow can be any value, which can make the section out of limit no longer without considering the reserve variables. In this situation, the original network security constraint (10) needs to be added.
3 Modeling of effective reserve considering renewable energy uncertainty
3.1 SCUC model of box uncertainty set
Because the model of SCUC is complex and contains many binary variables, it is difficult to solve the model. In the SCUC stage, the box robust optimization is adopted to consider the uncertainty of renewable energy and ensure the solution efficiency of the model. 5) is rewritten as follows:
where NE represents the renewable energy unit set,
The uncertainty of renewable energy is limited to the box uncertainty set as follows:
where
3.2 SCED model of the robust stochastic optimization model
In the SCED stage, the model is a linear programming (LP) problem, and the efficiency of solving the model is no longer concerned. Therefore, more refined robust stochastic optimization (RSO) can be considered in this stage.
After considering the stochastic, the model becomes as follows:
where
where
In the existing scheduling systems, it is difficult to obtain accurate probability distribution, but it is relatively easy to obtain typical scenarios. Therefore, the data-driven robust stochastic optimization based on data scenarios has better application scenarios.
Here, the method of extending typical scenes to related scenes is used to construct scene sets, as follows:
where
4 Model reconstruction
In the stage of SCUC and SCED, the model cannot be solved directly because the uncertainty variables are considered in the model, so it is necessary to make a reformulation to the model.
4.1 Model reformulation of SCUC
Formulas 25, 26 respectively describe the unit output and box uncertainty set under the renewable energy output uncertainty, To convert it to a solvable form, the display filter is used for conversion, as follows (Bai et al., 2016):
where
p* is one norm. If the influence of
15) and 16) comes as follows:
Now, the robust model of the SCUC stage is transformed into a mixed-integer linear programming (MILP) model. So far, this paper proposes a robust optimization SCUC model ((1)–(2), (4), (6)–(9) (12) (34) (35)/(36)) in multiple scenarios. When binary variables are introduced 18) need to be added; Without introducing binary variables (19)–(20) need to be added in extreme scenarios, and (10) 24) in non-extreme scenarios.
4.2 Model reformulation of SCED
The biggest difference between the SCED model and the SCUC model is that there is an expectation in the objective function of the SCED model, and the expectation function needs to be linearized. Here, the dual theory is used for linearization.
The following transformation theory is given (Su et al., 2019; Chen et al., 2022):
where
In the SCED stage, the start and stop of the unit have been determined, so the cost of this part is constant. The objective function is as follows:
In the SCED stage, considering the influence of ambiguity sets, the objective function becomes the following form:
In the SCED stage, the section is usually adjusted to the state of not exceeding the limit, that is, the SL variables are 0. To solve it, need to transform the expectation into a linearly solvable form.
Therefore, the SCED model can be reformulated as follows:
Now, the model reconstruction of SCUC and SCED has been completed. The model can be solved directly by calling the solver.
The clearing process of the electricity market after considering the uncertainty set is shown in Figure 1 and the following process:
Step 1: Solution of the SCUC model considering the box uncertainty set and effective reserve modeling. Determine the startup and shutdown state of the unit.
Step 2: According to the typical scenario of renewable energy output. Constructing uncertainty sets of event expressions.
Step 3: Adjust the boundary data cleared by the power system, the planned output of the unit and tie line, etc.
Step 4: Calculate the RSO-SCED model. Determine whether the calculation result satisfies the standard issued by the scheduling agency, if not, go back to step 2, if so, publish the result.
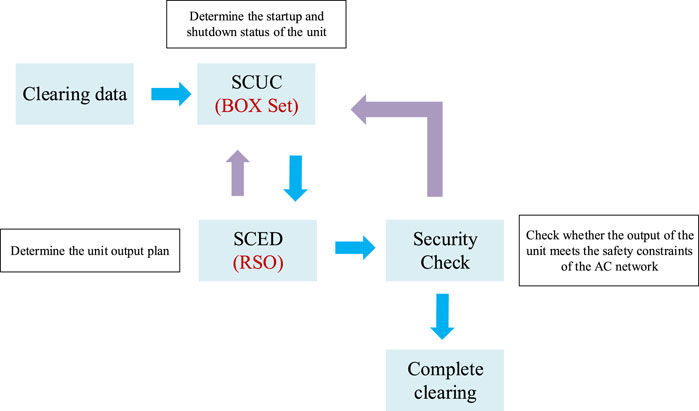
FIGURE 1. Day-ahead electricity market clearing process.
5 Numerical simulation
In this section, the simulation analysis is based on the IEEE 300-bus system and the actual operation data of a province in China. All simulation analysis is based on MATLAB or C++. All simulation analyses were performed on a laptop. Processor model: i7-8565u, 1.8GHz, 16 g memory.
To test the engineering application value of effective reserve modeling, the test is carried out in C++ based on the actual electricity market operation data. Due to the lack of data on typical daily operation scenarios of renewable energy in the actual operation data, the simulation analysis for multi-stage robust optimization is carried out based on MATLAB with the IEEE 300-bus system, and the typical daily operation scenarios of renewable energy are generated by the Monte Carlo method. In the IEEE 300-bus system, Renewable energy is connected at nodes 10, 30, 52, 57, 68, 81, 169, 175, 194, 265, and 271 with each capacity of 80 MW.
5.1 Comparative analysis of effective reserve calculation models
PRSCUC is used to represent the SCUC model after considering the modeling (19) (20) of reserve variables, BSCUC represents a model that calculates the effective reserve by introducing binary variables (18), and sPRSCUC is used to represent the SCUC model after slack the feasible region (22) (10), the SCUC model after the reserve variables can affect each other. SCED uses the same naming logic in Figure 2.
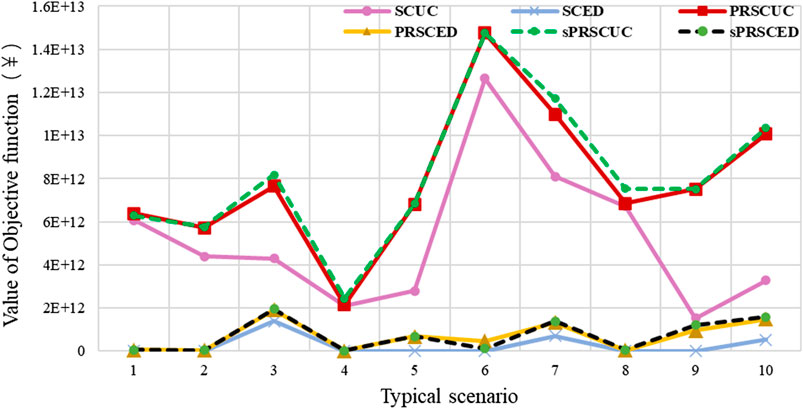
FIGURE 2. Comparison value of objective functions of different models under different typical scenarios.
Where * means that the model can find a feasible solution in 1800s. As can be seen from Table 1, The BSCUC model with binary variables will impose a great burden on the calculation efficiency, and often the model cannot be solved normally. In actual operation, this situation is not allowed. PRSCUC and sPRSCUC models will make the model speed longer, such as scenario 1, scenario 4, and scenario 8. However, there are also cases where the model solving speed is significantly improved, such as scenario seven This phenomenon is caused by the introduction of new continuous variables, which increases the relevant constraints of the SCUC model and reduces the feasible region. The solver may spend more time and find the optimal solution faster when using branch and bound to solve MILP problems. However, the order of magnitude of the model solution time has not changed, and it belongs to an acceptable fluctuation range from the perspective of engineering applications.
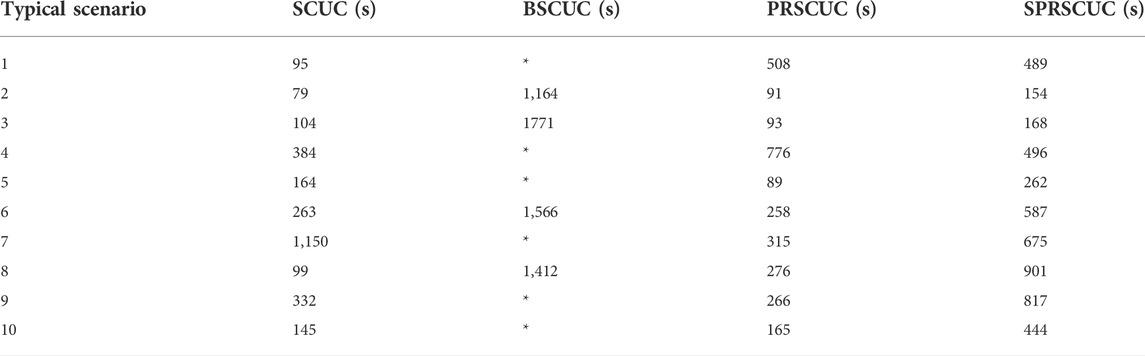
TABLE 1. Comparison results of calculation time of different models under different typical scenarios.
Figure 2 shows the changes in objective function values of several models in different scenarios. In the SCUC stage, because the slack penalty factor of network security constraints in the objective function value is large, the objective function values of the three models are quite different. In the SCED stage, the slack penalty factor of network security constraints is small, and the difference between the objective function values of different models is not obvious. But in general, the objective function values of the SPR. model and PR. model are higher than those of the original model. This is because the refinement considers the effective reserve value of each unit and the feasible region of the SPR. model and PR. model is smaller than that of the original model, so the objective function value is on the high side as a whole. In scenarios 1, 4, and 8, the difference between the optimization objective functions of the three models is very small, in these scenarios, there is less power load, the transmission pressure of the power grid is small, and most of the transmission lines are in the light load state.
Table 2 shows the efficiency of the system under different models, and the specific calculation formula is 1. Both PRSCUC and SPRSCUC models have high efficiency. Among them, it is worth noting that in scenario 6, in which the system load is high and the transmission lines are generally overloaded, so it is difficult to provide sufficient effective reserve. After reducing the feasible region, the refined modeling part can only provide 71% of the effective reserve. However, considering the cooperation between units, the PRSCUC model can satisfy almost all scenarios.
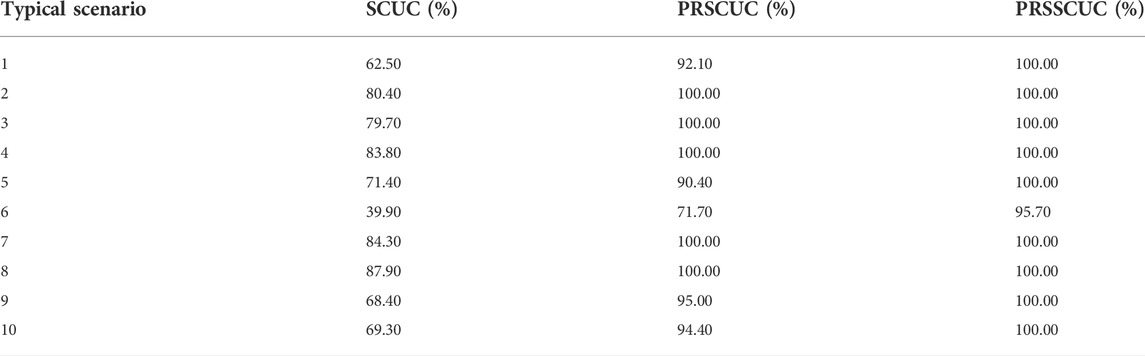
TABLE 2. Comparison of effective reserve of different models.
5.2 Comparative analysis of multi-stage robust optimization and conventional robust optimization
To verify the influence of several robust optimizations on the clearing model, a comparative analysis is carried out based on IEEE300. CM represents the clearing model, and PCM represents the clearing model that considers the uncertainty of renewable energy output to improve the reserve demand. ROCM represents the clearing model under box robust optimization. RSOCM indicates that box type robust optimization is adopted in the SCUC stage and the RSO clearing model is adopted in the SCED stage. The reserve demand is 10% of the system load. Considering the extreme scenario that all renewable energy sources are unable to provide output in PCM, the reserve demand increases the total capacity of renewable energy output based on the original demand. The distance parameter
As shown in Figure 3, RSOCM approximates from ROCM results to CM results as the number of samples increases. However, when the sample volume is greater than 1,500, the objective function changes slightly, because the uncertainty of 1,500 renewable energy output under the current system has been described as accurately as possible. Although cm has better optimization results, the system has low-risk resistance and poor robustness of clearing results. PCM has the best robustness because it considers the higher reserve demand, but the system economy is poor.
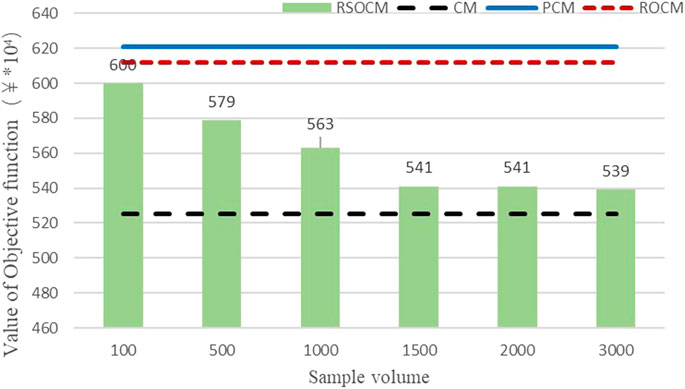
FIGURE 3. Comparison of objective functions of different models under different sample volumes.
Since the differences between the above models are all in the SCED stage, a comparative analysis is made only for the calculation speed of RSOCM and other models in the SCED stage. The details are as follows.
Figure 4 shows the time from modeling to the solution of different models. Since the model itself is small and LP problem, the modeling time is considered. Except for the RSOCM model, the solution time of other models is very close, about 1.25s. The RSOCM model takes longer to calculate, but the overall magnitude does not change.
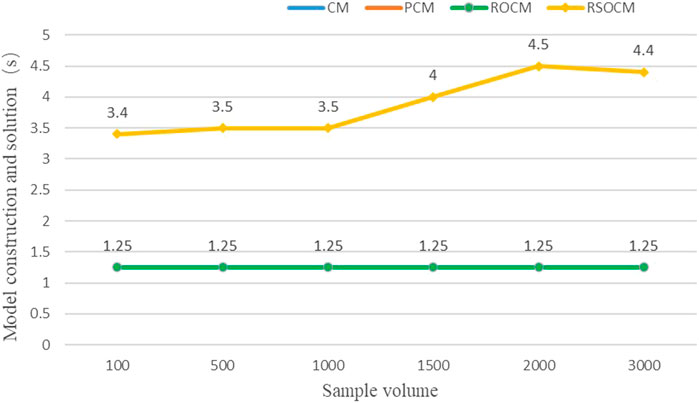
FIGURE 4. Comparison of calculation time of different models under different sample volumes.
5.3 Comparative analysis of different models under different renewable energy penetration rates
With the development of the power system, the proportion of renewable energy access will gradually increase. Here, simulation analysis is made for the power system under different renewable energy penetration rates, as follows:
Figure 5 shows the changes in objective functions of several models with the increasing penetration of clean energy. As can be seen from the figure, since the cost of clean energy is much lower than that of conventional units, the objective function value of the CM model is declining. After considering the impact of the reserve, the objective function value of the PCM model is improved. The optimization result of PCM is similar to that of ROCM, but the difference is small. In addition, with the increase of renewable energy permeability, the value of the objective function of the RSOCM model decreases slowly. It is proved that the RSOCM model performs well when clean energy has a high penetration rate.
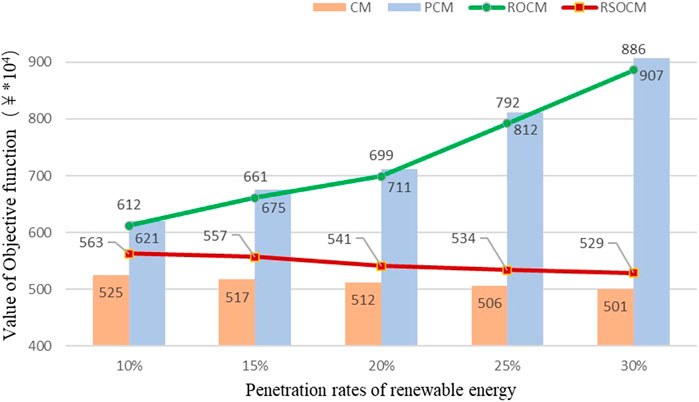
FIGURE 5. Comparison of objective functions of different models under different renewable energy penetration rates.
6 Conclusion
In this paper, a calculation method of system effective reserve is proposed and embedded into the robust optimization model of SCUC and SCED. Different robust optimization methods are adopted in SCUC and SCED respectively to ensure the security and economy of the power system while the solving efficiency requirement is met. The effectiveness of the proposed model is verified by an actual operation case and the IEEE 300-node case. The simulation analysis, it shows that the proposed model considering reserve calculation can well ensure the safe operation of the power system. The proposed multi-stage robust optimization model matches the existing clearing process of the electricity market, and the model has good extensibility. In the future, the uncertainty set in different stages can be changed based on the needs of the operating entity to ensure the economy and security of the system operation.
Data availability statement
The data presented in the study are deposited in the Matpower repository, accession number https://github.com/MATPOWER/matpower/tree/master/data.
Author contributions
QD is responsible for writing the whole article and model derivation. ZC is responsible for technical guidance. XT, XX and HC are responsible for the layout adjustment and code debugging of the article. XS is responsible for the overall idea of the article.
Conflict of interest
Authors QD, ZC, XT, XX, HC and XS were employed by Electric Power Dispatching Control Center of Guangdong Power Grid Co, Ltd and Beijing Tsintergy Technology Co, Ltd
The author declares that this research was funded by key scientific and technological projects of Guangdong Power Grid Corporation 036000KK52210008 (GDKJXM20200713). The funders participated in the following research: research design, collection, analysis and writing.
Publisher’s note
All claims expressed in this article are solely those of the authors and do not necessarily represent those of their affiliated organizations, or those of the publisher, the editors and the reviewers. Any product that may be evaluated in this article, or claim that may be made by its manufacturer, is not guaranteed or endorsed by the publisher.
References
Ahmadi-Khatir, A., Bozorg, M., and Cherkaoui, R. (2013). Probabilistic spinning reserve provision model in multi-control zone power system. IEEE Trans. Power Syst. 28, 2819–2829. doi:10.1109/tpwrs.2013.2243923
Bai, X., Qu, L., and Qiao, W. (2016). Robust AC optimal power flow for power networks with wind power generation. IEEE Trans. Power Syst. 31 (5), 4163–4164. doi:10.1109/tpwrs.2015.2493778
Ben-Tal, A., Ghaoui, L. E., and Nemirovski, A. Robust optimization. princeton university press princeton nj.
Ben-Tal, A., and Nemirovski, A. (1998). Robust convex optimization. Math. OR. 23 (4), 769–805. doi:10.1287/moor.23.4.769
Bertsimas, D., Litvinov, E., Sun, X. A., Zhao, J., and Zheng, T. (2013). Adaptive robust optimization for the security constrained unit commitment problem. IEEE Trans. Power Syst. 28 (1), 52–63. doi:10.1109/tpwrs.2012.2205021
Bertsimas, D., and Sim, M. (2004). The price of robustness. Operations Res. 52, 35–53. doi:10.1287/opre.1030.0065
Chen, Z., Melvyn, S., and Xiong, P. (2022). Optimization online. Robust stochastic optimization made easy with RSOME. Available: http://www.optimization-online.org/DB_FILE/2017/06/6055.pdf.
Farhani, S. (2015). Renewable energy consumption, economic growth and CO2 emissions: Evidence from selected MENA countries. Work. Pap.
Lu, T., Zhang, W., Wang, Y., Xie, H., and Ding, X. (2022). Medium- and long-term trading strategies for large electricity retailers in China's electricity market. Energies 15, 3342. doi:10.3390/en15093342
Ma, X., Sun, D., and Cheung, K. (2007). Energy and reserve dispatch in a multi-zone electricity market. IEEE Trans. Power Syst. 14 (3), 913–919. doi:10.1109/59.780903
Papavasiliou, A., Oren, S. S., and O'Neill, R. P. (2011). Reserve requirements for wind power integration: A scenario-based stochastic programming framework. IEEE Trans. Power Syst. 26 (4), 2197–2206. doi:10.1109/tpwrs.2011.2121095
Ramezanzade, M., Jafari-Nokandi, M., and Barforoshi, T. (2018). Scheduling of generation and reserve of thermal generation resources considering load and wind uncertainty in presence of energy storage and demand response. Tehran, Iran: Faculty of Electrical & Computer Engineering.2
Sahin, C., Shahidehpour, M., and Erkmen, I. (2013). Allocation of hourly reserve versus demand response for security-constrained scheduling of stochastic wind energy. IEEE Trans. Sustain. Energy 4 (1), 219–228. doi:10.1109/tste.2012.2213849
Su, X. (2018). “A novel data-driven robust method applied to OPF with uncertain wind power,” in 2018 2nd IEEE conference on energy internet and energy system integration (EI2), 1–5.
Su, X., Bai, X., Liu, C., Zhu, R., and Wei, C. (2019). Research on robust stochastic dynamic economic dispatch model considering the uncertainty of wind power. IEEE Access 7 ({}), 147453–147461. doi:10.1109/access.2019.2946460
Su, X. (2019). “Data-driven robust dispatch of integrated electricity-gas energy systems considering uncertainty of wind power,” in 2019 IEEE power & energy society general meeting (PESGM), 1–5.
Wenhuan, H. (2022). Research on deduction algorithm for limited power system reserve capacity network. Electr. Eng. (09), 12–14.
Xu, H., Liu, Y., and Sun, H. (2018). Distributionally robust optimization with matrix moment constraints: Lagrange duality and cutting plane methods. Math. Program. 169 (2), 489–529. doi:10.1007/s10107-017-1143-6
Zhao, C., and Guan, Y. (2018). Data-driven risk-averse stochastic optimization with Wasserstein metric. Operations Res. Lett. 46 (2), 262–267. doi:10.1016/j.orl.2018.01.011
Zhao, D., X. (2021). Statistical measure for risk-seeking stochastic wind power offering strategies in electricity markets. J. Mod. Power Syst. Clean Energy, 1–6.
Zhou, M. (2017). “Multi-area generation-reserve joint dispatch approach considering wind power cross-regional accommodation,” in Power and energy systems (Beijing, China: CSEE Journal of).
Keywords: reserve capacity, electricity market, SCUC, SCED, renewable energy, robust optimization
Citation: Duan Q, Chao Z, Tang X, Xie X, Chen H and Su X (2022) Multi-stage robust clearing model considering renewable energy output uncertainty and unit effective reserve calculation in electricity market. Front. Energy Res. 10:980125. doi: 10.3389/fenrg.2022.980125
Received: 28 June 2022; Accepted: 11 July 2022;
Published: 27 September 2022.
Edited by:
Dongliang Xiao, South China University of Technology, ChinaReviewed by:
Yang Yuan, Shandong Jiaotong University, ChinaJifeng Chu, Xi’an Jiaotong University, China
Wei Dai, Guangxi University, China
Copyright © 2022 Duan, Chao, Tang, Xie, Chen and Su. This is an open-access article distributed under the terms of the Creative Commons Attribution License (CC BY). The use, distribution or reproduction in other forums is permitted, provided the original author(s) and the copyright owner(s) are credited and that the original publication in this journal is cited, in accordance with accepted academic practice. No use, distribution or reproduction is permitted which does not comply with these terms.
*Correspondence: Xiangyang Su, c3V4aWFuZ3lhbmcwMTJAMTYzLmNvbQ==