 Jizheng Xue
 YouRui Xu2
- 1Tellhow Software Co. Ltd, Xi’an, China
- 2State Grid Qinghai Electric Power Company Haixi Power Supply Company, Qinghai, China
- 3Tellhow Software Co. Ltd, Shanghai, China
The purpose is to study the Carbon Footprint (CF) verification system of power enterprises, promote the Low-Carbon Economy (LCE) in the power industry, and improve resource utilization during Energy Conservation and Emission Reduction (ECER). The Carbon Dioxide Emission (CDE) of power enterprises is explored based on the CF. First, Edge Computing (EC) is adopted to calculate the direct Carbon Dioxide Emission (CDE) of the Chinese power industry from 2005 to 2020 based on energy input. The direct CDE and the changing trend are analyzed. On this basis, Blockchain Technology (BCT) is employed to quantify the indirect CDEs of power enterprises’ energy consumption. A comprehensive analysis is made of the changing trend and circulation of the total CF of power enterprises based on the direct and indirect CDEs. The data show that the proportion of direct and indirect CDEs in total CF gradually decreases and increases. The results show that the power industry should increase the proportion of clean power in the power industry, control the CDEs from the source, and improve energy utilization to optimize the CF verification.
1 Introduction
China’s energy demand has been increasing with the rapid economic development in recent years. Many have realized that China’s dependence on crude oil has exceeded the international warning line. It is now urgent for China to focus on the efficient use of energy, reduce energy consumption, reduce air pollution, and achieve Energy Conservation and Emission Reduction (ECER). Especially since the Reform and opening-up, China’s economy has seen decades of economic boom. However, the cost of resource consumption and environmental destruction is overwhelming. The uncontrolled development and utilization of resources have led to the deterioration of the environment and seriously affected China’s sustainable development (Sonmez et al., 2018). Therefore, the emergence of ECER technology-driven Low-Carbon Economy (LCE) offers a possible development path, targeting greenhouse gas emission reduction. LCE has changed people’s lifestyles and brought structural transformation. It is reshaping the development concepts and becoming a new direction for China’s economic development. Because of the current situation of China’s economic development, there is a need to take corresponding measures to promote LCE’s rapid development vigorously.
In 2007, the term Carbon Footprint (CF) was proposed as one of the key quantitative parameters in the ECER process. CF measures the greenhouse gas emissions in production and consumption, including direct and indirect emissions. Indirect carbon emissions are greenhouse gas emissions from using purchased power or heat. CF is generally divided into personal, product, enterprise, and national urban CF. Of these, personal CF estimates carbon emissions in daily life. The enterprise CF is the sum of the carbon emissions generated by the overall enterprise activities. It includes the carbon emissions from non-production activities to the product CF. The urban CF mainly includes the various greenhouse gas emissions. At present, the exploration of CF in China has just begun without any in-depth achievements, and more industrial practices are urgently needed to promote CF development (Premsankar et al., 2018). The lagging and high regional power grid emission factors will make the carbon emission results of non-emission control enterprises distorted and large. There are potential disadvantages that damage the competitiveness of enterprises. China’s accounting guidelines specify that the regional power grid emission factors published in the latest year should be used to account for indirect electric power emissions. The accounting guidelines are also applicable to non-emission-controlled enterprises. However, the regional power grid emission factors have not been updated. Thus, it is understood that the national, provincial, and pilot carbon-market emission factors are often used for non-emission-controlled enterprises. Adopting the grid emission factor more in line with the actual situation as a supplementary means can play certain positive roles. Nevertheless, doing so will lead to poor comparability of accounting results and great reference difficulty. Hence, it is not conducive to the benchmarking evaluation and decision-making of enterprises, the public, and investors (Wiche et al., 2022). According to the research review in China and overseas, the current indirect Carbon Dioxide Emission (CDE) calculation methods mainly include the input-output method, life cycle method, and Intergovernmental -Panel on Climate Change (IPCC) method (Osorio et al., 2022). Firstly, the input-output method is based on the division of different departments. It cannot reflect the differences in CFs of different products within the department. This leads to a large deviation in the results. At the same time, the CF of specific industries or departments obtained by the input-output method cannot be applied to calculating other products, with a limited applicational range (Schmitt et al., 2022). The life cycle method involves many links in the production process. The data collection is often incomplete, or the data collection is often distributed on multiple links. The final results fail to reflect the CF of the product genuinely. Lastly, although the IPCC method is widely used, it only considers the direct CF within the region and does not consider the indirect CF caused by the linkage between the outside and the inside of the region. Therefore, it has high requirements for the research object and applies to the CF calculation within the closed system.
In this work, the total CF of the power industry is obtained through the direct and indirect emissions of carbon dioxide in the power industry and its change trend. Further, the indirect CDE of power enterprises is quantified using Blockchain Technology (BCT) based on specific data. The trend and cycle of total CF of power enterprises are analyzed from the direct and indirect CDEs. The innovation of this work is to analyze the direct and indirect CDEs and their change trends in the power industry using Edge Computing (EC) and BCT. Consequently, the flow of the total CF of the power industry is obtained. This work aims to provide an important reference for improving energy efficiency and optimizing CF verification of power enterprises. Chapter 1 describes the purpose and background. Chapter 2 analyzes the relevant research on EC and BCT and combines the two to verify the CF. Chapter 3 gives the experimental results. The research results can provide suggestions and references for the follow-up ECER work and the CF verification work of power enterprises. At the same time, it lays a foundation for optimizing the CF verification system of power enterprises from the emission source and breaks down the obstacles that hinder the development of LCE. It is of great significance to Chinese power enterprises’ economic growth and ECER.
2 Materials and method
2.1 Edge computing
Multi-access EC is proposed by European Telecommunication Standards Association (ETSA). It provides computing, storage, and other infrastructure for the Internet of Things (IoT) devices at the network edge close to users. MEC is defined as mobile EC in the narrow sense and multi-access EC in the broad sense. EC supplements the performance of current cloud computing and exerts a more positive impact on the development of the IoT (Li et al., 2021a; Li et al., 2021b).
EC has unique advantages over Cloud Computing. EC performs on widely distributed nodes compared to the centralized nodes of Cloud Computing. EC can provide computing services for the network edge close to the data source, meet the needs of IoT applications, and can give a better solution. It has six basic characteristics: wide distribution, low delay, edge devices-based computing, edge intelligence, secured user privacy, and reduced traffic (Krestinskaya et al., 2019; Li, 2022a; Li, 2022b). Based on this, the edge node must have certain computing ability, network transmission, storage capacity, and compatibility with multiple protocols. The IoT terminal devices interact with the cloud center through the edge nodes in EC. Offline computing of many businesses can be directly implemented on the edge side in an EC ecosystem. There is no need to upload to the cloud, making the business processing faster and more efficient, relieving the traffic pressure, and increasing private data security (Porambage et al., 2018; Yousefpour et al., 2019). Figure 1 displays the system architecture of EC, which consists of three layers: cloud server layer, MEC server layer, and mobile terminal layer from top to bottom.
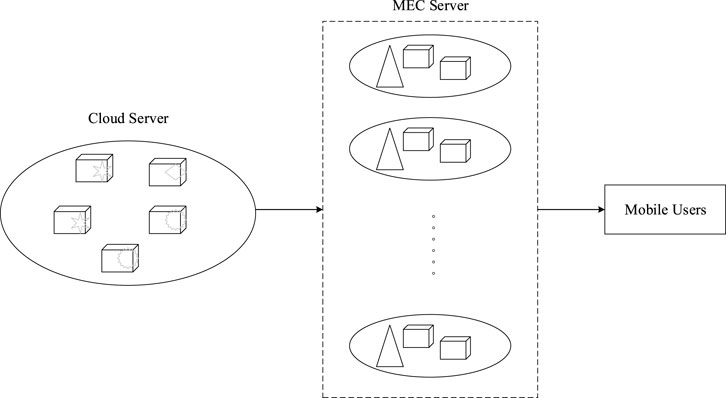
FIGURE 1. MEC system architecture.
EC can shorten the data processing distance and enhance real-time performance. However, the security issues in the data processing and analysis steps still need further research. Meanwhile, with the development of IoT technology, BCT has become a research hotspot in many fields with its strong data security storage capacity. Therefore, further research on BCT is needed.
2.2 Blockchain
BCT is a crucial technological innovation. Its basic structure includes six application, contract, incentive, consensus, network, and data layers. This structure is distributed from top to bottom, reflecting the function allocation from concrete to abstract. Each of these six layers has its function and can cooperate. A reasonable blockchain includes at least these six layers. Figure 2 presents the specific structure. Each layer should be designed according to its functional requirements (Sabella et al., 2019; Sodhro et al., 2019).
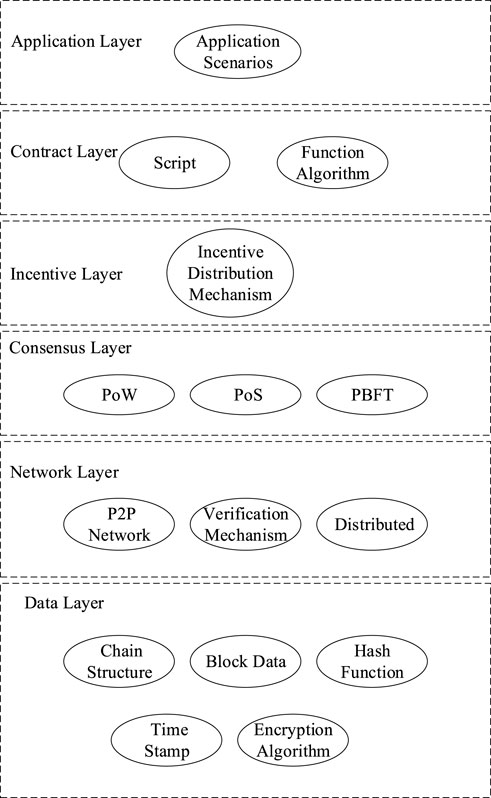
FIGURE 2. Infrastructure of blockchain.
2.2.1 Data layer
The data layer is a physical expression of BCT, the basic and core structure in the whole structure. It is characterized by no-tampering and full backup.
2.2.2 Network layer
The network layer controls the communication of the whole system. It can improve data transmission efficiency in each stage when sending, receiving, and sharing data. The most crucial part of the blockchain network is Point to Point (P2P) transmission, which is adapted to complete a distributed network. Thereby, blockchain is essentially a P2P network structure with an automatic networking mechanism. At each node, information can be received and generated. Any node in the network can maintain the communication between them when the same growing blockchain structure is maintained. Moreover, the network layer also has many functions, such as data dissemination and verification, which are the most basic (Sittón-Candanedo et al., 2019).
2.2.3 Consensus layer
The consensus layer encapsulates a consensus mechanism algorithm on each node to control the authentication and identification of data in P2P mode. Dispersed nodes must reach a consensus through the consensus layer in the decentralized network structure to safeguard data validity. The consensus mechanism guarantees system security and reliability and is one of the core technologies of blockchain structure.
2.2.4 Incentive layer
There are many incentive mechanisms in the incentive layer, and the nodes in each blockchain participate in verifying new blocks.
2.2.5 Smart contract layer
The smart contract layer is the basis for the blockchain to program and de-trust. It systematically specifies the transaction method and specific process, including all kinds of scripts and codes, which can be executed automatically and cannot be tampered with at will.
2.2.6 Application layer
The application layer undertakes the docking with various application scenarios, and the entities in each application scenario will participate in it and formulate the overall rules according to the intelligent contract, making the whole business logic more complete (Roman et al., 2018).
2.3 Carbon footprint verification based on edge computing and blockchain technology
CF verification is a metric of the product life cycle level, a bottom-up carbon accounting system. It is the carbon emission of products or services in the life cycle. For example, the CF of a book considers all carbon emissions generated in the process of paper making, printing, transportation, sales, disposal, and natural decomposition. The British Standards Institute issued the CF calculation standard and elaborated CF’s calculation methods and principles. CF calculation can let consumers know the greenhouse gas emissions during the whole life cycle of commodities and encourage consumers to choose low-carbon commodities. In addition, calculating CF can help manufacturers fully understand the carbon emissions of goods in production, transportation, and consumption. It helps explore improvements to guide the reduction of energy consumption and costs (Ray et al., 2019). In short, it is the total amount of greenhouse gases released by products or services in the life cycle. With the continuous improvement of the international market’s understanding of the product CF, CF verification is a key condition for obtaining orders from multinational companies. CF can be verified through the enterprise CF of the whole company or the product CF, including the complete life cycle of a specific product or service, the supply chain, and pollutant emission control technology (Monrat et al., 2019).
At the same time, the blockchain can be divided into public, private, and alliance chains according to the range distribution of blockchain nodes. The public chain is entirely open to the public, which anyone can directly access without authorization. A private chain is established by an organization and accessible to only specific authorized users. An alliance chain is a mixture of public and private chains visited by users who join the alliance. The public chain has reliability and privacy security problems, and the alliance chain is difficult to deploy due to its large scale. Thus, this work selects a private blockchain with a small scale to record and store relevant event information, such as CF verification of power enterprises. Also, the private blockchain is deployed on the local platform, so the initial blockchain is safe and reliable. EC processes data at the network’s edge or near the data source. According to the research data, the deployed edge node computing and processing capacity can meet the processing requirements of the equipment used for CF verification of power enterprises (Gao et al., 2022). Based on this, this work further analyzes the CF verification of power enterprises by fusing EC and BCT.
2.4 Calculation of total carbon footprint
The CF verification system of power enterprises is studied. The specific calculation method is as follows:
2.4.1 Calculation method of direct carbon dioxide emission
The direct CDE is calculated based on EC by Eq. 1:
In Eq. 1,
2.4.2 Calculation of indirect carbon dioxide emission
Consuming the products or services of other sectors will emit carbon dioxide, which is the indirect CDEs. The carbon emission coefficient should be calculated as follows (Efanov and Roschin, 2018):
a. Calculation of indirect carbon dioxide emission coefficient
b. Calculation of indirect carbon dioxide emission
The following equation calculates the indirect emissions of each sector after the coefficient calculation.
According to the input-output method, the cost of power input and the amount of carbon dioxide indirectly emitted by the power enterprise is calculated by Eq. 4:
Here, R is the proportion of input. K denotes the total investment amount. IN represents the sum of output added value.
(3) This research cites foreign scholars’ definitions of direct and indirect CDEs. It calls the CDEs related to the direct combustion of fossil energy the direct CDEs of power enterprises, namely, the CDEs generated by the direct combustion of coal, oil, and other energy sources in the power industry’s production. Indirect CDEs are the CDEs of non-energy products or services in their life cycle. That is, the energy consumption of other industrial sectors of the national economy and the CDEs generated to maintain the production needs of consumers in the power sector (Reyna et al., 2018; Al-Jaroodi and Mohamed, 2019).
The direct CDE of power enterprises is mainly due to the excessive consumption of thermal power generation and electric heating energy. The indirect CDE is mainly the services consumed by the thermal power sector. CDEs of the product refer to the CDEs of commodities in the whole life cycle of exploitation, production, power and heat distribution, consumption, and recycling of raw materials (Andoni et al., 2019).
The sum of direct and indirect CDEs is the total CF (Salah et al., 2019) that is:
2.5 Data setting
This work mainly uses the method of data set to evaluate the model of EC and BCT, to explore the comprehensive performance of this model. The used dataset is the Dash dataset, which is a Python data visualization library for building web applications. It is based on the Python web framework Flask and the Javascript drawing library Plotly.js and the Javascript library React.js for building user interfaces, so it is very suitable for building web pages with Flask-based backend and front-end data visualization. The Dash application consists of two parts. The first part is the layout, which describes the design style of the application, and it is used to display data and guide users; the second part describes the interactivity of the application. The specific settings for evaluating the models are illustrated in Table 1.
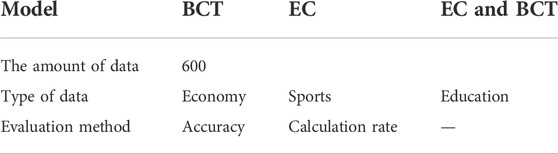
TABLE 1. Information for data settings.
As portrayed in Table 1, experimental evaluations of three models are set up, and the models are evaluated from different perspectives, making the evaluation results more valuable.
3 Results and discussion
3.1 Performance evaluation of edge computing and blockchain technology
Based on the progress of science and technology, data processing has become a key requirement of the current society for various technologies. The development of EC technology and BCT can not only satisfy the demands of data processing efficiency but also meet the requirements of data security. Therefore, this vision is fulfilled by the design of EC and BCT. Figure 3 demonstrates the performance evaluation results of the EC and BCT model.
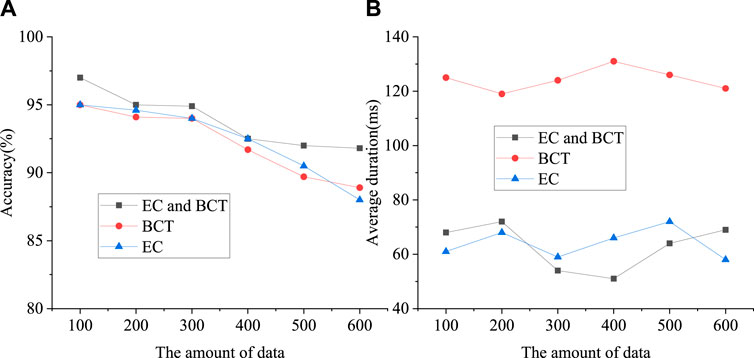
FIGURE 3. Performance evaluation of EC and BCT (A) refers to the accuracy of data processing, (B) stands for the duration of data processing).
In Figure 3, the design uses EC and BCT to analyze the CF of power enterprises, and the designed model can well meet this requirement. The accuracy rate of the designed model is more than 92%, which is almost the same as the data processing effect of EC and BCT, but the data processing rate of this work far exceeds that of blockchain technology, and the duration of data processing is about 70 ms. It means that the designed model not only has good data processing effect but also has security and efficiency. In addition, the work also evaluates the model under 100 experiments with different types of data. Table 2 presents the average accuracies of the models evaluated using different types of data. Table 2 Denotes that the accuracy rates of the three models are basically the same in different types of data processing. Therefore, it can be found that the designed model of EC and BCT is relatively successful.
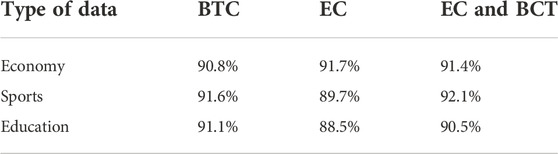
TABLE 2. Evaluation of different performances of the models.
3.2 Analysis of carbon footprint of power enterprises
The total CF is the sum of the total amount of carbon dioxide emitted directly and indirectly. Direct CDE is obtained through EC, and indirect CDE accounting is based on input-output analysis and BCT. On this basis, the change and characteristic structure of direct and indirect CDE of China’s power enterprises in 2005, 2010, 2015, and 2020 are studied by using the data of power enterprises from 2005 to 2020. Then, the BCT is used to quantitatively analyze the influencing factors of direct CDEs from thermal power consumption (Niranjanamurthy et al., 2019).
The total CF of the power industry in 2005, 2010, 2015, and 2020 is obtained by the sum of direct CDEs and indirect CDEs in the above 4 years. Tables 3; Figure 4 are the calculation results. Table 3 shows that power enterprises’ total CF has rapidly increased in the past 20 years.
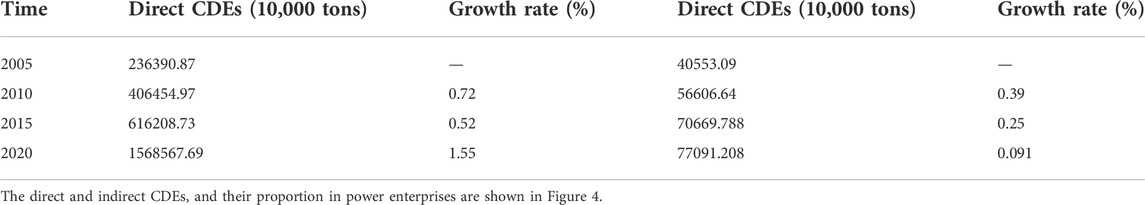
TABLE 3. Direct CDEs and growth rate of the power industry.
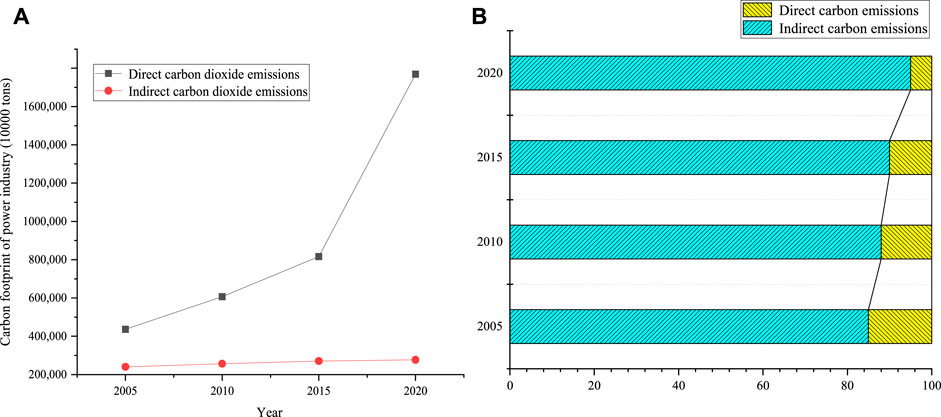
FIGURE 4. Direct and indirect CDEs and emission ratio of power enterprises. (A) Direct and indirect CDEs from power enterprises; (B) Proportion of direct and indirect CDEs in power enterprises.
The comprehensive analysis of the data in Figure 4 reveals the following results.
a. Regarding the total amount of CDEs in 2005, the direct CDEs were 2,363,908,700 tons, and the indirect CDEs were 405,530,900 tons. By 2020, the direct CDEs had reached 15,685,676,900 tons, and the indirect CDEs had reached 770,912,080 tons. It suggests that the total CF of China’s power industry is growing rapidly. Regarding the structure, direct CDEs account for a large proportion of the total CF. Proportion of direct CDE in 2005, 2010, 2015 and 2020 was 85%, 88%, 90% and 95%. The proportion of direct CDE is rising yearly, while the proportion of indirect CDE is declining yearly. In the final analysis, the power industry and other related industries are gradually decoupling due to the continuous improvement of technology levels. The investment in intermediate technology is added, resulting in a substantial increase in indirect CDEs.
b. China’s energy demand for industrial, civil, and heating has proliferated from 2005 to 2020, resulting in an obvious upward trend in power and heat production. Both energy input and direct CDE have an obvious upward trend. The CDE of the power industry is the main contributor to China’s CDE growth. The main factors affecting the emission reduction effect of China’s power industry are the input structure of energy, the structure of power sources, the technology in the power generation process, and the scale of the industry.
c. The power industry CF has risen from 2005 to 2020, with direct CDE and indirect CDE accounting for 95% and 5%, respectively. It reveals that the direct CDEs are very large, accounting for a significant proportion of power enterprises’ total CF. In the indirect CDEs, thermal power production is closely related to heavy manufacturing, mining, transportation, warehousing, postal, and other service industries. Service industries consume the intermediate services and products of other industries and greatly impact the CDEs of these industries.
4 Conclusion
The CDE of the power industry is analyzed from the perspective of CF verification. The results reveal that the power industry needs to focus on adjusting the power supply structure and expanding the proportion of clean power in electric power production. Clean power generation using wind, nuclear, and other low-carbon technologies should be encouraged. The investment structure of power generation and heating energy should be adjusted accordingly to control the growth of CDEs from the source and optimize CF verification. The energy intensity of China’s power industry may continue to decline. Its effect on ECER will gradually appear. Hence, power enterprises must improve energy utilization to implement CF verification and control the production’s power consumption and heat loss.
The research deficiency is that no specific industry-oriented CF research is explored. Currently, China’s CF verification research is in the demonstration and promotion stage. CF analysis is very crucial for enterprise CF verification systems. Enterprises should contain the CDE within the international standard and constantly improve the CF verification indexes in the future. This work hopes enterprises can focus on the full use of energy and better verify the CF. It is expected to help power enterprises control the power consumption index and heat loss in production, thereby achieving ECER.
Data availability statement
The original contributions presented in the study are included in the article/supplementary material, further inquiries can be directed to the corresponding author.
Author contributions
Each author made significant individual contributions to this manuscript. JX: writing and performing surgeries; YX: article review and intellectual concept of the article; YY: data analysis and performing surgeries.
Conflict of interest
Author JX was employed by Tellhow Software Co. Ltd.
Author YX was employed by State Grid Qinghai Electric Power Company Haixi Power Supply Company.
Author YY was employed by Tellhow Software Co. Ltd.
Publisher’s note
All claims expressed in this article are solely those of the authors and do not necessarily represent those of their affiliated organizations, or those of the publisher, the editors and the reviewers. Any product that may be evaluated in this article, or claim that may be made by its manufacturer, is not guaranteed or endorsed by the publisher.
References
Al-Jaroodi, J., and Mohamed, N. (2019). Blockchain in industries: A survey. IEEE Access 7, 36500–36515. doi:10.1109/access.2019.2903554
Andoni, M., Robu, V., Flynn, D., Abram, S., Geach, D., Jenkins, D., et al. (2019). Blockchain technology in the energy sector: A systematic review of challenges and opportunities. Renew. Sustain. Energy Rev. 100, 143–174. doi:10.1016/j.rser.2018.10.014
Belotti, M., Božić, N., Pujolle, G., and Secci, S. (2019). A vademecum on blockchain technologies: When, which, and how. IEEE Commun. Surv. Tutorials 21 (4), 3796–3838. doi:10.1109/comst.2019.2928178
Efanov, D., and Roschin, P. (2018). The all-pervasiveness of the blockchain technology. Procedia Comput. Sci. 123, 116–121. doi:10.1016/j.procs.2018.01.019
Gao, T., Jin, P., Song, D., and Chen, B. (2022). Tracking the carbon footprint of China's coal-fired power system. Resour. Conserv. Recycl. 177, 105964. doi:10.1016/j.resconrec.2021.105964
Gatteschi, V., Lamberti, F., Demartini, C., Pranteda, C., and Santamaria, V. (2018). To blockchain or not to blockchain: That is the question. IT Prof. 20 (2), 62–74. doi:10.1109/mitp.2018.021921652
Halaburda, H. (2018). Blockchain revolution without the blockchain?[J]. Commun. ACM 61 (7), 27–29. doi:10.1145/3225619
Krestinskaya, O., James, A. P., and Chua, L. O. (2019). Neuromemristive circuits for edge computing: A review. IEEE Trans. Neural Netw. Learn. Syst. 31 (1), 4–23. doi:10.1109/tnnls.2019.2899262
Li, H., Deng, J., Feng, P., Pu, C., Arachchige, D. D., and Cheng, Q. (2021). Short-term nacelle orientation forecasting using bilinear transformation and ICEEMDAN framework. Front. Energy Res. 697. doi:10.3389/fenrg.2021.780928
Li, H., Deng, J., Yuan, S., Feng, P., and Arachchige, D. D. (2021). Monitoring and identifying wind turbine generator bearing faults using deep belief network and EWMA control charts. Front. Energy Res. 770. doi:10.3389/fenrg.2021.799039
Li, H. (2022). SCADA data based wind power interval prediction using LUBE-based deep residual networks. Front. Energy Res. 10, 920837. doi:10.3389/fenrg.2022.920837
Li, H. (2022). Short-term wind power prediction via spatial temporal analysis and deep residual networks. Front. Energy Res. 10, 920407. doi:10.3389/fenrg.2022.920407
Monrat, A. A., Schelén, O., and Andersson, K. (2019). A survey of blockchain from the perspectives of applications, challenges, and opportunities. IEEE Access 7, 117134–117151. doi:10.1109/access.2019.2936094
Niranjanamurthy, M., Nithya, B. N., and Jagannatha, S. (2019). Analysis of blockchain technology: Pros, cons and SWOT. Clust. Comput. 22 (6), 14743–14757. doi:10.1007/s10586-018-2387-5
Osorio, A. M., Úsuga, L. F., Vásquez, R. E., Nieto-Londono, C., Rinaudo, M. E., Martinez, J. A., et al. (2022). Towards carbon neutrality in higher education institutions: Case of two private universities in Colombia. Sustainability 14 (3), 1774. doi:10.3390/su14031774
Porambage, P., Okwuibe, J., Liyanage, M., Ylianttila, M., and Taleb, T. (2018). Survey on multi-access edge computing for Internet of Things realization. IEEE Commun. Surv. Tutorials 20 (4), 2961–2991. doi:10.1109/comst.2018.2849509
Premsankar, G., Di Francesco, M., and Taleb, T. (2018). Edge computing for the Internet of Things: A case study. IEEE Internet Things J. 5 (2), 1275–1284. doi:10.1109/jiot.2018.2805263
Ray, P. P., Dash, D., and De, D. (2019). Edge computing for Internet of Things: A survey, e-healthcare case study and future direction. J. Netw. Comput. Appl. 140, 1–22. doi:10.1016/j.jnca.2019.05.005
Reyna, A., Martín, C., Chen, J., Soler, E., and Diaz, M. (2018). On blockchain and its integration with IoT. Challenges and opportunities. Future gener. Comput. Syst. 88, 173–190. doi:10.1016/j.future.2018.05.046
Roman, R., Lopez, J., and Mambo, M. (2018). Mobile edge computing, fog et al.: A survey and analysis of security threats and challenges. Future Gener. Comput. Syst. 78, 680–698. doi:10.1016/j.future.2016.11.009
Sabella, D., Sukhomlinov, V., Trang, L., Kekki, S., Paglierani, P., Rossbach, R., et al. (2019). Developing software for multi-access edge computing. ETSI white Pap. 20, 1–38. doi:10.1007/978-3-030-79618-1_9
Salah, K., Rehman, M. H. U., Nizamuddin, N., and Al-Fuqaha, A. (2019). Blockchain for AI: Review and open research challenges. IEEE Access 7, 10127–10149. doi:10.1109/access.2018.2890507
Schmitt, L., Jeong, J., Potier, J. M., Izoret, L., Mai-Nhu, J., Decousser, N., et al. (2022). Using an analysis of concrete and cement epd: Verification, selection, assessment, benchmarking and target setting. Acta Polytech. CTU Proc. 33, 546–551. doi:10.14311/app.2022.33.0546
Sittón-Candanedo, I., Alonso, R. S., Corchado, J. M., Rodriguez-Gonzalez, S., and Casado-Vara, R. (2019). A review of edge computing reference architectures and a new global edge proposal. Future Gener. Comput. Syst. 99, 278–294. doi:10.1016/j.future.2019.04.016
Sodhro, A. H., Pirbhulal, S., and De Albuquerque, V. H. C. (2019). Artificial intelligence-driven mechanism for edge computing-based industrial applications. IEEE Trans. Ind. Inf. 15 (7), 4235–4243. doi:10.1109/tii.2019.2902878
Sonmez, C., Ozgovde, A., and Ersoy, C. (2018). EdgeCloudSim: An environment for performance evaluation of edge computing systems. Trans. Emerg. Tel. Tech. 29 (11), e3493. doi:10.1002/ett.3493
Wiche, P., Droguett, B. R., and Granato, D. (2022). Challenges to quantify the life cycle carbon footprint of buildings in Chile. E3S Web Conf. 349, 04005. doi:10.1051/e3sconf/202234904005
Keywords: edge computing, blockchain, power enterprises, carbon footprint, carbon footprint verification
Citation: Xue J, Xu Y and Yang Y (2023) Power enterprises-oriented carbon footprint verification system using edge computing and blockchain. Front. Energy Res. 10:989221. doi: 10.3389/fenrg.2022.989221
Received: 08 July 2022; Accepted: 19 August 2022;
Published: 11 January 2023.
Edited by:
Yusen He, The University of Iowa, United StatesCopyright © 2023 Xue, Xu and Yang. This is an open-access article distributed under the terms of the Creative Commons Attribution License (CC BY). The use, distribution or reproduction in other forums is permitted, provided the original author(s) and the copyright owner(s) are credited and that the original publication in this journal is cited, in accordance with accepted academic practice. No use, distribution or reproduction is permitted which does not comply with these terms.
*Correspondence: Jizheng Xue, eHVjaGFvYmIxOTg1QDE2My5jb20=