 Chen Zhang
 Rachel Sheinberg
 Shashank Narayana Gowda
 Michael Sherman
 Amirhossein Ahmadian
- Smart Grid Energy Research Center, University of California, Los Angeles (UCLA), Los Angeles, CA, United States
Electric vehicle aggregators (EVAs) that utilize vehicle-to-grid (V2G) technologies can function as both controllable loads and virtual power plants, providing key energy management services to the distribution system operator (DSO). EVAs can also balance the grid’s reactive power as a virtual static VAR compensator (SVC) and provide voltage stability by utilizing advanced electric vehicle (EV) chargers that are capable of four-quadrant operations to provide reactive power management. Finally, managed charging can benefit EVAs themselves by minimizing power factor penalties in their electricity bills. In this paper, we propose a novel EV charging scheduling algorithm based on a hierarchical distributed optimization framework that minimizes peak load and provides reactive power compensation for the DSO by collaboration with EVAs that manage both the active and the reactive charging and discharging power of participating EVs. Utilizing the alternative direction method of multipliers (ADMM), the proposed distributed optimization approach scales well with increased EV charging infrastructure by balancing active and reactive power while decreasing computational burden. In our proposed hierarchical approach, each EVA schedules the active and reactive EV charging and discharging power for 1) reactive power compensation in order to minimize power factor penalty and electricity cost accrued by the EVA, 2) satisfaction of each EV’s energy demand at minimal charging cost, and 3) peak shaving and load management for the DSO. When compared with an uncoordinated charging model, the efficacy of this proposed model is successfully demonstrated through a 300% decreased peak EV load for the DSO, 28% lower electricity costs for EV users, and 98.55% smaller power factor penalty, along with 17.58% lower overall electricity costs, for EVAs. The performance of our approach is validated in a case study with 50 EVs at multiple EVAs in an IEEE 13-bus test case and compared the results with uncoordinated EV charging.
1 Introduction
Electric Vehicles (EVs) present great demand response potential for electrical grids because of their flexibility in charging time and duration. Further, EV adoption is being widely encouraged by governments and institutions to help reduce greenhouse gas (GHG) emissions and meet decarbonization goals. For example, in September 2020 California Governor Gavin Newsom issued an executive order requiring that 100 percent of passenger vehicle sales in California be zero-emission by 2035 (California Executive Department, 2020). This type of push for EV sales has been repeated at the state, federal, and international scales (U.S. Department of the Treasury, 2022). Yet, despite EVs’ potential grid benefits and their promise for GHG emission reduction, high penetration of EVs also presents a large challenge for electrical grids–as their spatial and temporal charging variability can cause undesirable effects in the grid operation. Thus, coordinated EV charging is an important tool to avoid congestion by conducting load shifting (de Hoog et al., 2016; Brinkel et al., 2020) for the distribution network during charging sessions. In addition to load-management services, many other positive effects of coordinated EV charging have been identified by researchers, such as reducing daily electricity cost (Forrest et al., 2016), reducing voltage deviation (Deb et al., 2018), and supporting renewable energy integration support to prevent curtailment of renewable energy resources (Pearre and Swan, 2016; Colmenar-Santos et al., 2019). Thus, coordinated EV charging, or EV charging scheduling, is a promising strategy to accommodate large-scale EV penetration. Following an increasing number of EVs participating in electricity markets through their charging decisions, it has become evident that utilizing dedicated EV aggregators (EVAs) for charging management can lead to distribution grid benefits. For example, a 2013 study demonstrates that coordinated charging greatly increases the grid’s ability to absorb increased EV penetration without requiring increased supply (Ortega-Vazquez et al., 2013). Another study conducts a broad survey of research on smart interactions between the grid, aggregators, and EVs - identifying the potential for both direct and indirect control by aggregators to benefit all participating parties (Wang et al., 2016b). A final example is a study from 2020 that explores many aspects of EV charging and grid integration, emphasizing the importance of unified charging standards and describing the ability of EVAs to facilitate EV participation in ancillary markets (Das et al., 2020).
Under the EVA-supported EV charging framework, grid to vehicle (G2V) - or traditional charging - and vehicle to grid (V2G) - or discharging from the EV back to the electrical grid - are the two main charging technologies. G2V operation enables the EV charging system to unidirectionally pull power from the grid, while V2G technology supports EV chargers handling bidirectional power flow, which enables EVs to charge/discharge power from/to the grid. Although V2G chargers are still in the early stages of public deployment within the United States, V2G technology has garnered much attention due to its potential to improve system stability at times of high demand, enable EV drivers to act as a virtual power plant, and provide ancillary services to the grid (Karfopoulos and Hatziargyriou, 2016, Ravi and Aziz, 2022).
The widespread applicability of V2G operation has been questioned by some due to the potentially adverse effects of battery degradation on driver profits (Bishop et al., 2013). However, a variety of authors have demonstrated the economic viability of V2G for EV drivers, especially through the use of smart charging algorithms that take into account battery cycling (Uddin et al., 2018). Further, one study–which utilizes both realistic battery degradation and driver behavior in its city-wide V2G model–finds that charging rate and efficiency are much more impactful than changes to battery life or cycling (Gandhi and White, 2021). Another study, employing a semi-empirical lithium-ion fade model, finds that, while battery wear is increased from V2G usage, this increase is minimal when compared to degradation from traditional use (Wang et al., 2016a).
Authors have also looked into future challenges and opportunities to utilize V2G technology. For example, one study investigates V2G use by fleets and fleet operators in the UK, concluding that there is potential to expand V2G to small and medium sized fleets, but that uptake of the technology by these users will be highly influenced by market environment (Meelen et al., 2021). Another investigates impacts of V2G on total cost of ownership for drivers in the UK–exploring the sensitivities to various charging and discharging schemes, as well as differences between participation in balancing versus load management services (Huber et al., 2021). There has also been much research into the use of V2G for grid-level support. One study, which conducts a techno-economic analysis of V2G system on the Indonesian grid, concludes that widespread adoption of EVs could help the country achieve high quality of electricity while providing economic benefits to both the power company and EV drivers (Huda et al., 2020).
As noted above, another focus of research has been V2G grid-level support services managed by EVAs conducting coordinated charging. Some examples of services that have been studied include V2G capability for frequency regulation (Peng et al., 2017), load shaving (Karfopoulos et al., 2016; Yu et al., 2022), congestion relief (Gowda et al., 2019), and renewable energy integration (Gao et al., 2014).
Coordinated EV charging frameworks are mainly divided into two categories: centralized (Jian et al., 2017) and decentralized (Gan et al., 2013). The centralized approaches focus on a centralized unit that directly controls the charging of the EVs. The EVA plays an important role in centralized charging by managing the communication between the utility and EVs, and by controlling EVs’ charging power directly (Al-Ogaili et al., 2019). The decentralized approaches, on the other hand, enable EVs to optimize their charging behaviors based on price signal broadcasts, so there may be no aggregator and individual EVs create their charging profile based on price signals, which are influenced by local load (Xydas et al., 2016). Although centralized charging is preferred by system operators because it can systematically allocate energy across a large population of EVs and efficiently achieve a global optimum (Yi et al., 2020), due to the mixed-integer nonlinear nature of the EV scheduling problem, centralized charging suffers from computational challenges with a large penetration of EVs (Faia et al., 2021; Hussain et al., 2021).
To alleviate the computational inefficiency of centralized charging, both multi-objective computing approaches (Fang et al., 2021) and hierarchical computing approaches can be used to achieve computational efficiency (Wu et al., 2019). In recent years, the alternating direction method of multipliers (ADMM), which is an iteration-based algorithm that can solve large-scale optimization problems in a distributed manner, has gained popularity in solving convex optimization problems (Boyd et al., 2010), as well as non-convex problems (Zha et al., 2018). An EV charging coordination method using ADMM was proposed in (Rivera et al., 2017) for both valley filling and charging cost minimization. However, without considering feeders’ capacity constraints these methodologies are inapplicable in practice. Both the Frank-Wolfe method and ADMM are applied in (Zhang et al., 2017) to solve the EV charging coordination problem. However, the Frank-Wolfe method is an iterative first-order optimization algorithm for convex optimization (Freund and Grigas, 2016), which performs inefficiently for problems with binary decision variables. In (Khaki et al., 2018), a hierarchical ADMM based framework was applied for EV charging scheduling with feeder capacity considered. However, in this study, it was not tested in a system-level simulation.
Further, the above-discussed studies only focus on active power coordination, which means only the consumption and/or supply of active power is considered and the possibility of utilizing EVs for reactive power support–an important ancillary service–is underestimated. Grid services such as frequency regulation and load shaving can be provided by EVs from active power dispatch (Han et al., 2010; Bhattarai et al., 2015), while reactive power dispatch could provide ancillary services for voltage support (Kisacikoglu et al., 2013). Nevertheless, reactive power dispatch is often not discussed in the existing literature on optimal power scheduling of EVs (Wang et al., 2019). In recent years, more and more research on the control of EV chargers has been proposed, showing how advanced charging infrastructure could enable EVs to be charged/discharged in any of the four P–Q quadrants (Mehboob et al., 2019; Hu et al., 2021). Providing an efficient way to support the grid with reactive power.
Research on advanced EV chargers that operate in full four-quadrants enables a broader view of EV charging scheduling studies involving both active and reactive power. The newest studies show that EVs can provide an efficient way to support power grids with reactive power (Li et al., 2019; Lenka et al., 2021). A study by (Lenka et al., 2021) shows that there is no additional battery degradation when EVs are charging/discharging reactive power. EVs can respond to the system demand of reactive power locally and fast, as highlighted by (Nikkhah Mojdehi and Ghosh, 2016). Thus, the four-quadrant operation of the EV chargers enable EVs with coordinated charging to act not only as loads for demand response and battery storage systems but also as fast var-compensators for the distribution network. Var-compensators, such as static var compensator (SVC), provide fast-acting reactive power to electricity transmission and distribution networks, and perform best when installed locally (Tan and Thottappillil, 1994). Considering the high cost of installing SVC locally, EVs with four-quadrants chargers can be a potential substitute, due to their spatial and temporal flexibility. An integrated volt-var optimization engine was proposed in (Zhang et al., 2018) for distributed grid control by utilizing V2G and EV coordination. However, the models were simplified as convex optimizations. A coordination framework optimally managing active and reactive power dispatch of spatially distributed EVs was also proposed, incorporating distribution grid level constraints (Wang et al., 2019). However, only two quadrants of the charging region of EVs were considered in order to decrease the computational burden.
The main contributions of this work are summarized as follows: 1) a hierarchical ADMM-based EV charging framework is proposed for incorporating large-scale penetration of EVs, 2) modeling dispatch of both active and reactive power that minimizes electricity bills of each EV user while also minimizing the electricity cost and power-factor penalty for the EVAs, 3) exploration of the possibility of active and reactive power support by EVs with four-quadrant EV chargers, 4) reduction of the peak load at the DSO level, and 5) efficient computations and data privacy due to the hierarchical charging network.
The rest of the paper is organized as follows: Section 2 introduces a standard ADMM form and presents the hierarchical architecture of the EV coordinated charging network. Section 3 formulates the mathematical model of the ADMM-based EV charging framework. Section 4 presents the case studies, and Section 5 concludes the paper.
2 Model description
2.1 Four-quadrant EV chargers
The advanced EV charging infrastructure enables the control region of EVs to become the full active and reactive power (P-Q) coordinate, shown in Figure 1. The positive directions of P (active power) and Q (reactive power) represent the power being delivered from the grid to the EVs, while the negative directions represent the power being supplied by the EVs to the grid. Figure 1 shows that the positive values of P indicate the EV charger is working in the G2V mode, and the negative P means it is working in V2G mode. The reactive power is capacitive when it is supplied from EVs to the grid (discharged), and is inductive when the it is delivered from the grid to EVs. It is worth noting that the standard EV chargers with uncontrolled reactive power work in the III and IV quadrants where the values of reactive power Q are negative, indicating the reactive power is delivered from the EVs to the grid. This is validated by a study measuring the power quality influenced by EVs’ charging sessions (Pinto et al., 2015).
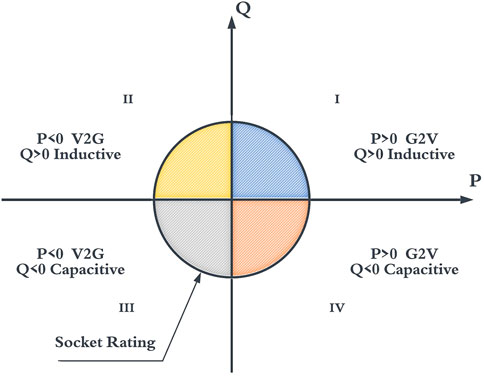
FIGURE 1. Four-quadrant operation of EV charging.
2.2 EV charging framework based on ADMM
Alternating direction method of multipliers (ADMM) is an algorithm that solves convex optimization problems with separable objective functions. One example of the standard form of ADMM is shown below.
The optimal value of x and y can be obtained by applying the ADMM algorithm according to the following steps.
a) Initialize the sequences
b) Generate the augmented form of ADMM
c) For
ADMM was initially applied to convex problems but then was also found to be effective in solving non-convex problems with binary variables (Zha et al., 2018), which is a perfect fit for the scheduling problem in this research. First, the hierarchical nature of our study entails multiple objective functions for each layer including EVs, EVAs, and the DSO, and they are separable as this structure can be considered as a sharing problem (Boyd et al., 2010) that can be solved in a distributed manner by ADMM. Additionally, the charging and discharging indicators for each EV charger are set as binary variables in the optimization model.
The function of the DSO in this study is to alleviate peak load conditions of a certain region in the distribution system by sending signals to EVAs and accordingly charging EVs when non-EV demand load is low or discharging EVs when the non-EV demand is high. We assume the EV charging infrastructure is controlled and managed by each EVA, and the information on non-EV load is managed by the DSO. In general, the DSO controls the total EV load at a local bus through communication with EVAs that manage the charging status of the EVs. The hierarchical structure of the studied EV charging infrastructure is visualized in Figure 2.
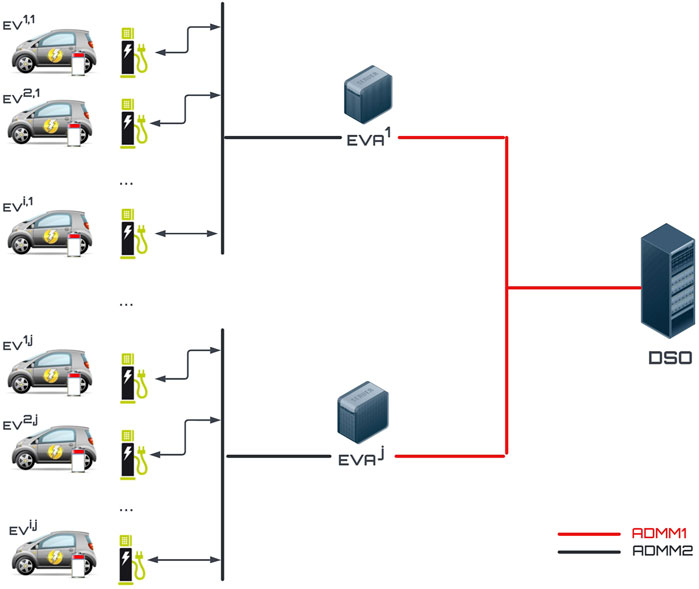
FIGURE 2. Schematic of the EV charging infrastructure with hierarchical ADMM scheme.
The time-discrete model of the charging sessions of EVs is described as follows. For each time interval
Eq. 8 is ensuring enough energy is stored in the battery by the time of departure for each EV
It is worth noting that only the four-quadrant EV chargers are capable of controlling both the reactive and active charging/discharging power, while the standard EV chargers simply handle the active power.
For the standard EV chargers, the reactive power is considered to be 20% of the value of active charging or discharging power during the first 85% of the charging session, with an increase up to 70% of the amount of active power for the last 15% of the session. These assumptions are based on research of EV charging characteristics (Pinto et al., 2015; Haidar and Muttaqi, 2016), both of which identify that reactive power is around 20% active power during the overall charging session, but increases significantly during the end phase of the charging session. It is worth noting that the reactive power of EVs using standard chargers is considered as capacitive under this condition, which means the reactive power is delivered from the EVs to the grid, so only reactive discharging power occurs during the standard charging sessions.
In addition, we also consider the upper bounds on the electrical power being supplied by each EVA to its EVs and by the DSO to the EVAs, shown in Eq. 11, 12.
3 Problem formulation
3.1 EV charging model
The total number of EV chargers supervised by the DSO is:
Where, the number of EV chargers supervised by EVA j is
For each EV i under EVA j, the objective is to minimize the electricity cost, and the cost model is shown in Eq. 15, where
Subject to:
Where,
For each EVA j, the objective is to minimize both the direct electricity cost and the demand charges. The surcharges caused by the drop of power factor (PF), or so-called power factor penalty, could be avoided by enabling EVs to utilize the four-quadrant EV chargers to mitigate reactive power variance that occurs due to the large-scale EV charging sessions of the EVA. The optimization model of the EVA is shown in Eq. 16.
Where
The sum of active power consumption for the EVAs within the certain region under the DSO, at time interval t is shown in Eq. 19, and
For the DSO, the objective is to minimize the peak load of the region
The general objective function of EV charging coordination including all three layers is shown in Eq. 22.
Now considering the matrix of EVs’ active and reactive power under EVA j:
Where
Eq. 28 could be rewritten in the standard ADMM form, shown in Eq. 29.
Where
According to (Boyd et al., 2010), Eq. 29 equals to Eq. 30, which represents the y-update blocks using a single average term
By utilizing Eq. 30, we decrease the y-update variables in Eq. 29 to only one variable. The following ADMM formulation section therefore is developed based on the form of Eq. 30.
3.2 ADMM formulation
• ADMM1
The sharing problem between the DSO and each EVA can be written in the ADMM form as follows .
1) x-update
s.t. (4)-(11), (15-a)—(15-o),
2) y-update
s.t. (12)
3) dual-variable update
Where
After the dual iteration in Eq. 33 of ADMM1, the DSO broadcasts
• ADMM2
According to the structure of the EV coordinated charging framework in this study, the matrix
Where
The sharing problem between EVA j and each EV i can be written in the ADMM form as follows.
1) U-update
s.t. (4) - (10), (15-a)—(15-o)
2) V-update
s.t. (11)
3) Dual variable update
Where,
The average active charging power of EVs at EVA j,
K in Eq. 44 is the sum of reactive power for all standard EV chargers, represented in Eq. 50, where
Where
The y-update vector
The process of using the ADMM to solve the hierarchical EV charging scheduling problem is provided in Algorithm 1.
Algorithm 1. Hierarchical ADMM Model
1. Each EVA calculates day-ahead EVs’ arrival/departure time
2. DSO obtain day-ahead non-EV load profile
3. Initialize
4. While
5. For j=1:
6. While
7. For i =1:
8. Calculate
9. End
10. Update
11. Calculate
12. Update and broadcast
13. End
14. Broadcast
15. End
16. Update
17. Calculate
18. Update and broadcast
19. End
4 Case Studies
The mathematical models described in Sections 2 and 3 are developed in Python and solved by the Gurobi solver (Gurobi Optimization LLC, 2020). For the case studies, we focus on a DSO in a certain region managing 2 EVAs with 50 EV chargers per EVA, assuming 100% EV penetration for households in the region. Of the 50 chargers per EVA, 30 are standard chargers and 20 are four-quadrant chargers that include reactive power management. It is also assumed that the DSO has a priori knowledge about the non-EV load of the system, and each EVA knows the arrival time, departure time, and desired state-of-charge (SOC) of its EVs. We use the UCLA Smart Grid Energy Research Center ‘s (SMERC) smart charging network infrastructure as a testbed of per-user data to simulate such an EVA. User charging data was collected at charging stations located at the Santa Monica Civic Center, Los Angeles, and the UCLA employee/visitor parking structure 9 (PS9) (Xiong et al., 2018).
The data collected from SMERC is preprocessed such that charging session records that last less than 0.5 hours or consume less than 1 kWh have been removed and any energy consumption that exceeds the maximum threshold is replaced with nominal maximum value. Additionally, all starting time, duration, and energy consumption values are normalized for each respective data set to be used for training and inversely scaled after testing to retrieve the correct values. In this paper, each user’s arrival time is generated by randomly sampling from a Gaussian Mixture Model trained with the users’ historical arrival hours (and optimized on the number of components, according to the Bayes information criterion (BIC)). Each user’s departure time is modeled by adding the prediction of stay duration based on Gaussian Kernel Density Estimation of the user’s historical charging session duration data to the randomly sampled arrival time (Chung et al., 2018).
The initial SOC is randomly set between 0.2 to 0.4, and final desired SOC is set between 0.8 to 1. The socket rating of the EVs is 60 kVA, which means the maximum active power charging rate is 60 kW considering the charging power range of DC fast charging methods. The maximum energy capacity of the EVs is randomly set between 30 kWh to 80 kWh. The simulation is run for 24 hours with 5-minute intervals.
To demonstrate the performance of our proposed model, the simulation results are compared with an uncoordinated EV charging condition, where each EV is charged at the maximum charging rate immediately after their arrival. Additionally, an IEEE 13-bus distribution system is utilized, as shown in Figure 3, for testing the influence of the proposed model on a distribution system. The EVAs in this study are assumed to be placed at node 634 in the IEEE 13-bus distribution system as seen in Figure 3. The non-EV load data was obtained from the National Renewable Energy Laboratory’s End-Use Load Profiles for U.S. Building Stock and is comprised of 10% of the total electricity load for 60 residential buildings, two small office buildings, and two retail strip malls in West Los Angeles throughout a 24-hour period in July of 2018 (National Renewable Energy Laboratory, 2021).
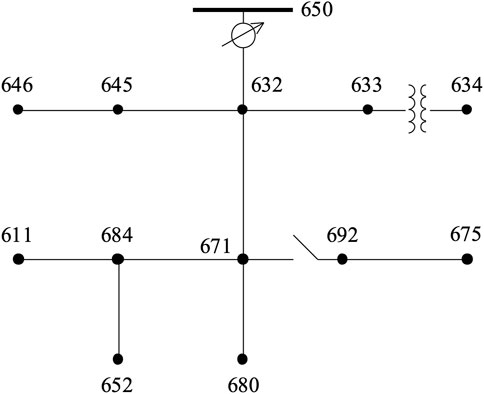
FIGURE 3. IEEE 13-bus system (W. H. Kersting, 2001).
4.1 Simulation results of EV charging scheduling
The electricity price used for charging/discharging the EVs is the summer time-of-use (TOU) price from the Los Angeles Department of Water and Power (LADWP). For each EVA, the price of electricity in a 24-hour period is based on the locational marginal price (LMP) from a CAISO node located in West Los Angeles over a 24-hour period in July of 2022. Figure 4 shows the TOU price and the LMP in a 24-hour period, respectively.
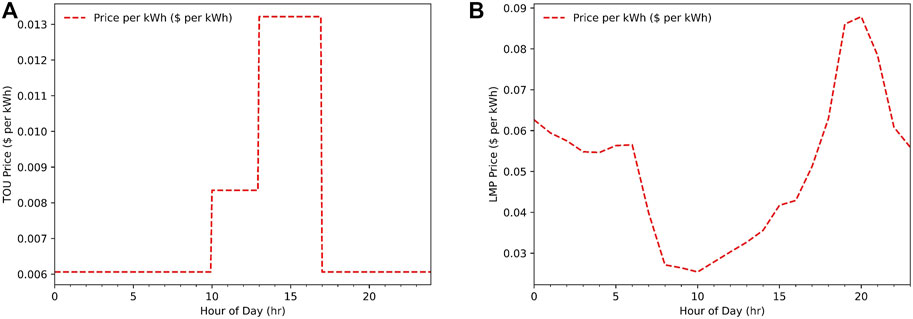
FIGURE 4. Price signals in a 24-hour period. (A) TOU price from LADWP, (B) locational marginal price from CAISO.
The hierarchical computation of the proposed EV charging scheduling framework is applied and tested on the case studies with the assumptions described above. The values of the ADMM parameters of Algorithm 1 are set as shown in Table 1.
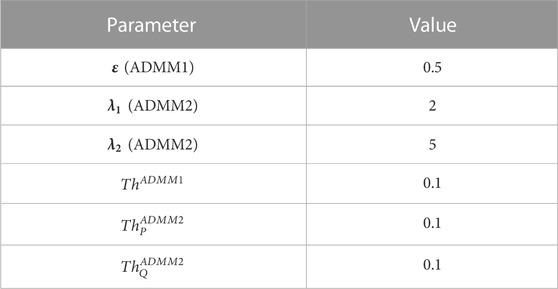
TABLE 1. Hierarchical ADMM parameters.
The variations of the dual residuals of ADMM1 and ADMM2 per iteration are shown in Figure 5. It shows that ADMM1 converged much faster than ADMM2. In fact, after 3 iterations of ADMM1 and on average 213 iterations of ADMM2, all the dual residuals reach values less than the corresponding error tolerances, and it is worth noting that the final converged value of the dual residuals are on average 0.001 for
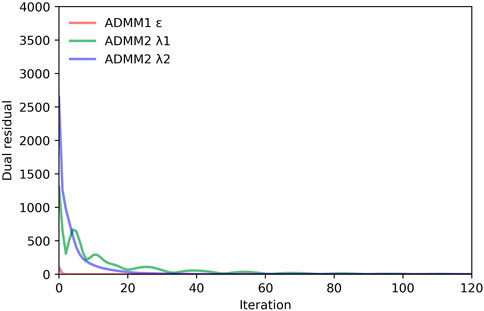
FIGURE 5. Dual residuals per iteration for ADMM1 and ADMM2.
The charging profiles of two EVs with standard and four-quadrant chargers, respectively, is shown in Figure 6. For a better comparison, the coordinated charging profiles are represented by the solid lines, while the charging profiles of each EV under uncoordinated charging are represented by the dashed lines. The difference in the initial charging time between the green lines and the dashed lines indicates that the proposed hierarchical EV charging scheduling is capable of load shifting by charging EVs at a different time period according to the optimization objectives of the EV, the EVA, and the DSO. And it is clear in both Figures 6A,B that the peak charging power of EVs under the proposed charging scheme is lower when compared to uncoordinated charging. The black line in Figure 6B shows that reactive power is generated between 3:00 and 8:00 PM by the EV with the four-quadrant charger to compensate for the reactive power simultaneously generated by EVs with standard chargers, whose reactive power is uncontrolled and is being injected into the grid during the active power charging session.
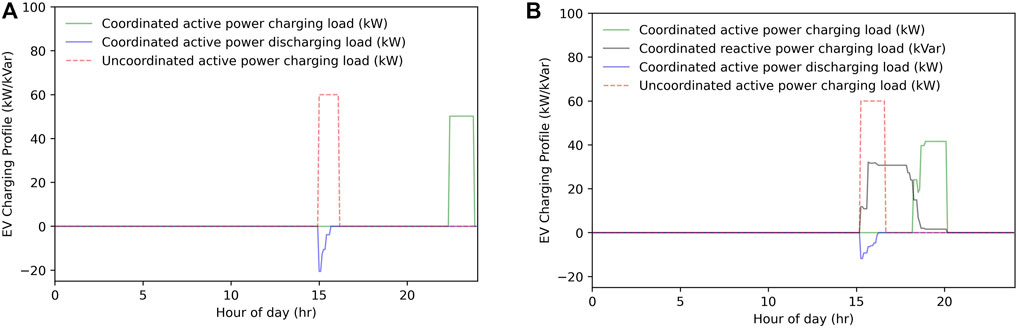
FIGURE 6. EV charging profiles by (A) standard charger and (B) four-quadrant charger.
The daily electricity costs for an EV with a standard charger in Figure 6A under the proposed charging and uncoordinated charging are $4.34 and $13.46 respectively, while the costs for an EV with four-quadrant charger in Figure 6B are $4.03 and $13.48 respectively. In fact, the average daily electricity cost for all EVs under the proposed charging scheme and the uncoordinated charging scheme are $6.04 and $8.39 respectively. This shows the capability of reducing electricity expenditure for EV users by applying the proposed charging strategy – resulting in 28% lower electricity costs on average for EV users under the proposed coordinated EV charging strategy. The lower charging cost for EVs under the proposed charging strategy can serve as a good incentive for EV users to participate in the coordinated EV charging. By utilizing the four-quadrant chargers and the proposed hierarchical charging strategy, the power factor could be maintained in a satisfactory range to avoid large amount of demand charges paid by the EVAs.
The average daily electricity costs of the EVAs, and the power factor penalty for the EVA under different charging schemes, are shown in Table 2. It is worth noting that for LADWP territory, the power factor penalty is calculated as a varying dollar amount per kWh depending on the how far the power factor value falls from its ideal value of 1 during any given time block (i.e., the charge is steeper for lower power factors), as well as whether that time block is during the high peak, low peak, or baseline time blocks (Los Angeles Department of Water and Power, 2022). These per kWh penalty charges range from $0.0004 to $0.01437. Additionally, the demand charge per month is levied as a per kW cost that is determined by the time and magnitude of the customer's highest peak load during that month. It will either be $10.00/kW, $3.75/kW, or $0.00 if the peak demand falls during the high peak, low peak, or baseline time blocks, respectively. In our model, overall peak demand for all three charging strategies was in the morning during the baseline time block, and therefore did not add any additional costs.
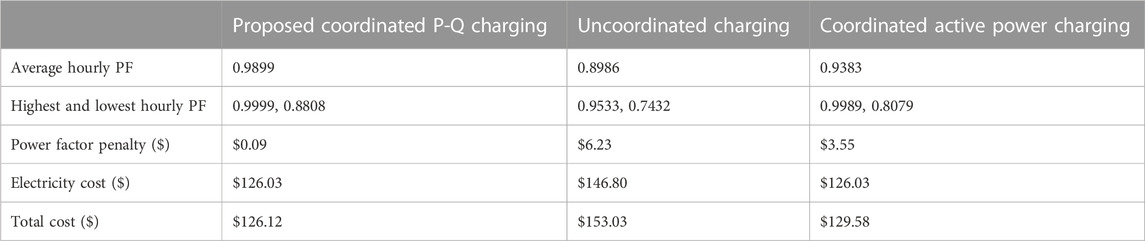
TABLE 2. Power factor, power factor penalty, and electricity cost of one EVA during a day under different charging strategies.
The proposed charging strategy manages not only active power but also reactive power by considering the four-quadrant operations of EV chargers, which can be beneficial for the EVA to maintain the reactive power balance and decrease the power factor penalty on the electricity bill. The performance of the proposed charging scheme is compared with both the uncoordinated charging and the coordinated charging scheme using the same hierarchical ADMM structure but not considering the reactive power optimization from four-quadrant EV chargers. According to Table 2, the average hourly power factor during a day with the proposed charging strategy is 0.9998, around 0.1 higher than the one with uncoordinated charging, 0.8986, and 0.05 higher than the coordinated charging case without reactive power management. The comparison between the highest and the lowest hourly power factor between different charging strategies shows that the proposed four-quadrant EV charging strategy enables the highest and most stable power factor for the EVA during a day. Accordingly, it leads to the lowest daily power factor penalty, $0.09, much lesser than the penalties under uncoordinated charging, $6.23, and penalties under coordinated charging with only active power managed, $3.55. The electricity cost of the proposed EV charging strategy is $126.03, which is $20.73 less than the case with uncoordinated charging. The total cost, the sum of the electricity cost and the power factor penalty, in Table 2 shows the proposed charging strategy’s good performance in minimizing the cost of the EVA. More specifically, by utilizing the proposed EV charging strategy, there is a 98.55% smaller power factor penalty and 17.58% lower electricity costs for each EVA, as compared to the uncoordinated charging scheme.
The performance of the four-quadrant EV charging in absorbing the reactive power generated by charging demand of EVs with standard chargers is shown in Figure 7. The yellow lines represent the sum of reactive power consumed (charged) by the EVs with four-quadrant chargers from the grid during the 24-hour period, while the blue lines are the sum of reactive power injected (discharged) into the grid from EVs with standard chargers. It is clear that by applying the proposed hierarchical EV charging strategy, the EVA containing four-quadrant chargers can locally track and consume the reactive power that is generated by EVs with the standard chargers. It can be observed that a small amount of reactive power generated by standard chargers between approximately 5pm and 6pm and near the end of the day is not absorbed by the EVs with the four-quadrant chargers under the coordinated charging scheme. One possible reason for this may be the lack of EVs with four-quadrant chargers available during that time-period. This shows that the ratio of the number of four-quadrant chargers to the total number of chargers managed by the EVA can influence the performance of reactive power balancing by the proposed EV charging model. The higher the ratio , the higher the availability of EVs utilizing four-quadrant chargers to compensate for the reactive power injected onto the grid by the EVs with standard chargers.
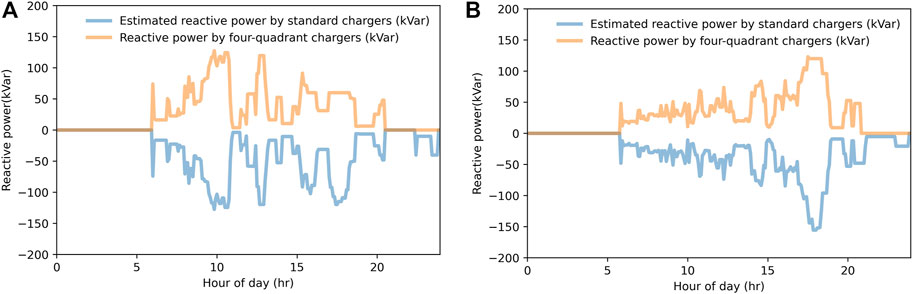
FIGURE 7. Reactive power under the hierarchical ADMM charging scheme at EVA1 (A) and EVA2 (B).
The variation of reactive power profiles under different EV charging strategies for the EVAs in this study are shown in Figure 8. Compared to the large variation of reactive power under uncoordinated charging, the variation of reactive power under coordinated charging is negligible.
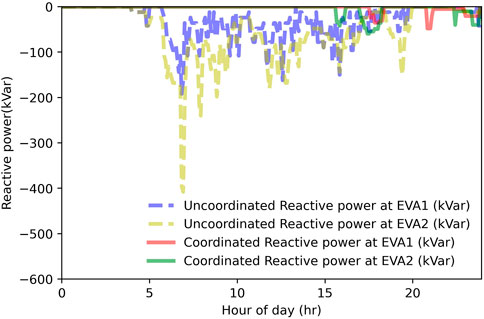
FIGURE 8. Reactive power profiles under the proposed EV charging and uncoordinated charging schemes at EVAs.
The EV active power charging load profiles under the proposed coordinated and uncoordinated charging strategies, along with the total load at the DSO level, are shown in Figure 9. It can be seen clearly in Figure 9A that the EV charging load profile under the coordinated charging has a maximum power at around 400kW and is much smoother with no spikes as compared to the uncoordinated EV charging load, which has four major peaks during a day with the highest peak at around 1200 kW. Figure 9B shows the total load profile including both EV charging load and the net load at the DSO level. It is clear that under the proposed charging strategy, the total load, including EVs, is much smoother and has fewer spikes than the total load with EVs under uncoordinated charging. Further, compared to the net load, the total load with EVs under the proposed charging strategy shows successful load valley filling, including less variation between the highest load peak and the prior load valley, 921.142kW, while the peak-valley variation of the netload is 992.149kW.

FIGURE 9. EV load profile (A) and total load profile (B) at the DSO level during a day.
4.2 Simulation Results on 13-bus IEEE system
The proposed approach is tested on the IEEE 13-bus test case using the pandapower module in Python (Thurner et al., 2018), in order to observe its impact on the distribution system. It is assumed that the EV charging load of the EVAs and the net load considered in the previous section are located at node 634 of the IEEE 13-bus system, shown in Figure 3. The simulation result is shown in Figure 10.
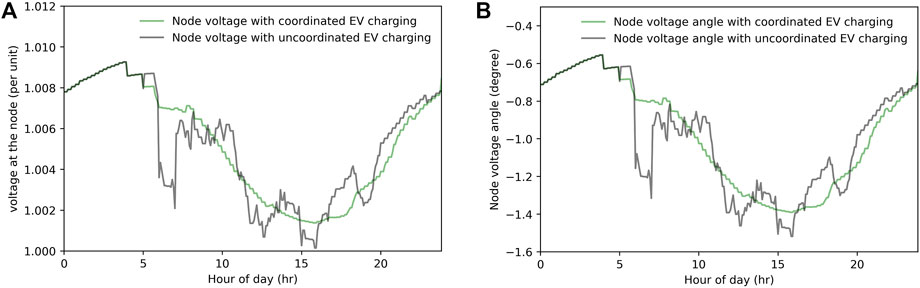
FIGURE 10. Variation of voltage (A) and voltage angle (B) under coordinated and uncoordinated EV charging during a day at the node 634 of the IEEE 13-bus system.
Figure 10 shows the variation of voltage and voltage angle at node 634 during a day with EVs under the different EV charging strategies. The uncoordinated EV charging causes more fluctuation in the node voltage and voltage angle profiles, as compared with fewer fluctuations in the node voltage and voltage angle under the proposed ADMM-based EV charging strategy. It is worth mentioning that the proposed EV charging model including reactive power management does successfully balance the reactive power generated by EVs, but it could be further expanded to consider the reactive power demand from the grid side to provide reactive power related ancillary services and lead to more stable node voltages.
4.3 Discussion
A major challenge with increased EV penetration is mitigating the spikes in peak demand as well as reduction in power factor due to reactive power generated during charging events. Thus, major topics in EV and smart grid research have been effective charging scheduling and, to a lesser extent, reactive power management.
However, optimization packages like CPLEX, SCIP, BARON cannot be directly applied in solving the proposed large-scale EV charging model due to the large number of binary variables and constraints (Kou et al., 2020). The ADMM structure proposed in this paper, which naturally aligns with the hierarchical EV charging system (DSO-EVA-EV), enables the centralized optimization to be solved in a distributed manner. Here, we include the charging and discharging status of both active power and reactive power, which doubles the complexity of the optimization problem in comparison to models used in previous research. The active and reactive power charging and discharging management is achieved through a combination of four-quadrant EV chargers and standard EV chargers managed by the EVAs. When compared with an uncoordinated charging model, the efficacy of this proposed model is successfully demonstrated through a 300% decreased peak EV load for the DSO, 28% lower electricity costs for EV users, and 98.55% smaller power factor penalty, along with 17.58% lower overall electricity costs, for EVAs. It also shows good performance in valley filling as well as the node voltage/voltage angle stability at the DSO level, compared to the uncoordinated EV charging scheme. The only information exchanged between the DSO, EVAs and the EVS are the dual variable updates in the hierarchical ADMM structure. This protects users’ privacy and makes the approach more practical. It is worth noting that the randomness of EVs’ availability was assumed to be known by the EVAs, so the inaccurate prior knowledge of the uncertainty would have a negative impact on the efficiency of the proposed EV charging strategy. The prediction of the EVs’ availability at each EVAs can be achieved by applying machine learning algorithms based on historical data.
The first major outcome from the ADMM-based EV charging scheme conducted in this paper is that it is feasible to conduct load curtailment of active power for EVAs and valley filling for the DSO. The second major outcome of this paper is the successful demonstration of an EVA utilizing four-quadrant EV chargers to balance reactive power generated from standard EV chargers, without the need to install extra SVC. Finally, this paper demonstrates the ability of the proposed algorithm to minimize costs to the EVA by reducing power factor penalties, which can be a serious issue for aggregators managing large numbers of charging stations and EVs. Cost comparison and reductions are shown in Table 2. Finally, the hierarchical structure proposed here enables information from each EV to be managed by the EVA without direct communication with the DSO, thus preserving the privacy of the EV customer.
5 Conclusion
In this study, a scalable EV charging optimization model is proposed for the hierarchical network structure, composed of a DSO, EVAs, and EVs. Typically, EV charging optimization models are not directly solvable by centralized optimization packages due to the size of the scheduling problem and the large number of binary variables and constraints for the increasing number of EVs. Therefore, ADMM is utilized to decentralize the optimization model into sub-problems at different levels and solve them in a distributed manner, which is especially applicable for a distribution network with a large number of EVs. The proposed EV charging scheme optimizes the active and reactive charging and discharging power of EV chargers managed by EVAs, with the goals of 1) benefitting the DSO through minimized peak load, 2) benefitting EVAs through reactive power management for reduced power factor penalties, and 3) benefitting EV owners by minimizing electricity costs.
One limitation of this work is that the estimation of reactive power generated by standard chargers is assumed to be a piecewise linear model, which could be improved to a dynamic model in future work. Further, in this paper, EVs with four-quadrant chargers are utilized for balancing reactive power generated by EVs with standard chargers, which in the future could be further expanded to balancing overall reactive power demand on the grid and participation in ancillary service markets. The influence of different ratios of four-quadrant chargers to the standard chargers on the performance of the proposed model, as well as the economic analysis of the different scenarios, is another piece that can be studied in the future.
Finally, future work could also include modeling a greater number of EVs and EVAs, as well as modeling a scaled up testcase that includes multiple nodes of a distribution network. These models would be able to demonstrate the efficiency of the ADMM model for different scales, an important step towards implementation.
Data availability statement
The raw data supporting the conclusion of this article will be made available by the authors, per request.
Author contributions
CZ: problem formulation, coding, draft write-up RS: problem formulation, draft write-up SN: problem formulation, draft write-up MS: data processing, draft write-up AA: draft write-up RG: draft review.
Acknowledgments
The EV database used in the current research was created by way of a project sponsored in part by LADWP/DOE grant numbers 20699 and 20686, which were part of the LADWP Smart Grid Regional Demonstration Project awarded to the department of Mechanical and Aerospace Engineering and the Smart Grid Energy Research Center (SMERC) at UCLA. We are also grateful to the additional sponsorship received from the following grants 69763, 77739, and 45779 to the department of Mechanical and Aerospace Engineering.
Conflict of interest
The authors declare that the research was conducted in the absence of any commercial or financial relationships that could be construed as a potential conflict of interest.
Publisher’s note
All claims expressed in this article are solely those of the authors and do not necessarily represent those of their affiliated organizations, or those of the publisher, the editors and the reviewers. Any product that may be evaluated in this article, or claim that may be made by its manufacturer, is not guaranteed or endorsed by the publisher.
References
Al-Ogaili, A. S., Tengku Hashim, T. J., Rahmat, N. A., Ramasamy, A. K., Marsadek, M. B., Faisal, M., et al. (2019). Review on scheduling, clustering, and forecasting strategies for controlling electric vehicle charging: Challenges and recommendations. IEEE Access 7, 128353–128371. doi:10.1109/ACCESS.2019.2939595
Bhattarai, B. P., Lévesque, M., Maier, M., Bak-Jensen, B., and Pillai, J. R. (2015). Optimizing electric vehicle coordination over a heterogeneous mesh network in a scaled-down smart grid testbed. IEEE Trans Smart Grid 6, 784–794. doi:10.1109/TSG.2014.2384202
Bishop, J. D. K., Axon, C. J., Bonilla, D., Tran, M., Banister, D., and McCulloch, M. D. (2013). Evaluating the impact of V2G services on the degradation of batteries in PHEV and EV. Appl Energy 111, 206–218. doi:10.1016/j.apenergy.2013.04.094
Boyd, S., Parikh, N., Chu, E., Peleato, B., and Eckstein, J. (2010). Distributed optimization and statistical learning via the alternating direction method of multipliers. Foundations and Trends in Machine Learning 3, 1–122. doi:10.1561/2200000016
Brinkel, N. B. G., Schram, W. L., AlSkaif, T. A., Lampropoulos, I., and van Sark, W. G. J. H. M. (2020). Should we reinforce the grid? Cost and emission optimization of electric vehicle charging under different transformer limits. Appl Energy 276, 115285. doi:10.1016/j.apenergy.2020.115285
California Executive Department (2020). Executive Order N-79-20. Available at: https://www.gov.ca.gov/wp-content/uploads/2020/09/9.23.20-EO-N-79-20-Climate.pdf (Accessed October 16, 2022).
Chung, Y. W., Khaki, B., Chu, C., and Gadh, R. (2018). “Electric vehicle user behavior prediction using hybrid kernel density estimator,” in Proceeding of the 2018 International Conference on Probabilistic Methods Applied to Power Systems, PMAPS 2018 - Proceedings, Boise, ID, USA, June 2018 (Institute of Electrical and Electronics Engineers Inc.). doi:10.1109/PMAPS.2018.8440360
Colmenar-Santos, A., Muñoz-Gómez, A. M., Rosales-Asensio, E., and López-Rey, Á. (2019). Electric vehicle charging strategy to support renewable energy sources in Europe 2050 low-carbon scenario. Energy 183, 61–74. doi:10.1016/j.energy.2019.06.118
Das, H. S., Rahman, M. M., Li, S., and Tan, C. W. (2020). Electric vehicles standards, charging infrastructure, and impact on grid integration: A technological review. Renew. Sustain. Energy Rev. 120, 109618. doi:10.1016/j.rser.2019.109618
de Hoog, J., Alpcan, T., Brazil, M., Thomas, D. A., and Mareels, I. (2016). A market mechanism for electric vehicle charging under network constraints. IEEE Trans. Smart Grid 7, 827–836. doi:10.1109/TSG.2015.2495181
Deb, S., Tammi, K., Kalita, K., and Mahanta, P. (2018). Impact of electric vehicle charging station load on distribution network. Energies (Basel) 11, 178. doi:10.3390/en11010178
Faia, R., Soares, J., Fotouhi Ghazvini, M. A., Franco, J. F., and Vale, Z. (2021). Local electricity markets for electric vehicles: An application study using a decentralized iterative approach. Front. Energy Res. 9. doi:10.3389/fenrg.2021.705066
Fang, B., Li, B., Li, X., Jia, Y., Xu, W., and Liao, Y. (2021). Multi-objective comprehensive charging/discharging scheduling strategy for electric vehicles based on the improved particle swarm optimization algorithm. Front. Energy Res. 9. doi:10.3389/fenrg.2021.811964
Forrest, K. E., Tarroja, B., Zhang, L., Shaffer, B., and Samuelsen, S. (2016). Charging a renewable future: The impact of electric vehicle charging intelligence on energy storage requirements to meet renewable portfolio standards. J. Power Sources 336, 63–74. doi:10.1016/j.jpowsour.2016.10.048
Freund, R. M., and Grigas, P. (2016). New analysis and results for the Frank–Wolfe method. Math. Program 155, 199–230. doi:10.1007/s10107-014-0841-6
Gan, L., Topcu, U., and Low, S. H. (2013). Optimal decentralized protocol for electric vehicle charging. IEEE Trans. Power Syst. 28, 940–951. doi:10.1109/TPWRS.2012.2210288
Gandhi, H. A., and White, A. D. (2021). City-wide modeling of vehicle-to-grid economics to understand effects of battery performance. ACS Sustain Chem. Eng. 9, 14975–14985. doi:10.1021/acssuschemeng.1c05490
Gao, S., Chau, K. T., Liu, C., Wu, D., and Chan, C. C. (2014). Integrated energy management of plug-in electric vehicles in power grid with renewables. IEEE Trans. Veh. Technol. 63, 3019–3027. doi:10.1109/TVT.2014.2316153
Gowda, S. N., Zhang, T., Kim, C. J., Gadh, R., and Nazaripouya, H. (2019). “Transmission, distribution deferral and congestion relief services by electric vehicles,” in Proceeding of the 2019 IEEE Power and Energy Society Innovative Smart Grid Technologies Conference (ISGT), Washington, DC, USA, February 2019 (IEEE), 1–5. doi:10.1109/ISGT.2019.8791557
Haidar, A. M. A., and Muttaqi, K. M. (2016). Behavioral characterization of electric vehicle charging loads in a distribution power grid through modeling of battery chargers. IEEE Trans. Ind. Appl. 52, 483–492. doi:10.1109/TIA.2015.2483705
Han, S., Han, S., and Sezaki, K. (2010). Development of an optimal vehicle-to-grid aggregator for frequency regulation. IEEE Trans. Smart Grid 1, 65–72. doi:10.1109/TSG.2010.2045163
Hu, J., Yin, W., Ye, C., Bao, W., Wu, J., and Ding, Y. (2021). Assessment for voltage violations considering reactive power compensation provided by smart inverters in distribution network. Front. Energy Res. 9. doi:10.3389/fenrg.2021.713510
Huber, D., De Clerck, Q., De Cauwer, C., Sapountzoglou, N., Coosemans, T., and Messagie, M. (2021). Vehicle to grid impacts on the total cost of ownership for electric vehicle drivers. World Electr. Veh. J. 12, 236. doi:10.3390/wevj12040236
Huda, M., Tokimatsu, K., and Aziz, M. (2020). Techno economic analysis of vehicle to grid (V2G) integration as distributed energy resources in Indonesia power system. Energies (Basel) 13, 1162. doi:10.3390/en13051162
Hussain, M. T., Sulaiman, D. N. bin, Hussain, M. S., and Jabir, M. (2021). Optimal management strategies to solve issues of grid having electric vehicles (ev): A review. J. Energy Storage 33, 102114. doi:10.1016/j.est.2020.102114
Jian, L., Zheng, Y., and Shao, Z. (2017). High efficient valley-filling strategy for centralized coordinated charging of large-scale electric vehicles. Appl. Energy 186, 46–55. doi:10.1016/j.apenergy.2016.10.117
Karfopoulos, E. L., and Hatziargyriou, N. D. (2016). Distributed coordination of electric vehicles providing V2G services. IEEE Trans. Power Syst. 31, 329–338. doi:10.1109/TPWRS.2015.2395723
Karfopoulos, E. L., Panourgias, K. A., and Hatziargyriou, N. D. (2016). Distributed coordination of electric vehicles providing V2G regulation services. IEEE Trans. Power Syst. 31, 2834–2846. doi:10.1109/TPWRS.2015.2472957
Kersting, W. H. (2001). “Radial distribution test feeders,” in Proceeding of the Power Engineering Society Winter Meeting, 2001, Columbus, OH, USA, January 2001 (IEEE).
Khaki, B., Chu, C., and Gadh, R. (2018). “A hierarchical ADMM based framework for EV charging scheduling,” in Proceedings of the IEEE Power Engineering Society Transmission and Distribution Conference, Denver, CO, USA, April 2018 (Institute of Electrical and Electronics Engineers Inc.). doi:10.1109/TDC.2018.8440531
Kisacikoglu, M. C., Ozpineci, B., and Tolbert, L. M. (2013). EV/PHEV bidirectional charger assessment for V2G reactive power operation. IEEE Trans. Power Electron 28, 5717–5727. doi:10.1109/TPEL.2013.2251007
Kou, X., Li, F., Dong, J., Starke, M., Munk, J., Xue, Y., et al. (2020). A scalable and distributed algorithm for managing residential demand response programs using alternating direction method of multipliers (ADMM). IEEE Trans. Smart Grid 11, 4871–4882. doi:10.1109/TSG.2020.2995923
Lenka, R. K., Panda, A. K., Dash, A. R., Venkataramana, N. N., and Tiwary, N. (2021). “Reactive power compensation using vehicle-to-grid enabled bidirectional off-board EV battery charger,” in Proceedings of the ICPEE 2021 - 2021 1st International Conference on Power Electronics and Energy, Bhubaneswar, India, January 2021 (Institute of Electrical and Electronics Engineers Inc.). doi:10.1109/ICPEE50452.2021.9358582
Li, Y., Li, L., Peng, C., and Zou, J. (2019). An MPC based optimized control approach for EV-based voltage regulation in distribution grid. Electr. Power Syst. Res. 172, 152–160. doi:10.1016/j.epsr.2019.03.003
Los Angeles Department of Water and Power (2022). Standard commercial/industrial rates. Available at: https://www.ladwp.com/ladwp/faces/ladwp/aboutus/a-financesandreports/a-fr-electricrates/a-fr-er-stcommindrates?_adf.ctrl-state=1avqk20ve8_46&_afrLoop=657134623103962 (Accessed October 20, 2022).
Meelen, T., Doody, B., and Schwanen, T. (2021). Vehicle-to-Grid in the UK fleet market: An analysis of upscaling potential in a changing environment. J. Clean. Prod. 290, 125203. doi:10.1016/j.jclepro.2020.125203
Mehboob, N., Restrepo, M., Canizares, C. A., Rosenberg, C., and Kazerani, M. (2019). Smart operation of electric vehicles with four-quadrant chargers considering Uncertainties. IEEE Trans. Smart Grid 10, 2999–3009. doi:10.1109/TSG.2018.2816404
Nikkhah Mojdehi, M., and Ghosh, P. (2016). An on-demand compensation function for an EV as a reactive power service provider. IEEE Trans. Veh. Technol. 65, 4572–4583. doi:10.1109/TVT.2015.2504264
Ortega-Vazquez, M. A., Bouffard, F., and Silva, V. (2013). Electric vehicle aggregator/system operator coordination for charging scheduling and services procurement. IEEE Trans. Power Syst. 28, 1806–1815. doi:10.1109/TPWRS.2012.2221750
Pearre, N. S., and Swan, L. G. (2016). Electric vehicle charging to support renewable energy integration in a capacity constrained electricity grid. Energy Convers. Manag. 109, 130–139. doi:10.1016/j.enconman.2015.11.066
Peng, C., Zou, J., Lian, L., and Li, L. (2017). An optimal dispatching strategy for V2G aggregator participating in supplementary frequency regulation considering EV driving demand and aggregator’s benefits. Appl. Energy 190, 591–599. doi:10.1016/j.apenergy.2016.12.065
Pinto, R. J. C., Pombo, J., Calado, M. R. A., and Mariano, S. J. P. S. (2015). “An electric vehicle charging station: Monitoring and analysis of power quality,” in Proceedings - 2015 9th International Conference on Compatibility and Power Electronics, CPE 2015, Costa da Caparica, Portugal, June 2015 (Institute of Electrical and Electronics Engineers Inc.), 37–42. doi:10.1109/CPE.2015.7231046
Ravi, S. S., and Aziz, M. (2022). Utilization of Electric Vehicles for Vehicle-to-Grid Services: Progress and Perspectives. Energies (Basel) 15. doi:10.3390/en15020589
Rivera, J., Goebel, C., and Jacobsen, H. A. (2017). Distributed convex optimization for electric vehicle aggregators. IEEE Trans. Smart Grid 8, 1852–1863. doi:10.1109/TSG.2015.2509030
Tan, O. T., and Thottappillil, R. (1994). Static VAR compensators for critical synchronous motor loads during voltage dips. IEEE Trans. Power Syst. 9, 1517–1523. doi:10.1109/59.336109
Thurner, L., Scheidler, A., Schafer, F., Menke, J. H., Dollichon, J., Meier, F., et al. (2018). Pandapower - an open-source Python tool for convenient modeling, analysis, and optimization of electric power systems. IEEE Trans. Power Syst. 33, 6510–6521. doi:10.1109/TPWRS.2018.2829021
U.S. Department of the Treasury (2022). Treasury releases initial information on electric vehicle tax credit under newly enacted inflation reduction act. Available at: https://home.treasury.gov/news/press-releases/jy0923.
Uddin, K., Dubarry, M., and Glick, M. B. (2018). The viability of vehicle-to-grid operations from a battery technology and policy perspective. Energy Policy 113, 342–347. doi:10.1016/j.enpol.2017.11.015
Wang, D., Coignard, J., Zeng, T., Zhang, C., and Saxena, S. (2016a). Quantifying electric vehicle battery degradation from driving vs. vehicle-to-grid services. J. Power Sources 332, 193–203. doi:10.1016/j.jpowsour.2016.09.116
Wang, Q., Liu, X., Du, J., and Kong, F. (2016b). Smart charging for electric vehicles: A survey from the algorithmic perspective. IEEE Commun. Surv. Tutorials 18, 1500–1517. doi:10.1109/COMST.2016.2518628
Wang, J., Bharati, G. R., Paudyal, S., Ceylan, O., Bhattarai, B. P., and Myers, K. S. (2019). Coordinated electric vehicle charging with reactive power support to distribution grids. IEEE Trans. Ind. Inf. 15, 54–63. doi:10.1109/TII.2018.2829710
Wu, D., Radhakrishnan, N., and Huang, S. (2019). A hierarchical charging control of plug-in electric vehicles with simple flexibility model. Appl. Energy 253, 113490. doi:10.1016/j.apenergy.2019.113490
Xiong, Y., Wang, B., Chu, C., and Gadh, R. (2018). “Electric vehicle driver clustering using statistical model and machine learning,” in IEEE power and energy society (Portland, Or.: General Meeting).
Xydas, E., Marmaras, C., and Cipcigan, L. M. (2016). A multi-agent based scheduling algorithm for adaptive electric vehicles charging. Appl. Energy 177, 354–365. doi:10.1016/j.apenergy.2016.05.034
Yi, Z., Scoffield, D., Smart, J., Meintz, A., Jun, M., Mohanpurkar, M., et al. (2020). A highly efficient control framework for centralized residential charging coordination of large electric vehicle populations. Int. J. Electr. Power Energy Syst. 117, 105661. doi:10.1016/j.ijepes.2019.105661
Yu, S., Du, Z., and Chen, L. (2022). Optimal regulation strategy of electric vehicle charging and discharging based on dynamic regional dispatching price. Front. Energy Res. 10. doi:10.3389/fenrg.2022.873262
Zha, Z., Zhang, X., Wu, Y., Wang, Q., Liu, X., Tang, L., et al. (2018). Non-convex weighted ℓ nuclear norm based ADMM framework for image restoration. Neurocomputing 311, 209–224. doi:10.1016/j.neucom.2018.05.073
Zhang, L., Kekatos, V., and Giannakis, G. B. (2017). Scalable electric vehicle charging protocols. IEEE Trans. Power Syst. 32, 1451–1462. doi:10.1109/TPWRS.2016.2582903
Keywords: EV charging scheduling, V2G, reactive power management, hierarchical ADMM, EV aggregator
Citation: Zhang C, Sheinberg R, Narayana Gowda S, Sherman M, Ahmadian A and Gadh R (2023) A novel large-scale EV charging scheduling algorithm considering V2G and reactive power management based on ADMM. Front. Energy Res. 11:1078027. doi: 10.3389/fenrg.2023.1078027
Received: 23 October 2022; Accepted: 13 April 2023;
Published: 09 May 2023.
Edited by:
Harun Or Rashid Howlader, University of the Ryukyus, JapanReviewed by:
Muhammad Aziz, The University of Tokyo, JapanJimmy Ehnberg, Chalmers University of Technology, Sweden
Copyright © 2023 Zhang, Sheinberg, Narayana Gowda, Sherman, Ahmadian and Gadh. This is an open-access article distributed under the terms of the Creative Commons Attribution License (CC BY). The use, distribution or reproduction in other forums is permitted, provided the original author(s) and the copyright owner(s) are credited and that the original publication in this journal is cited, in accordance with accepted academic practice. No use, distribution or reproduction is permitted which does not comply with these terms.
*Correspondence: Chen Zhang, Y2hlbnpoYW5nOTZAZy51Y2xhLmVkdQ==