 Hu Xiong1
 Zhixiong Liu
- 1Electric Power Research Institute of State Grid Hubei Electric Power Co, Ltd., Wuhan, China
- 2School of Electrical Engineering and Automation, Wuhan University, Wuhan, China
Addressing the overheating fault detection and alarming of insulated busways in buildings, a system based on sensing volatile gases generated by the thermal degradation of the busduct insulation layer was proposed. By monitoring the concentration of volatile gases in the environment, the overheating fault of the busducts can be found early. The thermal degradation process of the busway insulating layer is analyzed, and the pyrolysis characteristic gas at low temperature is studied. The experimental platform has been built, by which the relation between the concentration of volatile gases and temperature of the insulated layer has been studied. By testing, the concentration of volatile organic compounds (VOCs) is proposed as the basis for judging the overheating fault in the alarming system. With the collected samples for training and testing, the AdaBoost classifier is used to identify the overheating fault. Finally, the design of the overheating fault alarming system is given.
1 Introduction
The busway is an efficient high-current conductor and has become very popular in recent years, due to the fact that it can offer the predictable electrical and mechanical characteristics (Wood and McGoldrick, 1985; Rana et al., 2017). Compared with the cable, it has many advantages, such as large current capacity, small voltage drops, strong short-circuit load capacity, high safety, and reliability and it does not burn easily. It is also easy to maintain, with a beautiful appearance. Therefore, it is widely used in the power distribution network, especially in the power supply system of high-rise buildings.
Busway trunkings can be divided into two categories: the air insulated type and the compact insulated type. The busbars of the former are insulated by an air medium, and the latter is covered with an insulating layer. Nowadays, the AC compact insulated busduct trunkings are used in buildings commonly, which replace the traditional cables on a large scale. In the power supply system of buildings, the AC busducts are suitable for three-phase four-wire power supply and distribution system engineering and can work with frequencies of 50–60 Hz, rated voltage of 380 V, and rated current of 250–4000 A.
When the busway is working under overload current, its temperature will increase accordingly. Then, some parts of it, especially the joints, will be seriously overheated. The insulating layer of the busbar may be melted and deformed by high temperatures. Particularly, the aging of the bus insulation layer or the poor factory quality of the insulation layer will speed up this process. If the busway works in an overheated state for a long time, its insulation layer will be physically damaged and the insulation performance will be reduced, which will result in the breakdown of the insulating layer and cause a short-circuit fault, which will cause fire or even explosion, as shown in Figure 1.
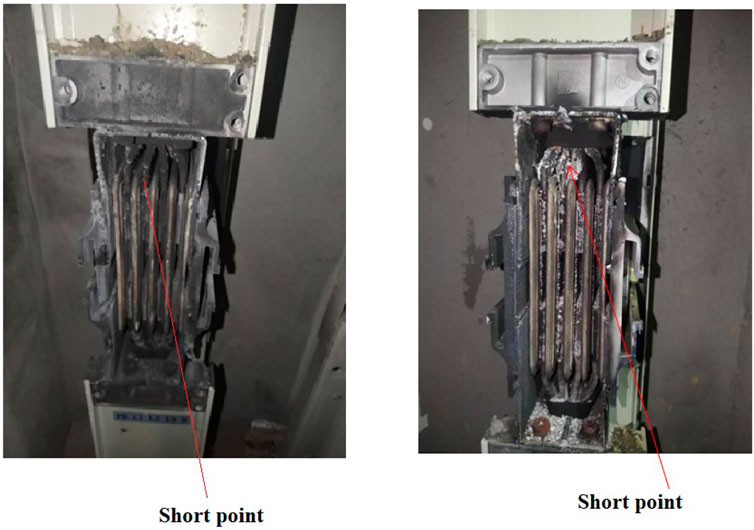
FIGURE 1. Fault busways with short circuit in buildings.
The short circuit caused by overheating will damage the electrical equipment, stop power supply of the building, and cause economic losses. The infrared imager can sense the surface temperature of electrical equipment, which is an effective way for monitoring overheating (Gao et al., 2021; Wang et al., 2021; Chen et al., 2022). During daily patrol inspection, the busduct can be inspected with an infrared imager. However, the working environment of the busway in buildings is relatively narrow, and the field vision of the camera is narrow. For achieving effective detection performance, we need to install many infrared cameras along the busduct trunkings, which is expensive.
Recently, some researchers proposed installing temperature sensors or thermo-couples inside the busduct to measure the inside temperature (Yun, 2013; Xu et al., 2019) and then used wireless or optical fiber communication to send data to the control device for analysis and alarm. However, the compact insulating busduct is a closed structure, its internal parts have been sealed and fixed, and the busbars in it are also wrapped by an insulation layer. If the sensors are installed in it, it will cause structural damage and affect the insulation and conductivity of the busduct. Therefore, it is not an appropriate choice to install temperature sensors inside the busduct.
Installing thermometers in the building wiring room to monitor the ambient temperature is also a choice. However, due to the closed structure of the busduct and the busbar which is wrapped by the insulated side, even the temperature of the busbar is very high, and the temperature rise of the busduct shell is not obvious. According to our testing, when the temperature of the busbar is as high as 130 °C, the busway is in a serious overheating state, but the external temperature of the compact insulated busway is only about 60 °C. Therefore, even if the busduct is overheated, the environmental temperature increase of the building wiring room is not significant. We also cannot get the ideal early warning effect only by monitoring the ambient temperature.
There are some similarities between the busway overheating fault warning study and fire warning study. Over the last decade, many early fire warning technologies have been studied (Fonollosa et al., 2018; Khan et al., 2022; Kuznetsov et al., 2022). Various elements such as image (including the inferred image), temperature, smoke, heat, and gases (CO, CO2, etc.) are detected by multiple sensors and used for decision in fire alarm (Chen and Fu, 2012; Lin and Wang, 2017; Sarwar et al., 2018; Luo et al., 2019; Nakip et al., 2021; Wu et al., 2021; Dai et al., 2022; Kewon et al., 2022; Li et al., 2022). With the development of modern sensor technology, especially the application of high-sensitivity gas sensors in fire alarm systems, we can reduce the false alarms caused by other signal interference and get better accuracy than before. In these fire early warning systems, some machine learning algorithms are used such as Bayesian estimation (Chen and Fu, 2012), Fuzzy theory (Sarwar et al., 2018), Kalman filter (Lin and Wang, 2017), neural network, and deep learning (Kuznetsov et al., 2022) (Luo et al., 2019; Nakip et al., 2021; Wu et al., 2021; Dai et al., 2022; Kewon et al., 2022; Li et al., 2022).
Chen and Fu (2012) elaborated the logic relationship between the fire alarm and the physical–chemical characteristics generated in the process of fire burning and used the Bayesian network (BN) to analyze fire alarm systems. Sarwar et al. (2018) used a multi-sensor solution and presented an intelligent fire monitoring and warning system (FMWS) that is based on Fuzzy logic, which could send alert to the FMWS. Lin and Wang (2017) utilized the real-time sensor data from thermocouple trees in each room and estimated the spread of building fire and forecasted smoke dispersion in real time by Kalman filter. Luo et al. (2019) proposed strategies to make the deep neural network (DNN) model smaller and improve its accuracy for detecting smoke from visual sensors. Nakip et al. (2021) used a recurrent trend predictive neural network for fire detecting based on fusion of multi-sensor readings. Kewon et al. (2022) designed a wireless fire prevention system that can detect and notify the fire risk by detecting the concentration of carbon dioxide (CO2) near the gas stove. Wu et al. (2021) proposed an indoor fire early warning algorithm based on the back propagation (BP) neural network, which fused the data of temperature, smoke concentration, and carbon monoxide, and output the probability of fire occurrence. Li et al. (2022) proposed an indoor fire perception algorithm based on multi-sensor fusion. It extracted the sensor data features by an improved temporal convolutional network (TCN), and the fire classification was realized by the support vector machine (SVM) classifier. Dai et al. (2022) used Yolo v3 to obtain multi-size image information and proposed a flame detection algorithm that is more sensitive to small flames.
In these aforementioned studies, the fire can also be divided into three stages: no fire, smoke, and flame. The smoke stage means the initial fire stage in these studies, so it can provide the chance of taking protective measures to avoid the occurrence and expansion of the fire. However, in our study, the goal is to find the overheating fault of the busduct before it fired or smoked, which is different from the aforementioned fire warning studies.
At present, some studies focus on very early electrical fire detection (before combustion) under low temperature, which is described as follows.
Li (2014) observed the PVC insulation sheath releases gas substances, mainly including plasticizer DOP when the temperature rises to about 150 °C, which can be used as a judgment for early fire detection of PVC cables. Chen and Yi (2019) also analyzed the compositions of the vapors from PVC insulation at different temperatures, conducted gas sensing tests for the main component, and pointed out that DOP could be considered as the signature gas for early detection of PVC cable fires. Han et al. (2019) identified the major volatile species for overheated PVC cables and verified their potential as fire signatures with metal oxide gas sensors, which could effectively detect the cable overheating at an early stage. Nie et al. (2008) utilized chemical sensors for the application of detecting the vapors produced by electrical heating of wire insulation to provide alarm function.
Benes et al. (2004) studied the thermal degradation process in the range 200–340 °C of the PVC cable insulation sample, which is accompanied by the release of HCl,
However, these aforementioned studies mainly focused on PVC cables. Addressing the detection of the overheating fault of compact insulated busducts in buildings, we proposed an overheating fault warning system based on the VOC sensor. VOCs usually refer to organic compounds which are volatile and can participate in atmospheric photochemical reactions. Usually, their boiling point is low and will cause harm to the environment. The basic principle of the proposed method is as follows.
There is an insulating layer which surrounded the busbar conductors in the busduct, and its component is PET (polyethylene terephthalate) film mixed with several different additives, which will be slowly pyrolyzed into gases of different compositions at high temperature. This thermal degradation process will be accelerated as the temperature increases (Dzieciol and Trzeszczy ski, 2001; Dzieciol and Trzeszczyn ski, 1998; Jiang et al., 2018). The wiring room of the building where the busduct is located is a relatively closed environment; then, considering that the temperature rise is a slow process, the concentration of VOCs in the air will increase gradually when the overheating of the busbar lasts for a period of time. As the VOC concentration reaches a certain value and is judged that an overheating fault has been occurred by our suggested algorithm, the alarm system will send a fault alarm signal to the operating staff.
Our study distinguishes itself from previous works in the following aspects:
• The proposed system can distinguish the overheating fault in compact insulated busduct of buildings by using the VOC centration data sampled by sensors, and send alarm message to the operation personnel. Many studies about early fire alarm systems (Wu et al., 2021; Dai et al., 2022; Kewon et al., 2022; Li et al., 2022) can identify the initial fire stage (smoke stage) effectively, by using the CO, CO2, and other sensors. In other words, these mentioned studies are difficult to alarm before combustion, replaced by alarming on the early stage of combustion (smoke) only. In contrast, we designed an alarm system which can detect the overheating fault of busducts before the combustion of the insulating layer.
• The volatile gases generated by thermal degradation of the busbar insulation layer were analyzed by means of a variety of experiments with different sensors selectively. By experiment, we found that CO and CO2 gases are not the typical gases in the early thermal degradation stage before the insulation layer melted. By experiment, the VOC concentration data have been selected as the input of the overheating fault early detecting system we designed.
The rest of the paper is organized as follows: Section 2 studies the thermal degradation of the busbar insulation layer, Section 3 proposes the system architecture, and then, the data feature extraction and the AdaBoost algorithm used are introduced. Section 4 gives the experiment platform and analysis of the results. Finally, conclusions and future work are presented in Section 5.
2 Thermal degradation of the busbar insulation layer
Although the PET film has excellent chemical stability, its physical and chemical properties will be changed by thermal degradation under high-temperature environments, and then, its insulation performance will be reduced accordingly. When the current flowing through the busbar is too large, overheating will occur, especially in the joint of the busbar. As the temperature rises further, this fault will be intensified and finally lead to the damage of the insulating layer.
By experiments, we found that the status of the insulation layer of the busbar could be divided as the following stages: normal, overheat, melted, burn, or explosion with the increase in temperature. After the insulating layer is melted, short circuit will occur, which would lead to an explosion when the current flowing through the busbar is too large. In other words, the insulating layer would be burned when the current is not large enough. The thermal degradation process of the insulation layer of the busbar is shown in Figure 2.
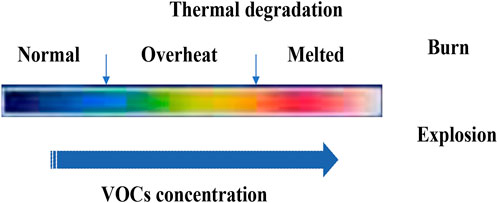
FIGURE 2. Thermal degradation process of the insulation layer.
The goal of our study is to detect the overheating fault of busducts and give alarms to operation personnel. It means we should identify the overheat stage before the insulation layer is melted.
The PET films are widely used in electrical engineering for their excellent insulating performance. The chemical formula of the PET is [OCH2-CH2OCOC6H4CO]. At high temperature, it will pyrolyze to produce various gases. Many studies and experiments have been carried out on the volatile toxic substances emitted within the temperature range 200–700 °C (Dzieciol and Trzeszczy ski, 2001; Dzieciol and Trzeszczyn ski, 1998). Studies have shown that acetaldehyde and formaldehyde are the main degradation products at temperatures 200–300 °C. At higher temperatures (400–700 °C), the decomposition products are very complex, which include carbon oxides, aldehydes, hydrocarbons, and aromatic acids and their esters, which depend on the temperature, atmosphere, or time. In our study about thermal degradation of the busway insulting layer, we face two problems different from these studies:
• The composition of the insulation layer in the busduct is not only PET films. In fact, in order to ensure various properties of the insulating layer, several types of additives are added for getting better performance during the manufacturing of the busduct insulated layer. Moreover, the composition of these additives is slightly different from manufacturer to manufacturer. Therefore, the composition of the insulating layer material is very complex, and its physical and chemical properties are different from those of the commonly used PET films. Consequently, the thermal degradation process of the busbar insulation layer and the volatile substances emitted are different from those of pure PET films, and the compositions of these additives are kept secret by the manufacturers, which makes it difficult to analyze the pyrolysis products by chemical methods.
• Our goal is to detect the overheating fault, that is, the early stage of pyrolysis which is between the normal state and the melted state. Generally, the overheating stage occurs under 200 °C.
In this study, the VOC sensors were used to identify the overheating fault instead of the generally used CO and CO2 sensors in other studies (Chen and Fu, 2012; Fonollosa et al., 2018; Khan et al., 2022) (Luo et al., 2019; Nakip et al., 2021; Wu et al., 2021; Kewon et al., 2022; Li et al., 2022), by a variety of experiments with different sensors selectively. We found that the VOC concentration was significantly changed during the overheating stage when the insulation layer of the busway worked under high temperature.
3 Overheating fault detecting system
3.1 System architecture
An overheating fault alarming system has been designed for the compact insulated busducts of buildings. In the designed system, the VOCs produced by pyrolysis in the thermal degradation of the insulation layer have been measured by sensors and as input of the classification model, which is used to identify the overheating fault of the busducts. Before the classification model is applied, it must be trained and tested with samples to determine its parameters. The train process is shown in Figure 3.
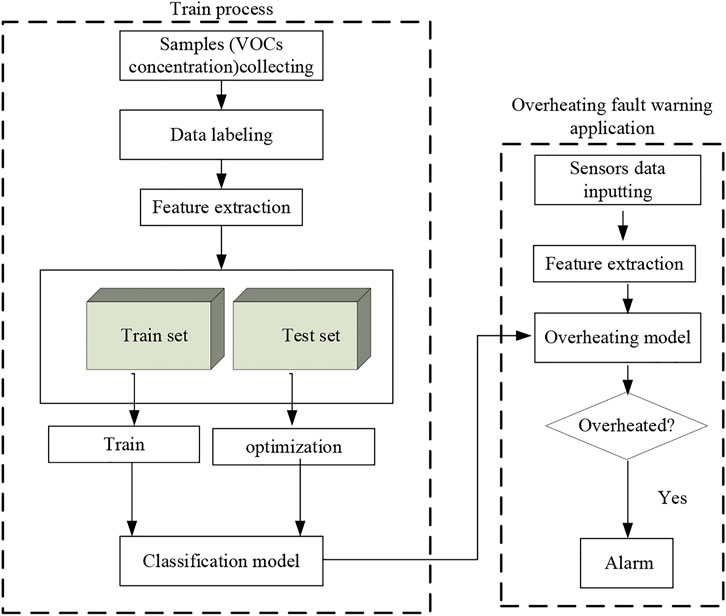
FIGURE 3. System architecture.
First, the collected samples have been labeled as positive and negative samples, and then, features were extracted from the samples to form a feature set. Then, the feature set was divided into a training set and a testing set according to a certain proportion. The training set is used to preliminarily determine the parameters of the model, and the testing set is used to optimize the parameters of the model. During the model testing, the samples of the testing set are input and classified by the trained classifier model and then the output classify results are used to compare with the correct labels, by which the model is evaluated and its parameters could be adjusted accordingly.
In the application system, the data series of various sensors are input into the trained model after feature extraction; finally, the classification results are obtained. If the model judges that it is currently in an overheated state, the system will send an alarm message to the operating staff.
3.2 AdaBoost classifier for overheating identification
The identification of the busduct overheating fault is essentially a two-classification problem in machine learning, that is, identifying the normal state and overheating state. In recent years, many classification algorithms have emerged in machine learning (Xiang et al., 2020), such as KNN (K-nearest neighbor) (Cover and Hart, 1967), SVM (support vector machine) (Schölkopf and Smola, 2002), Naive Bayes (Murphy, 2006), decision tree (Quinlan, 1986), random forest (Breiman, 2001), and AdaBoost (Freund and Schapire, 1995). Among them, AdaBoost has been proven to be extremely successful in generating accurate classifiers, especially, applied to two-classification problems (Zhu et al., 2009).
The AdaBoost algorithm is an iterative algorithm. It trains different classifiers (weak classifiers) for the same training set and then combines these weak classifiers to form a stronger final classifier (strong classifier). An AdaBoost classifier is a meta-estimator that begins by fitting a classifier on the original dataset and then fits additional copies of the classifier on the same dataset but where the weights of incorrectly classified instances are adjusted such that subsequent classifiers focus more on difficult cases. This implementing algorithm generally used is known as AdaBoost-SAMME (Zhu et al., 2009), and its procedure is shown as follows:
1) Initialize the weights
2) For m = 1 to M,
(a) Use the training data to fit a classifier
(b) Compute
(c) Compute
(d) Set
(e) Renormalize
3) Output classifier
where
3.3 Feature extraction of samples
In the early stage of thermal degradation, the concentration of VOCs is small, and it increases gradually with the increase in the busbar temperature, so the time series can better express this process. We use the statistical values of gas concentration from the VOC sensor and its trend values (Wu et al., 2021) as the features input to the model.
Assuming a time series of VOC centration data with length N is
1) The trend value of time series contains the amount of change and the direction of change, which can be obtained by the kendall τ formula:
where n is the discrete time variable, N is the window length, and
In order to better detect the rising and falling trends of fire signals, the kendall τ algorithm can modified as follows (Wu et al., 2021):
where
So, after the aforementioned modification, Eq. 5 is modified as a recursive formula:
Then, the trend value series TR can be obtained from VOC time series G by Eq. 8.
2) The statistical values of
3) The final feature set
So, there are eight features in a dataset used to identify the overheating in the application.
4 Experiment
4.1 Experiment platform
For the study, we built an experimental platform which can provide large current with a maximum of AC 600 A, as shown in Figure 4. The experimental device has a transparent shell, which is a closed structure simulating the wiring room of high-rise buildings. The insulated busduct is placed in the shell. A VOC sensor is installed on top of the cover. During testing, the temperature of the busbar is controlled by adjusting the magnitude and duration of the passing current. When an increasing large current passes through the busbar and lasts a certain time, the insulation layer will be overheated and pyrolyzed gradually. By this means, we can simulate the various overheating statuses by changing the working current of the busduct and collect samples under different statuses.
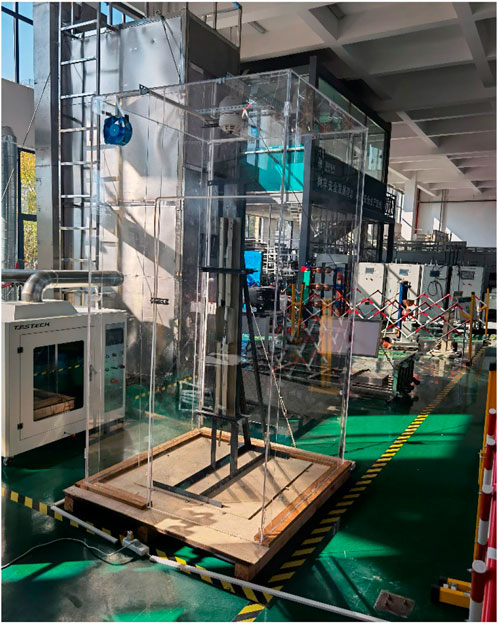
FIGURE 4. Experimental platform.
4.2 Characteristic gas selection
In the experiment, the copper bars in the busduct are 4 mm*20 mm, which are covered with the isolated layer (PET). The rated current of the testing busduct is 200 A. We gradually apply different currents to the busbars from small to large and measure various gases’ concentration by using different sensors. The commonly used detection gases in cable fire studies, such as carbon dioxide, formaldehyde, benzene, hydrogen sulfide, ethylene oxide, chlorine, and ammonia, are all detected in our experiment. We found that the concentrations of these gases had no obvious change both in the normal stage and the overheated stage during the temperature rise. Part of records are shown in Table1.
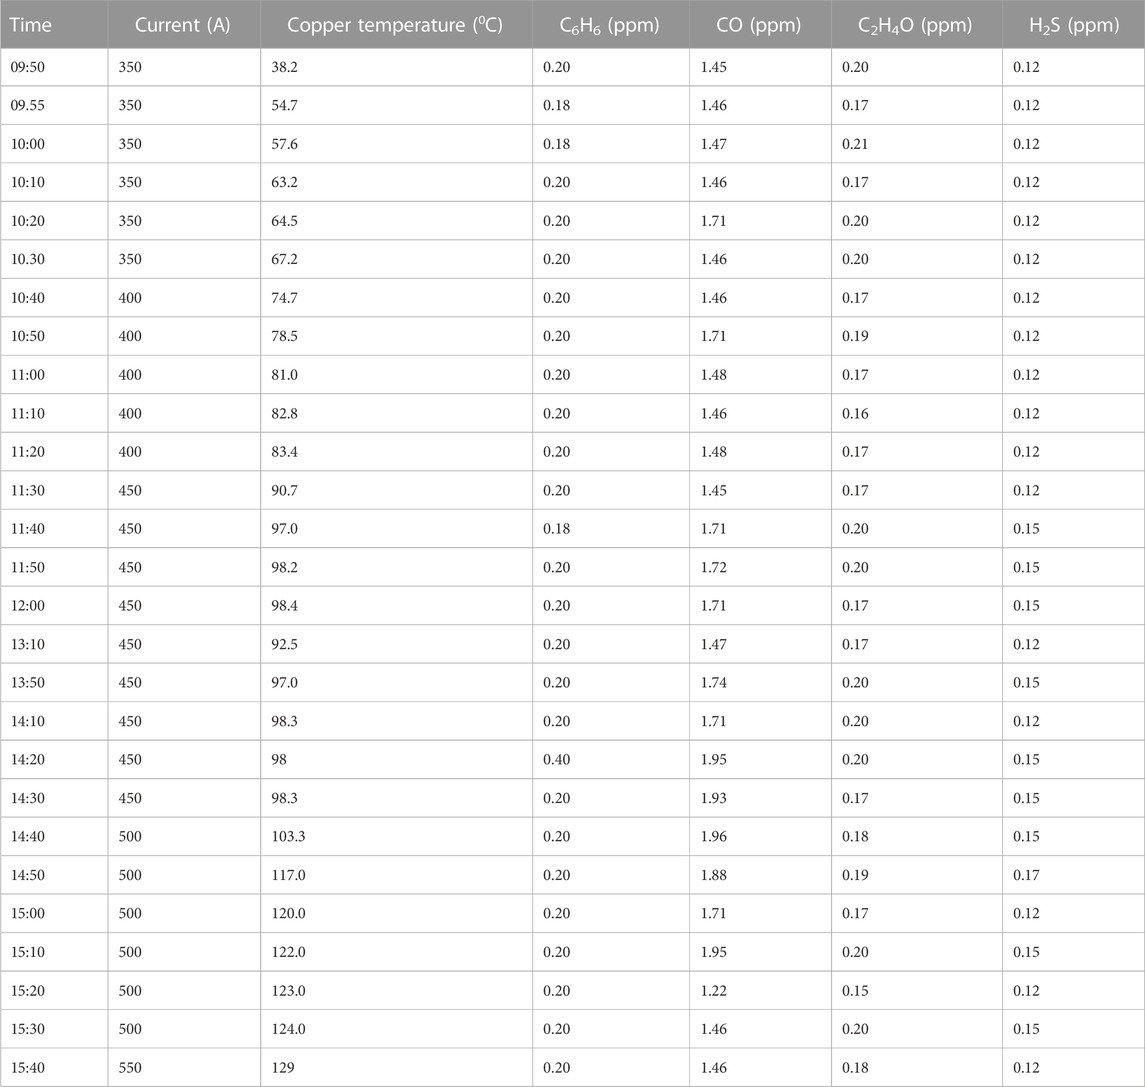
TABLE 1. Part of experiment records.
However, the measured values of the VOC sensor have been changed obviously and regularly during this period. Part of experiment records are described in Figure 5. From time
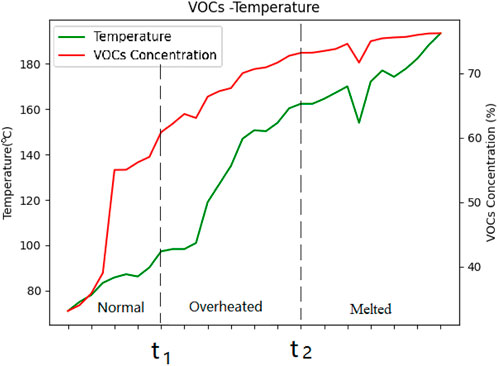
FIGURE 5. VOC concentration and copper temperature.
As shown in Figure 5, with the increase in the current flowing through the busbar, the temperature of the busbar gradually rises, and the concentration of VOCs increases accordingly. It can be divided into three different stages which correspond to different concentrations of VOCs: normal, overheated, and melted. Consequently, we selected VOCs as the characteristic gas for the overheating fault warning study.
4.3 Training and testing
In order to verify the effectiveness of the proposed method, we collected 3,000 samples that include two categories, which correspond to normal condition and overheated condition. The data sampling frequency is 2 s/time, and every five sampled data are grouped as a sample. Then, we labeled these samples and extracted features according to Eqs 6–10. Finally, the sample set has been made for training and testing. In our experiment, 80% of the samples were used as the training set and 20% of the samples were used as the test set.
The programming of the AdaBoost algorithm is available in Scikit-Learn, a powerful machine learning library written in Python. The classifier function is AdaBoostClassifier (), and its main input parameters are n_estimators (int) and learning_rate (float). “n_estimators” represents the maximum numbers of estimators at which boosting is terminated. In case of perfect fit, the learning procedure is stopped early. “learning_rate(C)” is the weight applied to each classifier at each boosting iteration. A higher learning rate increases the contribution of each classifier. There is a trade-off between the “n_estimators” and “learning_rate” parameters. The score results with various parameters are shown in Figure 6. By training and optimization, an average score of 89.2% is obtained when “n_estimators” = 200 and “C” = 0.2. The recognition results are shown in Table 2. Since the overheating stage (early thermal degradation stage) occurs before the melting of the insulating layer, the characteristics are not very obvious, so the identification rate is lower than that of the normal stage.
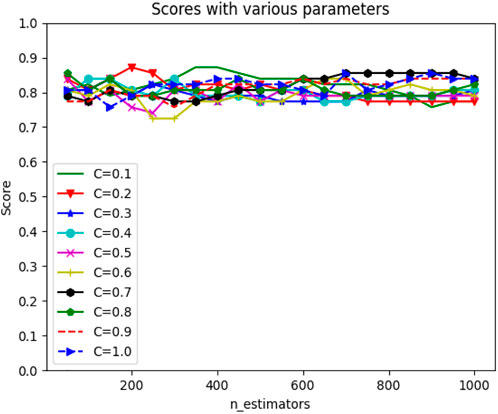
FIGURE 6. Score results of various parameters of AdaBoost.

TABLE 2. Recognition results.
For comparison, other machine learning classification algorithms are used, and the classification accuracies are compared and shown in Figure 7. In our testing, the AdaBoost, KNN, and SVM classifiers have shown higher accuracy than others.
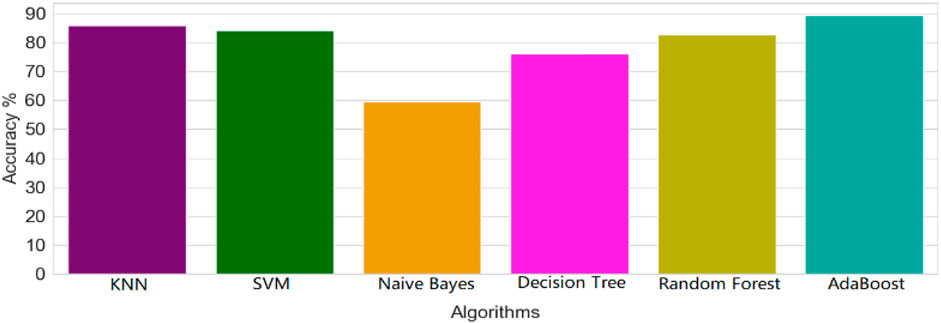
FIGURE 7. Accuracy comparison of different classifiers.
4.4 Application system designed
The overheating fault alarming system is designed as in Figure 8. For the application, we have made a VOC sensing device which integrates a VOC sensor, MCU, and WIFI communication module. In the wiring room of the building, the VOC sensing devices are installed. All VOC data of sensors are sent to the server through the WIFI network. By the VOC data samples collected in the experiment, the AdaBoost model was trained and its parameters were optimized before it was put into practice. After the server has received the VOC contraction data in application, it will use the trained AdaBoost model to output the classification results. If it is judged that an overheating fault has been occurred, it will notify the operating staff through phone call, email, APP, etc. In the designed system, the AdaBoost classifier is used to recognize the overheat status of the busducts.
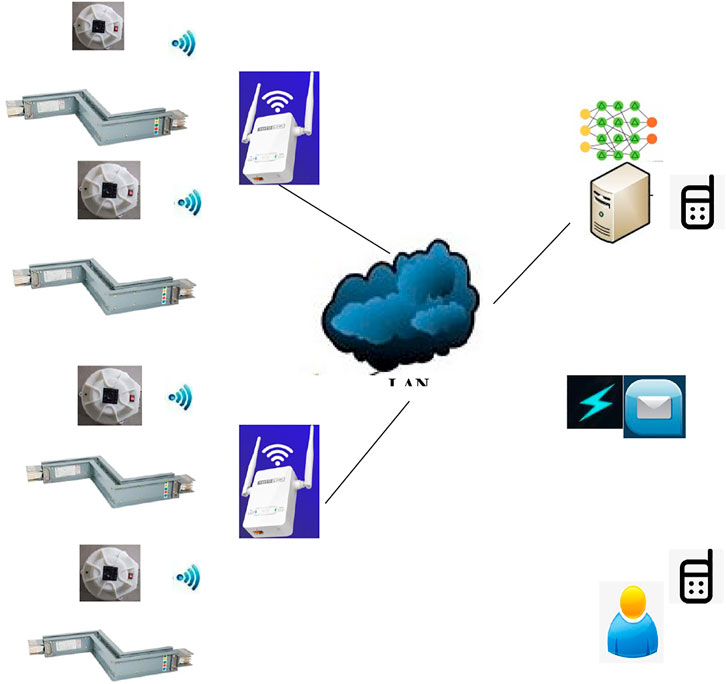
FIGURE 8. Overheating alarm system for busducts.
5 Conclusion and future work
Aiming at the overheating fault warning of compact insulted busways in buildings, this paper proposed a fault warning system based on pyrolysis gases which came from thermal degradation of the busduct insulation layer. Although there are many studies on early warning of fire, little attention is paid to the overheating stage of fire. Few similar studies on cable overheating warning focus on PVC cables (Nie et al., 2008; Li, 2014; Chen and Yi, 2019; Han et al., 2019), but not on busways in buildings. The architecture of the recognition system based on the AdaBoost classification model was designed, and the method of feature extraction was also given. The experimental platform was built, and it is pointed out that VOC gas could be used as the characteristic gas for overheating fault warning by testing. The experimental results showed that the AdaBoost classifier could get high classification accuracy than other commonly used classifiers in machine learning. Finally, the design and implementation of the system are given.
In the future work, the specific chemical components of the thermal decomposition gas will be analyzed in detail by chemical instruments, and more representative characteristic gases will be selected according to the analysis results to improve the identification accuracy. In engineering applications, some problems will continue to be studied, such as the installation location and number of sensors. The proposed method and the designed system are further optimized and improved in practical application.
Data availability statement
The original contributions presented in the study are included in the article/Supplementary Material; further inquiries can be directed to the corresponding author.
Author contributions
This paper is a result of the collaboration of all co-authors. HX was responsible for the research organization and experiment. ZL provided the theory and conceived and revised the manuscript. JL, XJ, WL, and BX helped in testing and analysis.
Conflict of interest
Authors HX, JL, WL, XJ, and BX were employed by the Electric Power Research Institute of State Grid Hubei Electric Power Co., Ltd.
The remaining authors declare that the research was conducted in the absence of any commercial or financial relationships that could be construed as a potential conflict of interest.
Publisher’s note
All claims expressed in this article are solely those of the authors and do not necessarily represent those of their affiliated organizations, or those of the publisher, the editors, and the reviewers. Any product that may be evaluated in this article, or claim that may be made by its manufacturer, is not guaranteed or endorsed by the publisher.
References
Babrauskas, V. (2006). Mechanisms and modes for ignition of low-voltage, PVC-insulated electrotechnical products. Fire Mater. 30 (2), 151–174. doi:10.1002/fam.900
Benes, M., Milanov, N., Matuschek, G., Kettrup, A., Placek, V., and Balek, V. (2004). Thermal degradation of PVC cable insulation studied by simultaneous TG-FTIR and TG-EGA methods. J. Therm. Analysis Calorim. 78 (2), 621–630. doi:10.1023/B:JTAN.0000046123.59857.ad
Chen, J., and Fu, J. (2012). Fire alarm system based on multi-sensor Bayes network. Procedia Eng. 29, 2551–2555. doi:10.1016/j.proeng.2012.01.349
Chen, L., Lin, F., Chen, M., Huang, X., He, R., and Zheng, Y. (2022). Influence for ambient relative humidity and pollution on infrared detection of zero resistance insulators. Front. Energy Res. 8 (17), 942408. doi:10.3389/fenrg.2022.942408
Chen, W., and Yi, J. (2019). Identification and gas sensor testing of volatile signature gas for early detection of PVC cable fires. Fire Saf. Sci. 28 (2), 94–100. doi:10.3969/j.issn.1004-5309.2019.02.04
Cover, T. M., and Hart, P. E. (1967). Nearest neighbor pattern classification. IEEE Trans. Inf. Theory 13 (1), 21–27. doi:10.1109/TIT.1967.1053964
Dai, P., Zhang, Q., Lin, G., Shafique, M. M., Huo, Y., Tu, R., et al. (2022). Multi-scale video flame detection for early fire warning based on deep learning. Front. Energy Res. 10, 848754. doi:10.3389/fenrg.2022.848754
Dzieciol, M., and Trzeszczy ski, J. (2001). Temperature and atmosphere influences on smoke composition during thermal degradation of Poly (ethylene terephthalate). J. Appl. Polym. Sci. 81, 3064–3068. doi:10.1002/app.1757
Dzieciol, M., and Trzeszczyn ski, J. (1998). Studies of temperature influence on volatile thermal degradation products of Poly (ethylene terephthalate). J. Appl. Polym. Sci. 69, 2377–2381. doi:10.1002/(sici)1097-4628(19980919)69:12<2377::aid-app9>3.0.co;2-5
Fonollosa, J., Solórzano, A., and Marco, S. (2018). Chemical sensor systems and associated algorithms for fire detection: A review. Sensors 18, 553. doi:10.3390/s18020553
Freund, Y., and Schapire, R. E. (1995). A desicion-theoretic generalization of on-line learning and an application to boosting. Lect. Notes Comput. Sci. 904, 23–37. doi:10.1007/3-540-59119-2_166
Gao, X., Boecklin, M. V., Ermanoski, I., and Stechel, E. B. (2021). Low-Cost radiant heater for rapid response, high-temperature heating. Front. Energy Res. 9, 652203. doi:10.3389/fenrg.2021.652203
Han, J., Chen, W., Yu, A., and Yi, J. (2019). Detection of semi-volatile plasticizers as a signature of early electrical fire. Front. Mater. 6, 250. doi:10.3389/fmats.2019.00250
Jiang, X., Sun, P., Peng, Q., and Sima, W. (2018). Isothermal relaxation current and microstructure changes of thermally aged polyester films impregnated by epoxy resin. J. Phys. D Appl. Phys. 51, 015306. doi:10.1088/1361-6463/aa9a6e
Kewon, S. J., Park, J. R., Park, C. O., Yoo, H. J., and Ha, S. (2022). Wireless kitchen fire prevention system using electrochemical carbon dioxide gas sensor for smart home. Sensors 22 (11), 3965. doi:10.3390/s22113965
Khan, F., Xu, Z., Sun, J., Ahmed, A., and Zhao, Y. (2022). Recent advances in sensors for fire detection. Sensors 22, 3310. doi:10.3390/s22093310
Kuznetsov, G., Kopylov, N., Sushkina, E., and Zhdanova, A. (2022). Adaptation of fire-fighting systems to localization of fires in the premises: Review. Energies 15 (2), 522. doi:10.3390/en15020522
Li, N. (2014). Study on new electrical fire monitoring technology for low-voltage distribution cabinet. Build. Electr. 33 (7), 26–29. doi:10.3969/j.issn.1003-8493.2014.07.007
Li, Y., Su, Y., Zeng, X., and Wang, J. (2022). Research on multi-sensor fusion indoor fire perception algorithm based on improved TCN. Sensors 22 (12), 4550. doi:10.3390/s22124550
Lin, C., and Wang, L. (2017). Real-time forecasting of building fire growth and smoke transport via ensemble Kalman filter. Fire Technol. 53 (3), 1101–1121. doi:10.1007/s10694-016-0619-x
Luo, S., Zhang, X., Wang, M., and Xu, J. H. (2019). A slight smoke perceptual network. IEEE Access 7, 42889–42896. doi:10.1109/ACCESS.2019.2906695
McNeil, L. C., Memetea, L., and Cole, W. J. (1995). A study of the products of PVC thermal degradation. Polym. Degrad. Stab. 49 (1), 181–191. doi:10.1016/0141-3910(95)00064-S
Nakip, M., Guzelis, C., and Yildiz., O. (2021). Recurrent trend predictive Neural Network for multi-sensor fire detection. IEEE Access 9, 84204–84216. doi:10.1109/ACCESS.2021.3087736
Nie, M., Stetter, J. R., and Buttner, W. J. (2008). Orthogonal gas sensor arrays with intelligent algorithms for early warning of electrical fires. Sensors Actuators B 130, 889–899. doi:10.1016/j.snb.2007.10.070
Quinlan, J. R. (1986). Induction of decision trees. Mach. Learn. 1 (1), 81–106. doi:10.1007/bf00116251
Rana, B., Mallick, P., and Rana, T. K. (2017). “Efficient and superior elbow joint for high power busway trunking System,” in In proceedings of the 8th Annual Industrial Automation and Electromechanical Engineering Conference (IEMECON), Bangkok, Thailand, 16-18 August 2017.
Sarwar, B., Bajwa, I. S., Ramzan, S., Ramzan, B., and Kausar, M. (2018). Design and application of fuzzy logic based fire monitoring and warning systems for smart buildings. Symmetry 10, 615. doi:10.3390/sym10110615
Schölkopf, B., and Smola, A. J. (2002). Learning with kernels: Support Vector Machines, regularization, optimization and beyond. adaptive computation and machine learning. Cambridge, MA: MIT Press.
Wang, H., Wang, B., Li, M., Luo, P., Ma, H., and Ma, F. (2021). Insulator contamination perception based on feature fusion of infrared image and meteorological parameters. Front. Energy Res. 9, 746378. doi:10.3389/fenrg.2021.746378
Wood, R. H., and McGoldrick, G. A. (1985). Busway short circuit testing procedures. IEEE Trans. Industry Appl. 21 (4), 873–875. doi:10.1109/TIA.1985.349534
Wu, L., Chen, L., and Hao, X. (2021). Multi-sensor data fusion algorithm for indoor fire early warning based on BP neural network. Information 12, 59. doi:10.3390/info12020059
Xiang, B., Liu, Z., and Zhang, K. (2020). Flagging implausible inspection reports of distribution transformers via anomaly detection. IEEE Access 8, 75798–75808. doi:10.1109/ACCESS.2020.2989330
Xu, Q., Xie, W., Jiang, S., Zeng, C., and Jiang, D. (2019). A wireless sensor dynamic sampling strategy for monitoring temperature rise signals of busway. Power Syst. Prot. Control 47 (8), 106–112. doi:10.7667/PSPC180541
Yun, Q. (2013). Design of fiber distributed busway temperature monitoring system. Adv. Mater. Res. 694-697, 1114–1117. doi:10.4028/www.scientific.net/amr.694-697.1114
Keywords: compact insulated busway, thermal degradation, overheating fault, AdaBoost, alarming
Citation: Xiong H, Li J, Li W, Jiang X, Xiang B and Liu Z (2023) Overheating fault alarming for compact insulated busways in buildings by gas sensing. Front. Energy Res. 11:1091298. doi: 10.3389/fenrg.2023.1091298
Received: 06 November 2022; Accepted: 03 February 2023;
Published: 15 February 2023.
Edited by:
Meng Yen Shih, Autonomous University of Campeche, MexicoReviewed by:
Ravi Samikannu, Botswana International University of Science and Technology, BotswanaJianquan Zhu, South China University of Technology, China
Copyright © 2023 Xiong, Li, Li, Jiang, Xiang and Liu. This is an open-access article distributed under the terms of the Creative Commons Attribution License (CC BY). The use, distribution or reproduction in other forums is permitted, provided the original author(s) and the copyright owner(s) are credited and that the original publication in this journal is cited, in accordance with accepted academic practice. No use, distribution or reproduction is permitted which does not comply with these terms.
*Correspondence: Zhixiong Liu, enhsaXVAd2h1LmVkdS5jbg==