 You Lv
 Ruijun Qin
 Hao Sun
 Ziming Guo2
- 1State Key Laboratory of Alternate Electrical Power System with Renewable Energy Sources, North China Electric Power University, Beijing, China
- 2School of Control and Computer Engineering, North China Electric Power University, Beijing, China
Energy storage technology can effectively solve the problems caused by large-scale grid connection of renewable energy with volatility and uncertainty. Due to the high cost of the energy storage system, the research on capacity allocation of energy storage system has important theoretical and application value. In this paper, an optimization method for determining the capacity of energy storage system for smoothing the power output of renewable energy is proposed. First, based on the actual data of Ulanqab, the output characteristics of wind power and photovoltaic power generation are studied, and the K-means algorithm is used to select typical days. Then, the energy storage configuration model is built according to the objective function and constraints. Finally, genetic algorithm is used to solve the optimization model, obtain the corresponding parameters, and complete the configuration of energy storage capacity. Based on the results of renewable energy spectrum analysis, the minimum capacity of the energy storage system that meets the constraint of target power output volatility after compensation by the energy storage system can be optimized. The simulation results show that at 1 and 10 min, the flattened volatility is about 2% and 5%, while the actual penetration volatility is about 20% and 30%. The volatility of the optimized model is greatly reduced, which proves the effectiveness of the proposed strategy.
1 Introduction
Due to the rapid use and pollution of fossil fuels, how to achieve carbon neutrality has become an issue of global engagement. Wind and solar energy are renewable resources that currently contain large amounts of energy. The networked operation of wind power and photovoltaic power generation is an effective way to achieve large-scale development of renewable energy. However, the fluctuation and intermittency of wind power have a significant adverse effect on its connection to the grid, which limits the ability of large-scale renewable energy to connect to the grid. Therefore, on the premise of ensuring the safe and stable operation of the power grid, how to absorb renewable energy on a large scale has become an urgent problem to be solved (Li et al., 2021).
The energy storage system can charge and discharge by itself, which provides an effective means to smooth the output fluctuation of renewable energy and improve the ability to connect to the grid. Ref. (Ramseebaluck, 2019) proposed a hybrid model of rural sites in sub-Saharan Africa (Neeru and Boipuso) using HOMER. Six configurations of locally available energy at each site were considered in the analysis, including solar photovoltaics, wind turbines, batteries for storage, and diesel generators for backup. Ref. (Mishra et al., 2023) proposed model consists of local renewable sources i.e., solar and biomass along with batteries for storage purposes. The major objectives of the study are to optimize the sizing of PV panels and batteries with power sales or purchases from the grid. Ref. (Lawal, 2015) proposed a hydro energy based hybrid system for the rural area, of which the optimization was carried out using HOMER. The Pico hydro system was combined with a solar photovoltaic system for providing the supply. Ref. (Soliman et al., 2021) provides a new energy management control technique for a smart DC-microgrid based on a combined fuzzy logic controller and high-order sliding mode methods. The hybrid energy provider integrated into the DC microgrid is made up of a battery bank, wind energy, photovoltaic energy, and tidal energy sources. Ref. (Alahmadi et al., 2021) proposes an intelligent energy management controller based on combined fuzzy logic and fractional-order proportional-integral-derivative controller methods for a smart DC microgrid. The configurations consist of solar PV, wind turbine, and battery for storage. However, current energy storage systems are expensive, so the research on the capacity configuration of energy storage systems has important theoretical and applied value (Kabeyi and Olanrewaju, 2022).
There has been much research on the capacity allocation strategy of energy storage with renewable energy at home and abroad. Most of the current studies focus on the capacity configuration of energy storage systems from an economic perspective. Ref. (Feng, 2019) evaluates the economy of energy storage projects based on the actual operation data of photovoltaic power stations. A whole life cycle cost model for energy storage was developed in Ref. (Meiqin et al., 2021). A risk management approach is considered in Ref. (Sadeghian et al., 2020), which leads to a study of the optimal capacity of the energy storage system in terms of cost and reliability. In Ref. (Ghaffari et al., 2022), in addition to power losses and energy storage system cost, flicker emission and voltage deviation are also minimized in the objective function. Ref. (Zhang et al., 2022) considers the energy storage configuration scheme of comprehensive demand response according to the real-time market tariff scheme. Ref. (Sun et al., 2023) aims to achieve the lowest operating cost of the distribution network and construct the allocation model by considering the generalized demand-side resources. In Ref. (Paliwal, 2021), the energy storage configuration model is established based on butterfly particle swarm optimization algorithm. The goal is to minimize the economic parameter called the equilibrium cost of energy. The expected unserved energy is used as a reliability constraint. Such a configuration would achieve maximum cost savings, but it does not consider the risks of large-scale access to renewable energy, which is volatile and intermittent.
There are also many ways to consider smoothing the volatility of renewable energy for the current configuration of energy storage capacity, mainly by decomposing renewable energy output by frequency and predicting renewable energy output. In Ref. (Makarov et al., 2012), the sliding average method is used to determine the grid-connected power of wind power and extract the hybrid energy storage output, and the low-frequency and high-frequency fluctuation components of the battery and supercapacitor are reasonably distributed by wavelet packet decomposition. In Ref. (Shen et al., 2023), the wind power output frequency is decomposed to build the configuration model of energy storage capacity by combining the decomposition methods of integrated empirical modal decomposition and empirical modal decomposition. In Ref. (Lamsal et al., 2018), the discrete Kalman filter method is used to predict the renewable energy output, so as to evaluate the capacity of the required energy storage system. In Ref. (Wang et al., 2021), the high-dimensional prediction error of multiple wind farms is considered based on the copula theory, which leads to the capacity allocation of the energy storage system. In Ref. (Zhang et al., 2016), Monte Carlo simulation was used to model the uncertainty of wind power output and system load, so as to optimize and determine the location and capacity of BESS while ensuring the level of wind power utilization. Ref. (Ahmad et al., 2020) discretized the continuous joint power distribution of wind farms and combined it with multi-objective hybrid particle swarm optimization and non-dominated sorting genetic algorithm to optimize the optimal position and capacity of the energy storage system. Ref. (Jamroen et al., 2019) presents a simulation analysis of the PV power smoothing method based on hull enhanced linear exponential smoothing technique using an energy storage system. However, the time-frequency analysis methods, such as low-pass filtering, EMD decomposition, discrete Fourier transform and so on, commonly used in the above research still have shortcomings in maintaining the security, reliability and economy of the power grid, and there are mode aliasing and other conditions, which need to be further improved.
Specifically, the contribution of this paper is to establish an energy storage allocation strategy to limit the volatility of renewable energy, which can effectively improve the economy and sustainable performance of the system. Energy storage technology can effectively solve the problems caused by large-scale grid connection of renewable energy with volatility and uncertainty. Due to the high cost of the energy storage system, the research on capacity allocation of energy storage system has important theoretical and application value. In this paper, an optimization method for determining the capacity of energy storage system for smoothing the power output of renewable energy is proposed. Based on the results of renewable energy spectrum analysis, the minimum capacity of the energy storage system that meets the constraint of target power output volatility after compensation by the energy storage system can be optimized. The remainder of the paper is organized as follows. Models for the wind-solar-storage combined system and renewable energy power generation characteristics are discussed in Section 2. The proposed optimization problem formulation for selecting typical days and sizing energy storage capacity allocation is given in Section 3. Case studies are presented in Section 4, and concluding remarks are discussed in Section 5.
2 System and characteristic analysis
2.1 Wind-solar-storage combined system model
When the energy storage device realizes the stabilization effect of the new energy output, it can operate with a single unit or coordinate control with the entire field group. The change of position can cause the stabilization effect or the configuration power and configuration cost. However, due to the energy storage system, compared with a single wind turbine or a single wind farm, the total capacity required for coordinating with the farm group is smaller, the effect is more obvious and the overall maintenance and control of the system are convenient (Dirin et al., 2023). This simulation combines the energy storage system with wind power and photovoltaic field groups are connected to the same bus, as shown in Figure 1.
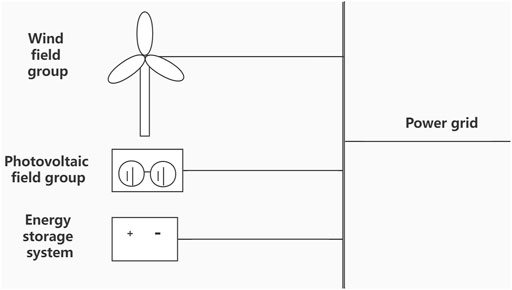
FIGURE 1. Diagram of wind-solar-storage system structure.
This paper is based on the establishment of a model in a certain area in Ulanqab City, in which the total installed capacity of wind farms is 149 MW and of photovoltaic field groups is 100 MW.
2.2 Wind power output characteristics
Ulanqab, a prefectural-level city in Inner Mongolia Autonomous Region, is located in the north of China, in the middle of Inner Mongolia Autonomous Region, with a total area of about 54,500 square kilometers. Its climate has four distinct seasons, cold winter with less snow, dry and windy spring, cool summer, and cool frosty autumn.
The annual distribution curve of daily power generation based on the 2020 wind farms in the Ulanqab area is shown in Figure 2, and the typical sunrise power curve in each season is shown in Figure 3. According to Figure 1, wind power output in a certain area of Ulanqab City is fluctuating, uncertain, and intermittent. The daily minimum total power generation is 4985 MW and the maximum total power generation is 84,230 MW, which is a difference of nearly 20 times. Its daily total power generation is also indescribable.
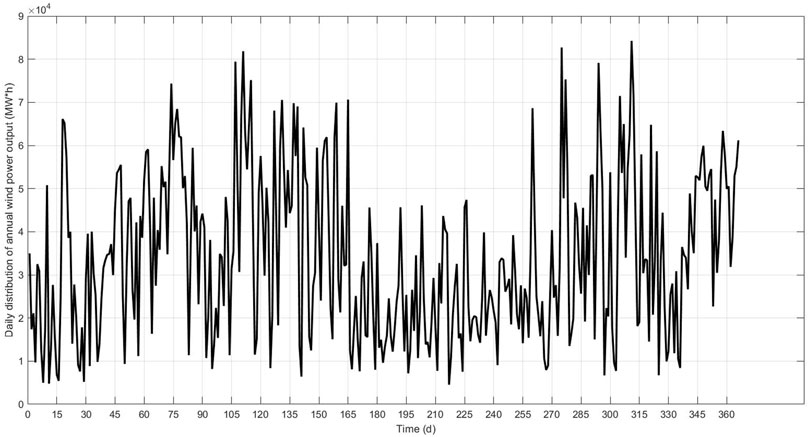
FIGURE 2. Daily distribution of wind power along a year.
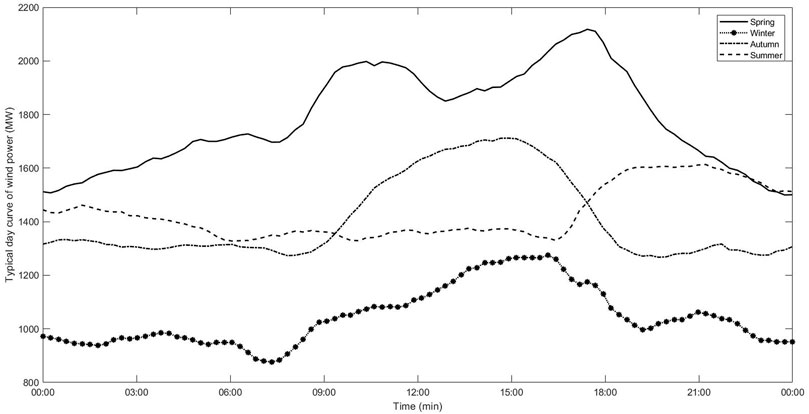
FIGURE 3. The typical curve for each season of wind power.
According to Figure 3, the typical daily wind power output varies from season to season. There are mainly two periods of high wind power output in spring, from 9:00 am to 12 noon and 3:00 pm to evening. The period of small wind power output is mainly from night to early morning. In summer, the wind power output period is from the evening, and the output during the rest period is close and small. During the autumn and winter seasons, the wind power output is relatively large during the daytime, and the trend of change is also roughly the same. In comparison, the power generation in spring is the largest among the four seasons, summer and autumn are roughly similar, and winter is the season with the least power generation.
2.3 Photovoltaic output characteristics
According to the survey, the annual average total solar radiation of Ulanqab is 5,500–6200 MJ/m2, the accumulated temperature greater than or equal to 10°C is 2,228–3,033°C, and the annual average sunshine hours are 2,775–3,080 h.
The annual distribution curve of daily power generation based on the PV field group in the Ulanqab area in 2020 is shown in Figure 4, and the typical sunrise force curve in each season is shown in Figure 5. According to Figure 4, PV output in a certain area of Ulanqab city also has volatility and uncertainty. The minimum total daily power generation is zero, and the maximum total daily power generation is 6477 MW, with a large difference. However, compared with wind power output, photovoltaic power generation is smaller but more stable, with daily power generation fluctuating between 4,000 MW and 7,000 MW except in rainy or extreme weather conditions.
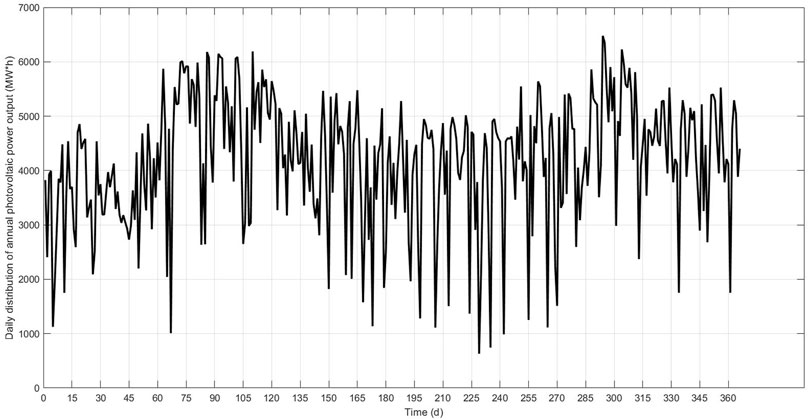
FIGURE 4. Daily distribution of photovoltaic power along a year.
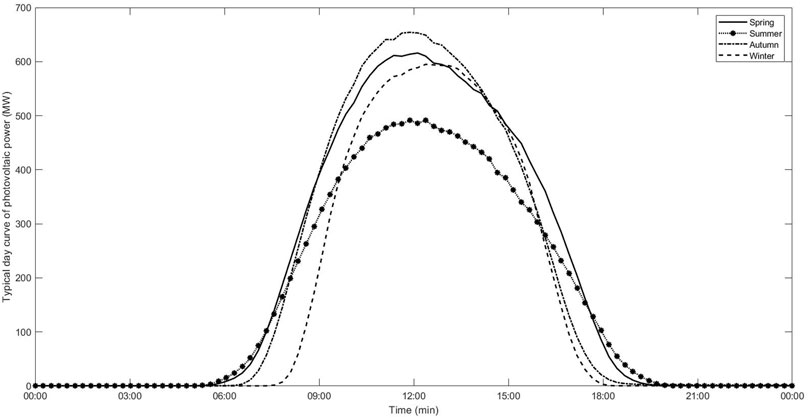
FIGURE 5. Typical day curve of photovoltaic power.
According to Figure 5, the typical daily PV output of the four seasons is concentrated in the period from sunrise in the morning to sunset, and the maximum power is generated at noon. Because high temperatures will lead to component power loss, although summer has the longest illumination time, the most abundant illumination, and the largest intensity, the instantaneous power and generation are far less than spring and autumn, and even less than winter.
3 Mathematical model
3.1 Typical day selection
Different eras have different methods for how to classify and select typical. In the past, people often classified input data according to the actual meaning of parameters or life and production experience. Today, with the continuous increase of data, when the correlation between input and output is difficult to directly see, clustering technology emerges as the times require.
Clustering analysis technology belongs to the unsupervised learning in artificial intelligence technology, that is, the data of unlabeled samples are automatically grouped to discover their spatial distribution characteristics, laws, and other natural structures. Clustering refers to dividing the total sample set into different sets, which can be divided into different clusters (classes) according to the distance (Euclidean distance, Manhattan distance, etc.) or similarity between the data, and each element in each cluster. There are obvious similar characteristics between each other, and elements in different categories have obvious different characteristics from each other.
At present, clustering has been widely used in the field of data classification and processing. The research of clustering algorithms mainly includes three aspects: technology, data, and derivative problems. Technical research refers to how to use algorithms to divide data. Data research refers to the research on the differences between measures and rules due to the differences in data types. The research on derived problems mainly includes whether the data can be clustered, how to select cluster features, how to visualize, and how to perform cluster verification.
In this typical day selection, the output of wind turbines and the output of photovoltaic units in each season are divided by clustering algorithms. Among the clustering algorithms, the K-Means algorithm has the advantages of being relatively simple and with high efficiency for large-scale data sets (Mingoti and Lima, 2006; Zhao et al., 2022). The K-Means algorithm is a hard clustering algorithm, and the number of values is only 0 or 1. The algorithm mainly uses the error sum of squares criterion function as the core rule. First, set K (the number of clusters) arbitrarily from the N data feature vector sets as the initial center, and then calculate the distance between the center and the data according to the rule and use this as a basis to re-classify and update the center, and iterate repeatedly until the evaluation index constant. Its flow chart is shown in Figure 6.
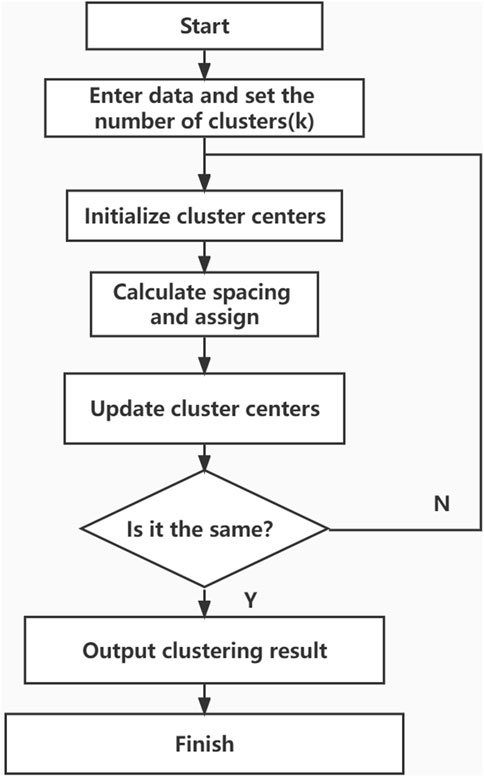
FIGURE 6. Flowchart of K-means algorithm.
The specific implementation steps are as follows:
(1) Initialization.
K points
(2) Calculation and judgment.
Calculate the interval from each data feature point to the cluster center. According to the rule, determine which cluster each point belongs to. When the data point is included in the ith class, the weight
where,
(3) Update cluster midpoints.
(4) Calculate the evaluation index J.
If J remains unchanged, the clustering results have stably converged to this category, and the iteration can be ended; if the evaluation index has a significant change, continue the iteration and update the cluster center point.
Therefore, the relevant data of Ulanqab City can be selected for typical days and the relevant output curves of the typical days described in Section 2 can be obtained.
3.2 Objective function
As described in Section 2, the power system structure connected to the energy storage system is a wind farm cluster, photovoltaic field cluster, and energy storage system are connected to the same bus and then sent to the power grid.
where, i is the sampling time,
According to research, the fluctuation coefficient can be defined as the ratio between the change value of grid-connected power and the change value of new energy output power at a certain moment, namely:
where,
In this paper, the genetic algorithm is adopted to select the optimal fluctuation coefficient corresponding to each moment, to achieve the goal of reducing the rated capacity of the required energy storage equipment under the condition of meeting the national new energy grid power fluctuation index, to reduce the energy storage cost and improve the economic benefits. Therefore, the main objective function of this model is to obtain the minimum variance between grid-connected output and the actual output of new energy, namely:
where,
In addition, it is necessary to ensure the sustainability of the energy storage system. Therefore, a secondary objective function is established to make the daily initial electric quantity equal to the daily final electric quantity as much as possible, namely:
where,
3.3 Constraints
New energy power generation is different from conventional energy power generation due to the resource characteristics of scenery. As described in Section 2, wind power has strong randomness and obvious intermittence, and the electric energy incorporated into the power grid has a large fluctuation range and irregular fluctuation frequency, which will lead to voltage and frequency fluctuation of the power grid. A large proportion of new energy connected to the grid will have a certain degree of negative impact on the safe and stable operation of the grid. Based on this issue, China has clarified the constraints on the fluctuation index of grid-connected power of generation, as shown in Table 1.

TABLE 1. Grid-connected power fluctuation index of China.
According to the index constraints on volatility in China, this study puts forward the following two limiting conditions:
(1) Volatility per minute shall not exceed 2% of system installed capacity.
(2) Volatility should not exceed 15% of installed capacity every 10 minutes.
where,
4 Case studies
4.1 Solution process
Genetic algorithms simulate the phenomena of replication, natural selection and crossover, and variation in heredity. It starts from each original population and creates a group of individuals that are more suitable for the environment through random selection, crossover, and mutation operation, so that the population develops into a better and better area in the search room to obtain high-quality solutions to the problem. The process is shown in Figure 7.
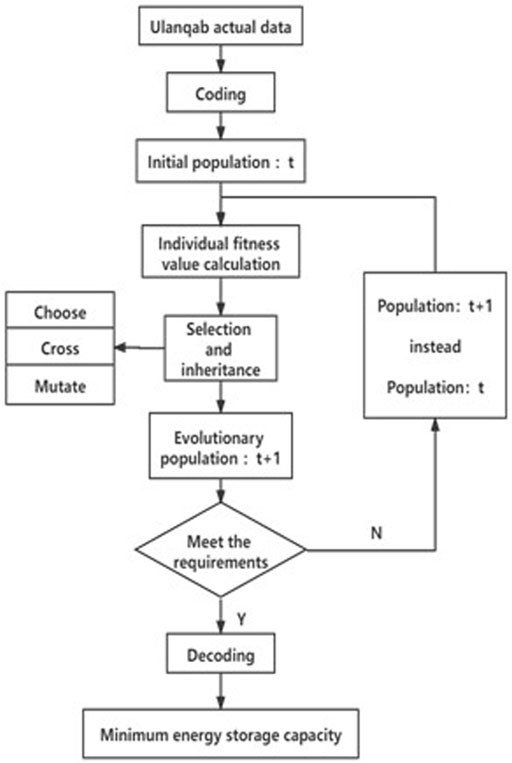
FIGURE 7. Genetic algorithm flow chart.
4.2 Results and discussion
The new energy power generation system in a certain area of Ulanqab is selected as the analysis object. The installed capacity of the wind farm cluster and photovoltaic field cluster of this system are 149MW and 100 MW respectively. The scheduling cycle is 96 periods a day, 15 min each period. Based on the form of generating burrs from the original data, the model was expanded to 1,440 sections, and the model was solved according to Figure 6. The population size is set to 30, the number of iterations is set to 200, the code is binary code, the length is 10, the crossover probability is 60%, and the mutation probability is 10%. The solution results are given as follows.
As shown in Figure 8, curves in different colors represent the actual output of new energy and the target grid-connected output respectively. The grid-connection curve after leveling is obviously smoother with smaller fluctuation. In order to better reflect the leveling effect of this strategy, the optimized grid-connection fluctuation rate and the actual new energy output fluctuation rate in 1 min and 10 min are respectively compared, as shown in Figure 9.
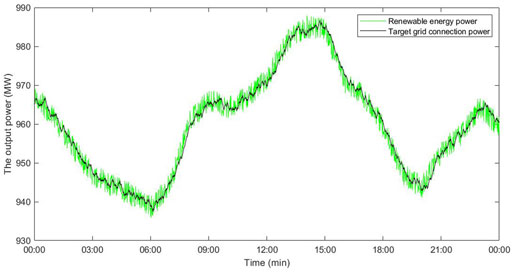
FIGURE 8. Renewable energy grid-connected target output curve.

FIGURE 9. Volatility comparison chart.
According to Figure 9, after suppression, the volatility is about 2% and 15% at 1 min and 10 min respectively, while the actual network entry volatility is about 20% and 30%. After optimization of this model, the volatility is greatly reduced, so this model has certain effectiveness. Charge and discharge power of the energy storage system is shown in Figure 10.
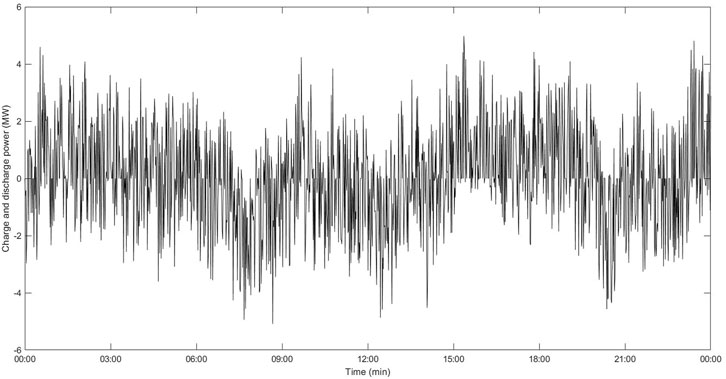
FIGURE 10. Charging and discharging power curve.
The genetic algorithm was used to search iteratively for optimization, and the convergence diagram of the optimal solution of the objective function was shown in Figure 11. The optimal solution was found by traversing 51 times.
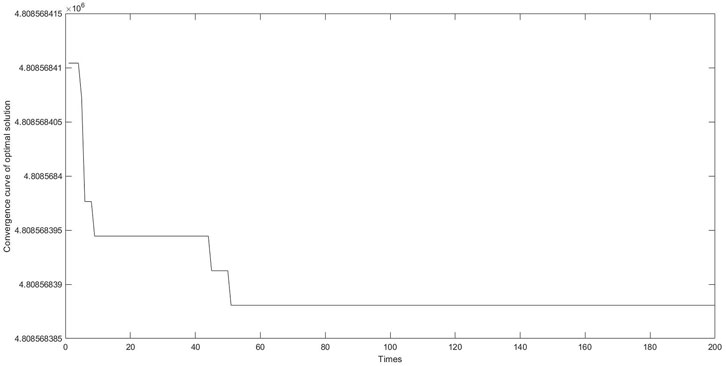
FIGURE 11. Optimal solution convergence graph.
As shown in Table 2, the energy storage system solved by the model has the following configuration parameters. The results show that the rated capacity of the required energy storage system is 6.6706 MW*h. The required energy storage system has a rated power of 5.084 MW.
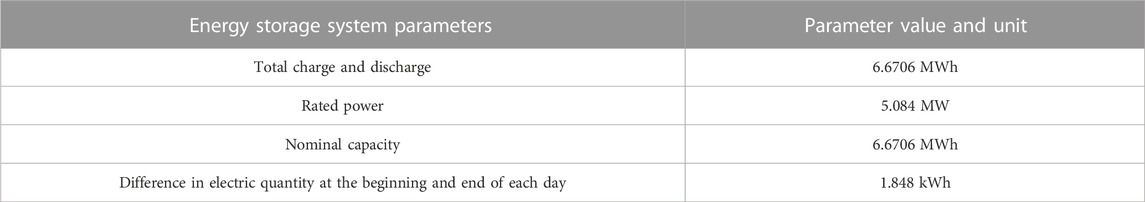
TABLE 2. Energy storage system configuration parameters.
Based on the results of renewable energy spectrum analysis, the minimum capacity of the energy storage system that meets the constraint of target power output volatility after compensation by the energy storage system can be optimized. The volatility of the optimized model is greatly reduced, which proves the effectiveness of the proposed strategy. Although this paper has made some progress in the research of energy storage configuration strategy, control strategy is also an important part of the operation of energy storage system. Only by combining the two can energy storage system achieve optimal utilization. The operation mode of energy storage system will be further studied in the future.
5 Conclusion
Based on the measured data of wind and solar output in a certain area of Ulanqab City, this paper proposes a new energy storage allocation strategy by analyzing the characteristics of the total output of wind farms and photovoltaic farms and the typical daily output curve of each season, which can stabilize the fluctuation of new energy grid-connected output.
After analyzing the characteristics of wind power output and photovoltaic output in a certain area of Ulanqab in 2020, it is found that there are fluctuations, uncertainty and intermittency. The minimum total daily power generation of wind power is 4985 MW, and the maximum total power generation is 84,230 MW, fluctuating wildly. In addition to the analysis of the overall output characteristics, the wind power output and photovoltaic output of a typical day in each season are also analyzed. The algorithm chosen for a typical day is the K-means algorithm. The analysis shows that the wind power output is the largest in spring and smaller in summer. The photovoltaic output is larger in spring and autumn and smaller in summer. For wind power output, photovoltaic output is generally small and relatively regular.
While achieving the smallest configuration energy storage capacity, the new energy storage allocation strategy has the ability to work continuously for a long time, and make the wind and solar active power output fluctuation as small as possible and meet the national new energy grid-connected fluctuation index. After the model is established, it is solved and simulated by genetic algorithm to obtain the required parameters. The effectiveness of the proposed strategy is proved by comparing the grid-connected power curves before and after optimization. In order to further verify the validity of the model, the optimized grid-connected volatility and the actual new energy output volatility within 1 min and 10 min were compared. The results show that the rated capacity of the required energy storage system is 6.6706 MW*h. The required energy storage system has a rated power of 5.084 MW. After stabilization, the volatility is about 2% and 15% at 1 min and 10 min, respectively. After the optimization of the model, the volatility is greatly reduced, which provides new ideas for energy storage to stabilize the volatility of renewable energy.
Through retrospective analysis, this work basically provides a new method for optimal configuration of energy storage to smooth out the volatility of wind power and photovoltaic active power grid connection. In future work, transmission system models will also be considered to ensure the feasibility of energy storage capacity allocation and energy storage power allocation. In addition, a stochastic approach that takes into account future demand and power generation forecasts will be adopted to better face the complex and changing power generation environment.
Data availability statement
The original contributions presented in the study are included in the article/supplementary materials, further inquiries can be directed to the corresponding authors.
Author contributions
YL, RQ, HS, ZG, FF, and YN contributed to conception and design of the study. HS and ZG processed data. YL and YN performed the statistical analysis. RQ wrote the first draft of the manuscript. All authors contributed to manuscript revision, read, and approved the submitted version.
Funding
The paper is supported by the Headquarters Science and Technology Project of State Grid Corporation of China (Project No. 52060021N00P). The funder was not involved in the study design, collection, analysis, interpretation of data, the writing of this article, or the decision to submit it for publication.
Conflict of interest
The authors declare that the research was conducted in the absence of any commercial or financial relationships that could be construed as a potential conflict of interest.
Publisher’s note
All claims expressed in this article are solely those of the authors and do not necessarily represent those of their affiliated organizations, or those of the publisher, the editors and the reviewers. Any product that may be evaluated in this article, or claim that may be made by its manufacturer, is not guaranteed or endorsed by the publisher.
References
Ahmad, A. A., Sirjani, R., and Daneshvar, S. (2020). New hybrid probabilistic optimisation algorithm for optimal allocation of energy storage systems considering correlated wind farms. J. Energy Storage 29, 101335. doi:10.1016/j.est.2020.101335
Alahmadi, A. A. A., Belkhier, Y., Ullah, N., Abeida, H., Soliman, M. S., Khraisat, Y. S. H., et al. (2021). Hybrid wind/PV/battery energy management-based intelligent non-integer control for smart DC-microgrid of smart university. IEEE Access 9, 98948–98961. doi:10.1109/access.2021.3095973
Ramseebaluck, A., and Chowdhury, S., Hybrid renewable-based reliable and cost-effective rural electrification in southern Africa. Proceedings of the IEEE Access, 2019, Sousse, Tunisia, March 2019: p. 1–6. doi:10.1109/IREC.2019.8754568
Dirin, S., Rahimiyan, M., and Baringo, L. (2023). Optimal offering strategy for wind-storage systems under correlated wind production. Appl. Energy 333, 120552. doi:10.1016/j.apenergy.2022.120552
Feng, X. (2019). Economical analysis of photovoltaic power station with battery energy storage system. Adv. Technol. Electr. Eng. Energy 38 (9), 52–58.
Ghaffari, A., Askarzadeh, A., and Fadaeinedjad, R. (2022). Optimal allocation of energy storage systems, wind turbines and photovoltaic systems in distribution network considering flicker mitigation. Energy 319, 119253. doi:10.1016/j.apenergy.2022.119253
Jamroen, C., Usaratniwart, E., and Sirisukprasert, S. (2019). PV power smoothing strategy based on HELES using energy storage system application: A simulation analysis in microgrids. IET Renew. Power Gener. 13 (13), 2298–2308. doi:10.1049/iet-rpg.2018.6165
Kabeyi, M. J. B., and Olanrewaju, O. A. (2022). Sustainable energy transition for renewable and low carbon grid electricity generation and supply. Front. Energy Res. 9. doi:10.3389/fenrg.2021.743114
Lamsal, D., Sreeram, V., Mishra, Y., and Kumar, D. (2018). Kalman filter approach for dispatching and attenuating the power fluctuation of wind and photovoltaic power generating systems. IET Generation, Transm. Distribution 12 (7), 1501–1508. doi:10.1049/iet-gtd.2017.0663
Lawal, K. O. (2015) IEEE. doi:10.1109/PSC.2015.7101691Hydro-based, renewable hybrid energy sytem for rural/remote electrification in Nigeria, Proceedings of the 2015 Clemson University Power Systems Conference (PSC), Clemson, SC, USA, March 2015.
Li, Q., Zhou, F., Guo, F., Fan, F., and Huang, Z. (2021). Optimized energy storage system configuration for voltage regulation of distribution network with PV access. Front. Energy Res. 9. doi:10.3389/fenrg.2021.641518
Makarov, Y. V., Du, P., Kintner-Meyer, M. C. W., Jin, C., and Illian, H. F. (2012). Sizing energy storage to accommodate high penetration of variable energy resources. IEEE Trans. Sustain. Energy 3 (1), 34–40. doi:10.1109/tste.2011.2164101
Meiqin, M., Jialing, H., and Liuchen, Z. (2021). Energy storage optimization configuration method considering conditional forecast error correction. Acta Energiae Solaris Sin. 42 (2), 410–416.
Mingoti, S. A., and Lima, J. O. (2006). Comparing SOM neural network with Fuzzy c-means, K-means and traditional hierarchical clustering algorithms. Eur. J. Operational Res. 174 (3), 1742–1759. doi:10.1016/j.ejor.2005.03.039
Mishra, S., Saini, G., Chauhan, A., Upadhyay, S., and Balakrishnan, D. (2023). Optimal sizing and assessment of grid-tied hybrid renewable energy system for electrification of rural site. Renew. Energy Focus 44, 259–276. doi:10.1016/j.ref.2022.12.009
Paliwal, P. (2021). Reliability-based optimal sizing for an isolated wind–battery hybrid power system using butterfly PSO. Adv. Energy Technol. 766, 163–172.
Sadeghian, O., Oshnoei, A., Khezri, R., and Muyeen, S. (2020). Risk-constrained stochastic optimal allocation of energy storage system in virtual power plants. J. Energy Storage 31, 101732. doi:10.1016/j.est.2020.101732
Shen, J., Huang, S., Liu, C., Li, S., and Wu, J. (2023). Optimal configuration method of wind farm hybrid energy storage based on EEMD-EMD and grey relational degree analysis. Front. Energy Res. 10. doi:10.3389/fenrg.2022.1021189
Soliman, M. S., Belkhier, Y., Ullah, N., Achour, A., Alharbi, Y. M., Al Alahmadi, A. A., et al. (2021). Supervisory energy management of a hybrid battery/PV/tidal/wind sources integrated in DC-microgrid energy storage system. Energy Rep. 7, 7728–7740. doi:10.1016/j.egyr.2021.11.056
Sun, W., Gong, Y., and Luo, J. (2023). Energy storage configuration of distribution networks considering uncertainties of generalized demand-side resources and renewable energies. Sustainability 15 (2), 1097. doi:10.3390/su15021097
Wang, J., Du, W., Yang, D., He, G., and Zhang, X. (2021). Optimal configuration of multi-type energy storage for integrated energy system considering multi-energy trading with load substitution. E3S Web Conf. 237, 02016. doi:10.1051/e3sconf/202123702016
Zhang, L., Chen, L., Zhu, W., Lyu, L., Cai, G., and Hai, K. L. (2022). Research on the optimal allocation method of source and storage capacity of integrated energy system considering integrated demand response. Energy Rep. 8, 10434–10448. doi:10.1016/j.egyr.2022.08.184
Zhang, Y., Dong, Z. Y., Luo, F., Zheng, Y., Meng, K., and Wong, K. P. (2016). Optimal allocation of battery energy storage systems in distribution networks with high wind power penetration. IET Renew. Power Gener. 10 (8), 1105–1113. doi:10.1049/iet-rpg.2015.0542
Keywords: wind-solar power generation system, energy storage system, capacity optimization, K-means algorithm, genetic algorithm
Citation: Lv Y, Qin R, Sun H, Guo Z, Fang F and Niu Y (2023) Research on energy storage allocation strategy considering smoothing the fluctuation of renewable energy. Front. Energy Res. 11:1094970. doi: 10.3389/fenrg.2023.1094970
Received: 10 November 2022; Accepted: 27 February 2023;
Published: 13 March 2023.
Edited by:
Huan Xi, Xi’an Jiaotong University, ChinaReviewed by:
Youcef Belkhier, Maynooth University, IrelandPeng Tan, Huazhong University of Science and Technology, China
Copyright © 2023 Lv, Qin, Sun, Guo, Fang and Niu. This is an open-access article distributed under the terms of the Creative Commons Attribution License (CC BY). The use, distribution or reproduction in other forums is permitted, provided the original author(s) and the copyright owner(s) are credited and that the original publication in this journal is cited, in accordance with accepted academic practice. No use, distribution or reproduction is permitted which does not comply with these terms.
*Correspondence: You Lv, eW91Lmx2QGhvdG1haWwuY29t; Ruijun Qin, cmVnZW5hQG5jZXB1LmVkdS5jbg==