 Guanpeng Lu
 Yi Yang
 Zhuangzhuang Li
 Yufeng Tang
- Electric Power College of South China University of Technology, Guangzhou, China
With the growing penetration of new energy sources, the impact of new energy generation on the income of the energy portfolio is becoming more significant. This paper proposes a risk measurement method based on the Conditional Value-at-Risk (CVaR) approach to measure the income risk from new energy generation on the energy portfolio. The superiority is proved by comparing it with the method only considering spot price fluctuations. Then, we constructed an energy allocation model of the hydropower plant to maximize the combined income-risk utility. In solving the optimal allocation of the energy portfolio, the effects of inflow and water level on the risk aversion parameters of the hydropower plant are considered. The results and comparison show that the proposed risk measurement method increases the income of the energy portfolio by 12%, and the proposed risk aversion parameter’s adjustment strategy can increase the income of the energy portfolio by 5.8% and reduces the CVaR value by 14.5%. Moreover, the method that considers the income risk from new energy generation can provide favorable conditions for improved new energy accommodation and safe operation of the system.
1 Introduction
At the beginning of China’s electricity market construction, the electricity market mainly carries out forward contracts and spot market trading. Hydropower plants can lock in income through forward contracts and simultaneously participate in the spot market to take advantage of the spot market price fluctuations to obtain additional income (Fernandes et al., 2018). In participating in energy market transactions, hydropower plants need to consider the spot price risk and the forward contracts performance risk caused by the uncertainty of energy generation by inflow (Rotting and Gjelsvik, 1992; Maceira et al., 2002; Pereira-Bonvallet et al., 2016). Considering the risk factors faced by hydropower plants in energy trading, it is essential to establish a set of effective energy optimization allocation methods to realize the decision of hydropower plants in the trade-off between benefits and risks.
Domestic and international researchers conducted a series of studies optimizing energy allocation for power plants. In (Garcia et al., 2017), the Conditional Value-at-Risk (CVaR) approach was applied to solve the risk measurement problem of the energy allocation portfolio, and a risk-minimizing energy portfolio optimization model was proposed. On this basis, the literature (Mathuria and Bhakar, 2014) constructed an optimization model for energy allocation decisions combining Generalized Auto Regressive Conditional Heteroskedasticity (GARCH) and modern portfolio optimization theory. The optimization model increases the economic income of the power plants’ energy portfolio by improving the spot price’s forecasting accuracy. In the literature (Leonel et al., 2021), a risk management model for the energy allocation portfolio considering the uncertainty of fuel prices, spot market price, and carbon emission rights price was developed and used to optimize the allocation of energy portfolios in forward contracts and spot markets for thermal power plants. A series of studies have been conducted on hydropower plants’ inter-zonal energy allocation problem. In (Diniz et al., 2020), a stochastic optimization model embedded with the CVaR method is proposed to solve the inter-zonal energy allocation decision problem of hydropower plants optimally under the Energy Reallocation Mechanism (ERM) in Brazil. In the paper (Ang et al., 2022), an optimal hydropower dispatching method combining Stochastic Dual Dynamic Programming (SDDP) and the Benders decomposition method is proposed to provide technical support for the long-term inter-zonal dispatching decision of hydropower under the combined hydropower-fired operation scenario in the Brazilian power sector. However, the above studies do not fully consider the impact of new energy generation from the scenery on the energy allocation decision of regulable hydropower plants. As the awareness of a clean environment increases, new energy applications are gaining continuous promotion worldwide (Pool, 2019; Xu et al., 2023). With the growing penetration of new energy sources, the impact of new energy generation on electricity market prices has become increasingly significant (Liu and Wu, 2007a). Measuring the income risk caused by the new energy generation on the energy portfolio has become one of the urgent research issues for hydropower plants in China.
To address the risk measurement problem of hydropower plants’ energy portfolio, some researchers have used Minimum Variance (MV) (Liu and Wu, 2007b) and Value-at-Risk (VaR) approach (Dahlgren et al., 2003; Gong et al., 2009) to measure the income risk of the energy portfolio. The MV approach uses the variance of income as the basis of risk measurement and does not distinguish between the upward and downward deviations of income. For market participants, the upside deviation is an additional income rather than a risk. The VaR approach requires the income of trading varieties to meet a normal distribution. However, the electricity market’s income has significant skewness and fat-tail characteristics (Safdarian et al., 2013), which can lead to a lower risk value than the actual one obtained by using the VaR approach. The CVaR approach measures the risk of income for both normal and non-normal distribution and records only the downside deviation of incomes as a risk. Numerous studies have shown that the CVaR approach can more accurately measure the risk of the electricity market (Carrión et al., 2007; Catalão et al., 2011; Díaz and Esparcia, 2021). The literature (Carrión et al., 2007) proposed an income risk measurement model for distribution companies’ electricity distribution portfolio based on the CVaR approach considering fluctuations in spot prices and load demand. The literature (Catalão et al., 2011) constructed a risk optimization model for energy purchase by large electricity consumers based on a stochastic programming framework and CVaR approach. In the literature (Díaz and Esparcia, 2021), a trading risk measurement model based on the CVaR approach considering fluctuations in spot prices and wind turbines output was developed. An optimization method for wind power generators’ spot market offer strategies was also proposed, considering competitors’ offers. This paper uses the CVaR approach to establish an improved risk measurement method for hydropower plants’ energy portfolio income, which can quantify the impact of new energy generation on energy portfolio income.
The risk preference of generators for the energy portfolio is one of the critical factors in the process of energy portfolio optimization. The literature (Atmaca, 2022) applies Time-Varying Risk Aversion Parameters (TVP) in a Generalized Autoregressive Conditional Heteroscedasticity In-Mean (GARCH-M) model. The model can follow the market trend to adjust the risk preferences of market participants and verify that the model has more stable profitability and risk aversion ability compared with the Fixed or Invariable risk Preferences (FP) model. The literature (Wang et al., 2005) proposes an energy portfolio optimization method that dynamically adjusts risk aversion parameters based on Sharpe and Treynor ratios in the electricity market. The method validated has a better performance level using Turkish day-ahead market data. It is important to note that these studies have not yet discussed the impact of the hydropower plants’ operational characteristics on risk appetite. In this study, hydropower plants dynamically adjust their risk appetite for the energy portfolio based on inflow and water levels. This strategy helps hydropower plants obtain a better-performing energy allocation scheme. Moreover, when hydropower plants adopt this strategy for energy allocation, they can make their power generation time not overlap with the time when the new energy generation is significant. At the same time, they have higher power generation capacity to support the system operation when the new energy generation is small, which is conducive to promoting the accommodation of new energy and improving the operation safety of the system.
This study first analyzes the impact of new energy generation on the income of the energy portfolio. Then we propose a risk measurement method for the energy portfolio based on the CVaR approach. Next, a dynamic risk appetite strategy considering the operational characteristics of regulable hydropower plants is investigated. Compared with the fixed risk appetite strategy, this strategy can improve the performance of the energy portfolio while promoting the level of new energy accommodation and enhancing the operational security of the power system. In summary, the main contributions of this paper include.
(1) A portfolio’s risk measurement method for an energy portfolio is established that considers the impact of new energy generation.
(2) An energy allocation model of a regulable hydropower plant that uses dynamic risk appetite to optimize energy portfolio performance is developed. This model allows regulable hydropower plants to adjust their risk appetite for the energy portfolio based on inflow and water levels. The energy allocation models with both dynamic and fixed risk appetite are modeled through the GAMS platform. And then, we compare their performance in the energy portfolio’s income, the using time to complete the expected minimum income, and the water level during the electricity demand peak period.
This paper is organized as follows. We present the mathematical description of the energy allocation model and risk measurement method for regulable hydropower plants in Section 2. In Section 3, we define the objective function and constraints for allocation optimization of the energy portfolio. The strategy for dynamically adjusting the risk appetite of the regulable hydropower plant is given in Section 4. Section 5 provides simulation results and analysis. Section 6 concludes the paper.
2 Regulable hydropower plant’s energy allocation model and risk measurement method
This section first proposes the energy allocation model for regulable hydropower plants, then introduces the basic principle of applying the CVaR method to measure the return risk of the energy allocation portfolio. And finally, we establish the power return loss function considering the influence of risk factors. The flowchart of the optimization framework proposed in this paper is shown in Figure 1.
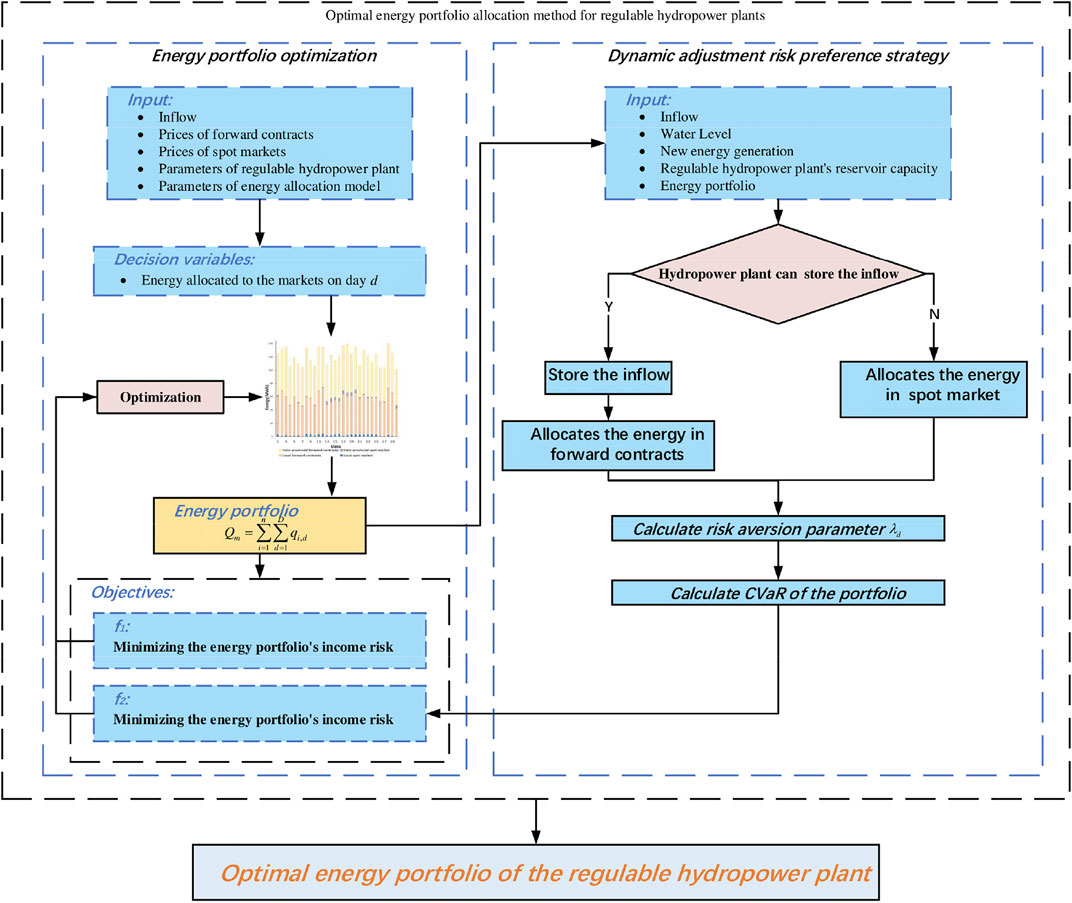
FIGURE 1. Flowchart of the energy portfolio allocation method optimization framework.
2.1 Energy allocation model
This paper’s energy allocation portfolio of regulable hydropower plants contains four trading varieties: the local forward contracts, the local spot market, the inter-provincial forward contracts, and the inter-provincial spot market. The energy allocation decision cycle is 1 month (30 days), and the time granularity is 1 day. Based on the introduction above of the trading varieties included in the portfolio and the energy allocation model proposed in the literature (Ma et al., 2018), the energy allocation model of regulable hydropower plants is:
Where:
Based on the introduction above of the trading varieties included in the portfolio of regulable hydropower plants and Eq. 1, the energy allocated to the spot market and forward contracts by the hydropower plants can be expressed as Eq. 2, 3
The energy allocated to the spot market by the hydropower plants is:
Where:
The energy allocated to the forward contracts by the hydropower plants is:
Where:
The economic income of the energy portfolio consists of forward contracts income, spot trading income, and energy deviation settlement fees of the forward contracts. On the basis of the mechanism of the southern China power market (Würzburg et al., 2013) and Eqs 1–3, the economic income of the energy portfolio can be expressed as Eq. 4.
Where:
2.2 The income risk measurement method for the energy portfolio
The CVaR approach is a risk measurement approach that calculates the income loss that an asset portfolio may suffer at a given confidence level at a given period in the future. The income risk measure of the energy portfolio is based on the risk measure proposed in the literature (Ma et al., 2018), and its expression is Eqs 5–8:
Let
Where
Let
Where
2.3 The income loss function
The CVaR method’s key to measuring the return risk of the energy portfolio is to construct the return loss function of the assets (energy) allocated in each market affected by risk factors. In this paper, we consider the impact of new energy generation on energy portfolio income, including.
(1) The marginal generation cost of the new energy is extremely low, and the average spot price will decrease with the increase of new energy generation (Keles et al., 2013; Cludius et al., 2014; Nappu et al., 2014; Paraschiv et al., 2014).
(2) When new energy generation is large, the generation of new energy will crowd out the accommodation space of other sources. The energy of forward contracted is affected by the new energy generation and cannot be accommodated (Day et al., 2002; Liu and Xie, 2020).
In summary, this paper constructs the income loss function of the energy portfolio in terms of both spot market income loss and forward contract income loss.
2.3.1 Spot market income loss function
The energy income loss function in the spot market consists of two parts: the fluctuation of the spot price itself and the impact of the new energy generation on the price.
Where
The expression of the loss function describing the fluctuation of spot prices in the spot market is:
Where
Assuming that the impact function of the new energy generation on the spot market price
Where:
Eq. 11 is rewritten as the energy absorption function of the spot market (García-González et al., 2007):
Where
The change in the absorption capacity of the spot market due to new energy generation can be described by Eq. 12 as the change in market price under a certain market electricity absorption elasticity:
When the values of
2.3.2 Forward contracts income loss function
When the new energy generation is large, the accommodation space for the energy of hydropower’s forward contracts will be reduced by the market rule of prioritizing the accommodation of new energy generation. Eq. 12 can be rewritten as the income impact of new energy generation on the energy of the hydropower plants’ forward contract market can be expressed as:
The loss function of forward contracts income is:
Where
3 Objective function and constraints of the optimization for energy allocation
This section first gives the composition of the objective function and describes its construction synthesis and linearization methods. Then, the electricity market trading constraint and the operating constraint of the hydropower plant are given.
3.1 Objective function
Hydropower plants reduce the risk of revenue loss and increase income by optimizing energy allocation in different markets to construct the optimal energy portfolio on each operating day. The main ways to achieve this object are (Uryasev, 2000).
1) shifting energy from the low-priced spot market to the high-priced spot market to improve income.
2) adjusting the energy allocated in forward contracts to reduce the risk of energy deviation penalties due to inflow uncertainty.
The objective function of the optimal energy allocation for regulable hydropower plants is the energy portfolio’s maximum income and minimum risk. Based on Eqs 4, 7, these two objectives are linearly combined into a combined utility function as follows (Mathuria and Bhakar, 2014).
Where:
Since the loss’s probability density function
To simplify the solution process, introduce dummy variables
The transformed objective function can be solved by the Linear Programming (LP) method (Andersson et al., 2001; Li et al., 2022).
3.2 Energy market trading constraints
On the basis of the mechanism of the southern China power market (Würzburg et al., 2013) and the optimization model’s constraints proposed in the literature (Ma et al., 2018), the energy market trading constraints expressed as Eq. 20.
Where:
3.3 Hydropower plant operating constraints
Based on the constraints proposed in the literature (Chou et al., 1992), the hydropower plant operating constraints can be expressed as Eqs 21–24.
3.3.1 Regulable reservoir capacity constraint
Where:
3.3.2 Water balance constraint
Where:
3.3.3 Hydropower plant outflow constraint
Where
3.3.4 Hydropower plant generation constraint
Where
4 Dynamically adjustment risk preference strategies for regulable hydropower plants
In the energy portfolio optimization process using the CVAR method, the power plant’s risk preference for the energy portfolio is one of the critical factors. In this section, we introduce the concept of risk aversion parameter to reflect the risk preferences of power plants and propose the dynamic adjustment of risk preferences (DARP) strategy for optimal allocation of energy portfolio of regulable hydropower plants based on inflow and water level.
The use of risk aversion parameters to reflect the risk preferences of market participants is a widely used method (Merton, 1980; Jackwerth, 2000; Baker and Wurgler, 2006). The risk aversion parameter can be calculated from the volatility of risky assets and the proportion of risk-free assets in the asset portfolio (ember-climate.org, 2022). In this paper, we note
Where:
This paper assumes that hydropower plants implement the following two operating scenarios for inflow based on inflow and operating water levels.
1) When the hydropower plant can store inflow, it allocates its energy in forward contracts to increase the risk-free income in the energy portfolio.
Where:
2) When the hydropower plant cannot store the inflow or can only store it in a daily regulation cycle, it allocates the energy produced from the inflow to the spot market as much as possible. The additional energy shares the fluctuation risk from the spot portion of the original energy portfolio.
Eqs 26, 27 show that the hydropower plant can adjust the risk aversion parameter by allocating the energy generated by inflow among risky and risk-free assets depending on the inflow and water level. We can rewrite Eq. 25 as:
5 Simulation example
In this paper, the proposed method for optimizing the energy allocation of regulable hydropower plants is a linear programming problem modeled and tested on the GAMS platform and solved using CPLEX 20.1. All the cases are implemented and computed on a desktop computer equipped with a 3.7GHz, E3-1230 V3 CPU, 24GB RAM, and 64-bit Windows operating system. In this section, we first give the parameters of the algorithm design, generate simulation data for forward contracts and spot prices, and examine them. Then, we analyze the optimization results of the energy portfolio optimization method. Finally, the optimization method proposed in this paper is compared with the fixed risk preferences (FRP) energy portfolio optimization method in terms of the income-risk performance of the power portfolio, the water level operation curve, and the level of new energy accommodation of the system.
5.1 Data and parameters setting
A regulable hydropower plant has a confidence level
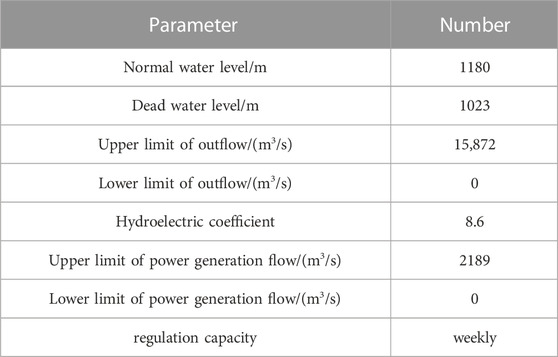
TABLE 1. Main parameters of hydropower station.
To improve the accuracy of the optimization method, we first use the Bootstrapping method to augment the historical data.
• Local forward contract prices (LFCP).
• Inter-provincial forward contract prices (IFCP).
• Local spot prices (LSP).
• Inter-provincial spot prices (ISP).
• New energy generation in the inter-provincial receiving-end grid (NEG).
• Inflow.
Then, the four critical statistical characteristics of the augmented data, namely, mean, variance, skewness, and kurtosis, were compared with the original historical data to verify the validity of the augmented data. The results are shown in Table 2.
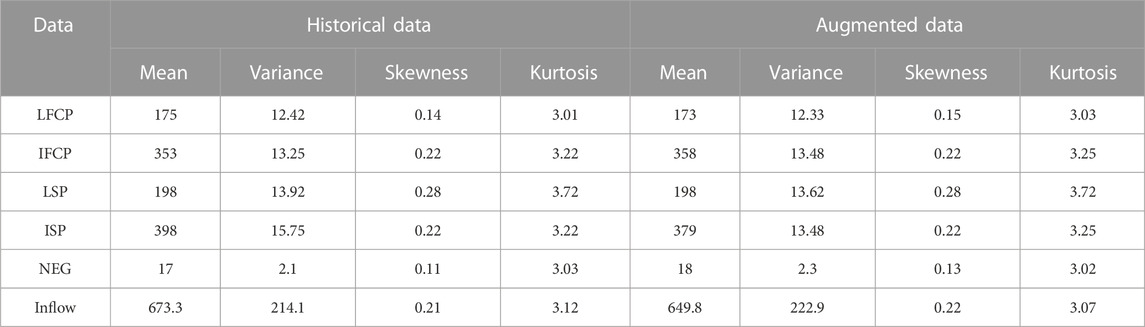
TABLE 2. Statistical indicators of historical data and simulated data.
The data augmentation results are shown in Figure 2 and Figure 3. The Pearson correlation coefficient for the local and inter-provincial forward contract price is 0.017, indicating no linear correlation between the two. The Pearson correlation coefficient for the local and inter-provincial spot market price is −0.812, indicating a strong negative correlation between the two. The allocation of energy by hydropower plants to the local and inter-provincial spot markets can spread the spot price risk.
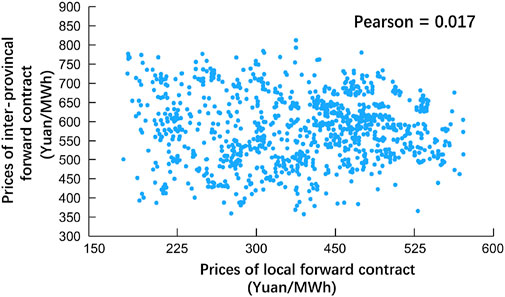
FIGURE 2. Correlation analysis of simulated prices in local and inter-provincial forward contracts.
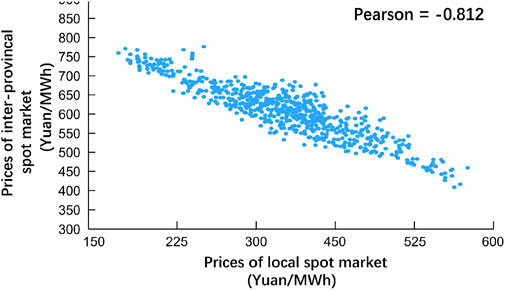
FIGURE 3. Correlation analysis of simulated electricity prices in local and inter-provincial spot markets.
The analysis of the match between the hydropower plant’s energy in the spot market and the spot price is shown in Figure 4 and Figure 5. The high match between the hydropower plant’s energy in the local spot market and the spot price is because the maximum energy capacity of new energy in the energy supply structure of the province where the hydropower plant is located is relatively small, about 2%. The impact of new energy on spot market prices is weak, spot prices are relatively stable, and hydropower stations need less deal with spot price volatility when making spot energy allocations. The largest share of new energy in the inter-provincial market is about 20.2%. The amount of new energy influences the price of the inter-provincial spot market, and the spot price volatility is more obvious. Hydropower plant in the inter-provincial spot market energy and spot price match is low, and the hydropower plant needs to optimize the energy allocated in the inter-provincial spot market. As far as possible, allocate the energy in the spot market on the high price day to improve the income of the spot market power.
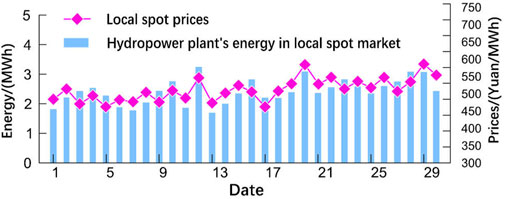
FIGURE 4. Matching analysis of hydropower plant’s energy in local spot market and the spot price.
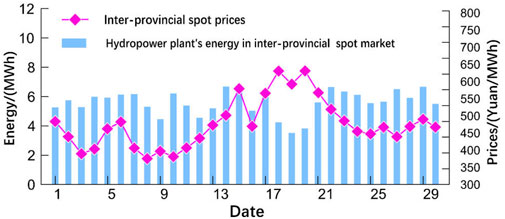
FIGURE 5. Matching analysis of hydropower plant’s energy in inter-provincial spot market and the spot price.
The maximum generation capacity of new energy in the cross-provincial market for hydropower is 20.2% because China’s new energy sources are at a steady construction stage, which is still far from the goal of “a new power system dominated by renewable energy.” To study the impact of the increased penetration of new energy on the energy portfolio’s income, we increase the maximum proportion of new energy’s energy generation in the system during the simulation example. Germany’s new energy development is relatively rapid. The proportion of new energy generation in 2020 is close to 40% (Moghaddam et al., 2013). This paper assumes that after China completes new energy construction, the new energy’s proportion in the system will be consistent with the current level of Germany. The new energy exploitable potential of the province where the hydropower station is located is small, and the impact of new energy generation on the spot price of the province where the hydropower station is located is ignored in this paper. The relationship analysis between the share of new energy generation and the average inter-province spot price is shown in Table 3. As the proportion of new energy generation increases, the average spot price decreases more and more significantly. As the maximum share of new energy generation in the system increases from 27% to 40%, the decrease in spot price increases from 5% to 18.46%, and the price decreases from RMB 376.42/(MWh) to RMB 324.52/(MWh).

TABLE 3. Average spot prices for markets with different shares of new energy generation.
5.2 Analysis of results
5.2.1 Analysis of optimization results
Based on the simulation data of new energy generation, inflow, and price, the optimization results of the monthly energy portfolio of regulable hydropower plants are shown in Figure 6, Figure 7, and Table 4.
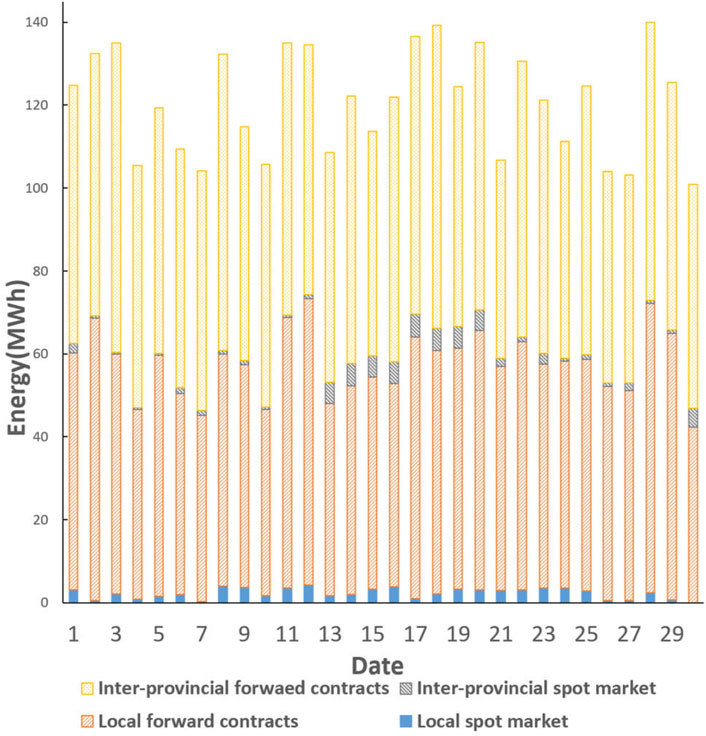
FIGURE 6. Result of optimized allocation of the energy portfolio.
FIGURE 7. Energy portfolio of different confidence levels.
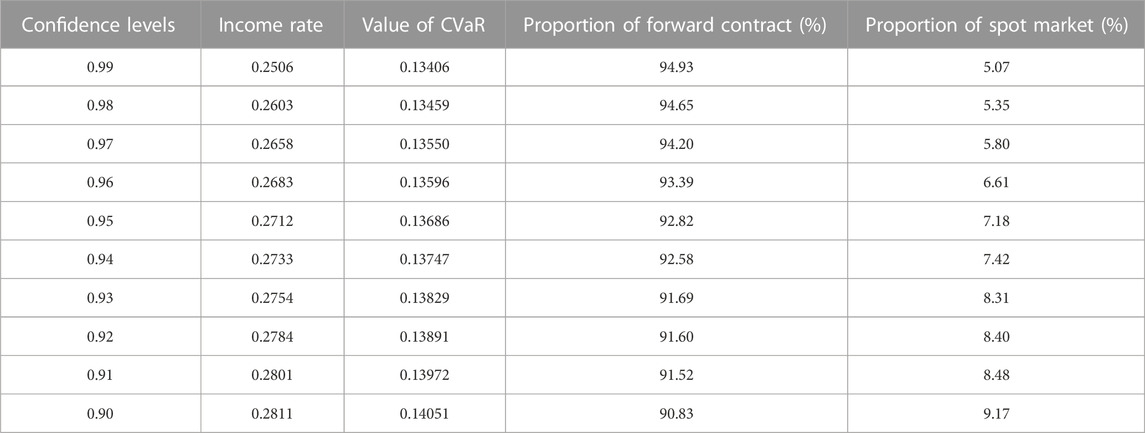
TABLE 4. Portfolios at different confidence levels.
The analysis of Figure 6, Figure 7, and Table 4 prove the effectiveness of the optimal energy allocation method proposed in this paper.
1) The forward contracts account for a larger proportion of the monthly energy portfolio of regulable hydropower plants, which effectively locks in the income through forward contracts and reduces the overall risk of the energy portfolio. The optimization results align with the actual situation of hydropower plant operation.
(2) As the set confidence level decreases, the income and the risk (CVaR) value of the energy portfolio obtained from the optimization increase simultaneously. Reflecting that the regulable hydropower plant operators can get more income while being willing to take more risks, the results are consistent with the hydropower plant operators in the actual market decision-making situation.
Figure 8 shows the results of the inflow and the hydropower plant’s water level. Figure 9 shows the result of the risk aversion coefficient of the hydropower station to the energy portfolio. In the initial stage, the water level of the hydropower plant is high, the inflow is small, and the hydropower plant arranges the energy to reduce the water level gradually. The risk aversion coefficient of the hydropower plant is low, and the hydropower plant has an aggressive risk preference. From day 3 to day 5, the risk aversion coefficient rises gradually as the water level decreases. On day 6, the hydropower plant encounters a large inflow, and the water level of the hydropower plant is high. The risk aversion coefficient turns from rising to decreasing, denoting the risk preference of the hydropower plant is strengthened. In the same period, the new energy generation is large. The lower risk aversion parameter helps hydropower plant reduces water abandonment and sells energy in the highest-priced of spot market as much as possible to maximize the energy portfolio’s income. After day 11, the effect of the last round of incoming water disappears, the water level of the hydropower plant gradually decreases, and the risk aversion parameter rises simultaneously. From day 16 to day 30, during the second period of large new energy generation, the higher risk aversion makes the hydropower plant reduce allocate the energy in the spot market, which is conducive to improving the new energy power accommodation level in the spot market. Finally, on day 25, hydropower plants reached the highest water level value, and the new energy generation in the following days was low. The high hydropower plant water level can provide strong energy support for the system, improving the system’s operational safety. The higher water level of the hydropower plant on the high-price day means that it can sell more energy on the high-price day, which is conducive to the income of the energy portfolio. The maxima and jumps in risk aversion parameters occur from day 13 to day 16, when operating water levels and income fall in tandem and genuinely reflect the operating behavior of hydropower plants. That is because hydropower plants tend to exhibit a greater risk-averse preference during those periods, allocating limited energy to forward contracts to avoid the penalty of deviation assessment.
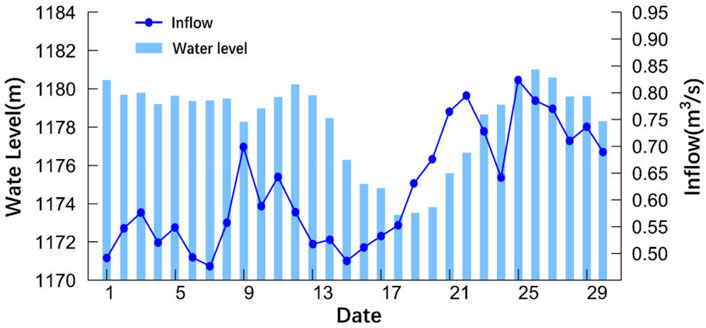
FIGURE 8. Optimal water level curve and inflow process.
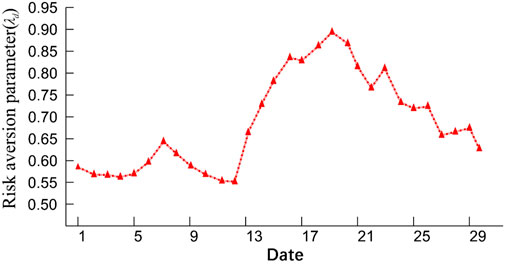
FIGURE 9. Risk aversion parameter.
The result of energy allocated to the inter-provincial spot market before and after the optimization of hydropower plants on each operating day is shown in Figure 10. From day 13 to day 20, when the new energy generation is smaller, the spot price is usually higher, and hydropower plants allocate more energy to the spot market, which improves the income of the energy portfolio. From day 1 to day 12 and day 21 to day 29, the new energy generation is larger, and the hydropower plant allocates less energy to the spot market. Hydropower plant generation avoids the large new energy generation periods, providing more accommodation space for new energy.
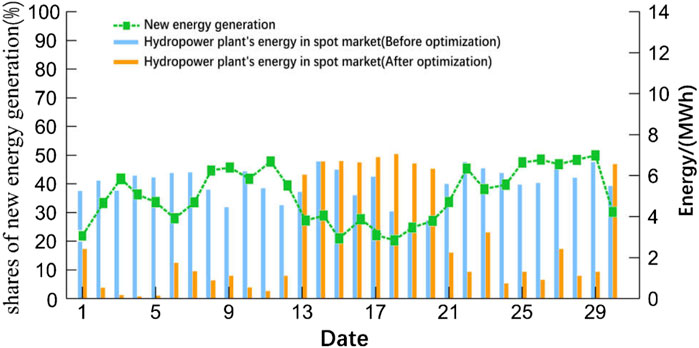
FIGURE 10. Hydropower plant’s energy allocation before and after optimization.
As shown in Figure 11, the hydropower plant’s energy allocation curve has improved the matching with the spot price after optimization. After the optimized allocation, the hydropower plant allocated energy mainly in the higher spot price period and less in the lower spot price period. Because day 30 is the last day of the optimization cycle, the hydropower plant allocates all the remaining spot energy of the month, resulting in the energy of this day not fully matching the spot price. Combined with Figure 10, we can find that the spot price of the new energy generation period is also low, so the hydropower plant improves the income of the energy portfolio by transferring the energy from the low price period to the high price period.
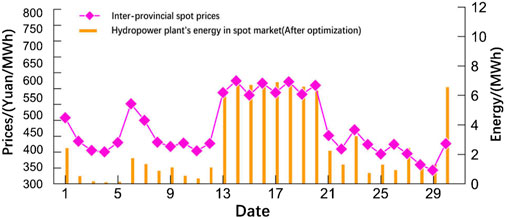
FIGURE 11. Matching analysis of energy allocation after optimization in inter-provincial spot and the spot prices.
In Figure 12, We analyzed the impact of the regulation capacity of the hydropower plant on the results of optimal energy allocation. For weekly regulated hydropower plants, the energy portfolio optimization method will prioritize the completion of the forward contract to avoid losses caused by negative deviation assessment, and the reservoir capacity of the hydropower plant changes more drastically. For monthly regulated hydropower plants, the energy portfolio optimization method will increase the energy allocation in the spot market as much as possible to obtain additional income, and the reservoir capacity of hydropower plants will change slightly. The results show that the optimization method proposed in this paper is equally effective for hydropower plants with different regulation capacities.
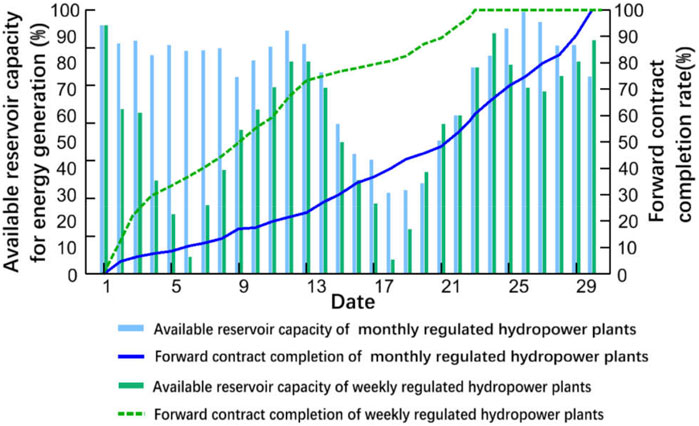
FIGURE 12. Optimization results for hydropower plants with different regulation capacities.
5.2.2 Performance comparison
The methods of two relevant study papers are selected for comparison in this paper to verify the characteristics of the proposed optimal energy allocation method in terms of risk measurement and energy portfolio income.
a) The risk measurement method based on the spot price forecast in literature (Mathuria and Bhakar, 2014) is used to compare the risk measurement method proposed in this paper.
b) Fixed risk preferences (FRP) strategy from the literature [40] is used dynamically adjustment risk preference (DARP) strategy proposed in this paper.
Table 5 shows the comparative results of solving the two risk measurement methods. Table 6 gives the solution comparison results of the two risk preference strategies.
1) Performance comparison of risk measurement methods
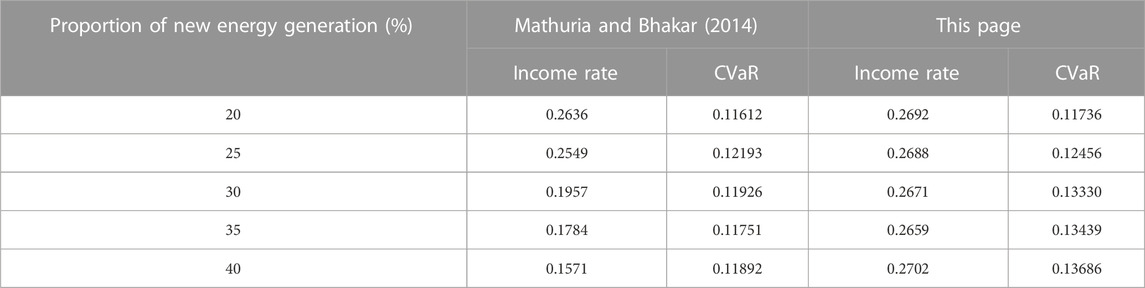
TABLE 5. Performance comparison of Risk measurement methods.
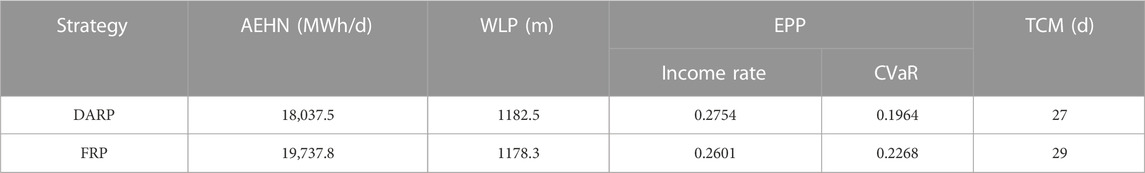
TABLE 6. Performance comparison of DARP and FRP.[40].
The confidence level of both risk measurement methods is 0.95, and other parameters are the same. As shown in Table 5, as new energy generation rises, the risk value (CVaR) obtained based on the method in (Mathuria and Bhakar, 2014) changes less, and the energy portfolio income gradually decreases. Because the method of (Mathuria and Bhakar, 2014) does not consider the impact of new energy generation on the energy portfolio income, the risk value cannot reflect the risk of energy income caused by the increase of the new energy generation, which makes the income of the energy portfolio decrease. The risk measurement method proposed in this paper obtains a risk value that increases gradually with the new energy generation. At the same time, the change in energy portfolio income is small. It shows that the risk measurement method proposed in this paper can correctly reflect the risk of new energy generation on the energy portfolio and effectively reduce the fluctuation of its income. It should be noted that when the new energy generation in the system in the system is higher than 25%, the advantage of the solution results of the proposed method gradually increases. In the scenario where the new energy generation in the system is 40%, the energy portfolio income based on the risk measurement method proposed in this paper is 12% higher than that of the literature (Mathuria and Bhakar, 2014), which has a significant advantage. This result is because the operating days with higher new energy generation usually overlap with those with lower spot prices. The method based on spot price forecasting in (Mathuria and Bhakar, 2014) can reflect part of the risk of energy income loss due to spot price fluctuations. However, the method in (Mathuria and Bhakar, 2014) underestimates the spot price risk on the operating days with higher new energy generation because it does not consider the impact of new energy generation. And it does not reflect the risk of energy income loss in forward contracts due to new energy generation. As new energy generation increases, the advantages of the method proposed in this paper over the method in (Mathuria and Bhakar, 2014) become more and more obvious.
2) Performance comparison of DARP and FRP
As shown in Table 5, the optimization results based on the two strategies of setting risk preference, DARP, and FRP, are significantly different, where the risk preference of the FRP strategy takes the value of 1 (Moghaddam et al., 2013) and using the risk measurement method proposed in this paper. Other parameters of the optimization are the same.
Compared with the FRP strategy in the literature (Moghaddam et al., 2013), the DARP strategy proposed in this paper increases the income of the energy allocation portfolio by 5.8% and reduces the CVaR value by 14.5%. The time taken to complete the expected minimum income (TCM) is 7.9% faster than the FRP. In addition, the average energy of the hydropower plant during the rich new energy generation periods (AEHN) is significantly lower, indicating that hydropower plants can allocate more of their energy to periods with higher electricity prices. That provides favorable conditions for the system to increase new energy consumption. The DARP strategy also increases the water level during electricity consumption peak periods (WLP), which allows hydropower plants to generate more energy during peak periods and supports the safe operation of the system. Generally speaking, the price of electricity during peak load periods is higher than in other periods. Hence, a higher water level during peak load periods benefits hydropower plants to obtain more economic benefits.
2) Performance comparison of DARP and FRP
As shown in Table 5, the optimization results based on the two strategies of setting risk preference, DARP, and FRP, are significantly different, where the risk preference of the FRP strategy takes the value of 1 (ember-climate.org, 2022), and the other parameters are the same.
Compared with the FRP strategy in the literature (Moghaddam et al., 2013), the DARP strategy proposed in this paper increases the income of the energy allocation portfolio by 5.8% and reduces the CVaR value by 14.5%. The time taken to complete the desired minimum income (TCM) is 7.9% faster than the FRP. In addition, the average energy of hydropower plants during the new energy boom periods (AEHN) is significantly lower, indicating that hydropower plants can allocate more of their energy to periods with higher electricity prices. That provides favorable conditions for the system to increase new energy consumption. The DARP strategy also increases the water level during electricity consumption peak periods (WLP), which allows hydropower plants to generate more energy during peak periods and supports the safe operation of the system. Generally speaking, the price of electricity during peak load periods is higher than in other periods. Hence, a higher water level during peak load periods benefits hydropower plants to obtain more economic benefits.
In summary, the DARP strategy proposed in this paper is relative to the FRP strategy in the literature (Moghaddam et al., 2013). The DARP strategy directs hydropower plants to use reservoir capacity more rationally and allocate runoff-converted electricity in the high-value market as much as possible through the dynamic adjustment of risk preference. The DARP strategy not only improves the energy portfolio performance (EPP) and the time taken to complete the expected minimum income (TCM) compared to the FRP strategy but also optimizes the average energy of the hydropower plant during the rich new energy generation periods (AEHN) and the water level during electricity consumption peak periods (WLP). That is mutually beneficial for regulable hydropower plants, new energy generators, and systems.
6 Conclusion
In this paper, we study the energy allocation of regulable hydropower plants considering the impact of new energy generation. First, a regulable hydropower plant’s energy allocation model participating in multiple market transactions is established. Then a risk measurement method considering the impact of new energy generation on the energy portfolio income is proposed based on this allocation model. And an energy allocation optimization method to maximize the joint utility function of energy portfolio income and risk is constructed. In the optimization stage, a dynamic adjustment risk preference strategy that considers inflow and water level to adjust the risk aversion parameter in the objective function is proposed to improve the performance of the energy allocation optimization method.
The following conclusions are drawn from analyzing the simulation example’s result.
(1) The risk measurement method proposed in this paper can portray the income risk of new energy generation to the energy portfolio more accurately than the traditional risk measurement method based on the price prediction. As the proportion of new energy generation in the system increases, the performance advantage of this paper’s proposed method becomes more obvious. In a scenario where the proportion of new energy generation is 40% in the system, the risk measurement method proposed in this paper can increase the income of the energy portfolio by 12%.
(2) The DARP strategy proposed in this paper can improve the income of the energy portfolio by 5.8% compared to the FRP strategy while reducing its CVaR value by 14.5%. Also, the time required for the energy portfolio to complete the expected minimum income is 7.9% faster than the FRP strategy.
(3) The energy allocation method proposed in this paper shifts the energy of hydropower plants from a period of rich new energy generation to a period of meager new energy generation providing favorable conditions for the system to improve the level of new energy accommodation. At the same time, the hydropower plant has a higher water level when new energy generation is meager, increasing the amount of energy the hydropower plant can generate during that period, which provides favorable conditions for safe system operation.
(4) The increase in new energy penetration is an important trend in China’s future energy development. With the help of the energy portfolio optimization method proposed in this paper, regulable hydropower plants can provide strong support for the economical, clean and safe operation of the system while taking into account their economic benefits. And that is conducive to the realization of the “double carbon” goal of the power system.
The construction of China’s electricity market is steadily advancing, and the models and algorithms described in this paper all contain certain assumptions and simplifications. As the electricity market improves, subsequent studies will continue to be in-depth according to the actual situation.
Data availability statement
The raw data supporting the conclusion of this article will be made available by the authors, without undue reservation.
Author contributions
GL carried out the establishment of model, presentation of strategies, data analysis, and wrote the first draft. YY assisted in establishment of model and improvement of strategies. ZL assisted in data analysis and polished the manuscript. YT helped the revision of the manuscript and help to collect sample data and write programs.
Conflict of interest
The authors declare that the research was conducted in the absence of any commercial or financial relationships that could be construed as a potential conflict of interest.
Publisher’s note
All claims expressed in this article are solely those of the authors and do not necessarily represent those of their affiliated organizations, or those of the publisher, the editors and the reviewers. Any product that may be evaluated in this article, or claim that may be made by its manufacturer, is not guaranteed or endorsed by the publisher.
References
Andersson, F., Mausser, H., Rosen, D., and Uryasev, S. (2001). Credit risk optimization with conditional value-at-risk criterion. Math. Program. 89 (2), 273–291. doi:10.1007/pl00011399
Ang, T. Z., Salem, M., Kamarol, M., Das, H. S., Nazari, M. A., and Prabaharan, N. (2022). A comprehensive study of renewable energy sources: Classifications, challenges and suggestions. Energy Strategy Rev. 43, 100939. doi:10.1016/j.esr.2022.100939
Atmaca, M. E. (2022). Portfolio management and performance improvement with Sharpe and Treynor ratios in electricity markets. Energy Rep. 8, 192–201. doi:10.1016/j.egyr.2021.11.287
Baker, M., and Wurgler, J. (2006). Investor sentiment and the cross-section of stock returns. J. Finance 61 (4), 1645–1680. doi:10.1111/j.1540-6261.2006.00885.x
Carrión, M., Philpott, A. B., Conejo, A. J., and Arroyo, J. M (2007). A stochastic programming approach to electric energy procurement for large consumers. IEEE Trans. Power Syst. 22 (2), 744–754. doi:10.1109/tpwrs.2007.895164
Catalão, J. P. S., Pousinho, H. M. I., and Mendes, V. M. F. (2011). Optimal offering strategies for wind power producers considering uncertainty and risk. IEEE Syst. J. 6 (2), 270–277. doi:10.1109/jsyst.2011.2163009
Chou, R., Engle, R. F., and Kane, A. (1992). Measuring risk aversion from excess returns on a stock index. J. Econ. 52 (1-2), 201–224. doi:10.1016/0304-4076(92)90070-8
Cludius, J., Hermann, H., Matthes, F. C., and Graichen, V. (2014). The merit order effect of wind and photovoltaic electricity generation in Germany 2008–2016: Estimation and distributional implications. Energy Econ. 44, 302–313. doi:10.1016/j.eneco.2014.04.020
Dahlgren, R., Liu, C. C., and Lawarree, J. (2003). Risk assessment in energy trading. IEEE Trans. Power Syst. 18 (2), 503–511. doi:10.1109/tpwrs.2003.810685
Day, C. J., Hobbs, B. F., and Pang, J. S. (2002). Oligopolistic competition in power networks: A conjectured supply function approach. IEEE Trans. power Syst. 17 (3), 597–607. doi:10.1109/tpwrs.2002.800900
Díaz, A., and Esparcia, C. (2021). Dynamic optimal portfolio choice under time-varying risk aversion. Int. Econ. 166, 1–22. doi:10.1016/j.inteco.2021.02.002
Diniz, A. L., Maceira, M. E. P., Vasconcellos, C. L. V., and Penna, D. D. J. (2020). A combined SDDP/Benders decomposition approach with a risk-averse surface concept for reservoir operation in long term power generation planning. Ann. Operations Res. 292 (2), 649–681. doi:10.1007/s10479-019-03419-4
ember-climate.org (2022). Data explorer | ember | ember (ember-climate.org). Available at: https://ember-climate.org/data/data-explorer/.
Fernandes, G., Gomes, L. L., and Brandão, L. E. T. (2018). A risk-hedging tool for hydro power plants. Renew. Sustain. Energy Rev. 90, 370–378. doi:10.1016/j.rser.2018.03.081
Garcia, R. C., Gonzalez, V., Contreras, J., and Custodio, J. E. (2017). Applying modern portfolio theory for a dynamic energy portfolio allocation in electricity markets. Electr. Power Syst. Res. 150, 11–23. doi:10.1016/j.epsr.2017.04.026
García-González, J., Parrilla, E., and Mateo, A. (2007). Risk-averse profit-based optimal scheduling of a hydro-chain in the day-ahead electricity market. Eur. J. Operational Res. 181 (3), 1354–1369. doi:10.1016/j.ejor.2005.11.047
Gong, X., Luo, X., and Wu, J. (2009). “Electricity auction market risk analysis based on EGARCH-EVT-CVaR model,” in 2009 Proceedings of the IEEE International Conference on Industrial Technology, Churchill, VIC, Australia, 10-13 February 2009, 1–5. IEEE.
Jackwerth, J. C. (2000). Recovering risk aversion from option prices and realized returns. Rev. Financial Stud. 13 (2), 433–451. doi:10.1093/rfs/13.2.433
Keles, D., Genoese, M., Möst, D., Ortlieb, S., and Fichtner, W. (2013). A combined modeling approach for wind power feed-in and electricity spot prices. Energy Policy 59, 213–225. doi:10.1016/j.enpol.2013.03.028
Leonel, L. D., Balan, M. H., Ramos, D. S., Rego, E. E., and Mello, R. F. D. (2021). Financial risk control of hydro generation systems through market intelligence and stochastic optimization. Energies 14, 6368. doi:10.3390/en14196368
Li, Z., Yang, P., Yang, Y., Lu, G., and Tang, Y. (2022). Solving stochastic hydro unit commitment using benders decomposition and modified stochastic dual dynamic programming. Front. Energy Res. 10 (2022), 955875. doi:10.3389/fenrg.2022.955875
Liu, M., and Wu, F. F. (2007). Portfolio optimization in electricity markets. Electr. Power Syst. Res. 77 (8), 1000–1009. doi:10.1016/j.epsr.2006.08.025
Liu, M., and Wu, F. F. (2007). Risk management in a competitive electricity market. Int. J. Electr. Power & Energy Syst. 29 (9), 690–697. doi:10.1016/j.ijepes.2007.05.003
Liu, S., and Xie, M. (2020). Modeling the daily generation schedules in under-developed electricity markets with high-share renewables: A case study of yunnan in China. Energy 201, 117677. doi:10.1016/j.energy.2020.117677
Ma, H., Chen, Y., Chen, Y., Liu, W., and Lin, S. (2018). Mechanism design of Southern China (starting from Guangdong Province) electric spot market. South. Power Syst. Technol. 12 (12), 42–48.
Maceira, M. E. P., Terry, L. A., Costa, F. S., Damazio, J. M., and &Melo, A. C. G. (2002). “Chain of optimization models for setting the energy dispatch and spot price in the Brazilian system,” in Proceedings of the 14th power system computation conference—PSCC, Sevilla, Spain, 24 June 2002.
Mathuria, P., and Bhakar, R. (2014). “Integrated risk management model for portfolio selection in multiple markets,” in 2014 Proceedings of the IEEE PES General Meeting| Conference & Exposition, National Harbor, MD, USA, 27-31 July 2014.
Merton, R. C. (1980). On estimating the expected return on the market: An exploratory investigation. J. financial Econ. 8 (4), 323–361. doi:10.1016/0304-405x(80)90007-0
Moghaddam, I. G., Nick, M., Fallahi, F., Sanei, M., and Mortazavi, S. (2013). Risk-averse profit-based optimal operation strategy of a combined wind farm–cascade hydro system in an electricity market. Renew. energy 55, 252–259. doi:10.1016/j.renene.2012.12.023
Pool, N. (2019). Annual report [EB/OL].Available at: https://www.nordpoolgroup.com/message-center-container/Annual-report/. [Accesssed 2020-06-24].
Nappu, M. B., Arief, A., and Bansal, R. C. (2014). Transmission management for congested power system: A review of concepts, technical challenges and development of a new methodology. Renew. Sustain. Energy Rev. 38, 572–580. doi:10.1016/j.rser.2014.05.089
Paraschiv, F., Erni, D., and Pietsch, R. (2014). The impact of renewable energies on EEX day-ahead electricity prices. Energy Policy 73, 196–210. doi:10.1016/j.enpol.2014.05.004
Pereira-Bonvallet, E., Puschel-Lovengreen, S., Matus, M., and Moreno, R. (2016). Optimizing hydrothermal scheduling with non-convex irrigation constraints: Case on the chilean electricity system. Energy Procedia 87, 132–140. doi:10.1016/j.egypro.2015.12.342
Rotting, T. A., and Gjelsvik, A. (1992). Stochastic dual dynamic programming for seasonal scheduling in the Norwegian power system. IEEE Trans. Power Syst. 7 (1), 273–279. doi:10.1109/59.141714
Safdarian, A., Fotuhi-Firuzabad, M., and Lehtonen, M. (2013). A stochastic framework for short-term operation of a distribution company. IEEE Trans. Power Syst. 28 (4), 4712–4721. doi:10.1109/tpwrs.2013.2278076
Uryasev, S. (2000). “Conditional value-at-risk: Optimization algorithms and applications,” in proceedings of the IEEE/IAFE/INFORMS 2000 conference on computational intelligence for financial engineering (CIFEr)(Cat. No. 00TH8520), New York, NY, USA, 28-28 March 2000, 49–57. IEEE.
Wang, R., Shang, J. C., Zhou, X. Y., and Zhang, Y. C. (2005). “Risk assessment and management of portfolio optimization for power plants,” in 2005 Proceedings of the IEEE/PES Transmission & Distribution Conference & Exposition: Asia and Pacific, Dalian, China, 18-18 August 2005, 1–5. IEEE.
Würzburg, K., Labandeira, X., and Linares, P. (2013). Renewable generation and electricity prices: Taking stock and new evidence for Germany and Austria. Energy Econ. 40, S159–S171. doi:10.1016/j.eneco.2013.09.011
Xu, A., Awalin, L. J., Al-Khaykan, A., Fard, H. F., Alhamrouni, I., and Salem, M. (2023). Techno-economic and environmental study of optimum hybrid renewable systems, including PV/Wind/Gen/Battery, with various components to find the best renewable combination for ponorogo regency, east java, Indonesia. Sustainability 15 (3), 1802. doi:10.3390/su15031802
Keywords: hydropower plants, energy portfolio, new energy generation, risk measurement model, risk aversion parameters
Citation: Lu G, Yang Y, Li Z and Tang Y (2023) Optimal energy portfolio allocation method for regulable hydropower plants considering the impact of new energy generation. Front. Energy Res. 11:1114949. doi: 10.3389/fenrg.2023.1114949
Received: 03 December 2022; Accepted: 27 February 2023;
Published: 09 March 2023.
Edited by:
Ramakrishna Gokaraju, University of Saskatchewan, CanadaReviewed by:
Mohamed Salem, University of Science Malaysia (USM), MalaysiaMojtaba Nedaei, University of Padua, Italy
Copyright © 2023 Lu, Yang, Li and Tang. This is an open-access article distributed under the terms of the Creative Commons Attribution License (CC BY). The use, distribution or reproduction in other forums is permitted, provided the original author(s) and the copyright owner(s) are credited and that the original publication in this journal is cited, in accordance with accepted academic practice. No use, distribution or reproduction is permitted which does not comply with these terms.
*Correspondence: Yi Yang, ZXB5YW5neWkxOTkyQG1haWwuc2N1dC5lZHUuY24=