 A. Cammarata
 L. Mastropasqua
- 1Department of Energy, Politecnico di Milano, Milan, Italy
- 2National Fuel Cell Research Center, University of California, Irvine, Irvine, CA, United States
The Nernst equilibrium potential calculates the theoretical OCV, which estimates the best performance achievable by an electrochemical cell. When multiple semi-reactions (or multiple ionic species) are active in one of the electrodes, the calculation of the theoretical OCV is not straightforward, since different Nernst potentials are associated to each semi-reaction. In this paper, analytical equations for calculation of the theoretical OCV are developed, using the mixed potential theory. The case of H2 and CO co-oxidation (or H2O and CO2 co-reduction) in solid oxide cells is used as a reference case, but similar conclusions can be drawn for other equivalent cases. OCV data from literature are used to calibrate and validate the model. The relative reaction rate of H2 and CO semi-reactions is estimated within the calibration process, and the result is in line with assumptions and suggestions given by other authors. The validation procedure shows predicted OCV values in line with experimental literature data, except for mixtures with relatively large CH4 concentration (e.g., 8%), for which the OCV is significantly underestimated. This is expected when thermochemical reactions, in parallel to electrochemical reactions occur, since the additional H2 produced by internal steam methane reforming is not accounted within the local mixed potential model. A fuel cell polarization model is developed based on the results from the calibration procedure, and it is used to predict the polarization behavior of an SOFC fed with a H2-H2O-CO-CO2 fuel mixture. It is found that either H2 or CO may be reduced rather than oxidized via an equivalent electrochemical water-gas-shift reaction.
1 Introduction
Solid Oxide Fuel Cell (SOFC) and Solid Oxide Electrolyzer Cell (SOEC) are innovative technologies used for energy conversion purposes. SOFCs are used to efficiently produce electricity using a fuel such as hydrogen (H2). The high operating temperature of SOFCs (500°C–1,000°C) allows them to operate using a variety of fuels, such as carbon monoxide (CO), methane (CH4), methanol (CH3OH), and ammonia (NH3) (Donazzi et al., 2016; Kishimoto et al., 2020; Fan et al., 2022; Sang et al., 2022). Conversely, SOECs are used to produce fuels like H2 and CO, starting from water (H2O), carbon dioxide (CO2), and an electricity supply. In the framework of energy transition, SOFCs may be used for the design of efficient and fuel-flexible energy systems (Ishak et al., 2012; Campanari et al., 2016; Mastropasqua et al., 2020; Duong et al., 2022), while SOECs could be a key technology for the synthesis of e-fuels, since CO and H2 are precursors for the production of high-value hydrocarbons via the Fischer-Tropsch process (Wang et al., 2017). Therefore, it is necessary to develop SOFC and SOEC models able to predict the performance in presence of different chemical species, interacting with each other through chemical and electrochemical reactions.
The open circuit voltage (OCV) of an electrochemical cell is the voltage established in the electrical circuit at zero current, and it is closely related to its thermodynamic and kinetic performance. The meaning of the OCV measured for an electrochemical cell is twofold. In fuel cell mode, the OCV represents the maximum producible electric power per unit current. Conversely, the OCV represents the minimum electric power required per unit current to perform the electrolysis reaction at a certain temperature, pressure, and composition. When a finite current is flowing through an electrochemical cell, the cell voltage is different from the OCV due to electrochemical losses (i.e., overpotentials or polarization losses). For fuel cell operation the cell voltage is lower compared to the OCV, while the opposite is true for electrolyzers. This concept forms the basis for the development of numerical models, which require the precise theoretical estimation of the OCV. For the above reasons, it is important to correctly estimate the OCV of electrochemical cells. When multiple electrochemical reactions (or multiple ionic species) are active at one electrode, the estimation of the OCV is not a simple task due to the formation of the so-called mixed potential. Therefore, the primary goal of this paper is to develop a model suitable for the estimation of the mixed OCV of electrochemical cells, analyzing the case of H2 and CO half-reactions in solid oxide cells as an example.
Considering the half-reactions in a conventional SOFC, (Eq. 1) and (Eq. 2) are the only active electrochemical reactions at the fuel and air electrode respectively, and reaction (Eq. 3) is the global reaction. The Nernst potential (Eq. 4) is generally used to calculate the theoretical OCV, where
The Nernst equation is strictly valid when all steps required for reaction (Eq. 3) to occur are in equilibrium or in partial equilibrium (Kee et al., 2005). Therefore, the presence of chemical reactions like water-gas-shift (WGS) and steam methane reforming (SMR), expressed by reactions (Eq. 5) and (Eq. 6) respectively, could invalidate Eq. 4 since the elementary steps of reaction (Eq. 1) might not be in equilibrium. As an example, the hydrogen adsorption reaction is expected to be non-equilibrated if SMR is active, since the rate of hydrogen desorption from the electrode is larger than the rate of its adsorption. Therefore, the Gibbs free energy variation of the hydrogen adsorption reaction is different from zero, invalidating the demonstration shown in ref. (Kee et al., 2005). Following the demonstrations shown in the reference, it can also be inferred that the larger the reaction rate of the global oxidation reaction (Eq. 3) compared to that of the chemical reactions, the better is the accuracy of the Nernst equation.
Eq. 4 is expected to be particularly accurate when a mixture of H2 and H2O is used at the fuel electrode, since chemical equilibrium is guaranteed at open circuit. However, the Nernst equation has been extensively used to model non-equilibrium cell operation; for instance, when either WGS or SMR are active at the fuel electrode (Campanari and Iora, 2005; Spallina et al., 2015; Corigliano and Fragiacomo, 2020). In this case, it is implicitly assumed that WGS and SMR are relatively slow reactions, they do not prevent reactions (Eq. 1) and (Eq. 2) to reach partial equilibrium, and they do not significantly alter the partial pressures of gases within the porous electrode compared to the ones in the bulk gas mixture.
Conversely, assuming that WGS and SMR are fast reactions, some authors estimate the OCV by substituting the equilibrium partial pressures in Eq. 4 (Stoots et al., 2009; Lee et al., 2015; Jin et al., 2018; Vágner et al., 2019), calculated assuming that both WGS and SMR go to equilibrium at local temperature and pressure, starting from the bulk gas composition. Therefore, using the equilibrium partial pressures allows to indirectly include species like CO and CH4 in the estimation of the OCV. Moreover, the equilibrium model allows to easily estimate the OCV in presence of several electrochemical semi-reactions occurring at one electrode. For instance, if both half-reactions (Eq. 1) and (Eq. 7) are active at the fuel electrode, a second Nernst voltage could be defined as in Eq. 8.
If the equilibrium partial pressures are used,
The first method to estimate the cell OCV in a non-equilibrated mixture considering two active electrochemical semi-reactions at one electrode was introduced by Fleming (Fleming, 1977). Fleming defined an equivalent electric circuit representing the electrochemical cell, with as many parallel branches as the number of covered active sites (see Supplementary Appendix SB), for both H2 and CO (however, Fleming assumed that O2 and CO are electrochemically active at the fuel electrode). Assuming each branch includes both a voltage generator with value equal to either
However, Norton’s theorem is only applicable for linear electric circuits, and the resistances in H2 and CO branches are not equal in general. For instance, the activation overpotentials are generally modeled using a Butler-Volmer relationship which is not linear and it can lead to different activation overpotentials for H2 and CO charge transfer processes (Petruzzi et al., 2003; Suwanwarangkul et al., 2006; Andreassi et al., 2009; Iwai et al., 2011; Ni, 2012; Park et al., 2012; Andersson et al., 2013a; Razbani et al., 2013; De Lorenzo and Fragiacomo, 2015; Bao et al., 2016).
Other authors (Zhu and Kee, 2003; Aloui and Halouani, 2007; Stempien et al., 2012; Andersson et al., 2013b; Stempien et al., 2013; Baldinelli et al., 2015a) attempt to estimate the OCV by assuming a fictitious electrochemical semi-reaction (Eq. 10) occurring at the fuel electrode, which is a function of two parameters
The stoichiometric coefficients
In Section 2, a simple model is developed to estimate the mixed OCV, where two (or more) electrochemical semi-reaction are considered at one of the electrodes. The relative reaction rate of the semi-reactions, which affects the OCV, is considered using Butler-Volmer equations and exchange current densities. This approach is derived from the theory available for corrosion processes, in which two semi-reactions occur in presence of an electrolyte and an equipotential electrode, to calculate parameters such as the corrosion potential, which is a mixed potential, and the corrosion current (Bockris and Reddy, 2000). The case of H2 and CO co-oxidation in SOFC (or, equivalently, H2O and CO2 co-reduction in SOEC) is considered as an example. In Section 3 the model is calibrated and validated using experimental OCV data from the literature, which allowed to retrieve information regarding the relative reaction rate of H2 and CO semi-reactions. Finally, a simple polarization model is developed in Section 4 using the results from the calibration procedure. The model is used to calculate the polarization curve of an SOFC fed with a H2-H2O-CO-CO2 mixture.
2 Mixed potential model
The approach followed hereafter is similar to that followed to develop corrosion theory, due to analogies between a corrosion process, and a fuel electrode at OCV where both reactions (Eq. 1) and (Eq. 7) are active (Bockris and Reddy, 2000). During a corrosion process, two semi-reactions occur in presence of an electrolyte (water) and an equipotential electrode (the corroded metal), as shown in Figure 1 (left).
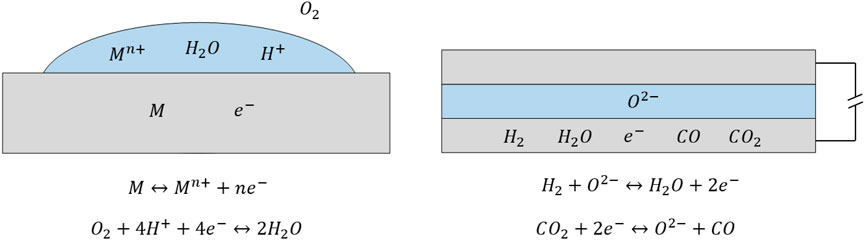
FIGURE 1. Analogy between a corrosion process (left) and the fuel electrode in an electrochemical cell at OCV, exposed to a H2-H2O-CO-CO2 mixture (right). In both cases there is an equipotential electrode, either the corroded metal or the porous fuel electrode, an electrolyte, either water or a solid electrolyte, and two competing electrochemical semi-reactions.
In corrosion, a species is oxidized (e.g., a metal), and a species is reduced (e.g., oxygen), and the process is driven by the different equilibrium potential (i.e., equilibrium electric potential difference between electrode and electrolyte) of the two semi-reactions at the specific operating conditions. Similarly, for the electrochemical cell at OCV shown in Figure 1 (right), it is expected that either H2 is oxidized to H2O and CO2 is reduced to CO, or CO is oxidized to CO2 and H2O is reduced to H2. The process is driven by the different equilibrium potentials of semi-reactions (Eq. 1) and (Eq. 7) at the specific operating conditions, which can be identified as the difference between
The kinetics of the semi-reactions is modeled using Butler-Volmer Eqs 12, 13. The parameters
Similarly to a corrosion process, it is assumed that the current produced by one of the two semi-reaction is completely absorbed by the other semi-reaction, which for a complete cell is equivalent to assuming a vanishing net current flowing in the external circuit, as expressed by Eq. 14.
Finally, the activation overpotentials can be written as functions of the OCV as in Eqs 15, 16.
Eqs 12–16 allow calculating
Using the procedure outline above, and introducing Tafel’s approximation (i.e., activation overpotentials are low), it is possible to find a simple analytical solution for
Removing Tafel’s approximation, and assuming that α is equal to β, and
The form of this equation is similar to that used to calculate the electrode mixed potential in a corrosion process (Bockris and Reddy, 2000). Note that by collecting either
Eq. 18 is slightly modified assuming
Note that the functional form of
3 Model calibration and validation
Eq. 21 can be used to estimate the OCV, but the reverse process can be useful to predict the ratio of pre-exponential factors of H2 and CO exchange current densities, if OCV experimental data are available. In order to calibrate and validate the model, literature OCV data on H2-H2O-CO-CO2 mixtures are used to estimate the ratio of pre-exponential factors, which is then compared with literature estimations. In principle, one could calibrate more parameters, like the difference between activation energies (here assumed null), or the species activity exponents in Eqs 19, 20. However, the scarce amount of reliable experimental data prevents this.
Ideally, the mixture used to produce experimental OCV data should not contain CH4, since the effective concentrations of H2, H2O, CO, and CO2 may be modified by the onset of the SMR reaction. Note that also the WGS reaction may modify the effective species concentrations, however here it is assumed that this effect is negligible. Moreover, the N2 concentration in the mixture should be minimized since it could lead to an increase in the OCV despite not directly appearing in the Nernst equation (Cinti et al., 2016), which is an effect that cannot be captured by Eq. 21. Finally, electrolytes having significant electronic conduction (e.g., Ceria-based) cannot be accurately modelled, because the estimation of the OCV would also depend on the short-circuit electronic current. To the best of the author’s knowledge, the literature does not provide experimental OCV data that respect all the above experimental operating conditions. However, the OCV data from Baldinelli et al. (2015b) are produced under operating conditions close to those described above, hence it is used as a reference for the model calibration and validation. A Ni-YSZ|8YSZ|LSCF button cell was used to produce experimental results, the oven temperature is 800°C, and the cathode is exposed to air (21% O2 molar fraction is assumed). Note that the adoption of a button cell configuration is preferred for the validation purpose, since the mixture composition may change if the fuel is blown through a channel, mainly due to WGS reaction. The mixture compositions used for calculation are shown in Table 1, and they are named as in reference (Baldinelli et al., 2015b). The measured OCV values are estimated from the figures shown in the reference.
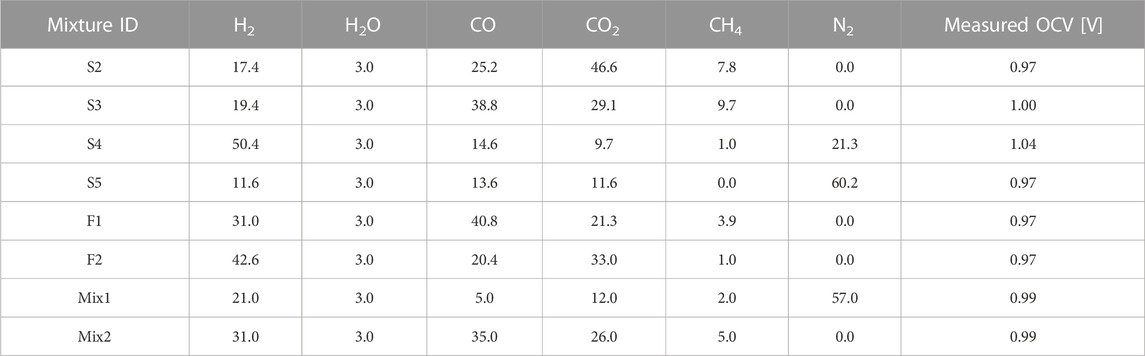
TABLE 1. Percentage molar composition of the mixtures used for model calibration and validation (Baldinelli et al., 2015b).
The mixture F2 is used to calibrate the ratio of pre-exponential factors appearing in Eq. 21, since it is free of N2, and the CH4 concentration is very low. The result is 2.54, which is in line with the range 2–3 suggested for a Ni-YSZ electrode working in a similar temperature range (Stoots et al., 2009; Razbani et al., 2013; Wang et al., 2017; Duong et al., 2022). After calibration, Eq. 21 is used to predict the OCV values for the mixtures in Table 1. The results are also compared to the OCV calculated assuming that the mixtures reach chemical equilibrium before giving rise to the cell potential, following the conventional method discussed in the introduction section. The results of the analysis are shown in Figure 2.
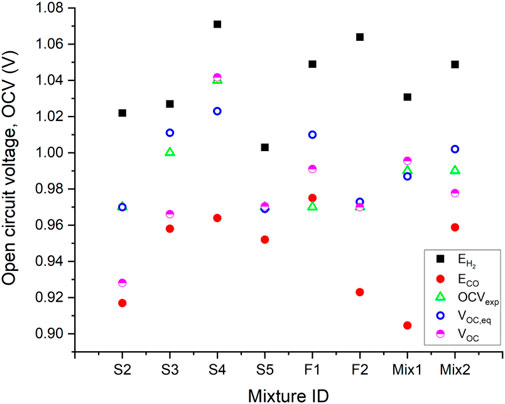
FIGURE 2. Experimental OCV measured for different mixtures (Baldinelli et al., 2015b), Nernst voltage for H2 and CO, and estimated OCV values based on equilibrium and mixed potential models.
Figure 2 shows the experimental OCV data from (Baldinelli et al., 2015b),
The prediction accuracy of the mixed potential model seems to decrease with increasing CH4 concentration. The model underpredicts the OCV for Mix2, S2, and S3, which have 5%, 8%, and 10% CH4 concentration respectively. This is ascribed to the onset of SMR, which increases the effective H2 and CO partial pressures near the active sites, with a positive effect on both
Overall, the equilibrium model always provides a reasonable estimation of the cell voltage, if mixture F1 is not considered. The mixed potential model predicts the OCV with either equal or better accuracy for the mixtures containing a relatively low CH4 concentration in the range 0%–5% (S4, S5, F2, Mix1, Mix2), i.e., scenarios without heterogeneous catalytic reactions in parallel to electrochemical reactions. For the mixtures with higher CH4 concentration (S2, S3), the equilibrium model is more accurate, which is expected. These preliminary results indicate that the model developed is suitable to estimate the OCV of an electrochemical cell, or to retrieve data regarding the relative velocity of competing semi-reactions occurring on the same electrode. However, dedicated and detailed experimentation is required to further validate the model developed, following the guidelines outlined above.
4 Development of a polarization model
The calibration process shown in Section 3 is not only useful to predict the OCV of an electrochemical cell, but it can also be used to develop a polarization model. Referring to the example shown in Section 3, the ratio between pre-exponential factors appearing in Eqs 19, 20 can be used to calculate
The voltage balance equations for both H2 and CO are represented by Eqs 22, 23. Note that concentration losses are neglected in this model for the sake of simplicity, which may be justified by the fact that only the polarization behavior near the OCV is of interest for the purpose of this paper, and concentration losses are usually relatively more important at large values of current density. Moreover, an electrolyte supported configuration is assumed, which is expected to make concentration losses even less important.
Exchange current densities (Eq. 19) and (Eq. 20), and Butler-Volmer Eqs 12, 13 are used for the polarization model developed. A similar Butler-Volmer equation is used to model the reaction rate of O2 semi-reaction. For all Butler-Volmer equations, a single-electron charge transfer, with charge transfer coefficient equal to 0.5 is assumed. The kinetic parameters and the functional form of H2 and O2 exchange current densities are the same as in reference (Campanari and Iora, 2005). As already mentioned,
The total current density,
Figure 3 shows the polarization curve near the OCV predicted by the model developed. Note that the contributions of both
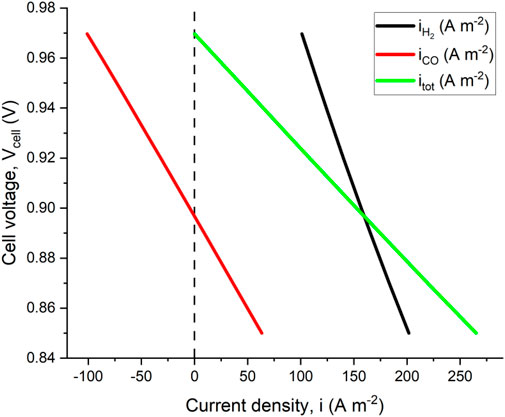
FIGURE 3. Polarization curve relative to mixture F2 at 800°C. Both H2 and CO contributions to total current density are shown. The model predicts a negative current density for CO semi-reaction at high voltage, which means that CO is electrochemically produced rather than consumed.
The model predicted OCV is 0.97 V, which is the same value calculated using Eq. 21. This can be explained by noticing that when the overall current equals zero, Eqs 22, 23, 25 become equivalent to Eqs 14-16, respectively. Moreover, the model predicts a negative CO current density when the cell voltage is very close to the OCV, meaning that reaction (Eq. 7) is reversed, and CO2 is reduced to CO. This is also expected since either
5 Conclusion
In this work, the mixed potential theory is applied to derive analytical equations for the estimation of the OCV in a fuel cell or electrolyzer, when two electrochemical semi-reactions are active on one of the electrodes. The case of H2 and CO co-oxidation (or H2O and CO2 co-reduction) is used as an example throughout the work. The equation found is calibrated and validated using OCV data from literature. The calibration process was used to estimate the ratio of pre-exponential factors of H2 and CO current densities. The resulting value of 2.54 is in line with values suggested and used by other authors for similar operating conditions. Very good matching between experimental and estimated OCV was obtained during model validation for mixtures with low CH4 content (0%–5%). The prediction accuracy was either comparable or better compared to using the equilibrium mixture composition to estimate the OCV. For mixtures with relatively large CH4 concentration (more than 8%), the mixed potential model significantly underestimates the OCV, due to additional H2 produced by SMR, which is not accounted for by the model developed. Conversely, the equilibrium potential model predicts with reasonable accuracy also the OCV generated by mixtures with relatively large CH4 concentration. The results from the calibration procedure are used to develop a polarization model of an SOFC fed with a H2-H2O-CO-CO2 fuel mixture. It is found that a fuel such as CO or H2 may be electrochemically produced rather than consumed when the cell voltage is close to or equal to the OCV.
Data availability statement
The raw data supporting the conclusion of this article will be made available by the authors, without undue reservation.
Author contributions
AC: formal analysis, writing original draft; LM: manuscript review and editing, image processing.
Conflict of interest
The authors declare that the research was conducted in the absence of any commercial or financial relationships that could be construed as a potential conflict of interest.
Publisher’s note
All claims expressed in this article are solely those of the authors and do not necessarily represent those of their affiliated organizations, or those of the publisher, the editors and the reviewers. Any product that may be evaluated in this article, or claim that may be made by its manufacturer, is not guaranteed or endorsed by the publisher.
Supplementary material
The Supplementary Material for this article can be found online at: https://www.frontiersin.org/articles/10.3389/fenrg.2023.1120343/full#supplementary-material
References
Aloui, T., and Halouani, K. (2007). Analytical modeling of polarizations in a solid oxide fuel cell using biomass syngas product as fuel. Appl. Therm. Eng. 27, 731–737. doi:10.1016/j.applthermaleng.2006.10.011
Andersson, M., Yuan, J., and Sundén, B. (2013). Grading the amount of electrochemical active sites along the main flow direction of an SOFC. J. Electrochem Soc. 160, F1–F12. doi:10.1149/2.026301jes
Andersson, M., Yuan, J., and Sundén, B. (2013). SOFC modeling considering hydrogen and carbon monoxide as electrochemical reactants. J. Power Sources 232, 42–54. doi:10.1016/j.jpowsour.2012.12.122
Andreassi, L., Toro, C., and Ubertini, S. (2009). Modeling carbon monoxide direct oxidation in solid oxide fuel cells. J. Fuel Cell Sci. Technol. 6, 0213071–02130715. doi:10.1115/1.3080552
Baldinelli, A., Barelli, L., and Bidini, G. (2015). Performance characterization and modelling of syngas-fed SOFCs (solid oxide fuel cells) varying fuel composition. Energy 90, 2070–2084. doi:10.1016/j.energy.2015.07.126
Baldinelli, A., Barelli, L., and Bidini, G. (2015). Syngas-fed SOFCs: Analysis of performance sensitivity to fuel composition. ECS Trans. 68, 2763–2774. doi:10.1149/06801.2763ecst
Bao, C., Jiang, Z., and Zhang, X. (2016). Modeling mass transfer in solid oxide fuel cell anode: II. H2/CO co-oxidation and surface diffusion in synthesis-gas operation. J. Power Sources 324, 261–271. doi:10.1016/j.jpowsour.2016.05.088
Bockris, J. O., and Reddy, A. K. N. (2000). Modern electrochemistry 2B. Electrodics in chemistry, engineering, biology, and enviornmental science. Second Edition. London: Kluwer Academic Publishers.
Campanari, S., and Iora, P. (2005). Comparison of finite volume SOFC models for the simulation of a planar cell geometry. Fuel Cells 5, 34–51. doi:10.1002/fuce.200400057
Campanari, S., Mastropasqua, L., Gazzani, M., Chiesa, P., and Romano, M. C. (2016). Predicting the ultimate potential of natural gas SOFC power cycles with CO2 capture – Part A: Methodology and reference cases. J. Power Sources 324, 598–614. doi:10.1016/j.jpowsour.2016.05.104
Cinti, G., Discepoli, G., Sisani, E., and Desideri, U. (2016). SOFC operating with ammonia: Stack test and system analysis. Int. J. Hydrogen Energy 41, 13583–13590. doi:10.1016/j.ijhydene.2016.06.070
Corigliano, O., and Fragiacomo, P. (2020). Extensive analysis of SOFC fed by direct syngas at different anodic compositions by using two numerical approaches. Energy Convers. Manag. 209, 112664. doi:10.1016/j.enconman.2020.112664
De Lorenzo, G., and Fragiacomo, P. (2015). Energy analysis of an SOFC system fed by syngas. Energy Convers. Manag. 93, 175–186. doi:10.1016/j.enconman.2014.12.086
Donazzi, A., Rahmanipour, M., Maestri, M., Groppi, G., Bardini, L., Pappacena, A., et al. (2016). Experimental and model analysis of the co-oxidative behavior of syngas feed in an intermediate temperature solid oxide fuel cell. J. Power Sources 306, 467–480. doi:10.1016/j.jpowsour.2015.12.038
Duong, P. A., Ryu, B., Jung, J., and Kang, H. (2022). Thermal evaluation of a novel integrated system based on solid oxide fuel cells and combined heat and power production using ammonia as fuel. Appl. Sci. 12, 6287. doi:10.3390/app12126287
Fan, L., Li, C., van Biert, L., Zhou, S. H., Tabish, A. N., Mokhov, A., et al. (2022). Advances on methane reforming in solid oxide fuel cells. Renew. Sustain Energy Rev. 166, 112646. doi:10.1016/j.rser.2022.112646
Fleming, W. J. (1977). Physical principles governing nonideal behavior of the zirconia oxygen sensor. J. Electrochem Soc. 124, 21–28. doi:10.1149/1.2133235
Ishak, F., Dincer, I., and Zamfirescu, C. (2012). Energy and exergy analyses of direct ammonia solid oxide fuel cell integrated with gas turbine power cycle. J. Power Sources 212, 73–85. doi:10.1016/j.jpowsour.2012.03.083
Iwai, H., Yamamoto, Y., Saito, M., and Yoshida, H. (2011). Numerical simulation of intermediate-temperature direct-internal-reforming planar solid oxide fuel cell. Energy 36, 2225–2234. doi:10.1016/j.energy.2010.03.058
Jin, X., Ku, A., Verma, A., Ohara, B., Huang, K., and Singh, S. (2018). The performance of syngas-fueled SOFCs predicted by a reduced order model (ROM): Temperature and fuel composition effects. J. Electrochem Soc. 165, F786–F798. doi:10.1149/2.0511810jes
Kee, R. J., Zhu, H., and Goodwin, D. G. (2005). Solid-oxide fuel cells with hydrocarbon fuels. Proc. Combust. Inst. 30 II, 2379–2404. doi:10.1016/j.proci.2004.08.277
Kishimoto, M., Muroyama, H., Suzuki, S., Saito, M., Koide, T., Takahashi, Y., et al. (2020). Development of 1 kW-class ammonia-fueled solid oxide fuel cell stack. Fuel Cells 20, 80–88. doi:10.1002/fuce.201900131
Lee, W. Y., Ong, K. M., and Ghoniem, A. F. (2015). Detailed H2 and CO electrochemistry for a MEA model fueled by syngas. Syngas 68, 3059–3074. doi:10.1149/06801.3059ecst
Mastropasqua, L., Pegorin, A., and Campanari, S. (2020). Low fuel utilisation solid oxide fuel cell system for CO2-free hydrogen production in oil refineries. J. Power Sources 448, 227461. doi:10.1016/j.jpowsour.2019.227461
Matsuzaki, Y., and Yasuda, I. (2000). Electrochemical oxidation of H[sub 2] and CO in a H[sub 2]-H[sub 2]O-CO-CO[sub 2] system at the interface of a Ni-YSZ cermet electrode and YSZ electrolyte. J. Electrochem Soc. 147, 1630. doi:10.1149/1.1393409
Ni, M. (2012). An electrochemical model for syngas production by co-electrolysis of H 2O and CO 2. J. Power Sources 202, 209–216. doi:10.1016/j.jpowsour.2011.11.080
Park, J., Li, P., and Bae, J. (2012). Analysis of chemical, electrochemical reactions and thermo-fluid flow in methane-feed internal reforming SOFCs: Part i - modeling and effect of gas concentrations. Int. J. Hydrogen Energy 37, 8512–8531. doi:10.1016/j.ijhydene.2012.02.110
Penchini, D., Cinti, G., Discepoli, G., Sisani, E., and Desideri, U. (2013). Characterization of a 100 W SOFC stack fed by carbon monoxide rich fuels. Int. J. Hydrogen Energy 38, 525–531. doi:10.1016/j.ijhydene.2012.09.060
Petruzzi, L., Cocchi, S., and Fineschi, F. (2003). A global thermo-electrochemical model for SOFC systems design and engineering. J. Power Sources 118, 96–107. doi:10.1016/S0378-7753(03)00067-3
Razbani, O., Assadi, M., and Andersson, M. (2013). Three dimensional CFD modeling and experimental validation of an electrolyte supported solid oxide fuel cell fed with methane-free biogas. Int. J. Hydrogen Energy 38, 10068–10080. doi:10.1016/j.ijhydene.2013.05.153
Sang, J., Li, Y., Yang, J., Wu, T., Luo, X., Chi, B., et al. (2022). Power generation by flat-tube solid oxide fuel cells with enhanced internal reforming of methanol. ACS Sustain Chem. Eng. 10, 6276–6288. doi:10.1021/acssuschemeng.2c00518
Spallina, V., Mastropasqua, L., Iora, P., Romano, M. C., and Campanari, S. (2015). Assessment of finite volume modeling approaches for intermediate temperature Solid Oxide Fuel Cells working with CO-rich syngas fuels. Int. J. Hydrogen Energy 40, 15012–15031. doi:10.1016/j.ijhydene.2015.08.101
Stempien, J. P., Ding, O. L., Sun, Q., and Chan, S. H. (2012). Energy and exergy analysis of Solid Oxide Electrolyser Cell (SOEC) working as a CO2 mitigation device. Int. J. Hydrogen Energy 37, 14518–14527. doi:10.1016/j.ijhydene.2012.07.065
Stempien, J. P., Sun, Q., and Chan, S. H. (2013). Performance of power generation extension system based on solid-oxide electrolyzer cells under various design conditions. Energy 55, 647–657. doi:10.1016/j.energy.2013.03.031
Stoots, C. M., O’Brien, J. E., Herring, J. S., and Hartvigsen, J. J. (2009). Syngas production via high-temperature coelectrolysis of steam and carbon dioxide. J. Fuel Cell Sci. Technol. 6, 0110141–01101412. doi:10.1115/1.2971061
Suwanwarangkul, R., Croiset, E., Entchev, E., Charojrochkul, S., Pritzker, M. D., Fowler, M. W., et al. (2006). Experimental and modeling study of solid oxide fuel cell operating with syngas fuel. J. Power Sources 161, 308–322. doi:10.1016/j.jpowsour.2006.03.080
Vágner, P., Kodým, R., and Bouzek, K. (2019). Thermodynamic analysis of high temperature steam and carbon dioxide systems in solid oxide cells. Sustain Energy Fuels 3, 2076–2086. doi:10.1039/c9se00030e
Wang, Y., Liu, T., Lei, L., and Chen, F. (2017). High temperature solid oxide H2O/CO2 co-electrolysis for syngas production. Fuel Process Technol. 161, 248–258. doi:10.1016/j.fuproc.2016.08.009
Keywords: mixed open circuit potential, electrochemical cells, solid oxide fuel cells (SOFC), electrode potential, co-oxidation, co-electrolysis
Citation: Cammarata A and Mastropasqua L (2023) Theoretical analysis of mixed open-circuit potential for high temperature electrochemical cells electrodes. Front. Energy Res. 11:1120343. doi: 10.3389/fenrg.2023.1120343
Received: 09 December 2022; Accepted: 07 April 2023;
Published: 09 May 2023.
Edited by:
John S. Hardy, Pacific Northwest National Laboratory (DOE), United StatesReviewed by:
Jie Bao, Pacific Northwest National Laboratory (DOE), United StatesAlexander Kozlov, Omsk State Technical University, Russia
Copyright © 2023 Cammarata and Mastropasqua. This is an open-access article distributed under the terms of the Creative Commons Attribution License (CC BY). The use, distribution or reproduction in other forums is permitted, provided the original author(s) and the copyright owner(s) are credited and that the original publication in this journal is cited, in accordance with accepted academic practice. No use, distribution or reproduction is permitted which does not comply with these terms.
*Correspondence: L. Mastropasqua, bG0xQGFwZXAudWNpLmVkdQ==